
Antihypertensive Activity of Milk Fermented by Lactiplantibacillus plantarum SR37-3 and SR61-2 in L-NAME-Induced Hypertensive Rats

 ,
,  , , , and
Abstract
:
1. Introduction
2. Materials and Methods
2.1. Animals and Study Design
2.2. L-NAME Model
2.3. Diets/Treatment
2.4. BP Measurement
2.5. Histological Analyses
2.6. Serum Biochemical Index Analysis
2.7. Intestinal Microbial Diversity
2.7.1. DNA Extraction and Polymerase Chain Reaction (PCR) Amplification
2.7.2. Illumina MiSeq Sequencing
2.7.3. Sequencing Data Processing
2.8. Serum Metabolic Profile and the Metabolomic Determination of Gut Microbiota
2.9. RNA-Seq and Genome-Wide Transcriptome Analysis of Blood Vessels
2.9.1. Sample Collection and Preparation
2.9.2. Clustering and Sequencing
2.9.3. Data Analysis
2.10. Determination of ACE Inhibitory Activity In Vitro
2.11. Statistical Analysis
3. Results
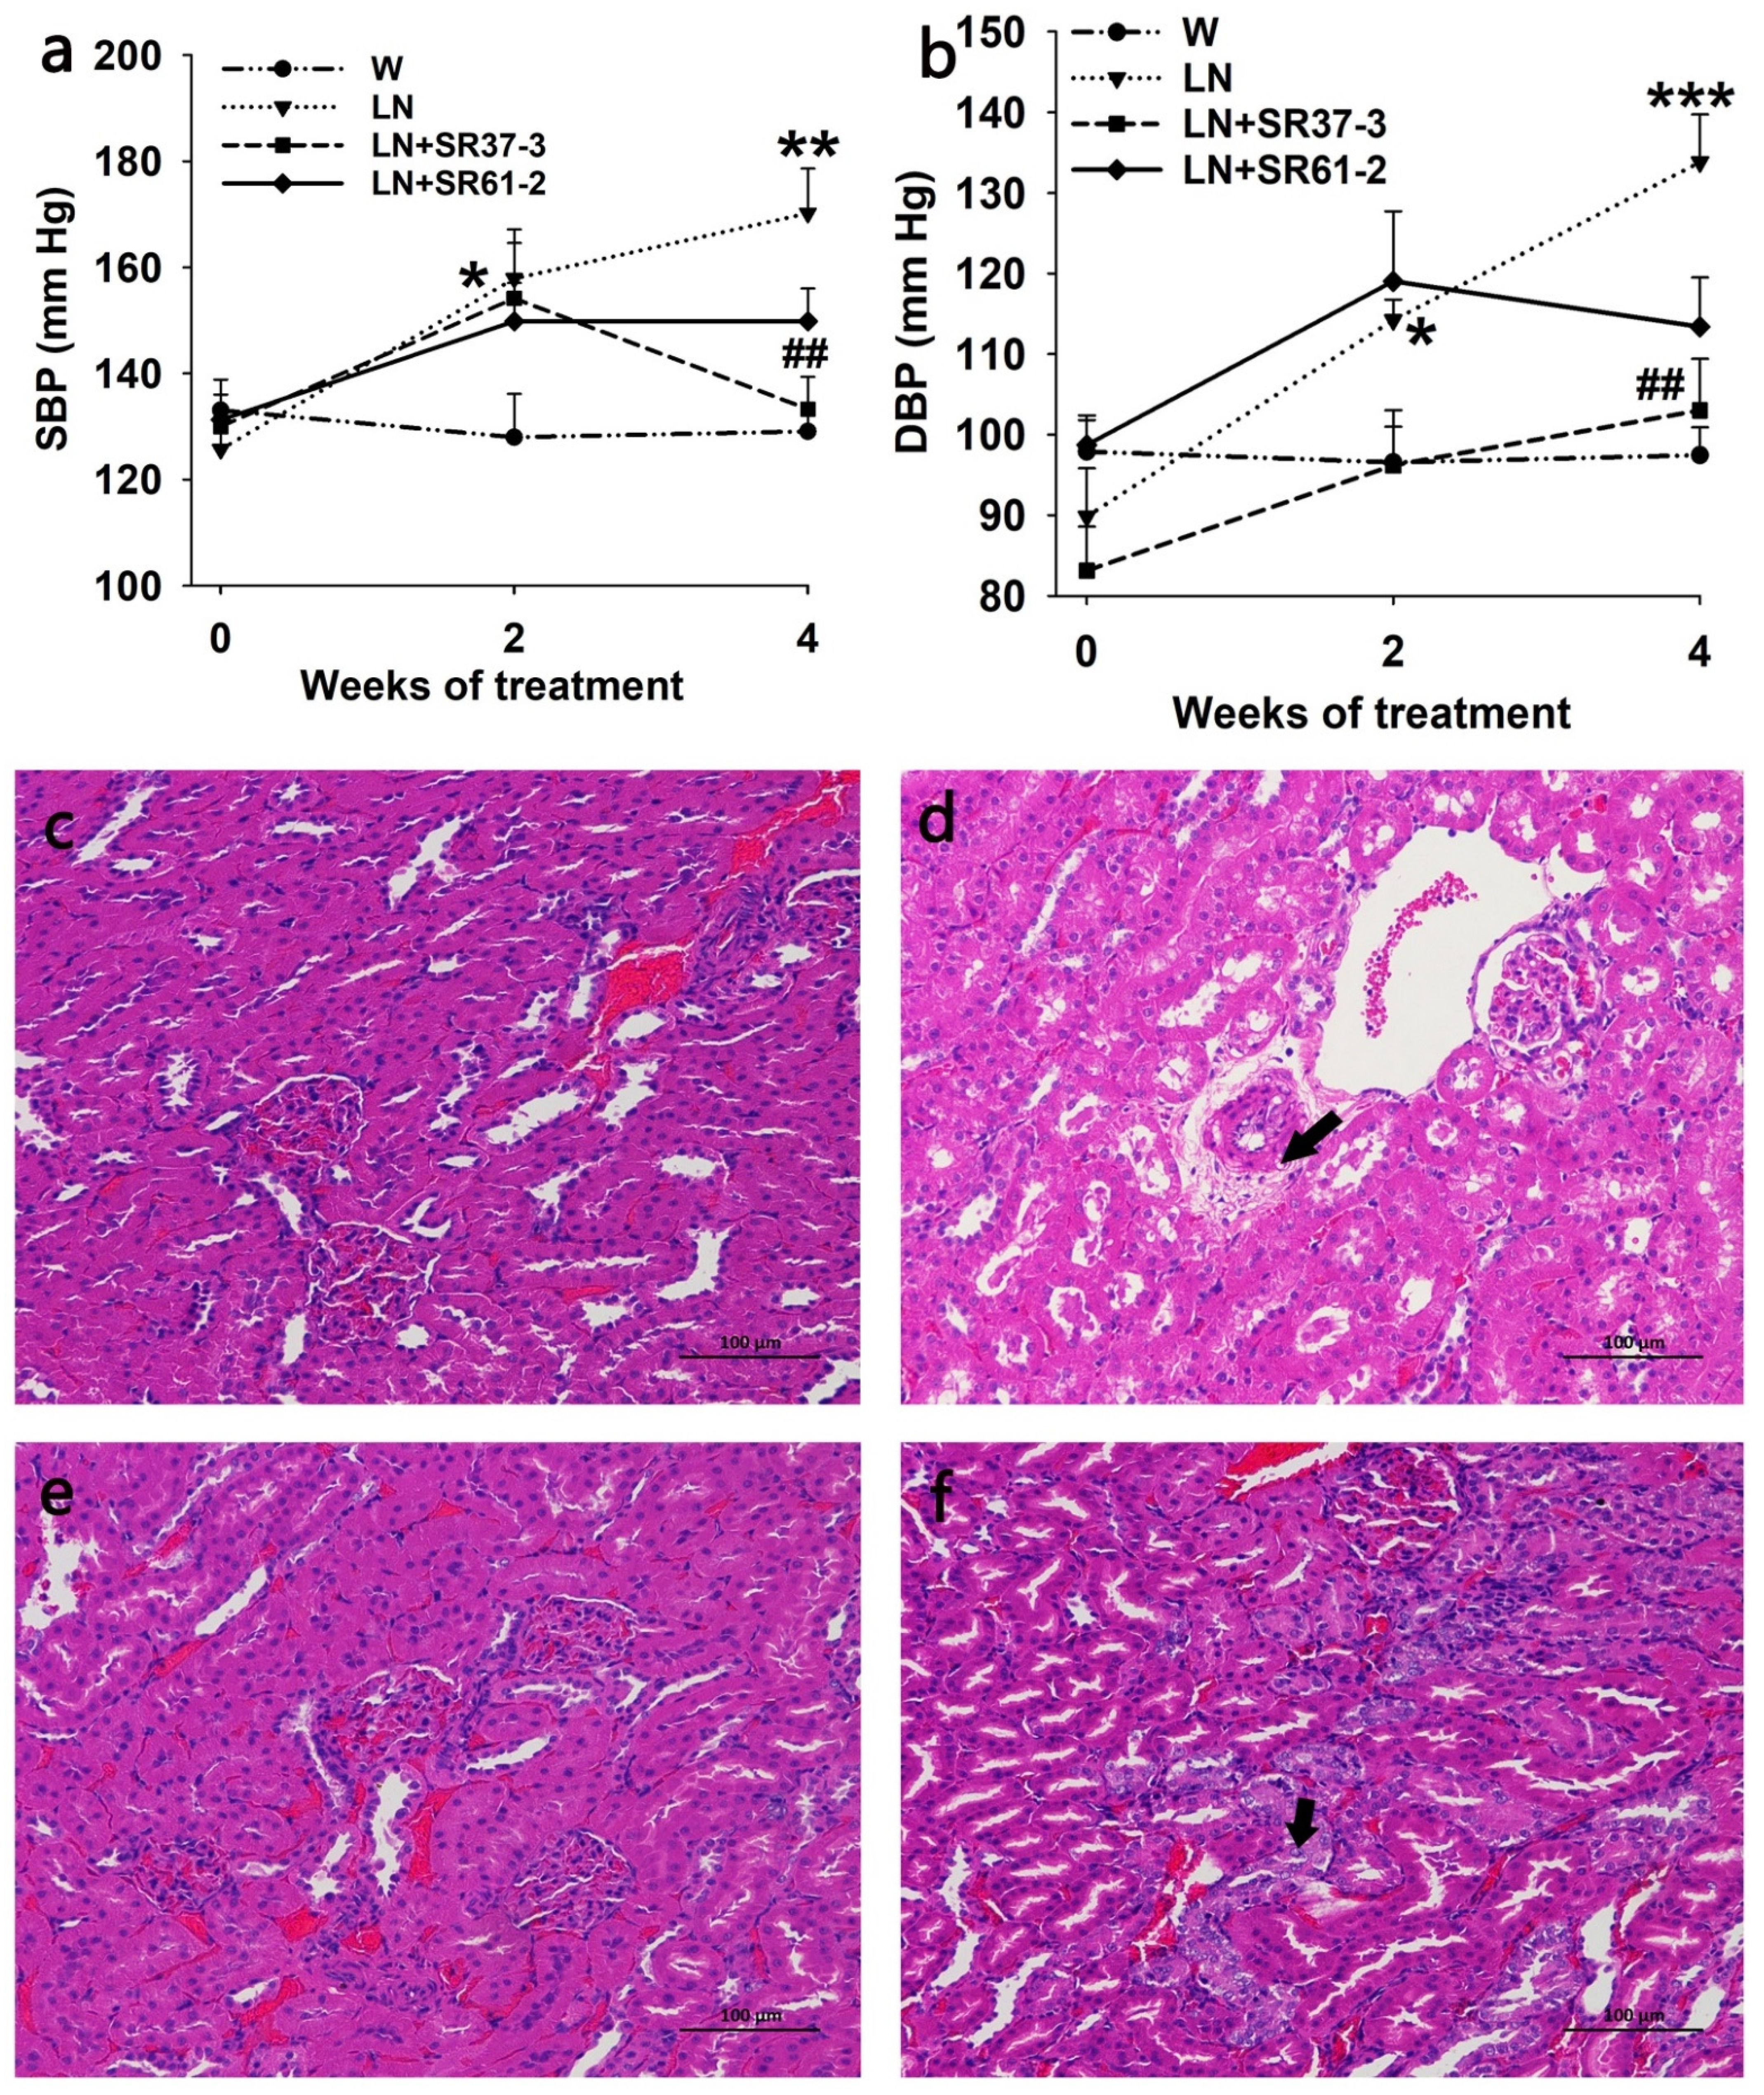
3.1. Changes in BP
3.2. PFM Rescues the Morphological Changes in the Kidneys
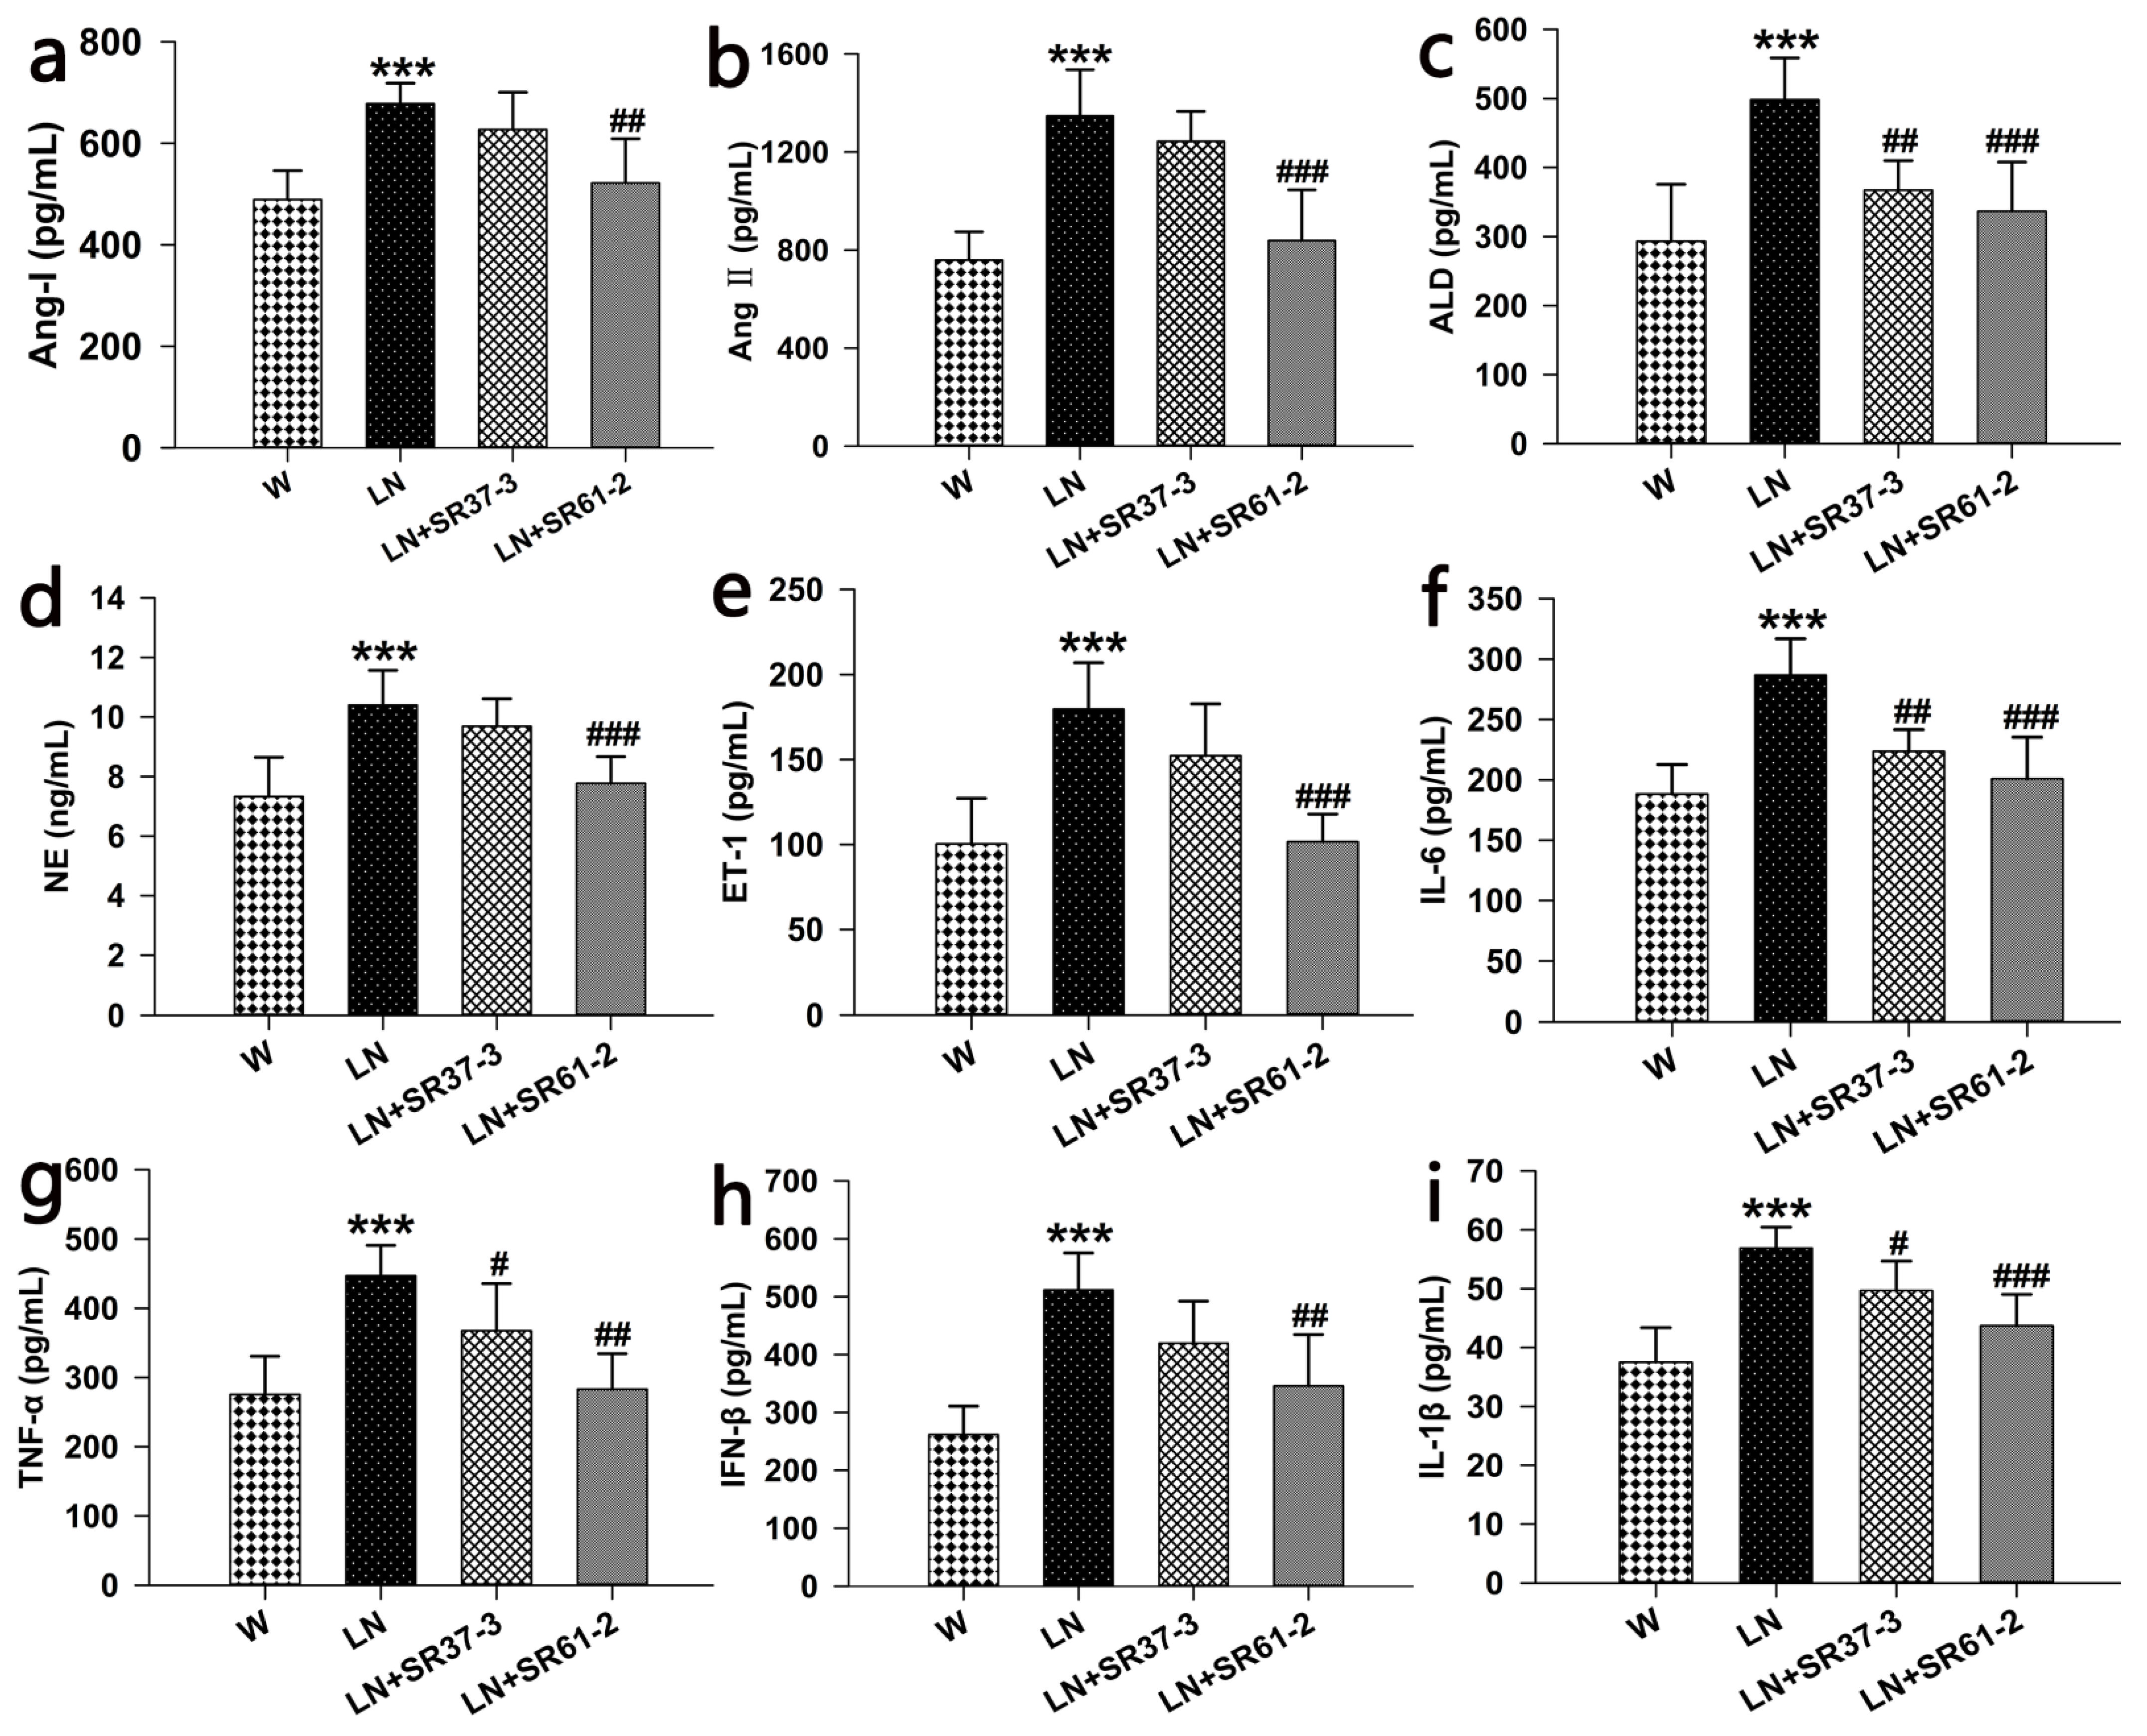
3.3. Effects of PFM on the Serum Parameters in Hypertensive Rats
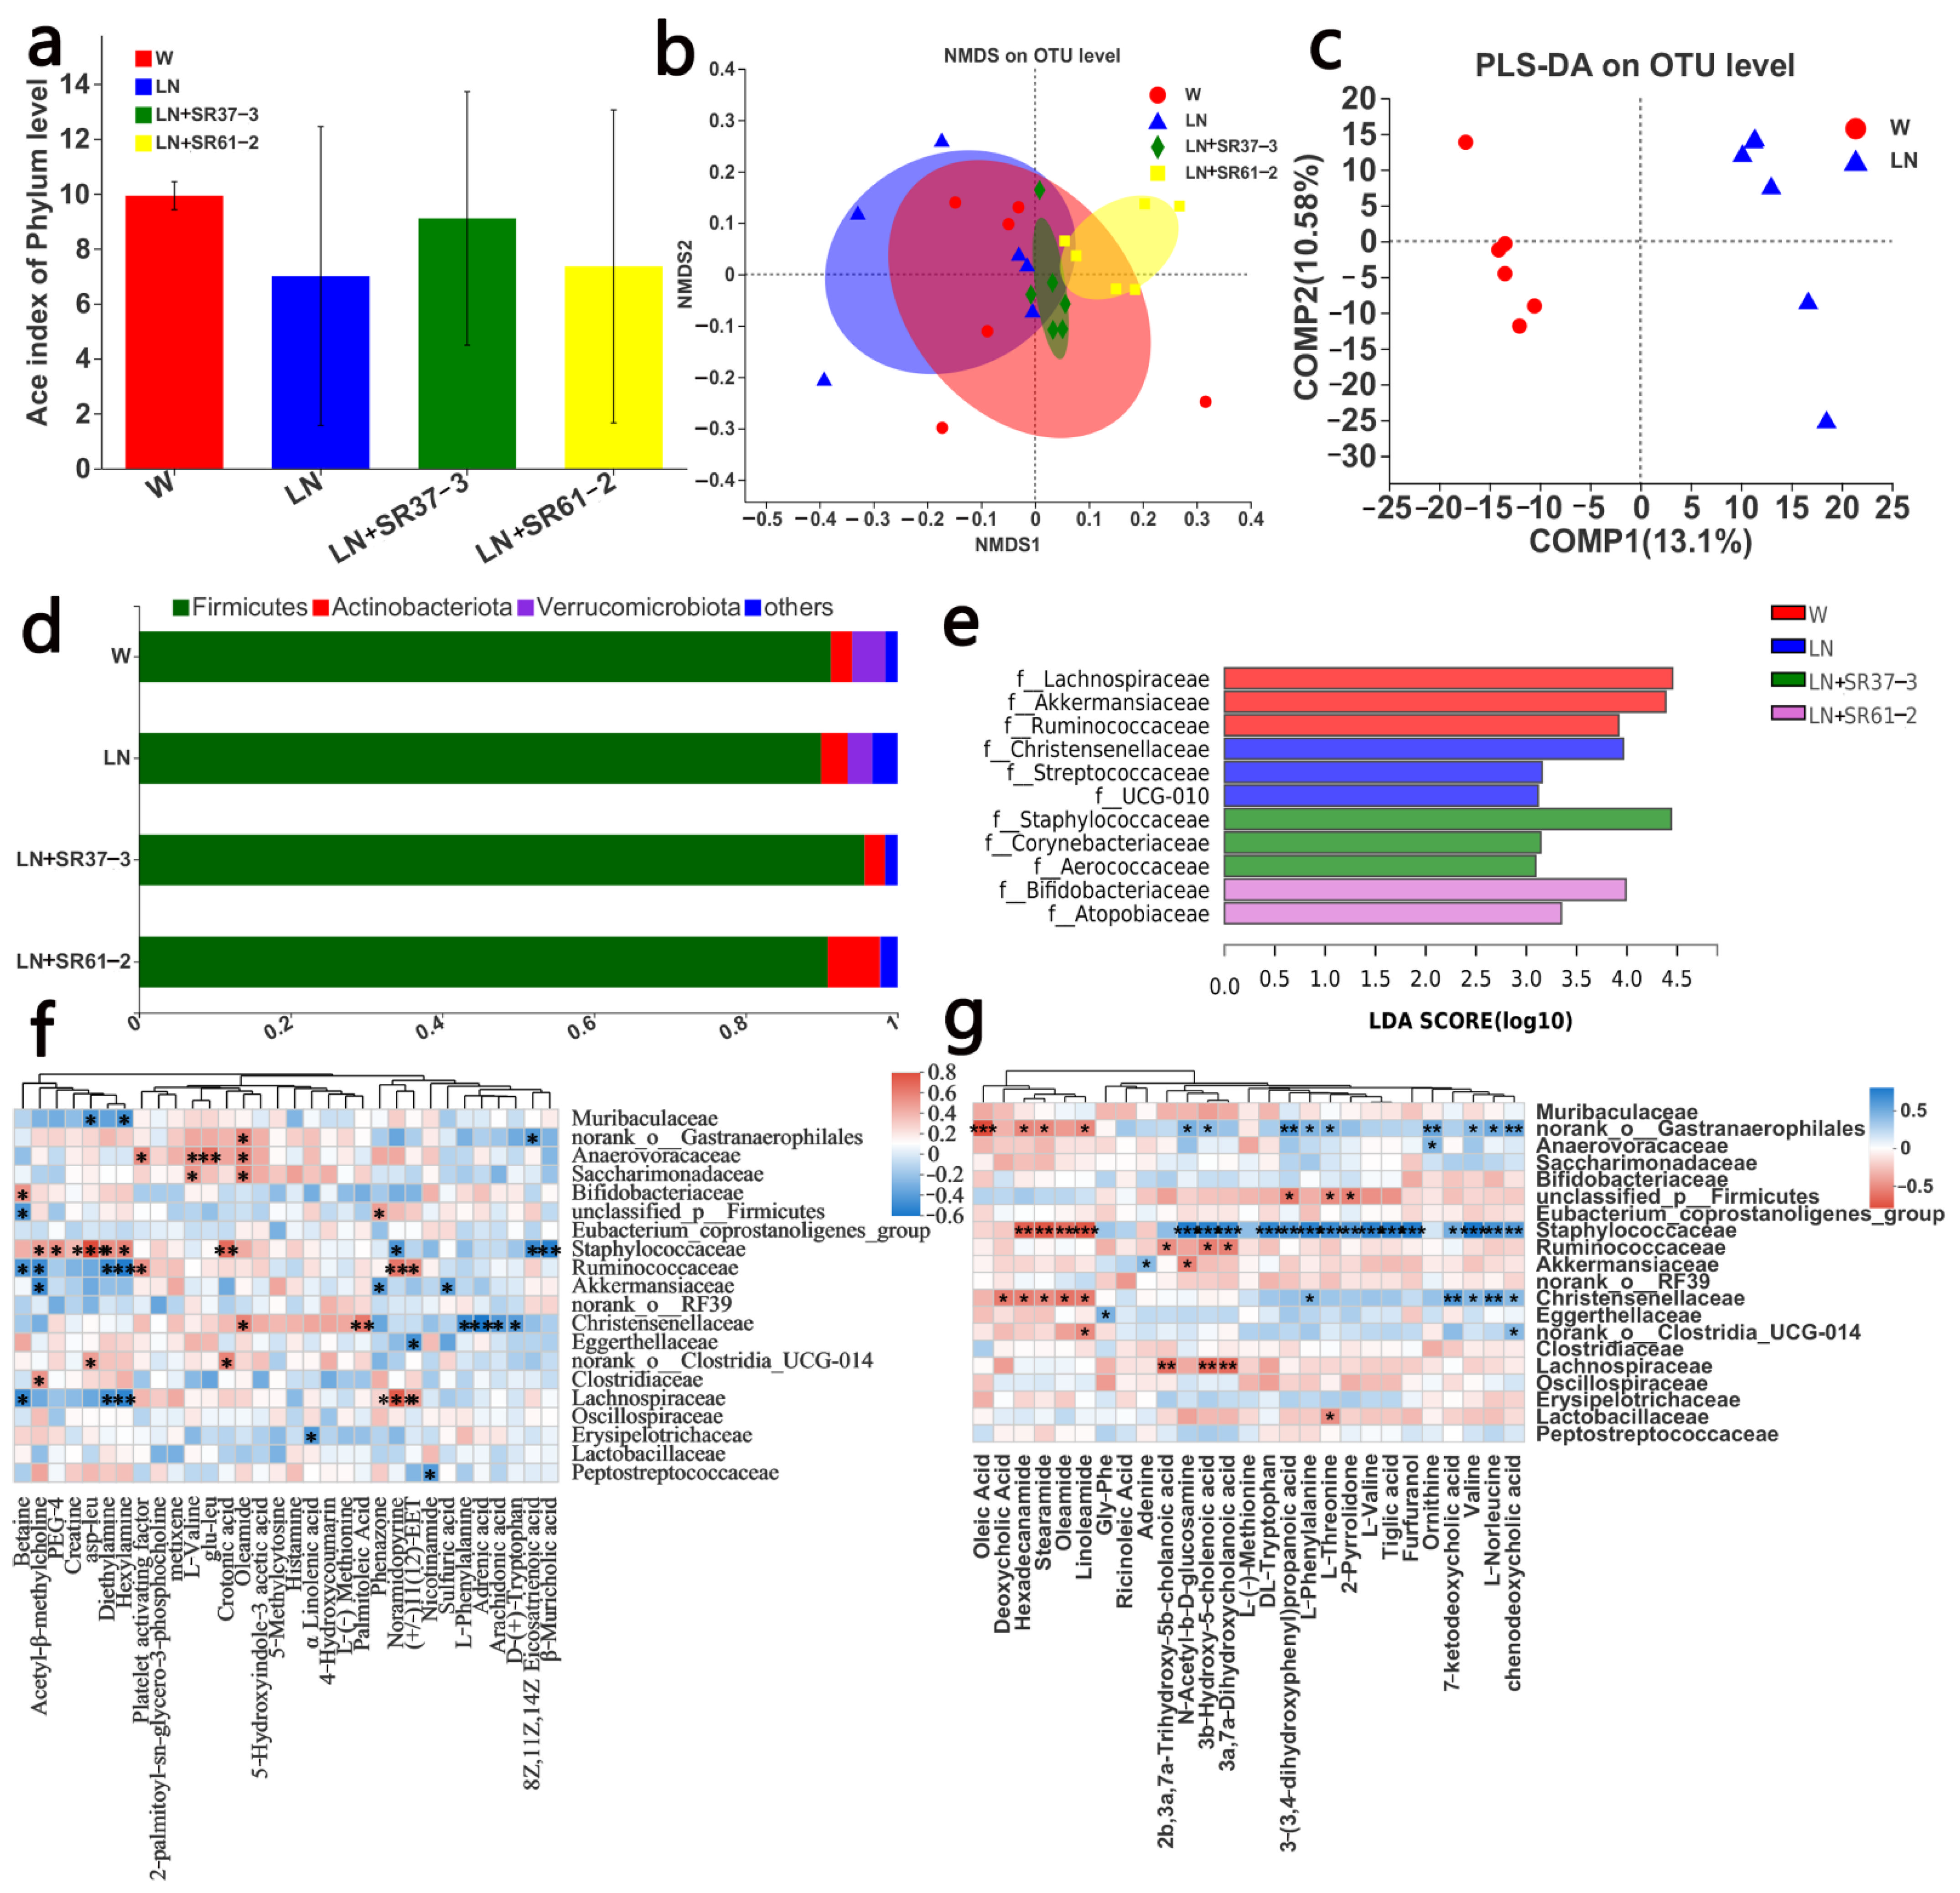
3.4. PFM Alleviates Intestinal Microbiota Dysbiosis in Hypertensive Rats
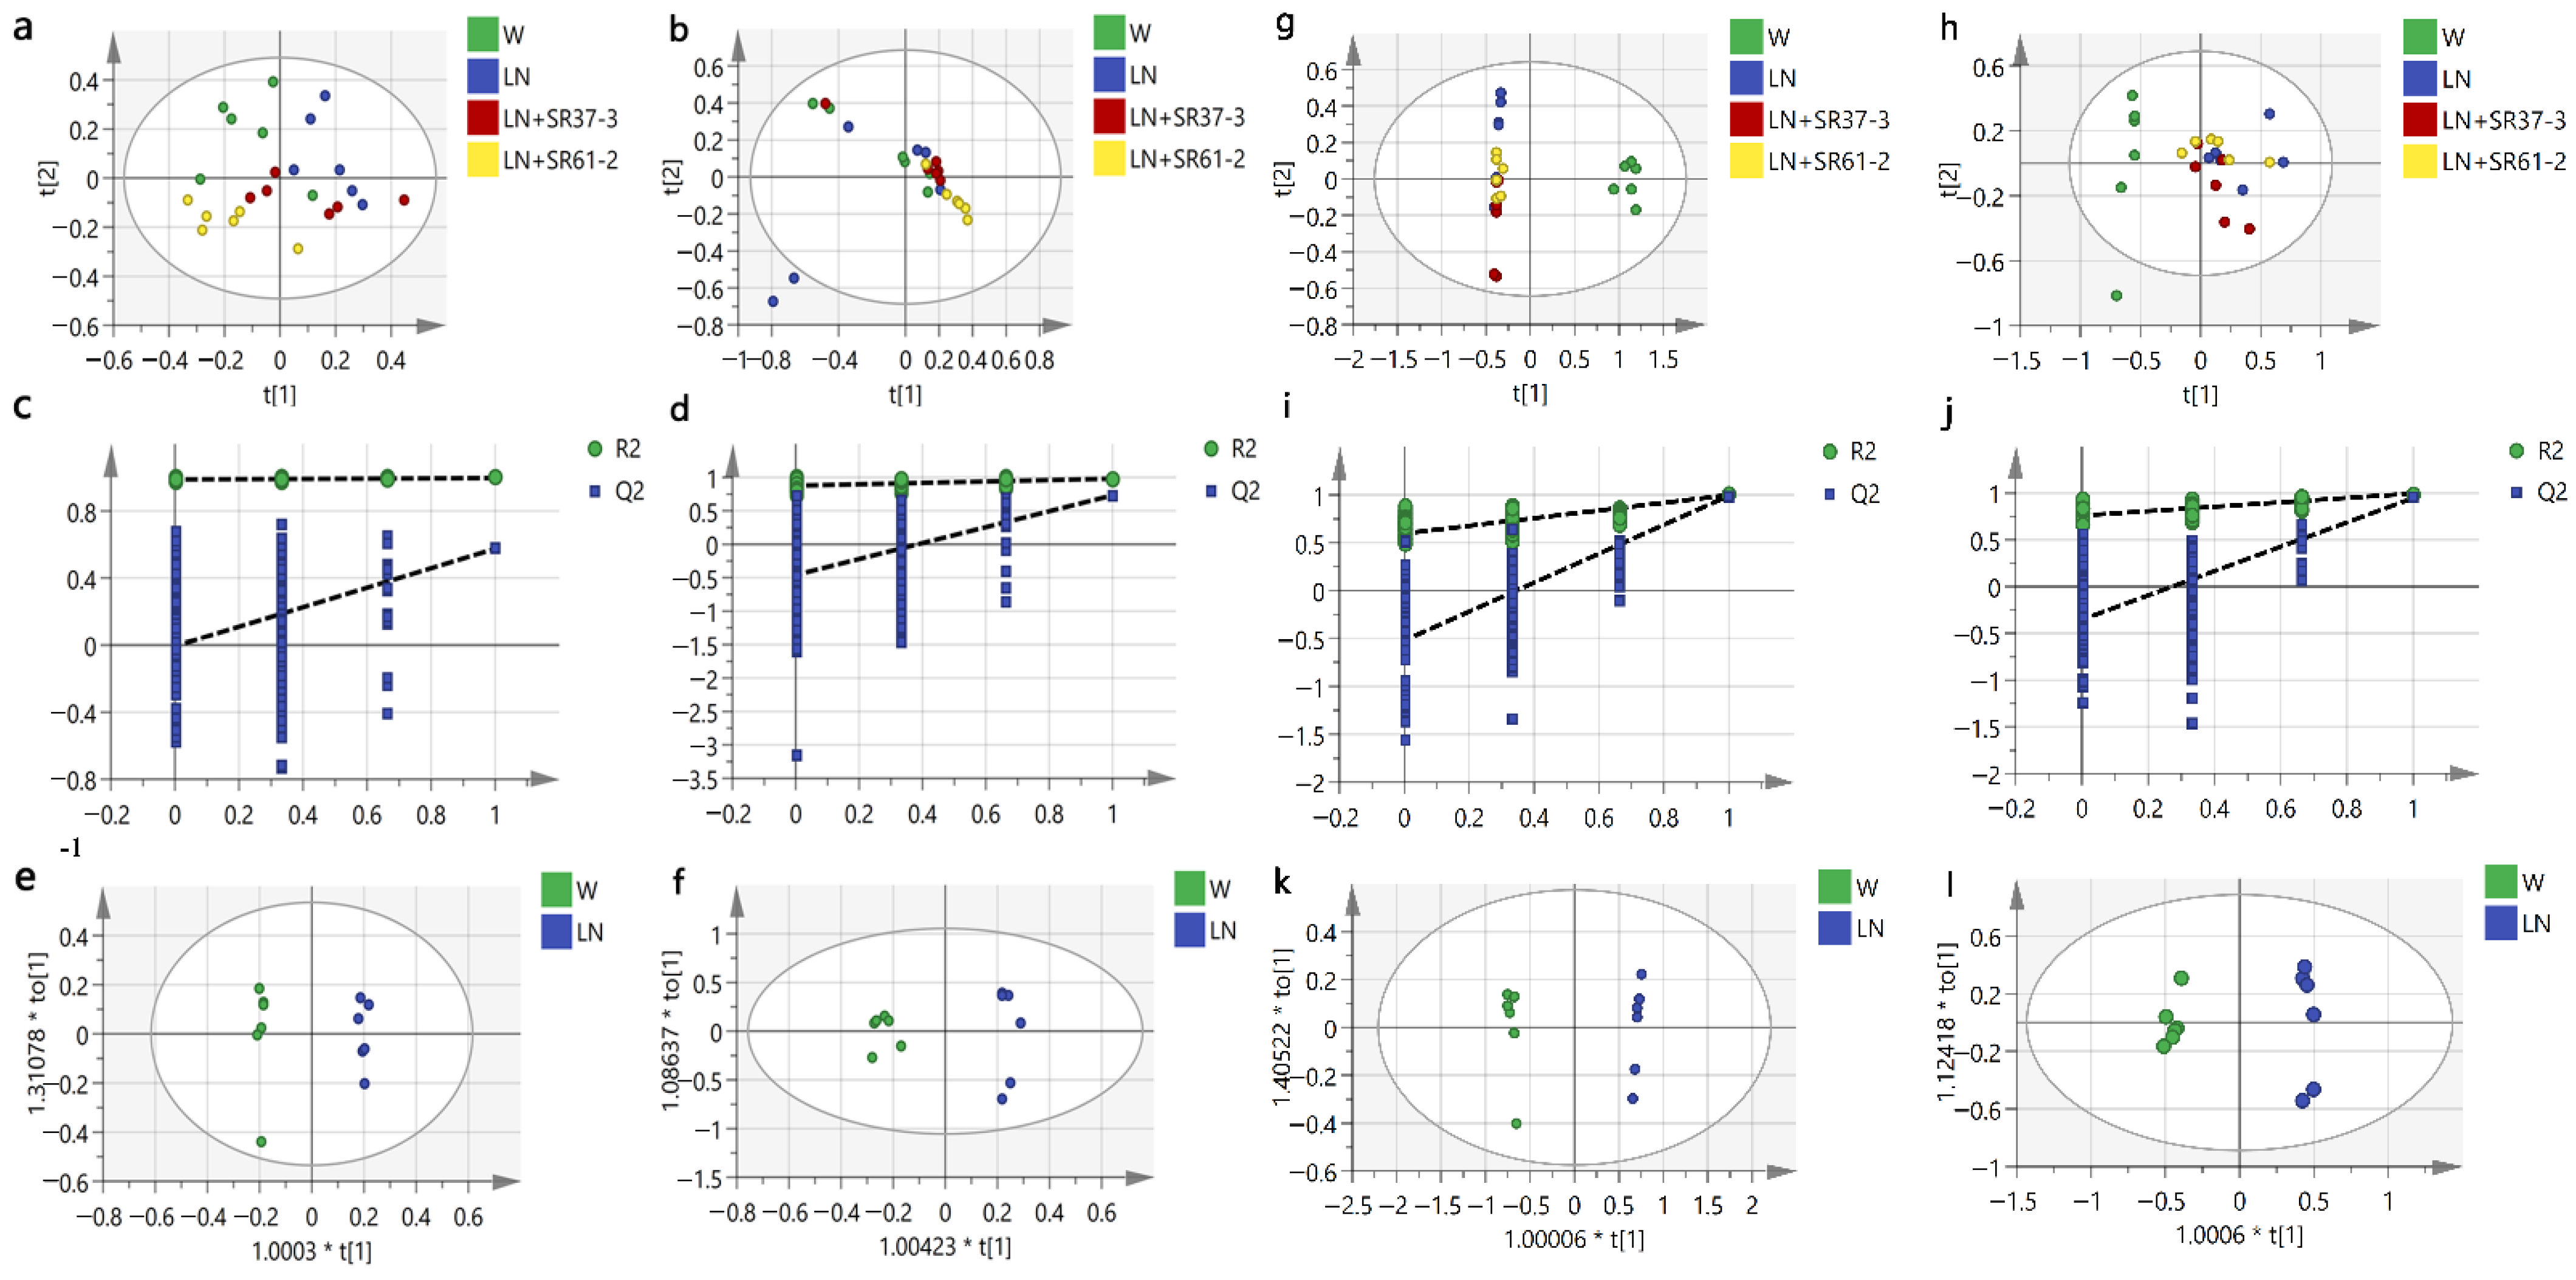
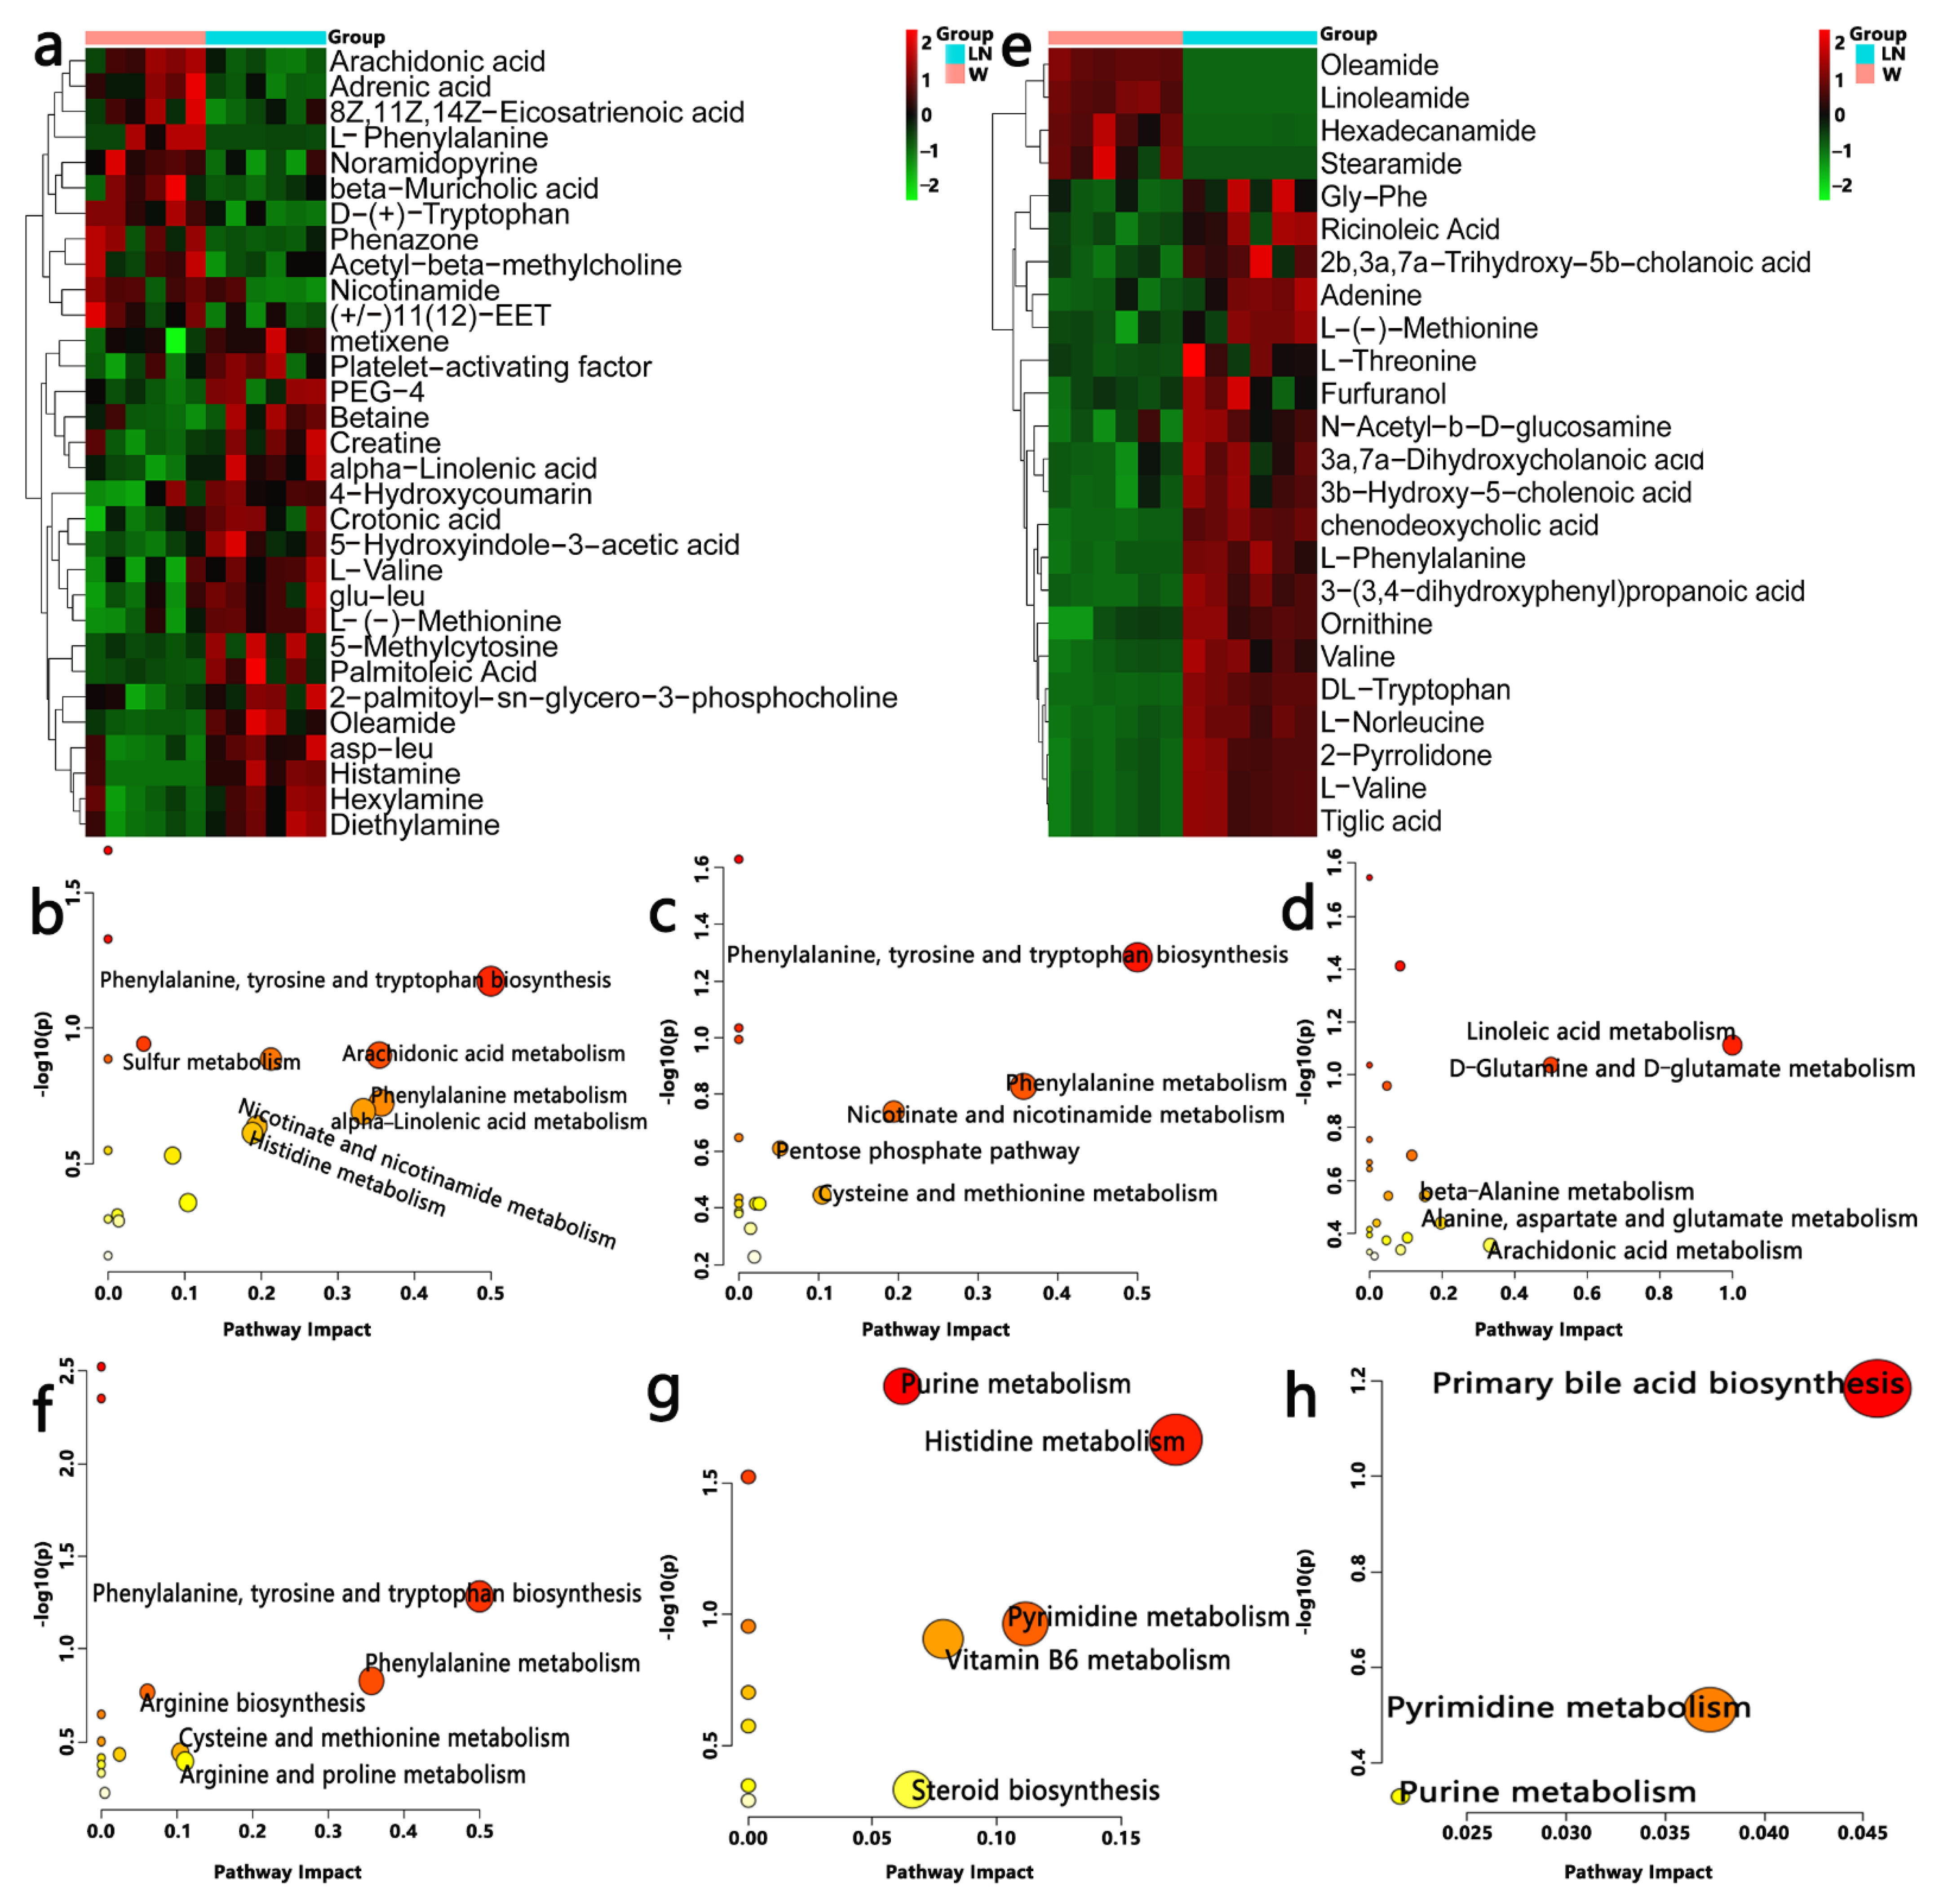
3.5. Effect of PFM on Metabolic Profiles
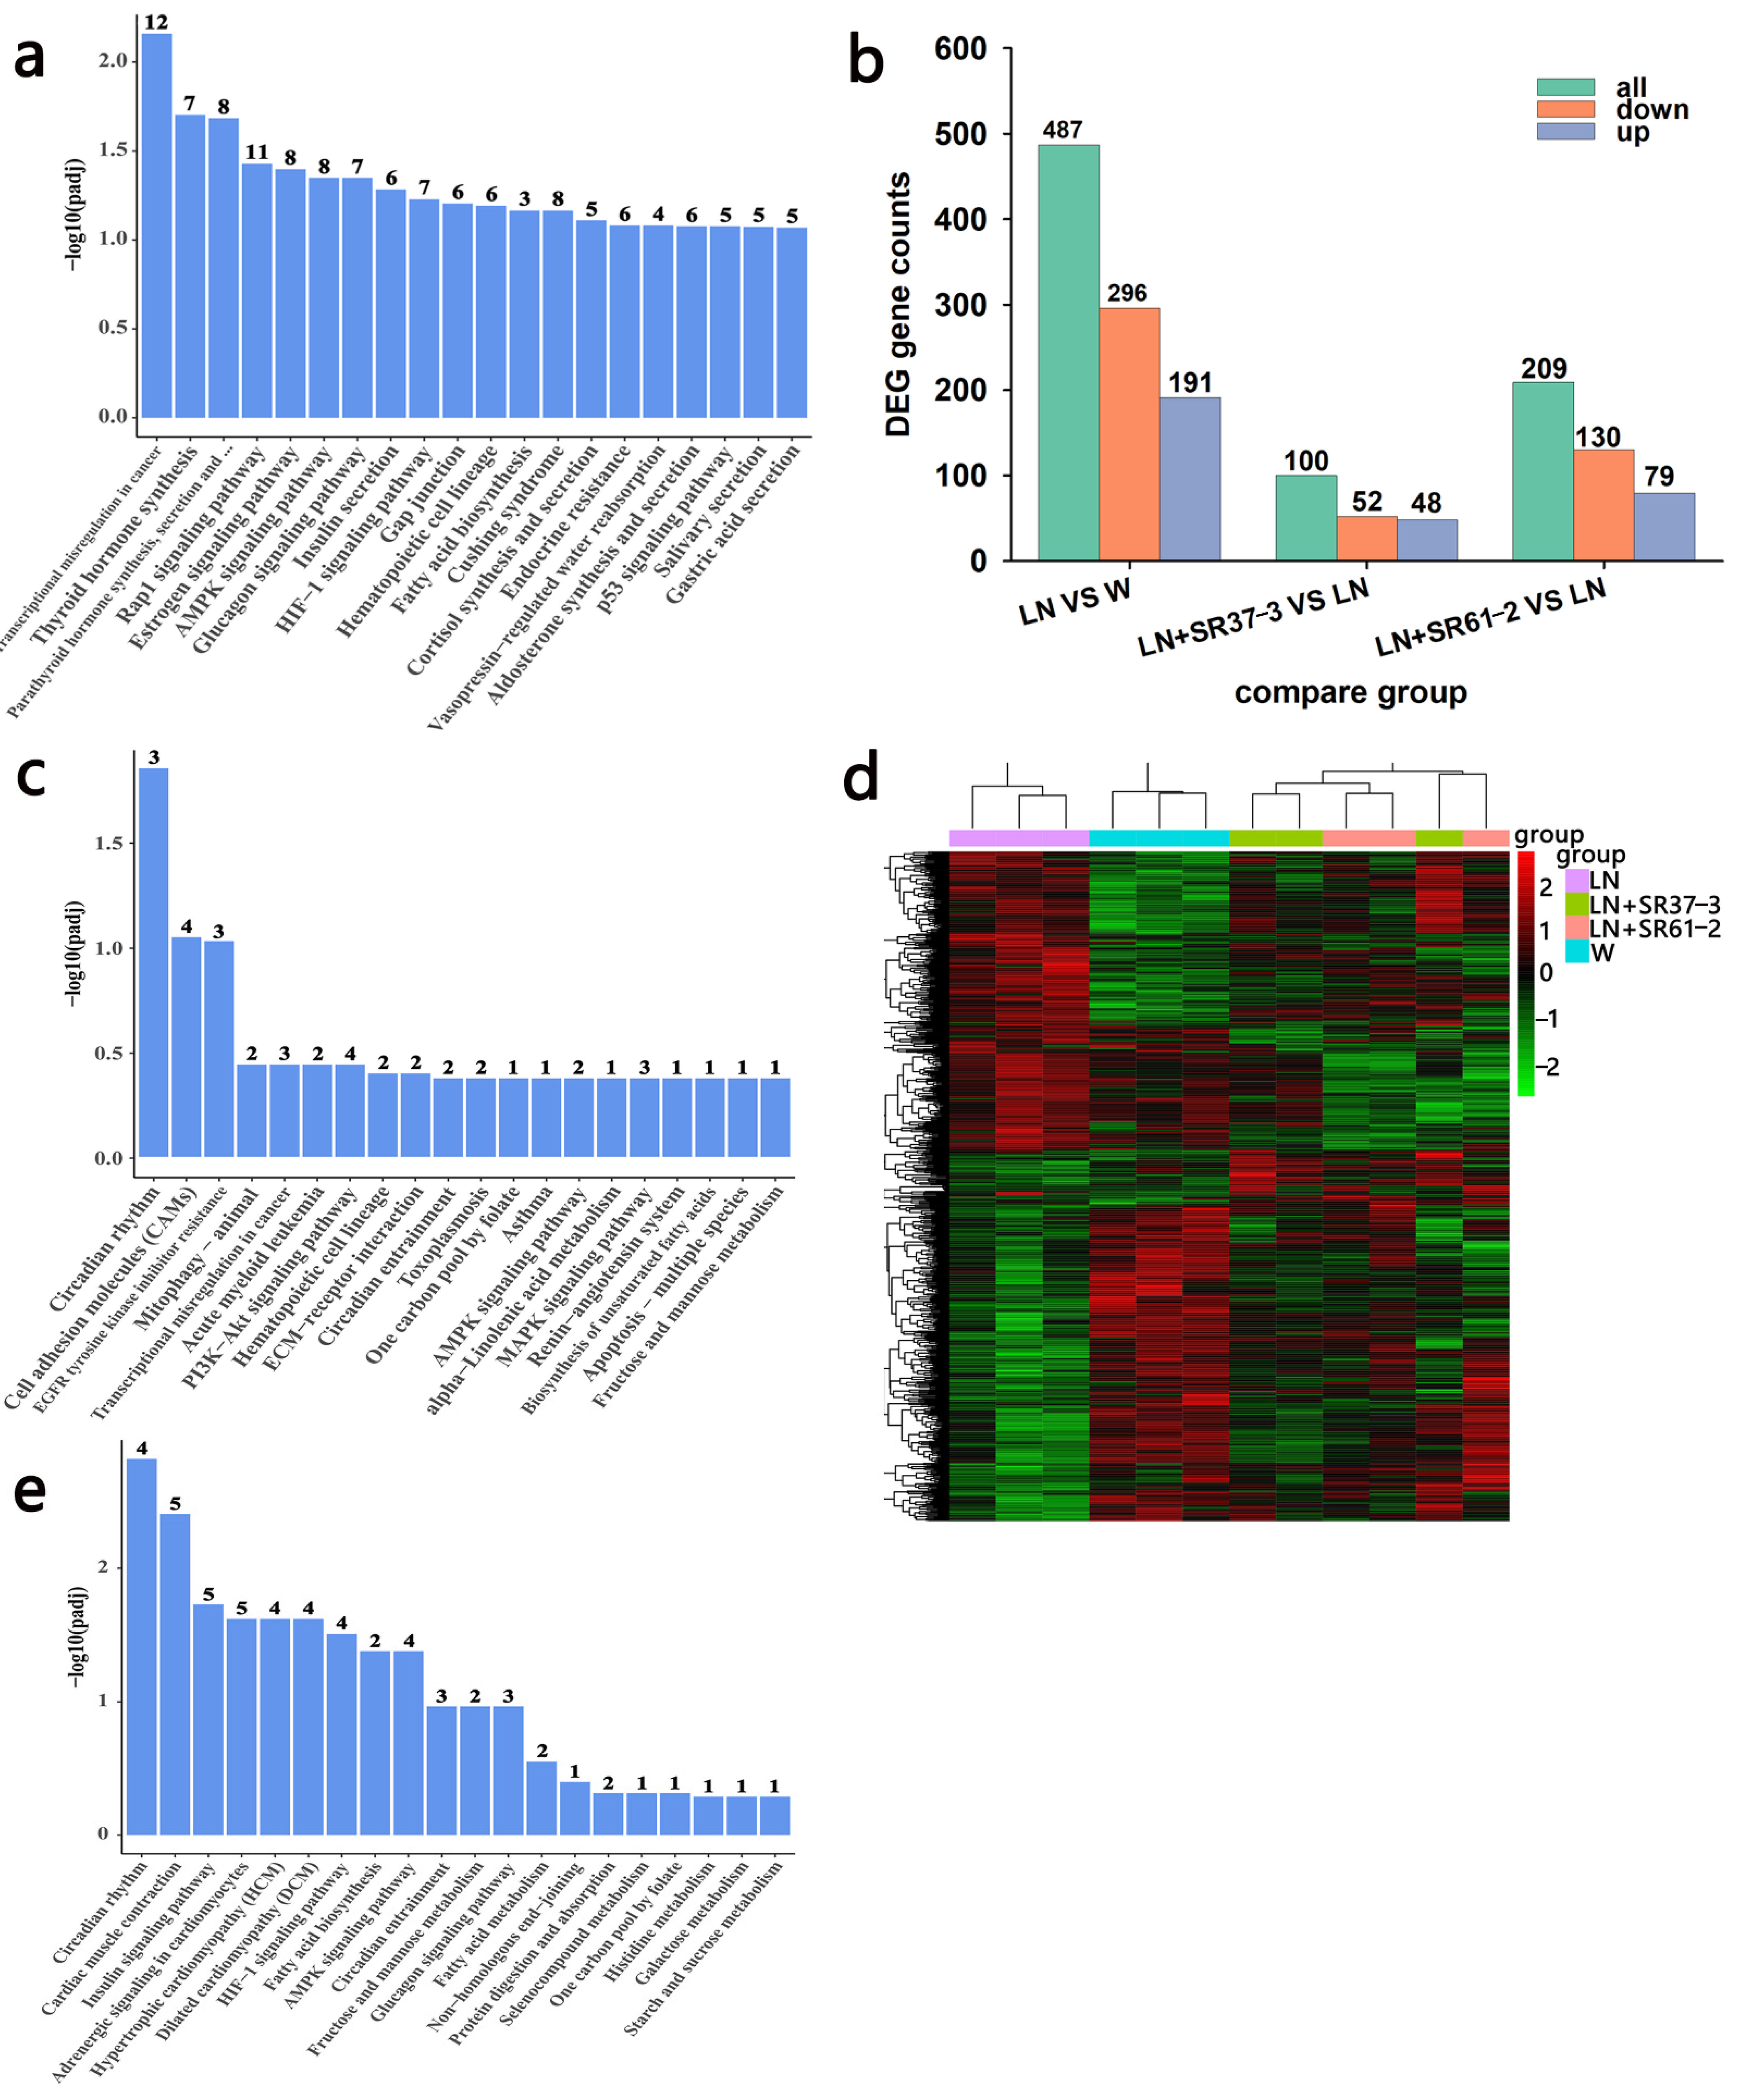
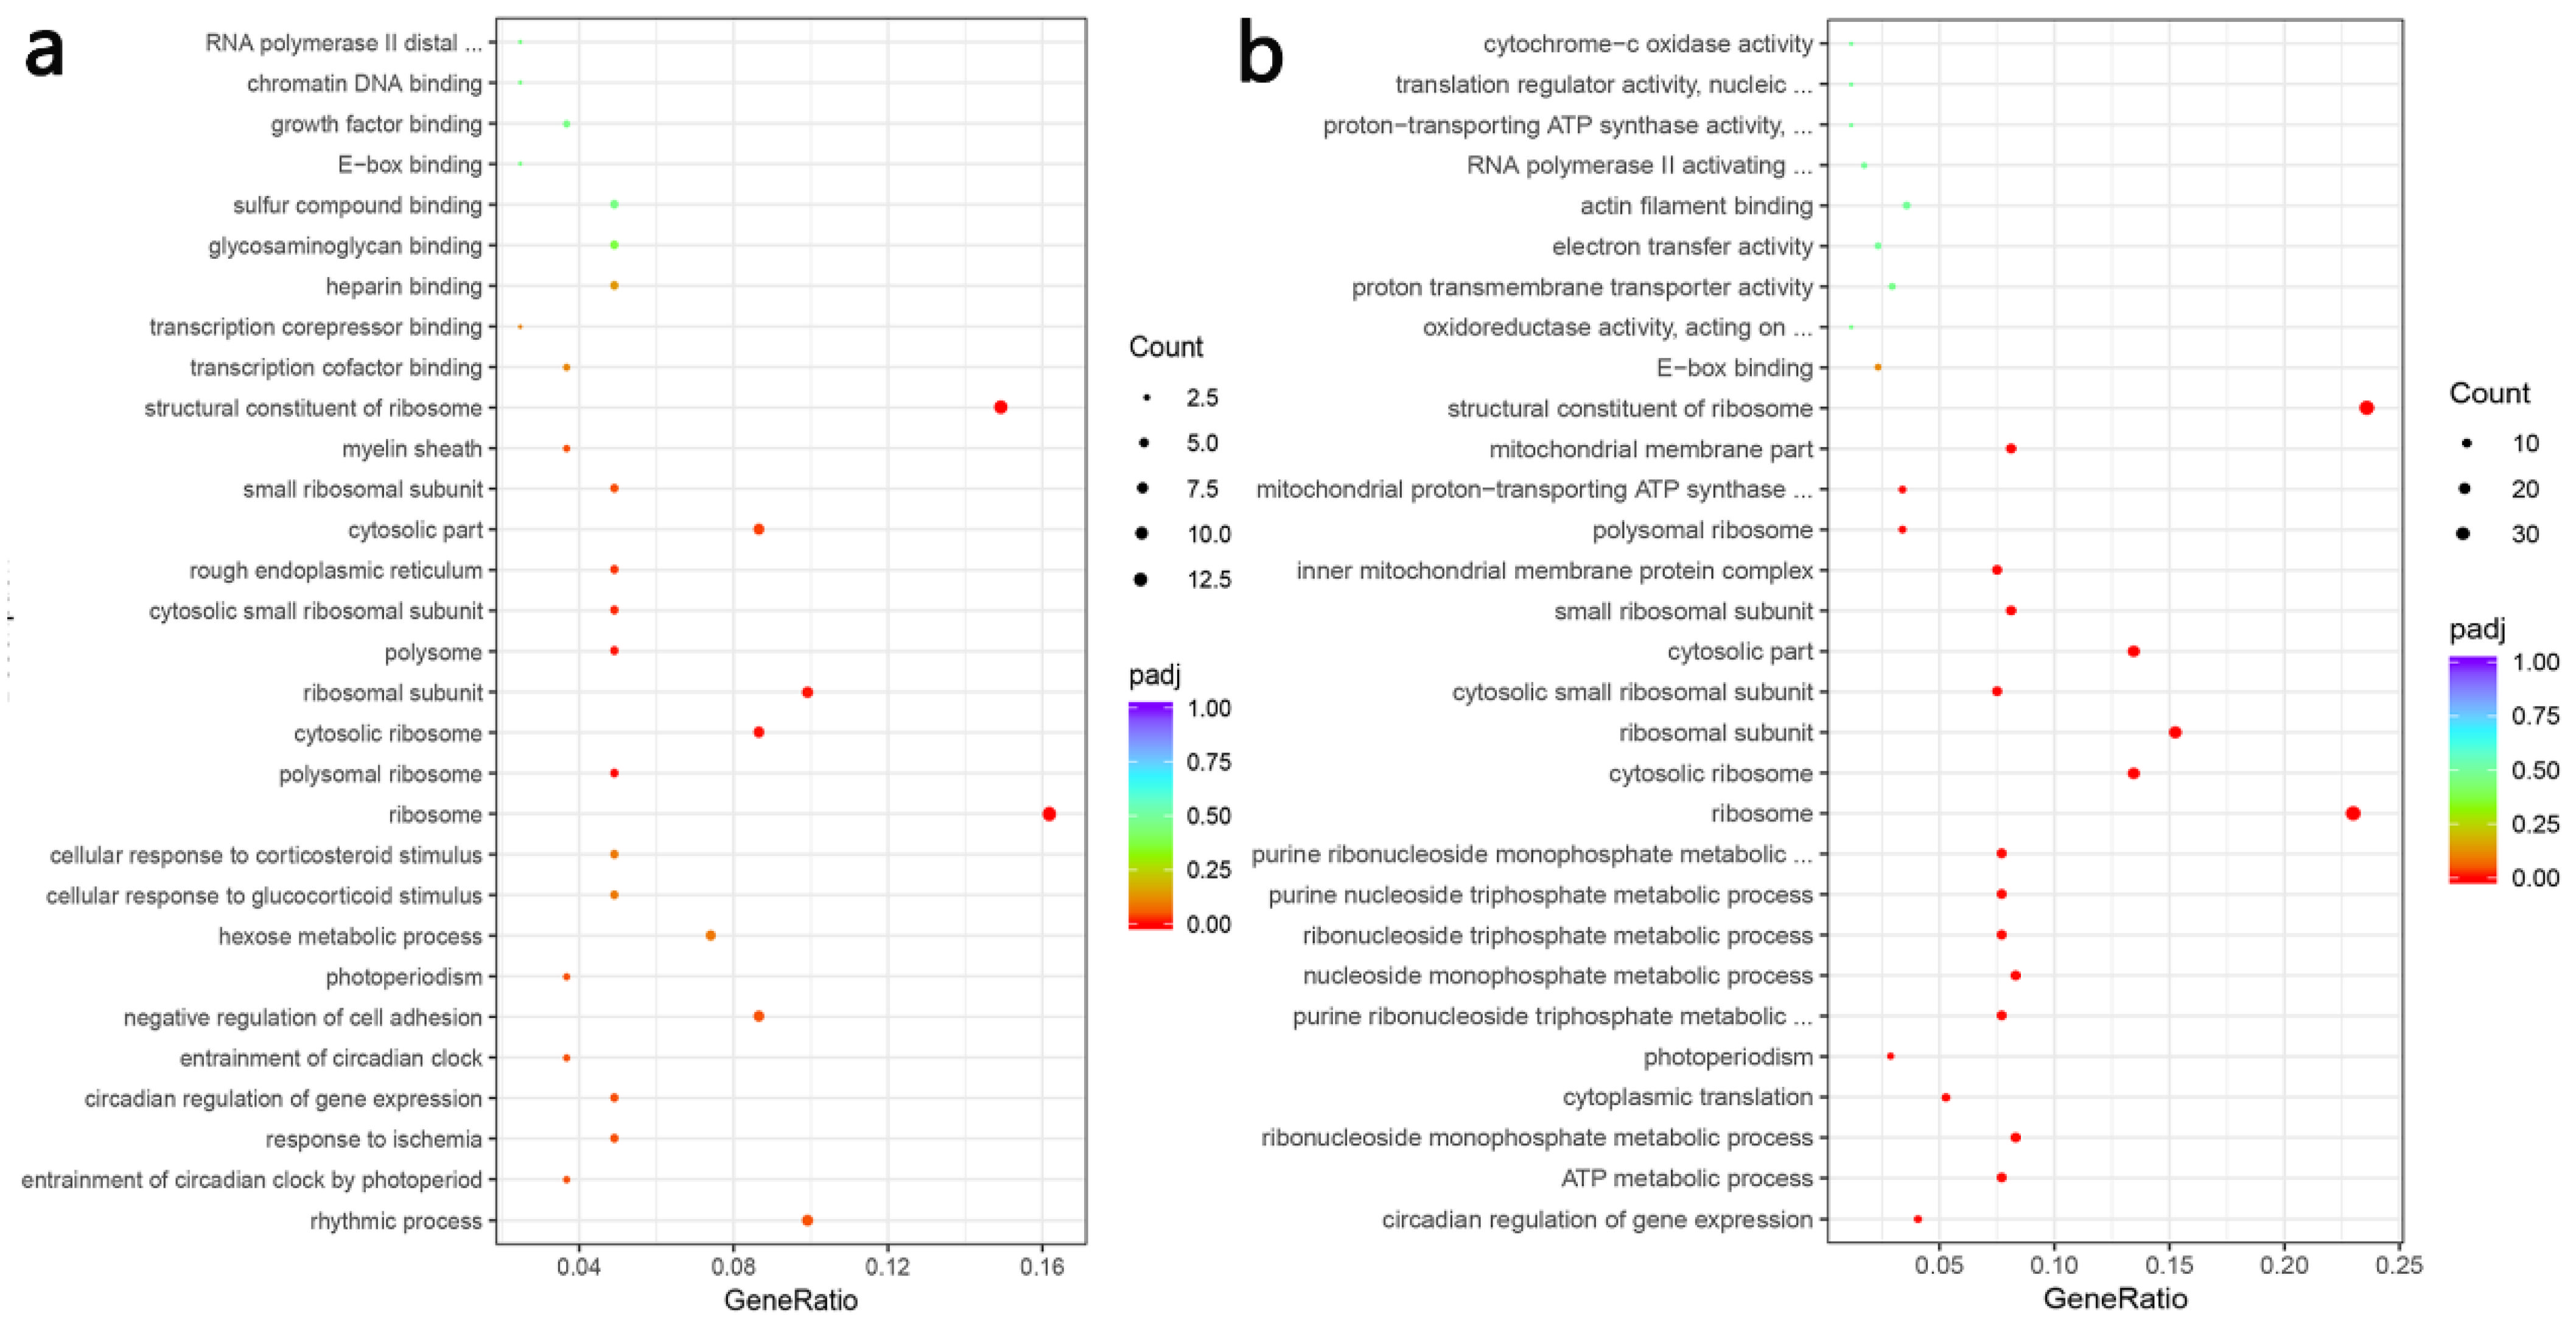
3.6. Transcriptome Profiles Reveals the Effect of PFM on the Thoracic Aorta of Hypertensive Rats
3.7. ACE Inhibition Rate of PFM Supernatant In Vitro
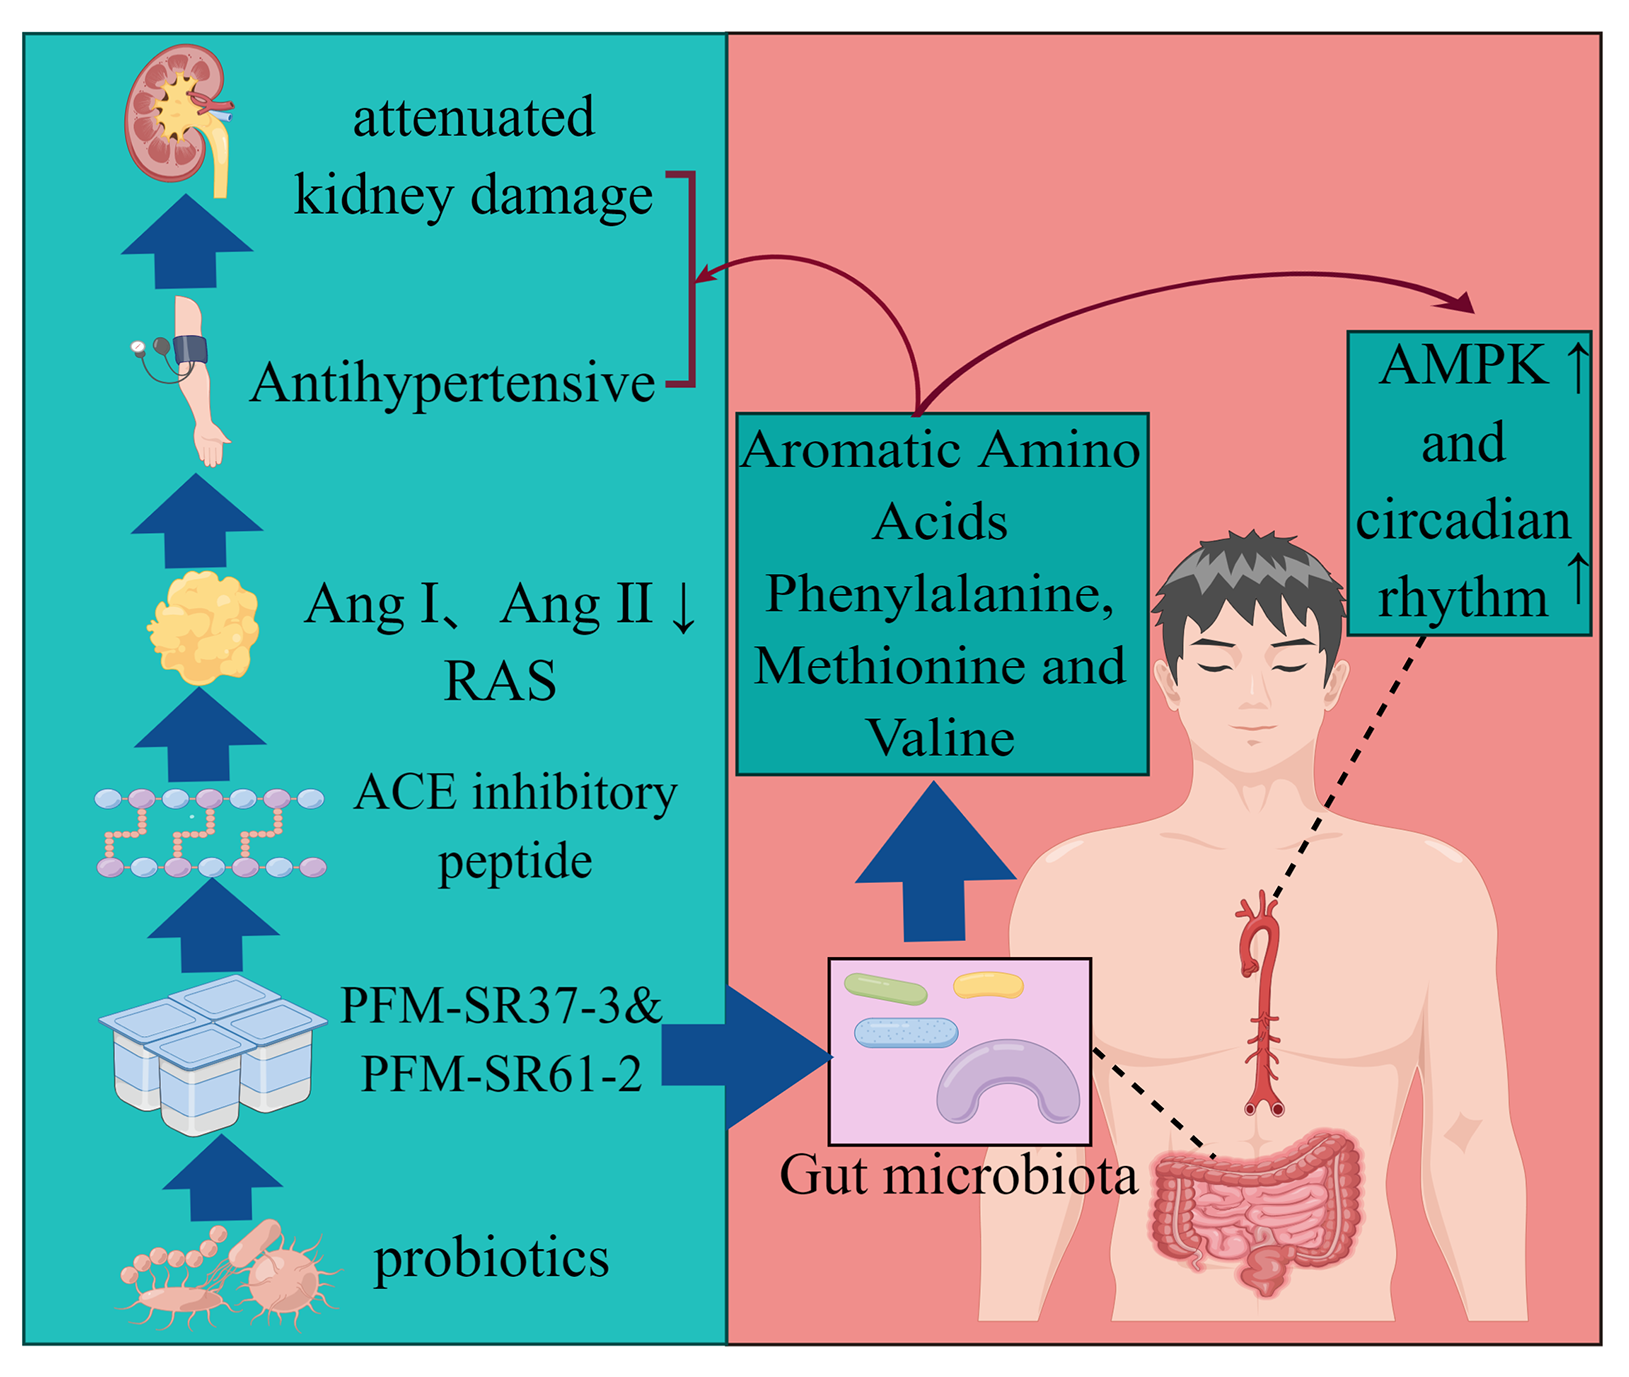
4. Discussion
Supplementary Materials
Author Contributions
Funding
Institutional Review Board Statement
Informed Consent Statement
Data Availability Statement
Conflicts of Interest
Abbreviations
| Abbreviation | Full name |
| ACE | Angiotensin Converting Enzyme |
| ALD | aldosterone |
| Ang Ⅰ | angiotensin I |
| Ang II | angiotensin II |
| BP | blood pressure |
| CVD | cardiovascular disease |
| DBP | diastolic BP |
| ELISA | enzyme linked immunosorbent assay |
| ET-1 | endothelin-1 |
| GO | Gene Ontology |
| HE | Hematoxylin-eosin |
| HESI | heating electrospray ion source |
| IFN-β | interferon-β |
| IL-1β | interleukin-1β |
| IL-6 | interleukin-6 |
| IPP | Ile-Pro-Pro |
| KEGG | Kyoto Encyclopedia of Genes and Genomes |
| LEfSe | linear discriminant analysis effect size |
| L-NAME | NG-nitro-L-arginine methyl ester |
| PFM-SR37-3 | milk fermented by Lactiplantibacillus plantarum strain SR37-3 |
| PFM-SR61-2 | milk fermented by Lactiplantibacillus plantarum strain SR61-2 |
| NE | norepinephrine |
| NMDS | Nonmetric multidimensional scaling |
| OPLS-DA | orthogonal least squares discriminant analysis |
| OSA | obstructive sleep apnea |
| OTUs | Operational taxonomic units |
| PAA | produce polyacrylic acid |
| PCA | principal component analysis |
| PCR | Polymerase Chain Reaction |
| PFM | Probiotics fermented milk |
| RAS | renin–angiotensin system |
| RCTs | randomized controlled trials |
| RDA | Redundancy Analysis |
| SBP | systolic BP |
| SD | standard deviation |
| SHR | spontaneously hypertensive rats |
| SPF | specific pathogen-free |
| TMAO | trimethylamine N-oxide |
| TNF-α | tumor necrosis factor α |
| VIP | variable importance projection |
| VPP | Val-Pro-Pro |
References
- Staessen, J.A. Age-specificity of blood-pressure-associated complications. Nat. Rev. Cardiol. 2014, 11, 499–501. [Google Scholar] [CrossRef] [PubMed] [Green Version]
- Kahan, T. Focus on blood pressure as a major risk factor. Lancet 2014, 383, 1866–1868. [Google Scholar] [CrossRef] [Green Version]
- Chen, M.; Sun, Q.; Giovannucci, E.; Mozaffarian, D.; Manson, J.E.; Willett, W.C.; Hu, F.B. Dairy Consumption and Risk of Type 2 Diabetes: 3 Cohorts of Us Adults and an Updated Meta-Analysis. BMC Med. 2014, 12, 215. [Google Scholar] [CrossRef] [PubMed] [Green Version]
- Hou, Q.; Li, C.; Liu, Y.; Li, W.; Chen, Y.; Siqinbateer; Bao, Y.; Saqila, W.; Zhang, H.; Menghe, B.; et al. Koumiss consumption modulates gut microbiota, increases plasma high density cholesterol, decreases immunoglobulin G and albumin. J. Funct. Foods 2018, 52, 469–478. [Google Scholar] [CrossRef]
- Li, C.; Kwok, L.-Y.; Mi, Z.; Bala, J.; Xue, J.; Yang, J.; Ma, Y.; Zhang, H.; Chen, Y. Characterization of the angiotensin-converting enzyme inhibitory activity of fermented milks produced with Lactobacillus casei. J. Dairy Sci. 2017, 100, 9495–9507. [Google Scholar] [CrossRef] [Green Version]
- Tillisch, K.; Labus, J.; Kilpatrick, L.; Jiang, Z.; Stains, J.; Ebrat, B.; Guyonnet, D.; Legrain-Raspaud, S.; Trotin, B.; Naliboff, B.; et al. Consumption of Fermented Milk Product with Probiotic Modulates Brain Activity. Gastroenterology 2013, 144, 1394–1401.e4. [Google Scholar] [CrossRef] [Green Version]
- Kechagia, M.; Basoulis, D.; Konstantopoulou, S.; Dimitriadi, D.; Gyftopoulou, K.; Skarmoutsou, N.; Fakiri, E.M. Health Benefits of Probiotics: A Review. Int. Sch. Res. Not. 2013, 2013, 481651. [Google Scholar] [CrossRef] [Green Version]
- Alhaj, O.A. Identification of potential ACE-inhibitory peptides from dromedary fermented camel milk. CyTA J. Food 2016, 15, 191–195. [Google Scholar] [CrossRef] [Green Version]
- Marchesi, J.R.; Adams, D.H.; Fava, F.; Hermes, G.D.A.; Hirschfield, G.M.; Hold, G.L.; Quraishi, M.N.; Kinross, J.; Smidt, H.; Tuohy, K.M.; et al. The gut microbiota and host health: A new clinical frontier. Gut 2015, 65, 330–339. [Google Scholar] [CrossRef] [Green Version]
- Turnbaugh, P.J.; Gordon, J.I. The core gut microbiome, energy balance and obesity. J. Physiol. 2009, 587, 4153–4158. [Google Scholar] [CrossRef]
- Khalesi, S.; Sun, J.; Buys, N.; Jayasinghe, R. Effect of Probiotics on Blood Pressure: A Systematic Review and Meta-Analysis of Randomized, Controlled Trials. Hypertension 2014, 64, 897–903. [Google Scholar] [CrossRef] [PubMed] [Green Version]
- Jose, P.A.; Raj, D. Gut microbiota in hypertension. Curr. Opin. Nephrol. Hypertens. 2015, 24, 403–409. [Google Scholar] [CrossRef] [PubMed] [Green Version]
- Solak, Y.; Afsar, B.; Vaziri, N.D.; Aslan, G.; Yalcin, C.E.; Covic, A.; Kanbay, M. Hypertension as an autoimmune and inflammatory disease. Hypertens. Res. 2016, 39, 567–573. [Google Scholar] [CrossRef] [PubMed]
- Abais-Battad, J.M.; Alsheikh, A.J.; Pan, X.; Fehrenbach, D.J.; Dasinger, J.H.; Lund, H.; Roberts, M.L.; Kriegel, A.J.; Cowley, A.W., Jr.; Kidambi, S.; et al. Dietary Effects on Dahl Salt-Sensitive Hypertension, Renal Damage, and the T Lymphocyte Transcriptome. Hypertension 2019, 74, 854–863. [Google Scholar] [CrossRef] [PubMed]
- Masson, G.S.; Nair, A.R.; Soares, P.P.S.; Michelini, L.C.; Francis, J. Aerobic training normalizes autonomic dysfunction, HMGB1 content, microglia activation and inflammation in hypothalamic paraventricular nucleus of SHR. Am. J. Physiol. Circ. Physiol. 2015, 309, H1115–H1122. [Google Scholar] [CrossRef] [Green Version]
- Sharafetdinov, K.; Plotnikova, O.A.; Alexeeva, R.I.; Sentsova, T.B.; Songisepp, E.; Stsepetova, J.; Smidt, I.; Mikelsaar, M. Hypocaloric diet supplemented with probiotic cheese improves body mass index and blood pressure indices of obese hypertensive patients—A randomized double-blind placebo-controlled pilot study. Nutr. J. 2013, 12, 138. [Google Scholar] [CrossRef] [Green Version]
- Naruszewicz, M.; Johansson, M.-L.; Zapolska-Downar, D.; Bukowska, H. Effect of Lactobacillus plantarum 299v on cardiovascular disease risk factors in smokers. Am. J. Clin. Nutr. 2002, 76, 1249–1255. [Google Scholar] [CrossRef] [Green Version]
- Ahrén, I.L.; Xu, J.; Önning, G.; Olsson, C.; Ahrné, S.; Molin, G. Antihypertensive activity of blueberries fermented by Lactobacillus plantarum DSM 15313 and effects on the gut microbiota in healthy rats. Clin. Nutr. 2015, 34, 719–726. [Google Scholar] [CrossRef]
- Xu, J.; Ahrén, I.L.; Prykhodko, O.; Olsson, C.; Ahrné, S.; Molin, G. Intake of Blueberry Fermented byLactobacillus plantarumAffects the Gut Microbiota of L-NAME Treated Rats. Evid.-Based Complement. Altern. Med. 2013, 2013, 1–9. [Google Scholar] [CrossRef] [Green Version]
- Yang, L.; Xie, X.; Li, Y.; Wu, L.; Fan, C.; Liang, T.; Xi, Y.; Yang, S.; Li, H.; Zhang, J.; et al. Evaluation of the Cholesterol-Lowering Mechanism of Enterococcus faecium Strain 132 and Lactobacillus paracasei Strain 201 in Hypercholesterolemia Rats. Nutrients 2021, 13, 1982. [Google Scholar] [CrossRef]
- Tsuchiya, K.; Tomita, S.; Ishizawa, K.; Abe, S.; Ikeda, Y.; Kihira, Y.; Tamaki, T. Dietary nitrite ameliorates renal injury in l-NAME-induced hypertensive rats. Nitric Oxide 2010, 22, 98–103. [Google Scholar] [CrossRef] [PubMed]
- Yildirim, F.I.A.; Kizilay, D.E.; Ergin, B.; Ekmekçi, B.; Topal, G.; Kucur, M.; Tansel, C.D.; Doğan, B.S.U. Barnidipine ameliorates the vascular and renal injury in l-NAME-induced hypertensive rats. Eur. J. Pharmacol. 2015, 764, 433–442. [Google Scholar] [CrossRef] [PubMed]
- Li, H.; Xie, X.; Li, Y.; Chen, M.; Xue, L.; Wang, J.; Zhang, J.; Wu, S.; Ye, Q.; Zhang, S.; et al. Pediococcus pentosaceus IM96 Exerts Protective Effects against Enterohemorrhagic Escherichia coli O157:H7 Infection In Vivo. Foods 2021, 10, 2945. [Google Scholar] [CrossRef]
- Liang, T.; Xie, X.; Wu, L.; Li, L.; Li, H.; Xi, Y.; Feng, Y.; Xue, L.; Chen, M.; Chen, X.; et al. Microbial Communities and Physiochemical Properties of Four Distinctive Traditionally Fermented Vegetables from North China and Their Influence on Quality and Safety. Foods 2021, 11, 21. [Google Scholar] [CrossRef] [PubMed]
- Chen, S.; Zhou, Y.; Chen, Y.; Gu, J. fastp: An ultra-fast all-in-one FASTQ preprocessor. Bioinformatics 2018, 34, i884–i890. [Google Scholar] [CrossRef]
- Edgar, R.C. UPARSE: Highly accurate OTU sequences from microbial amplicon reads. Nat. Methods 2013, 10, 996–998. [Google Scholar] [CrossRef]
- Stackebrandt, E.; Goebel, B.M. Taxonomic Note: A Place for DNA-DNA Reassociation and 16S rRNA Sequence Analysis in the Present Species Definition in Bacteriology. Int. J. Syst. Evol. Microbiol. 1994, 44, 846–849. [Google Scholar] [CrossRef] [Green Version]
- Wang, Q.; Garrity, G.M.; Tiedje, J.M.; Cole, J.R. Naive Bayesian classifier for rapid assignment of rRNA sequences into the new bacterial taxonomy. Appl. Environ. Microbiol. 2007, 73, 5261–5267. [Google Scholar] [CrossRef] [Green Version]
- Khan, A.; Ju, F.; Xie, W.; Hafeez, M.T.; Cheng, X.; Yang, Z.; Zhu, L.; Li, T.; Zhang, S. Transcriptomic Analysis Reveals Differential Activation of Microglial Genes after Ischemic Stroke in Mice. Neuroscience 2017, 348, 212–227. [Google Scholar] [CrossRef]
- Shalaby, S.M.; Zakora, M.; Otte, J. Performance of two commonly used angiotensin-converting enzyme inhibition assays using FA-PGG and HHL as substrates. J. Dairy Res. 2006, 73, 178–186. [Google Scholar] [CrossRef]
- Alshuniaber, M.; Alhaj, O.; Abdallah, Q.; Jahrami, H. Effects of camel milk hydrolysate on blood pressure and biochemical parameters in fructose-induced hypertensive rats. Nutr. Food Sci. 2021, 52, 292–307. [Google Scholar] [CrossRef]
- Yan, X.; Jin, J.; Su, X.; Yin, X.; Gao, J.; Wang, X.; Zhang, S.; Bu, P.; Wang, M.; Zhang, Y.; et al. Intestinal Flora Modulates Blood Pressure by Regulating the Synthesis of Intestinal-Derived Corticosterone in High Salt-Induced Hypertension. Circ. Res. 2020, 126, 839–853. [Google Scholar] [CrossRef] [PubMed]
- Yang, T.; Santisteban, M.M.; Rodriguez, V.; Li, E.; Ahmari, N.; Carvajal, J.M.; Zadeh, M.; Gong, M.; Qi, Y.; Zubcevic, J.; et al. Gut Dysbiosis Is Linked to Hypertension. Hypertension 2015, 65, 1331–1340. [Google Scholar] [CrossRef] [PubMed] [Green Version]
- Song, T.; Guan, X.; Wang, X.; Qu, S.; Chen, X. Dynamic modulation of gut microbiota improves post-yocardial infarct tissue repair in rats via butyric acid-ediated histone deacetylase inhibition. FASEB J. 2021, 35, e21385. [Google Scholar] [CrossRef] [PubMed]
- Strazzera, G.; Battista, F.; Andreolli, M.; Menini, M.; Bolzonella, D.; Lampis, S. Influence of different household Food Wastes Fractions on Volatile Fatty Acids production by anaerobic fermentation. Bioresour. Technol. 2021, 335, 125289. [Google Scholar] [CrossRef]
- Wishart, D.S.; Feunang, Y.D.; Marcu, A.; Guo, A.C.; Liang, K.; Vázquez-Fresno, R.; Sajed, T.; Johnson, D.; Li, C.; Karu, N.; et al. HMDB 4.0: The human metabolome database for 2018. Nucleic Acids Res. 2018, 46, D608–D617. [Google Scholar] [CrossRef]
- Chong, J.; Soufan, O.; Li, C.; Caraus, I.; Li, S.; Bourque, G.; Wishart, D.S.; Xia, J. MetaboAnalyst 4.0: Towards more transparent and integrative metabolomics analysis. Nucleic Acids Res. 2018, 46, W486–W494. [Google Scholar] [CrossRef] [Green Version]
- Nemet, I.; Saha, P.P.; Gupta, N.; Zhu, W.; Romano, K.A.; Skye, S.M.; Cajka, T.; Mohan, M.L.; Li, L.; Wu, Y.; et al. A Cardiovascular Disease-Linked Gut Microbial Metabolite Acts via Adrenergic Receptors. Cell 2020, 180, 862–877.e22. [Google Scholar] [CrossRef]
- Richards, J.; Diaz, A.N.; Gumz, M.L. Clock genes in hypertension: Novel insights from rodent models. Blood Press. Monit. 2014, 19, 249. [Google Scholar] [CrossRef] [Green Version]
- Zhao, D.; Qi, Y.; Zheng, Z.; Wang, Y.; Zhang, X.-Y.; Li, H.-J.; Liu, H.-H.; Zhang, X.-T.; Du, J.; Liu, J. Dietary factors associated with hypertension. Nat. Rev. Cardiol. 2011, 8, 456–465. [Google Scholar] [CrossRef]
- Marco, M.L.; Heeney, D.; Binda, S.; Cifelli, C.J.; Cotter, P.D.; Foligné, B.; Gänzle, M.; Kort, R.; Pasin, G.; Pihlanto, A.; et al. Health benefits of fermented foods: Microbiota and beyond. Curr. Opin. Biotechnol. 2017, 44, 94–102. [Google Scholar] [CrossRef] [PubMed]
- Aguilar, A. Microbiota under pressure. Nat. Rev. Nephrol. 2017, 13, 3. [Google Scholar] [CrossRef] [PubMed]
- Santisteban, M.M.; Kim, S.; Pepine, C.J.; Raizada, M.K. Brain-Gut-Bone Marrow Axis: Implications for Hypertension and Related Therapeutics. Circ. Res. 2016, 118, 1327–1336. [Google Scholar] [CrossRef] [PubMed]
- Ganesh, B.; Nelson, J.W.; Eskew, J.R.; Ganesan, A.; Ajami, N.J.; Petrosino, J.F.; BryanJr, R.M.; Durgan, D.J. Prebiotics, Probiotics, and Acetate Supplementation Prevent Hypertension in a Model of Obstructive Sleep Apnea. Hypertension 2018, 72, 1141–1150. [Google Scholar] [CrossRef]
- Gomez-Guzman, M.; Toral, M.; Romero, M.; Jimenez, R.; Galindo, P.; Sanchez, M.; Zarzuelo, M.J.; Olivares, M.; Galvez, J.; Duarte, J. Antihypertensive effects of probiotics Lactobacillus strains in spontaneously hypertensive rats. Mol. Nutr. Food Res. 2015, 59, 2326–2336. [Google Scholar] [CrossRef]
- Jakala, P.; Pere, E.; Lehtinen, R.; Turpeinen, A.; Korpela, R.; Vapaatalo, H.J.J.P.P. Cardiovascular activity of milk casein-derived tripeptides and plant sterols in spontaneously hypertensive rats. J. Physiol. Pharmacol. 2009, 60, 11–20. [Google Scholar]
- Beltrán-Barrientos, L.M.; García, H.S.; Hernández-Mendoza, A.; González-Córdova, A.F.; Vallejo-Cordoba, B.J.J.o.D.S. Invited review: Effect of antihypertensive fermented milks on gut microbiota. J. Dairy. Sci. 2021, 104, 3779–3788. [Google Scholar] [CrossRef]
- Kong, C.-Y.; Li, Z.-M.; Mao, Y.-Q.; Chen, H.-L.; Hu, W.; Han, B.; Wang, L.-S. Probiotic yogurt blunts the increase of blood pressure in spontaneously hypertensive rats via remodeling of the gut microbiota. Food Funct. 2021, 12, 9773–9783. [Google Scholar] [CrossRef]
- Chen, L.; Wang, L.; Li, J.; Shu, G. Antihypertensive potential of fermented milk: The contribution of lactic acid bacteria proteolysis system and the resultant angiotensin-converting enzyme inhibitory peptide. Food Funct. 2021, 12, 11121–11131. [Google Scholar] [CrossRef]
- Virdis, A.; Dell’Agnello, U.; Taddei, S.J.M. Impact of inflammation on vascular disease in hypertension. Maturitas 2014, 78, 179–183. [Google Scholar] [CrossRef]
- Miguel-Carrasco, J.L.; Mate, A.; Monserrat, M.T.; Arias, J.L.; Aramburu, O.; Vázquez, C. The role of inflammatory markers in the cardioprotective effect of L-carnitine in L-NAME-induced hypertension. Am. J. Hypertens. 2008, 21, 1231–1237. [Google Scholar] [CrossRef] [PubMed] [Green Version]
- Gonzalez-Gonzalez, C.R.; Tuohy, K.M.; Jauregi, P.J. Production of angiotensin-I-converting enzyme (ACE) inhibitory activity in milk fermented with probiotic strains: Effects of calcium, pH and peptides on the ACE-inhibitory activity. Int. Dairy. J. 2011, 21, 615–622. [Google Scholar] [CrossRef]
- Yang, Z.; Zhang, M.; Jiang, Y.; Cai, M. Characterization and ACE Inhibitory Activity of Fermented Milk with Probiotic Lactobacillus plantarum K25 as Analyzed by GC-MS-Based Metabolomics Approach. J. Microbiol. Biotechnol. 2020, 30, 903–911. [Google Scholar]
- Hao, Y.; Wang, Y.; Xi, L.; Li, G.; Zhao, F.; Qi, Y.; Liu, J.; Zhao, D. A Nested Case-Control Study of Association between Metabolome and Hypertension Risk. BioMed Res. Int. 2016, 2016, 7646979. [Google Scholar] [CrossRef] [PubMed]
- Heikal, L.; Starr, A.; Hussein, D.; Prieto-Lloret, J.; Aaronson, P.; Dailey, L.A.; Nandi, M. l-Phenylalanine Restores Vascular Function in Spontaneously Hypertensive Rats Through Activation of the GCH1-GFRP Complex. JACC Basic Transl. Sci. 2018, 3, 366–377. [Google Scholar] [CrossRef] [PubMed]
- Wang, Z.; Cheng, C.; Yang, X.; Zhang, C. L-phenylalanine attenuates high salt-induced hypertension in Dahl SS rats through activation of GCH1-BH4. PLoS ONE 2021, 16, e0250126. [Google Scholar] [CrossRef] [PubMed]
- Zhen-Lin, L.; Ben-Hua, Z.; Wei, W.; Gui-Hua, L.; Fei, W.; Li, W.; Qing-Ping, Z.; Hong, W. Xiang. Impact of the Consumption of Tea Polyphenols on Early Atherosclerotic Lesion Formation and Intestinal Bifidobacteria in High-Fat-Fed ApoE/Mice. Front. Nutr. 2016, 3, 42. [Google Scholar]
- Wang, J.; Gareri, C.; Rockman, H.A. G-Protein–Coupled Receptors in Heart Disease. Circ. Res. 2018, 123, 716–735. [Google Scholar] [CrossRef]
- Robin, S.; Maupoil, V.; Laurant, P.; Jacqueson, A.; Berthelot, A. Effect of a methionine-supplemented diet on the blood pressure of Sprague–Dawley and deoxycorticosterone acetate–salt hypertensive rats. Br. J. Nutr. 2004, 91, 857–865. [Google Scholar] [CrossRef]
- Robin, S.; Maupoil, V.; Groubatch, F.; Laurant, P.; Jacqueson, A.; Berthelot, A. Effect of a methionine-supplemented diet on the blood pressure of Wistar–Kyoto and spontaneously hypertensive rats. Br. J. Nutr. 2003, 89, 539–548. [Google Scholar] [CrossRef]
- Zhou, Y.; Zhao, L.; Zhang, Z.; Lu, X. Protective Effect of Enalapril against Methionine-Enriched Diet-Induced Hypertension: Role of Endoplasmic Reticulum and Oxidative Stress. BioMed Res. Int. 2015, 2015, 724876. [Google Scholar] [CrossRef] [PubMed] [Green Version]
- Mirmiran, P.; Teymoori, F.; Asghari, G.; Azizi, F. Dietary Intakes of Branched Chain Amino Acids and the Incidence of Hypertension: A Population-Based Prospective Cohort Study. Arch. Iran. Med. 2019, 22, 182–188. [Google Scholar] [PubMed]
- Wang, X.-J.; Gao, X.; Zhang, A.-H.; Wu, F.-F.; Yan, G.-L.; Sun, H. High-throughput metabolomics for evaluating the efficacy and discovering the metabolic mechanism of Luozhen capsules from the excessive liver-fire syndrome of hypertension. RSC Adv. 2019, 9, 32141–32153. [Google Scholar] [CrossRef] [PubMed] [Green Version]
- Fu, Z.D.; Cui, J.Y. Remote Sensing Between Liver and Intestine: Importance of Microbial Metabolites. Curr. Pharmacol. Rep. 2017, 3, 101–113. [Google Scholar] [CrossRef]
- Hilfenhaus, M. Circadian rhythm of the renin-angiotensin-aldosterone system in the rat. Arch. Toxicol. 1976, 36, 305–316. [Google Scholar] [CrossRef] [PubMed]
- Douma, L.G.; Holzworth, M.R.; Solocinski, K.; Masten, S.H.; Miller, A.H.; Cheng, K.-Y.; Lynch, I.J.; Cain, B.D.; Wingo, C.S.; Gumz, M.L. Renal Na-handling defect associated with PER1-dependent nondipping hypertension in male mice. Am. J. Physiol. Physiol. 2018, 314, F1138–F1144. [Google Scholar] [CrossRef]
- Tanaka, S.; Ueno, T.; Tsunemi, A.; Nagura, C.; Tahira, K.; Fukuda, N.; Soma, M.; Abe, M. The adrenal gland circadian clock exhibits a distinct phase advance in spontaneously hypertensive rats. Hypertens. Res. 2018, 42, 165–173. [Google Scholar] [CrossRef]
- Feng, D.-D.; Zheng, B.; Yu, J.; Zhang, M.-L.; Ma, Y.; Hao, X.; Wen, J.-K.; Zhang, X.-H. 17β-Estradiol Inhibits Proliferation and Oxidative Stress in Vascular Smooth Muscle Cells by Upregulating BHLHE40 Expression. Front. Cardiovasc. Med. 2021, 8, 1724. [Google Scholar] [CrossRef]


| Reagent | a | b | c | d |
|---|---|---|---|---|
| ACE | 10 μL | - | 10 μL | - |
| Milk serum sample | 10 μL | 10 μL | - | - |
| Tris-HCl | - | 10 μL | 10 μL | 20 μL |
| FAPGG | 150 μL | 150 μL | 150 μL | 150 μL |
Publisher’s Note: MDPI stays neutral with regard to jurisdictional claims in published maps and institutional affiliations. |
© 2022 by the authors. Licensee MDPI, Basel, Switzerland. This article is an open access article distributed under the terms and conditions of the Creative Commons Attribution (CC BY) license (https://creativecommons.org/licenses/by/4.0/).
Share and Cite
Yuan, L.; Li, Y.; Chen, M.; Xue, L.; Wang, J.; Ding, Y.; Zhang, J.; Wu, S.; Ye, Q.; Zhang, S.; et al. Antihypertensive Activity of Milk Fermented by Lactiplantibacillus plantarum SR37-3 and SR61-2 in L-NAME-Induced Hypertensive Rats. Foods 2022, 11, 2332. https://doi.org/10.3390/foods11152332
Yuan L, Li Y, Chen M, Xue L, Wang J, Ding Y, Zhang J, Wu S, Ye Q, Zhang S, et al. Antihypertensive Activity of Milk Fermented by Lactiplantibacillus plantarum SR37-3 and SR61-2 in L-NAME-Induced Hypertensive Rats. Foods. 2022; 11(15):2332. https://doi.org/10.3390/foods11152332
Chicago/Turabian StyleYuan, Lin, Ying Li, Moutong Chen, Liang Xue, Juan Wang, Yu Ding, Jumei Zhang, Shi Wu, Qinghua Ye, Shuhong Zhang, and et al. 2022. "Antihypertensive Activity of Milk Fermented by Lactiplantibacillus plantarum SR37-3 and SR61-2 in L-NAME-Induced Hypertensive Rats" Foods 11, no. 15: 2332. https://doi.org/10.3390/foods11152332
APA StyleYuan, L., Li, Y., Chen, M., Xue, L., Wang, J., Ding, Y., Zhang, J., Wu, S., Ye, Q., Zhang, S., Yang, R., Zhao, H., Wu, L., Liang, T., Xie, X., & Wu, Q. (2022). Antihypertensive Activity of Milk Fermented by Lactiplantibacillus plantarum SR37-3 and SR61-2 in L-NAME-Induced Hypertensive Rats. Foods, 11(15), 2332. https://doi.org/10.3390/foods11152332