
Fabrication of Dragee Containing Spirulina platensis Microalgae to Enrich Corn Snack and Evaluate Its Sensorial, Physicochemical and Nutritional Properties


 ,
,
Abstract
:
1. Introduction
2. Materials and Methods
2.1. Materials
2.2. Coating
2.3. Optimization of Dragee Formulation
2.4. Optimal Sample Experiments
2.4.1. Radical Scavenging Activity (RSA)
2.4.2. Total Phenolic Content (TPC)
2.4.3. Basic Chemical Composition
2.4.4. Amino Acid Analysis
2.4.5. Fatty Acids Composition Analysis
2.4.6. Vitamins Assay
2.4.7. Minerals Content
2.4.8. Scanning Electron Microscopy (SEM)
2.4.9. Color Evaluation
2.5. Optimal Mixture Design
2.5.1. Statistical Model Match
2.5.2. Preparation of Dragee and Experimental Design
2.5.3. Statistical Analyses
3. Results
3.1. Experimental Results
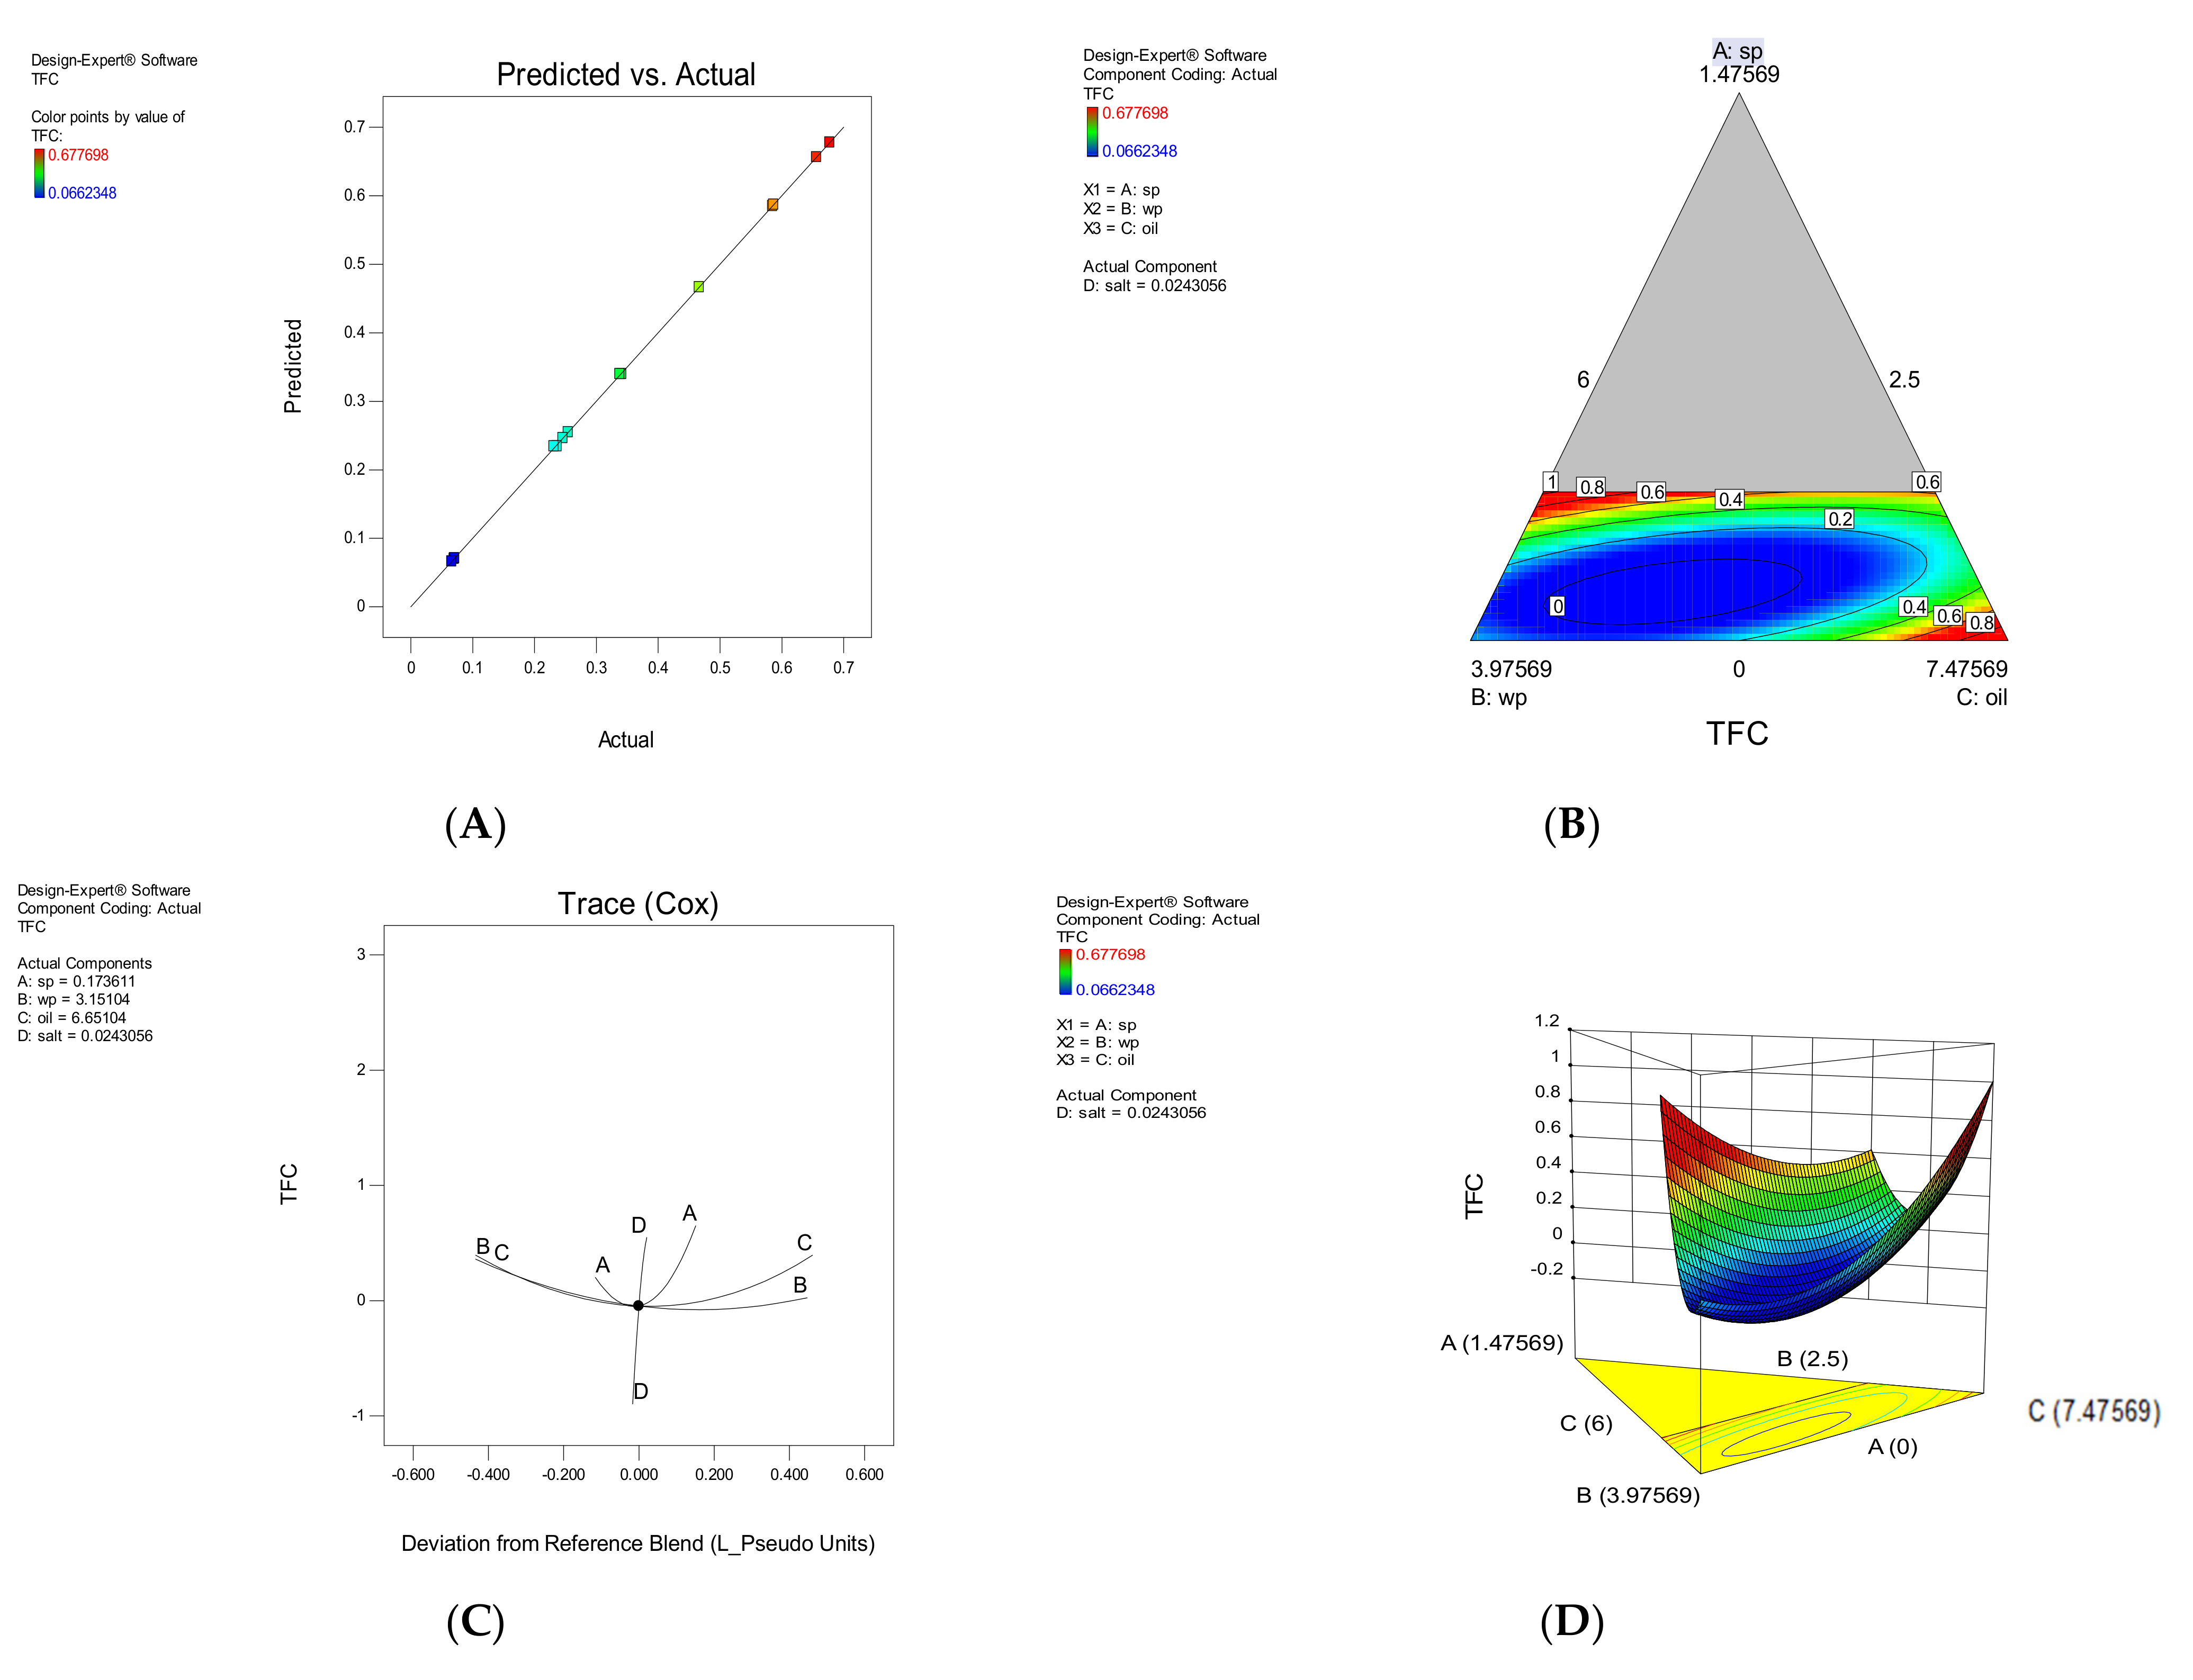
3.1.1. TFC
3.1.2. TAC
3.1.3. Sensory Evaluation
3.1.4. Hardness
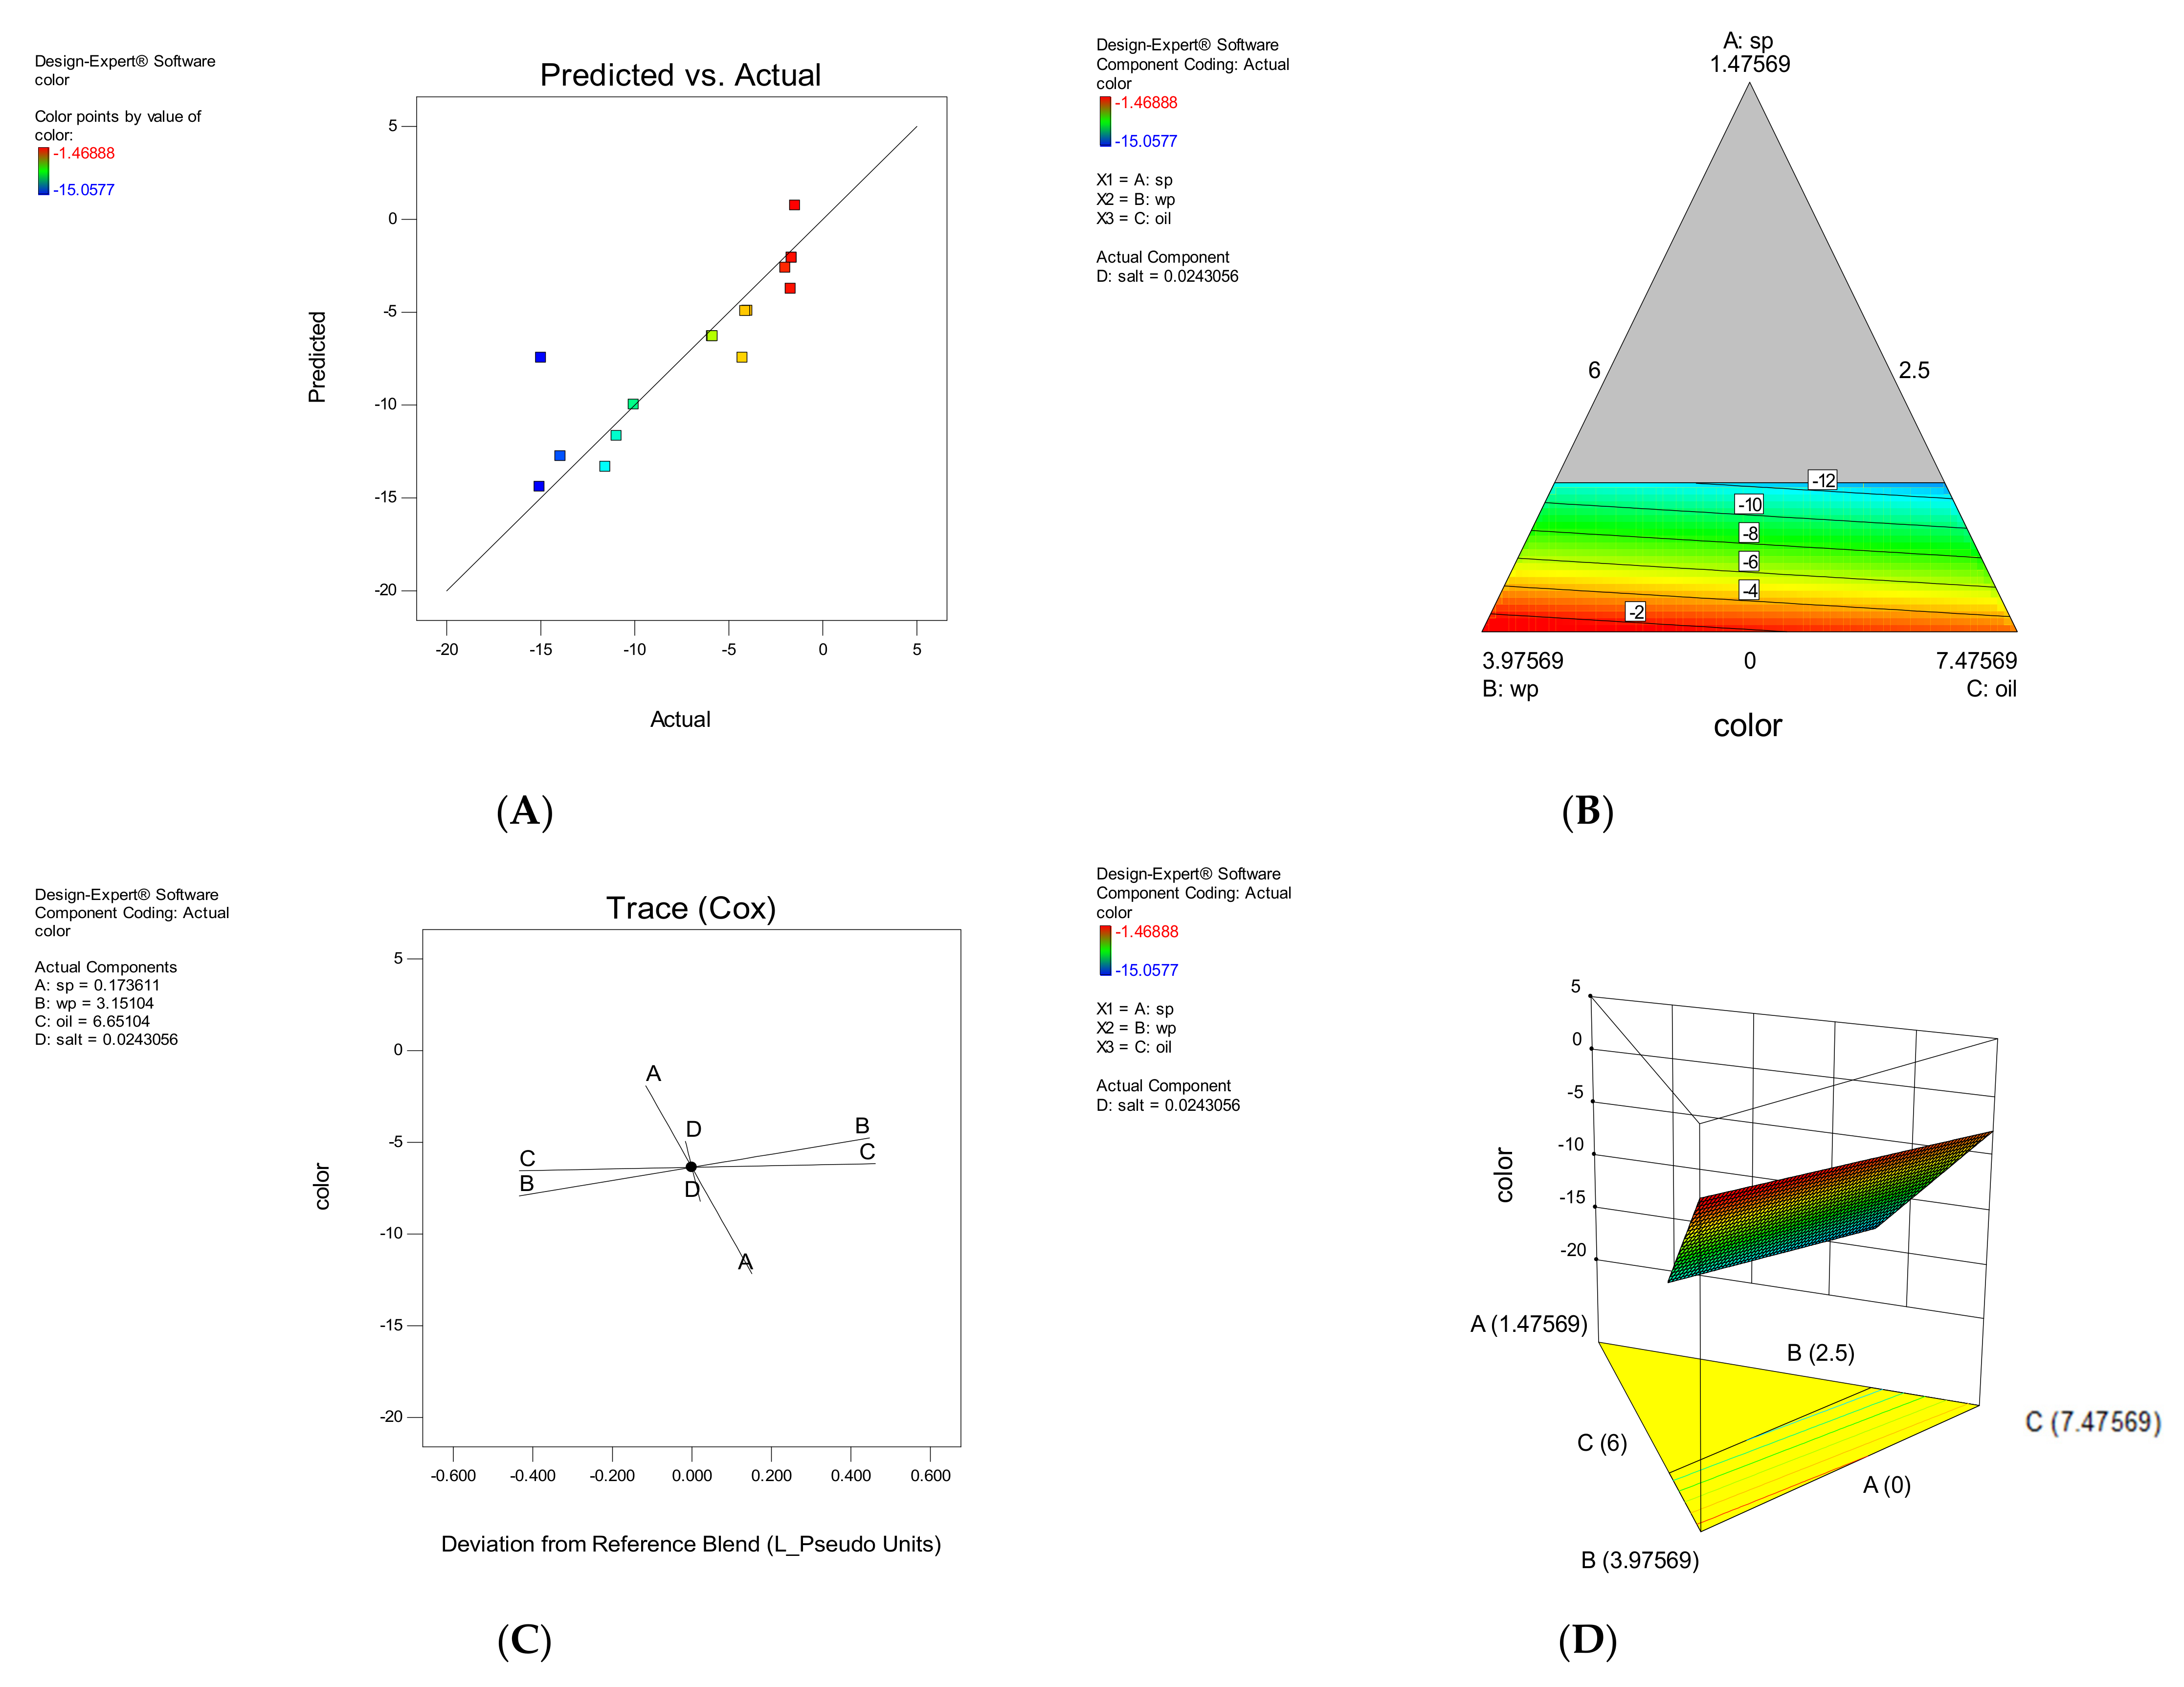
3.1.5. Color
3.2. Model Validation
3.3. Optimal Sample Analysis
3.3.1. Chemical and Antioxidant Compounds
3.3.2. Physical Tests
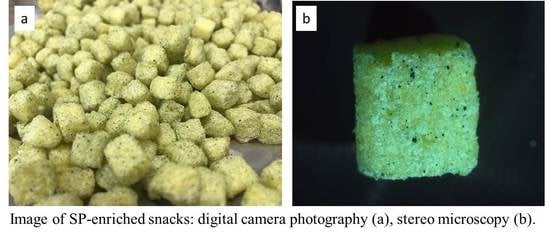
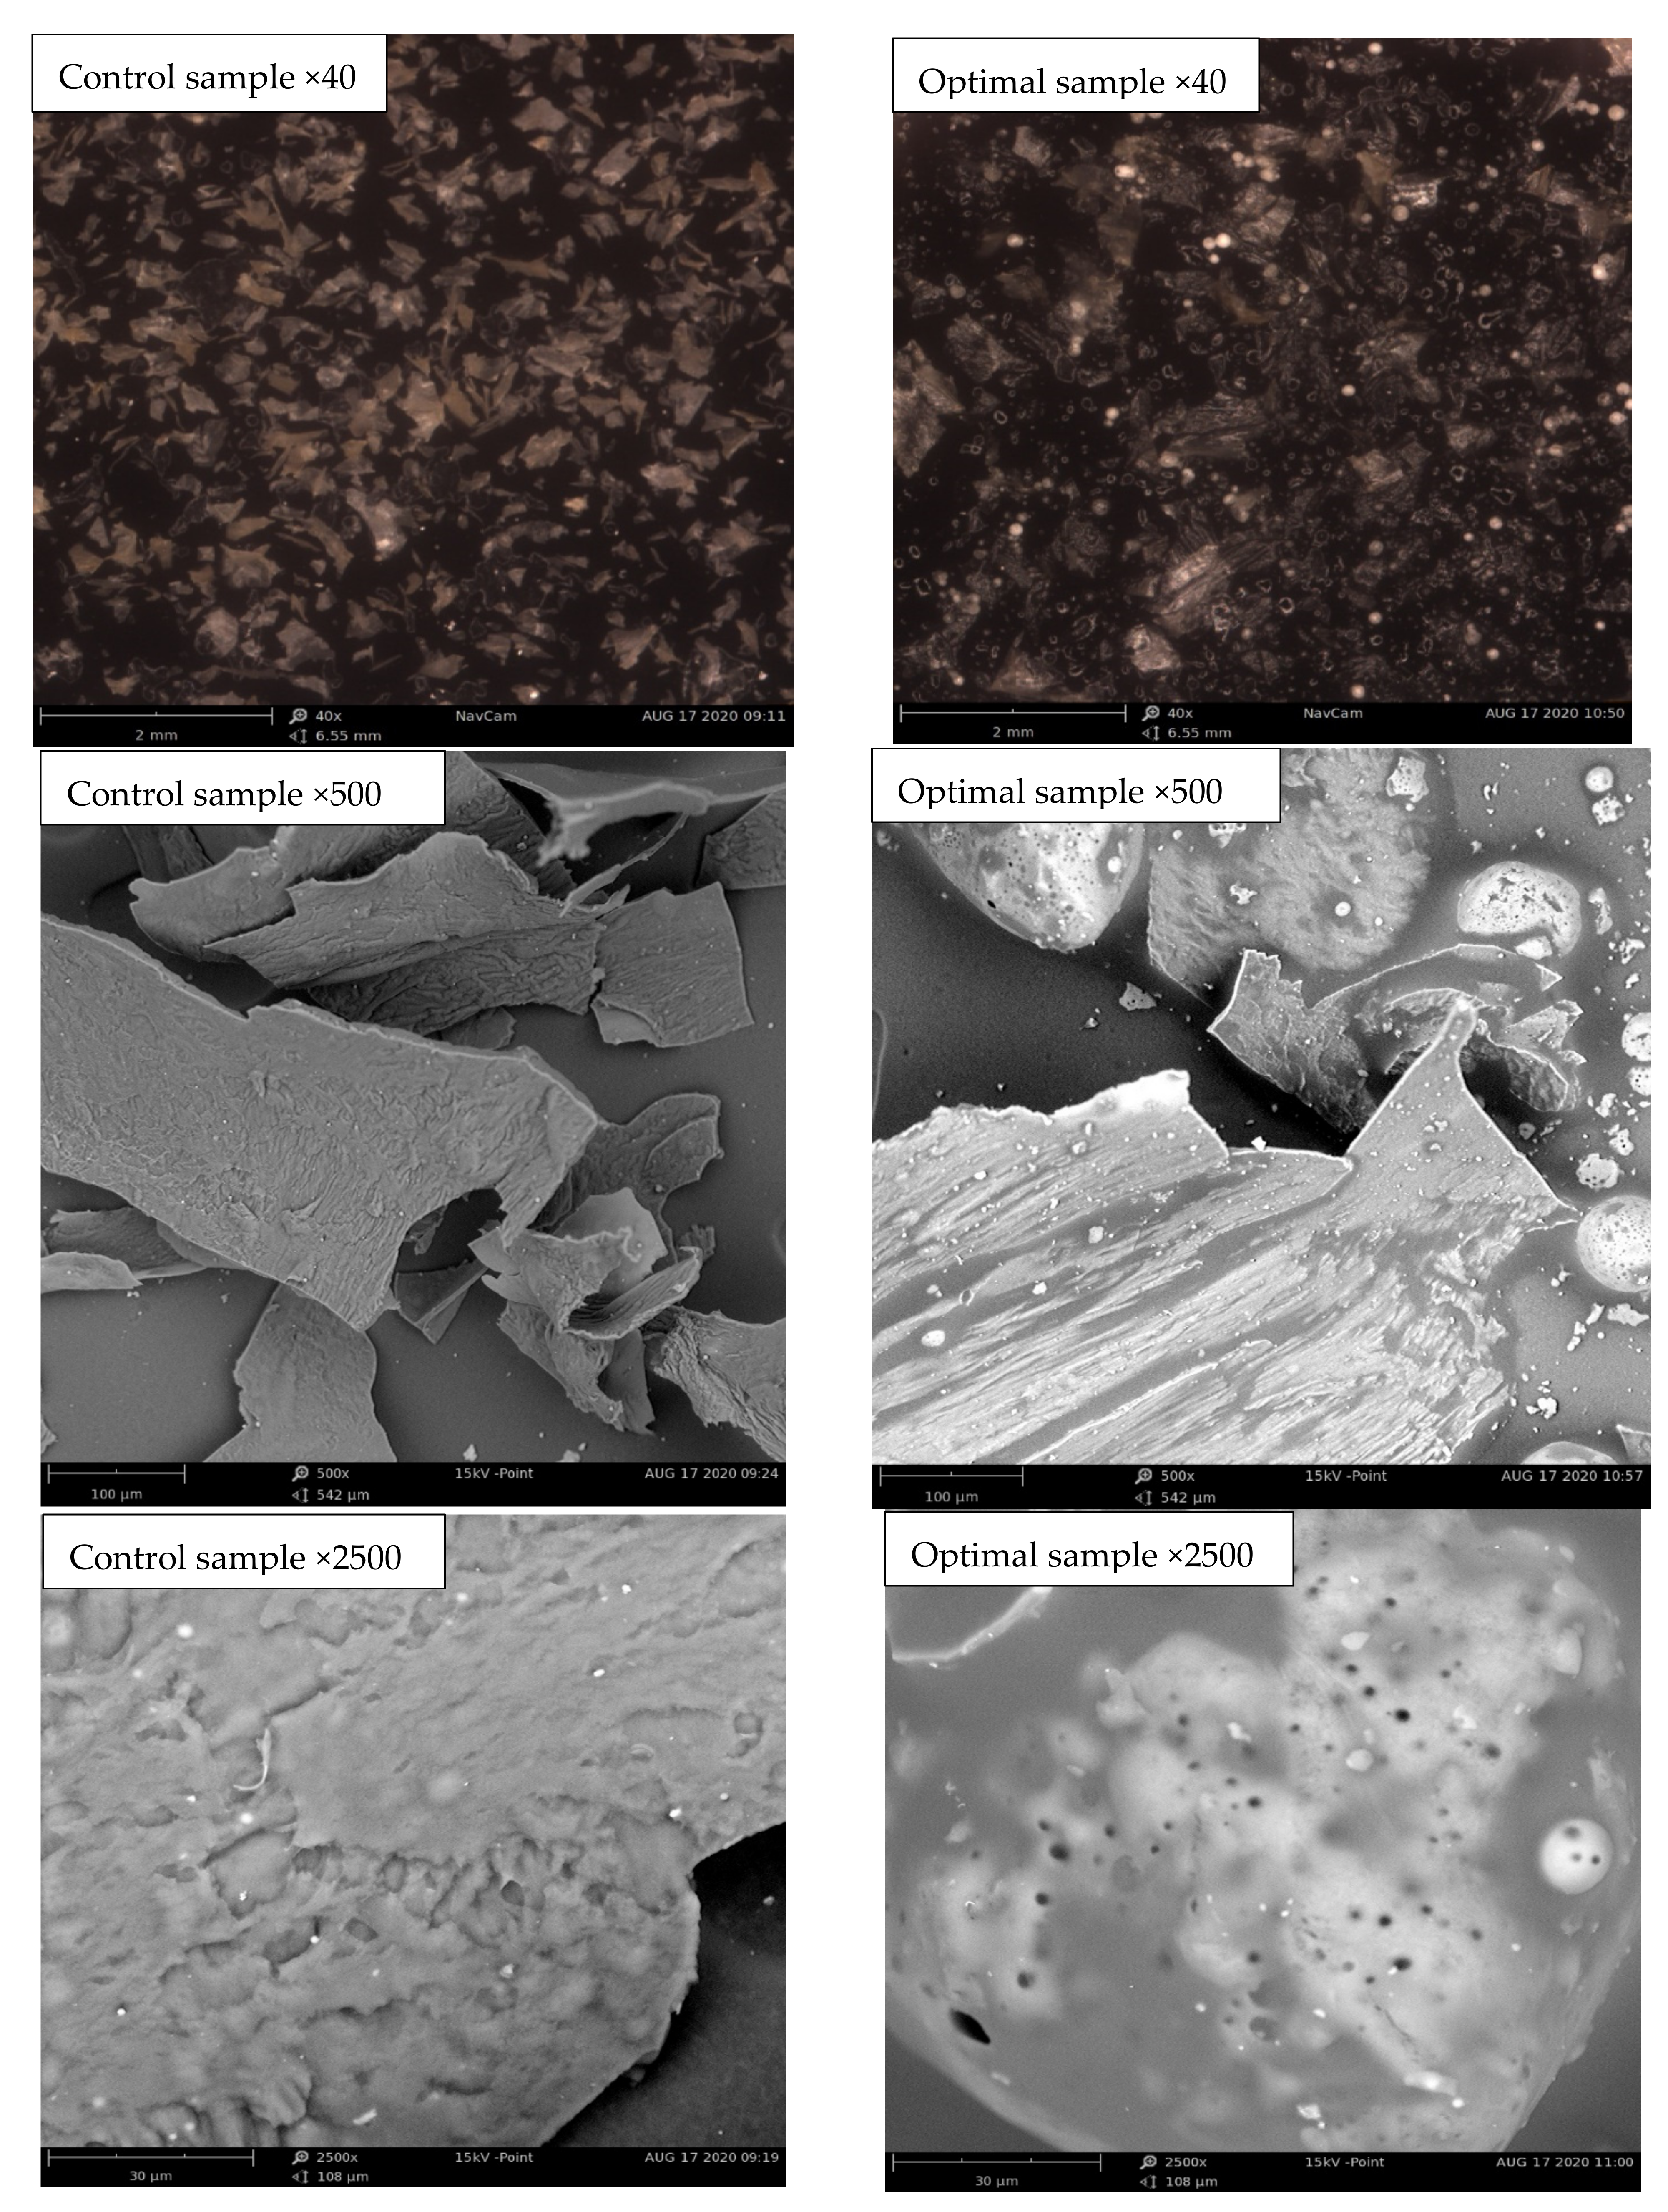
Microstructure
Color Parameters
Hardness
3.3.3. Sensory Evaluation
4. Discussion
5. Conclusions
Supplementary Materials
Author Contributions
Funding
Institutional Review Board Statement
Informed Consent Statement
Data Availability Statement
Conflicts of Interest
References
- Simpore, J.; Kabore, F.; Zongo, F.; Dansou, D.; Bere, A.; Pignatelli, S.; Biondi, D.M.; Ruberto, G.; Musumeci, S. Nutrition rehabilitation of undernourished children utilizing Spiruline and Misola. Nutr. J. 2006, 5, 1–7. [Google Scholar] [CrossRef] [PubMed] [Green Version]
- Lazou, A.; Krokida, M. Structural and textural characterization of corn–lentil extruded snacks. J. Food Eng. 2010, 100, 392–408. [Google Scholar] [CrossRef]
- Pastor-Cavada, E.; Drago, S.R.; González, R.J.; Juan, R.; Pastor, J.E.; Alaiz, M.; Vioque, J. Physical and nutritional properties of extruded products based on whole grain with the addition of wild legumes (V icia lutea subsp. lutea var. hirta and V icia sativa subsp. sativa). Int. J. Food Sci. Technol. 2013, 48, 1949–1955. [Google Scholar] [CrossRef]
- Neuhouser, M.L.; Patterson, R.E.; Kristal, A.R.; Rock, C.L. Do consumers of savory snacks have poor-quality diets? J. Am. Diet. Assoc. 2000, 100, 576–579. [Google Scholar] [CrossRef]
- Da Silva, P.C.; Toledo, T.; Brião, V.; Bertolin, T.E.; Costa, J.A.V. Development of extruded snacks enriched by bioactive peptides from microalga Spirulina sp. LEB 18. Food Biosci. 2021, 42, 101031. [Google Scholar] [CrossRef]
- Jeyakumari, A.; Rahul Das, M.S.; Bindu, J.; Joshy, C.G.; Zynudheen, A.A. Optimisation and comparative study on the addition of shrimp protein hydrolysate and shrimp powder on physicochemical properties of extruded snack. Int. J. Food Sci. Technol. 2016, 51, 1578–1585. [Google Scholar] [CrossRef]
- Segura-Campos, M.R.; García-Rodríguez, K.; Ruiz-Ruiz, J.C.; Chel-Guerrero, L.; Betancur-Ancona, D. In vitro bioactivity, nutritional and sensory properties of semolina pasta added with hard-to-cook bean (Phaseolus vulgaris L.) protein hydrolysate. J. Funct. Foods 2014, 8, 1–8. [Google Scholar] [CrossRef]
- Korus, J.; Gumul, D.; Czechowska, K. Effect of extrusion on the phenolic composition and antioxidant activity of dry beans of Phaseolus vulgaris L. Food Technol. Biotechnol. 2007, 45, 139–146. [Google Scholar]
- Wani, S.A.; Kumar, P. Effect of extrusion on the nutritional, antioxidant and microstructural characteristics of nutritionally enriched snacks. J. Food Process. Preserv. 2016, 40, 166–173. [Google Scholar] [CrossRef]
- Belay, A. New scientific developments in the health benefits of Spirulina (Arthrospira): Phycocyanin and its potential health benefits. Nutr. Sci. 2004, 7, 165–173. [Google Scholar]
- Gershwin, M.E.; Belay, A. Spirulina in Human Nutrition and Health; CRC Press: Boca Raton, FL, USA, 2007. [Google Scholar]
- Lee, Y.-K. Commercial production of microalgae in the Asia-Pacific rim. J. Appl. Phycol. 1997, 9, 403–411. [Google Scholar] [CrossRef]
- Karkos, P.D.; Leong, S.C.; Karkos, C.D.; Sivaji, N.; Assimakopoulos, D.A. Spirulina in clinical practice: Evidence-based human applications. Evid. Based Complement. Altern. 2008, 2011, 27. [Google Scholar]
- Spolaore, P.; Joannis-Cassan, C.; Duran, E.; Isambert, A. Commercial applications of microalgae. J. Biosci. Bioeng. 2006, 101, 87–96. [Google Scholar]
- Morsy, O.M.; Sharoba, A.M.; El-Desouky, A.I.; Bahlol, H.E.M.; Abd El Mawla, E.M. Production and evaluation of some extruded food products using spirulina algae. Ann. Agric. Sci. Moshtohor 2014, 52, 329–342. [Google Scholar]
- Ahsan, M.; Habib, B.; Parvin, M.; Huntington, T.C.; Hasan, M.R. A Review on Culture, Production and Use of Spirulina as Food for Humans and Feeds for Domestic Animals; FAO: Rome, Italy, 2008. [Google Scholar]
- Sharoba, A.M. Nutritional value of spirulina and its use in the preparation of some complementary baby food formulas. J. Food Dairy Sci. 2014, 5, 517–538. [Google Scholar] [CrossRef]
- Hirahashi, T.; Matsumoto, M.; Hazeki, K.; Saeki, Y.; Ui, M.; Seya, T. Activation of the human innate immune system by Spirulina: Augmentation of interferon production and NK cytotoxicity by oral administration of hot water extract of Spirulina platensis. Int. Immunopharmacol. 2002, 2, 423–434. [Google Scholar] [CrossRef]
- Santos, T.D.; De Freitas, B.C.B.; Moreira, J.B.; Zanfonato, K.; Costa, J.A.V. Development of powdered food with the addition of Spirulina for food supplementation of the elderly population. Innov. Food Sci. Emerg. Technol. 2016, 37, 216–220. [Google Scholar] [CrossRef]
- De Marco, E.R.; Steffolani, M.E.; Martínez, C.S.; León, A.E. Effects of spirulina biomass on the technological and nutritional quality of bread wheat pasta. LWT-Food Sci. Technol. 2014, 58, 102–108. [Google Scholar]
- Lucas, B.F.; de Morais, M.G.; Santos, T.D.; Costa, J.A.V. Spirulina for snack enrichment: Nutritional, physical and sensory evaluations. LWT 2018, 90, 270–276. [Google Scholar] [CrossRef]
- Lucas, B.F.; Rosa, A.P.C.D.; Carvalho, L.F.D.; Morais, M.G.D.; Santos, T.D.; COSTA, J.A.V. Snack bars enriched with Spirulina for schoolchildren nutrition. Food Sci. Technol. 2019, 40, 146–152. [Google Scholar] [CrossRef] [Green Version]
- Tristantini, D.; Amalia, R. Quercetin concentration and total flavonoid content of anti-atherosclerotic herbs using aluminum chloride colorimetric assay. AIP Conf. Proc. 2019, 2193, 30012. [Google Scholar]
- Muanda, F.N.; Soulimani, R.; Diop, B.; Dicko, A. Study on chemical composition and biological activities of essential oil and extracts from Stevia rebaudiana Bertoni leaves. LWT-Food Sci. Technol. 2011, 44, 1865–1872. [Google Scholar] [CrossRef]
- Gabr, G.A.; El-Sayed, S.M.; Hikal, M.S. Antioxidant activities of phycocyanin: A bioactive compound from Spirulina platensis. J. Pharm. Res. Int. 2020, 32, 73–85. [Google Scholar] [CrossRef]
- Ismaiel, M.M.S.; El-Ayouty, Y.M.; Piercey-Normore, M. Role of pH on antioxidants production by Spirulina (Arthrospira) platensis. Braz. J. Microbiol. 2016, 47, 298–304. [Google Scholar] [CrossRef] [Green Version]
- AOAC. Official Methods of Analysis. In Association of Official Analytical Chemists International, 17th ed.; AOAC Press: Rockville, MD, USA, 2000. [Google Scholar]
- Volkmann, H.; Imianovsky, U.; Oliveira, J.L.B.; Sant’Anna, E.S. Cultivation of Arthrospira (Spirulina) platensis in desalinator wastewater and salinated synthetic medium: Protein content and amino-acid profile. Braz. J. Microbiol. 2008, 39, 98–101. [Google Scholar] [CrossRef] [Green Version]
- Ötleş, S.; Pire, R. Fatty acid composition of Chlorella and Spirulina microalgae species. J. AOAC Int. 2001, 84, 1708–1714. [Google Scholar] [CrossRef] [Green Version]
- Rezagholi, F.; Hesarinejad, M.A. Integration of fuzzy logic and computer vision in intelligent quality control of celiac-friendly products. Procedia Comput. Sci. 2017, 120, 325–332. [Google Scholar] [CrossRef]
- Şahin, O.I. Functional and sensorial properties of cookies enriched with SPIRULINA and DUNALIELLA biomass. J. Food Sci. Technol. 2020, 57, 3639–3646. [Google Scholar] [CrossRef]
- Olusanya, R.N.; Kolanisi, U.; Van Onselen, A.; Ngobese, N.Z.; Siwela, M. Nutritional composition and consumer acceptability of Moringa oleifera leaf powder (MOLP)-supplemented mahewu. S. Afr. J. Bot. 2020, 129, 175–180. [Google Scholar] [CrossRef]
- Kim, Y.S.; Kwon, H.K.; Kim, B.I. Effect of nano-carbonate apatite to prevent re-stain after dental bleaching in vitro. J. Dent. 2011, 39, 636–642. [Google Scholar] [CrossRef]
- Narmadha, T.; Sivakami, V.; Ravikumar, M.; Mukeshkumar, D. Effect of Spirulina on lipid profile of hyperlipidemics. World J. Sci. Technol. 2012, 2, 19–22. [Google Scholar]
- Pao, T.K.; Van de Water, J.; Gershwin, M.E. Effects of a Spirulina-based dietary supplement on Cytokine production from Allergic Rhinitis patients. J. Med. Food 2005, 8, 27–30. [Google Scholar]
- Branger, B.; Cadudal, J.L.; Delobel, M.; Ouoba, H.; Yameogo, P.; Ouedraogo, D.; Guerin, D.; Valea, A.; Zombre, C.; Ancel, P. Spiruline as a food supplement in case of infant malnutrition in Burkina-Faso. Arch. Pediatr. Organe Off. La Soc. Fr. Pediatrie 2003, 10, 424–431. [Google Scholar] [CrossRef]
- Mendiola, J.A.; García-Martínez, D.; Rupérez, F.J.; Martín-Álvarez, P.J.; Reglero, G.; Cifuentes, A.; Barbas, C.; Ibañez, E.; Señoráns, F.J. Enrichment of vitamin E from Spirulina platensis microalga by SFE. J. Supercrit. Fluids 2008, 43, 484–489. [Google Scholar] [CrossRef]


| Run | SP Powder | SWP | Sunflower Oil | Salt |
|---|---|---|---|---|
| 1 | 0.00 | 3.23 | 6.73 | 0.02 |
| 2 | 0.13 | 2.98 | 6.82 | 0.05 |
| 3 | 0.13 | 2.50 | 7.36 | 0.00 |
| 4 | 0.40 | 2.50 | 7.08 | 0.01 |
| 5 | 0.13 | 2.98 | 6.82 | 0.05 |
| 6 | 0.40 | 2.84 | 6.69 | 0.05 |
| 7 | 0.10 | 3.54 | 6.31 | 0.04 |
| 8 | 0.20 | 3.77 | 6.00 | 0.02 |
| 9 | 0.00 | 4.00 | 6.00 | 0.00 |
| 10 | 0.40 | 3.60 | 6.00 | 0.00 |
| 11 | 0.00 | 3.94 | 6.0 | 0.05 |
| 12 | 0.40 | 3.21 | 6.36 | 0.01 |
| 13 | 0.40 | 3.54 | 6.00 | 0.05 |
| 14 | 0.00 | 3.23 | 6.73 | 0.02 |
| 15 | 0.00 | 2.5 | 7.46 | 0.03 |
| 16 | 0.20 | 3.77 | 6.00 | 0.02 |
| Responses | TFC | TAC | IA | COLOR | TX |
|---|---|---|---|---|---|
| predictive value | 0.69 ± 0.03 | 0.64 ± 0.10 | 298.18 ± 0.25 | −10.00 ± 0.04 | 255.41 ± 0.01 |
| experimental value a | 0.70 ± 0.06 | 0.68 ± 0.12 | 294.39 ± 0.20 | −10.10 ± 0.07 | 258.97 ± 0.09 |
| %Error b | 1.5827 | 6.5855 | −1.2693 | 1.1185 | 1.3942 |
| Model | F-Value | Model p-Value | LOF | LOF p-Value | R2 | Adj R2 | Predicted Equation | |
|---|---|---|---|---|---|---|---|---|
| TFC | Special Qubic | 9977.74 | <0.0001 | 2.68 | 0.191 | 0.999 | 0.998 | +58.32A + 0.070B + 2.68C − 279.41D − 76.33AB − 90.97AC − 2086.90AD − 1.60BC + 290.22BD + 181.96CD + 0.58ABC + 3292.87ABD + 3863.39ACD + 0.000BCD |
| TAC | Special Qubic | 6627.50 | <0.0001 | 2.97 | 0.171 | 0.999 | 0.998 | +45.22A + 0.047B + 1.96C − 191.24D − 58.62AB − 68.97AC − 1721.23AD − 1.19BC + 198.07BD + 118.29CD + 0.20ABC + 2633.40ABD + 3046.51ACD + 0.000BCD |
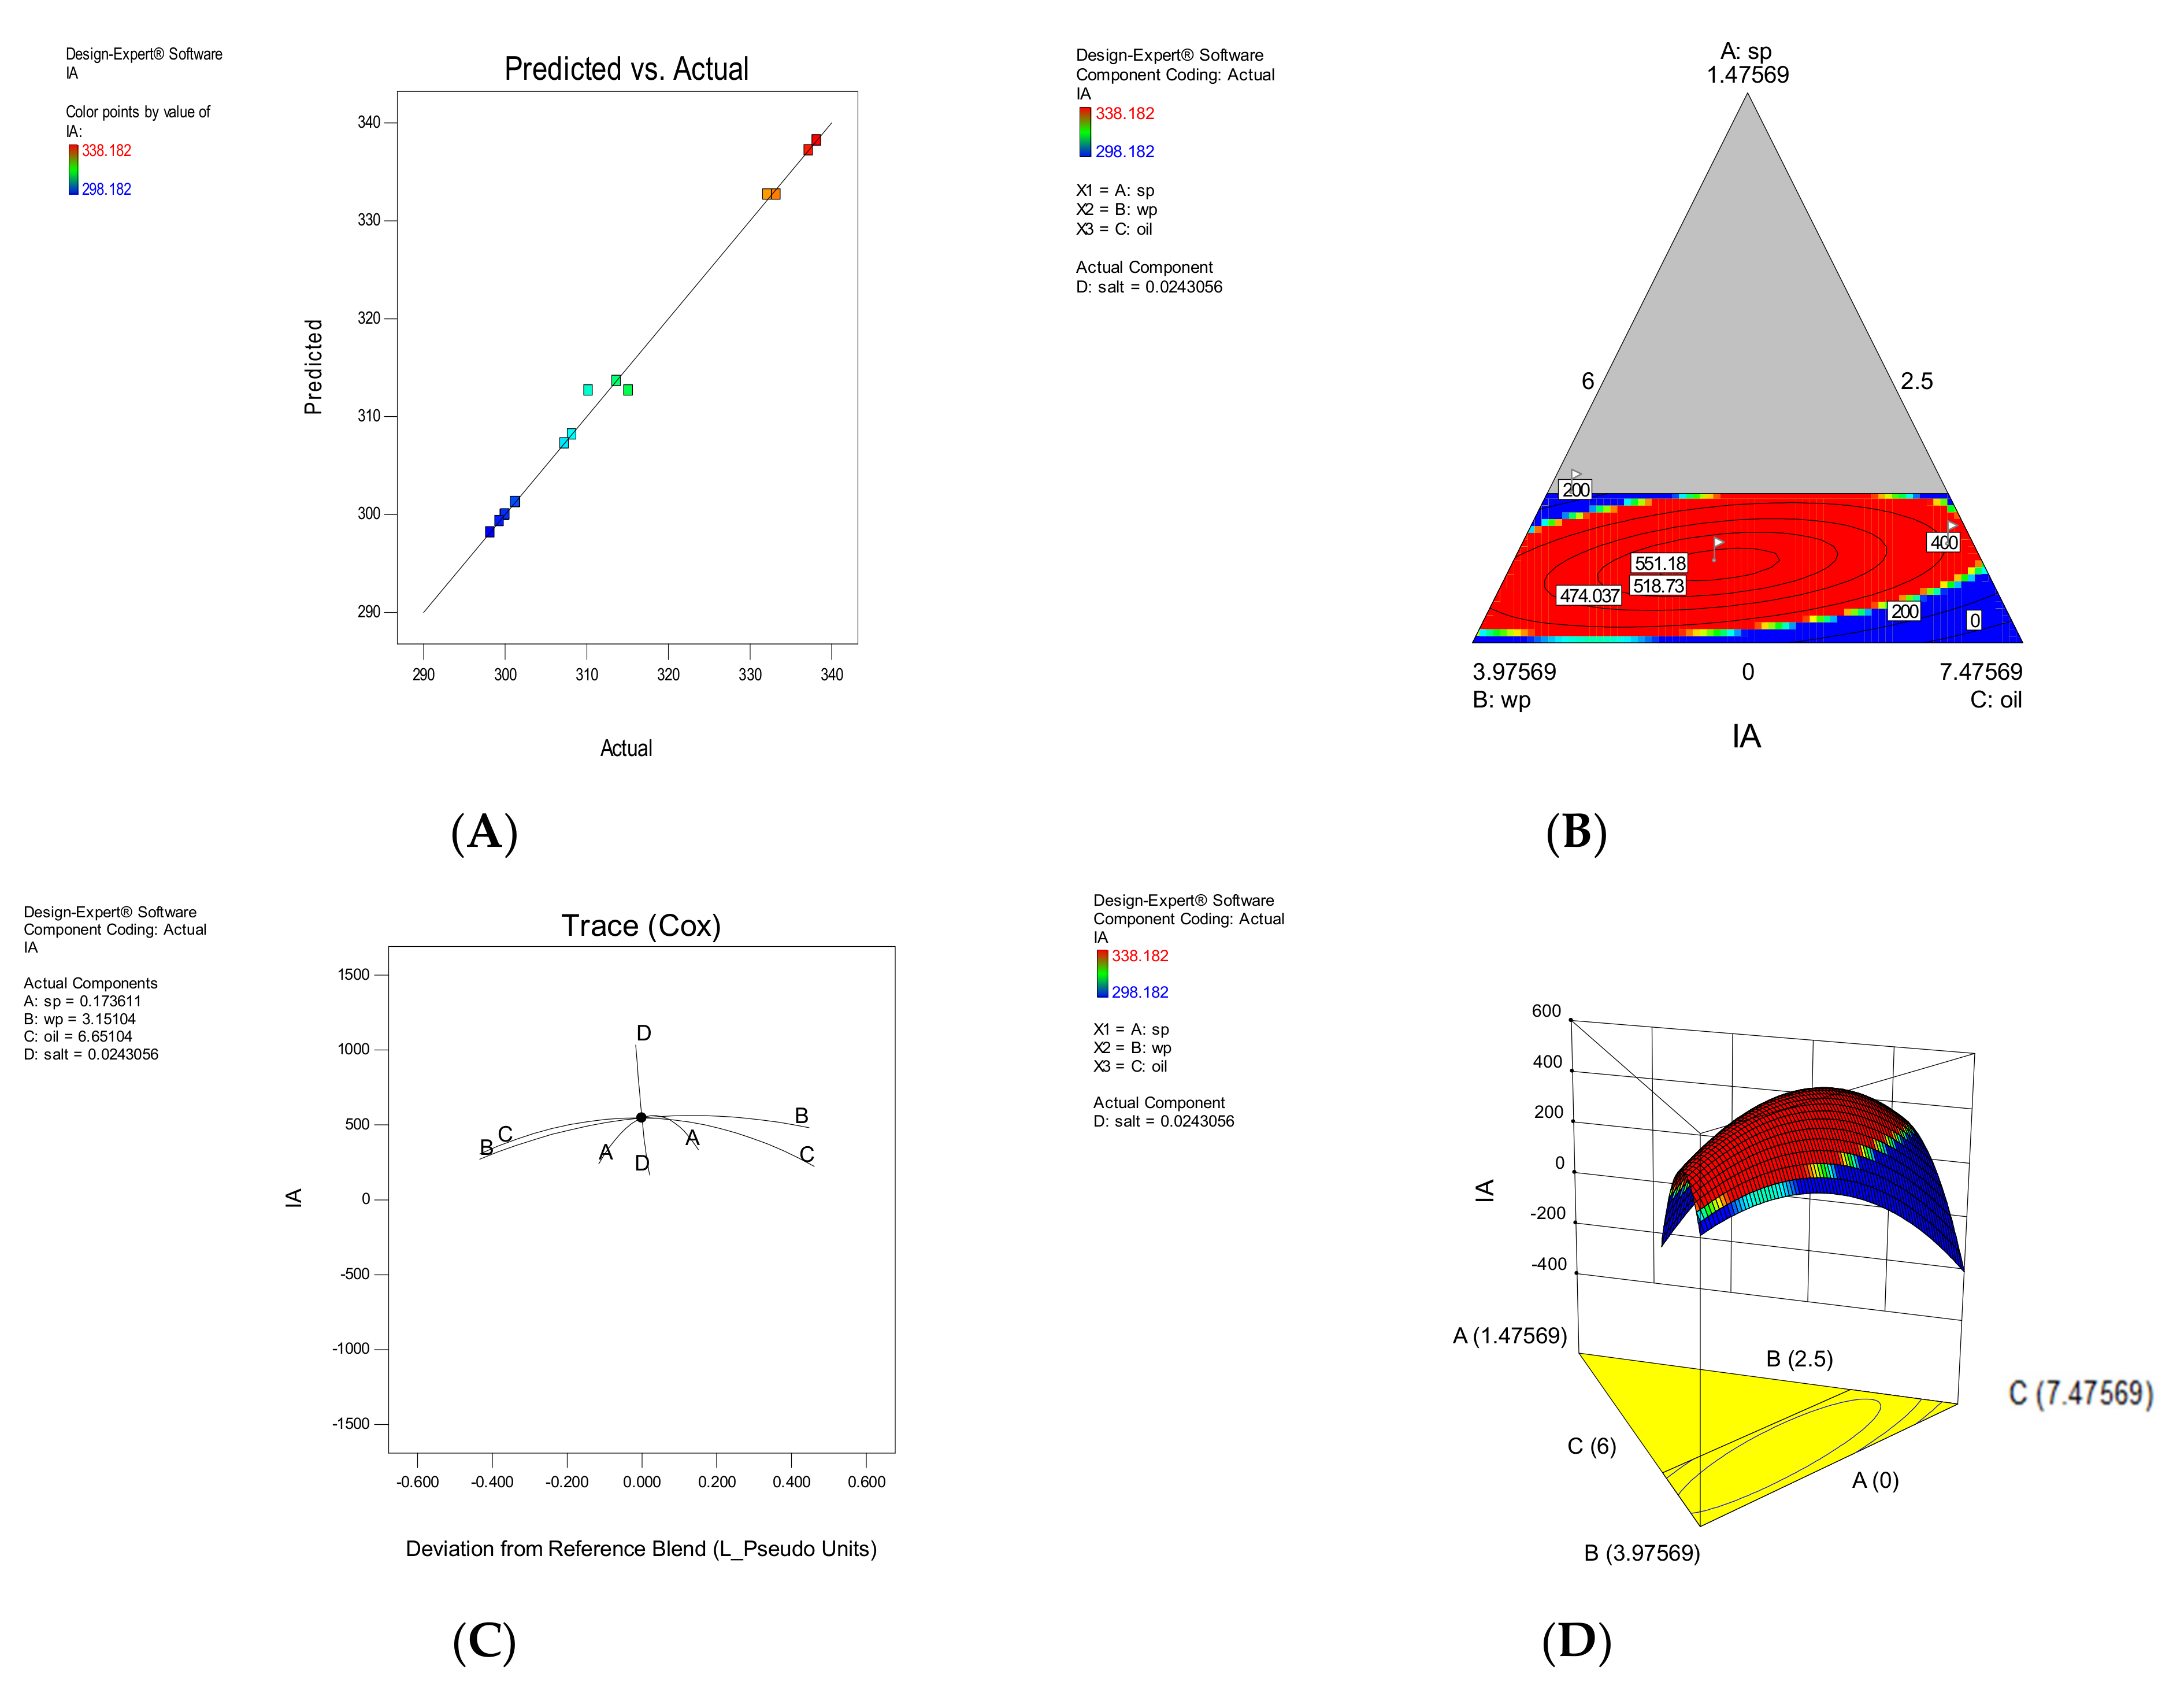
| IA | Quadratic | 55.41 | <0.0001 | 2.85 | 0.138 | 0.982 | 0.978 | +362.00A + 311.90B + 276.37C − 52272.41D − 82.73AB + 146.49AC + 54852.71AD − 17.59BC + 54,472.74BD + 54,894.86CD |
| C | Linear | 22.68 | <0.0001 | 1.85 | 0.987 | 0.985 | 0.981 | −39.46A + 0.75B − 1.56C − 89.12D |
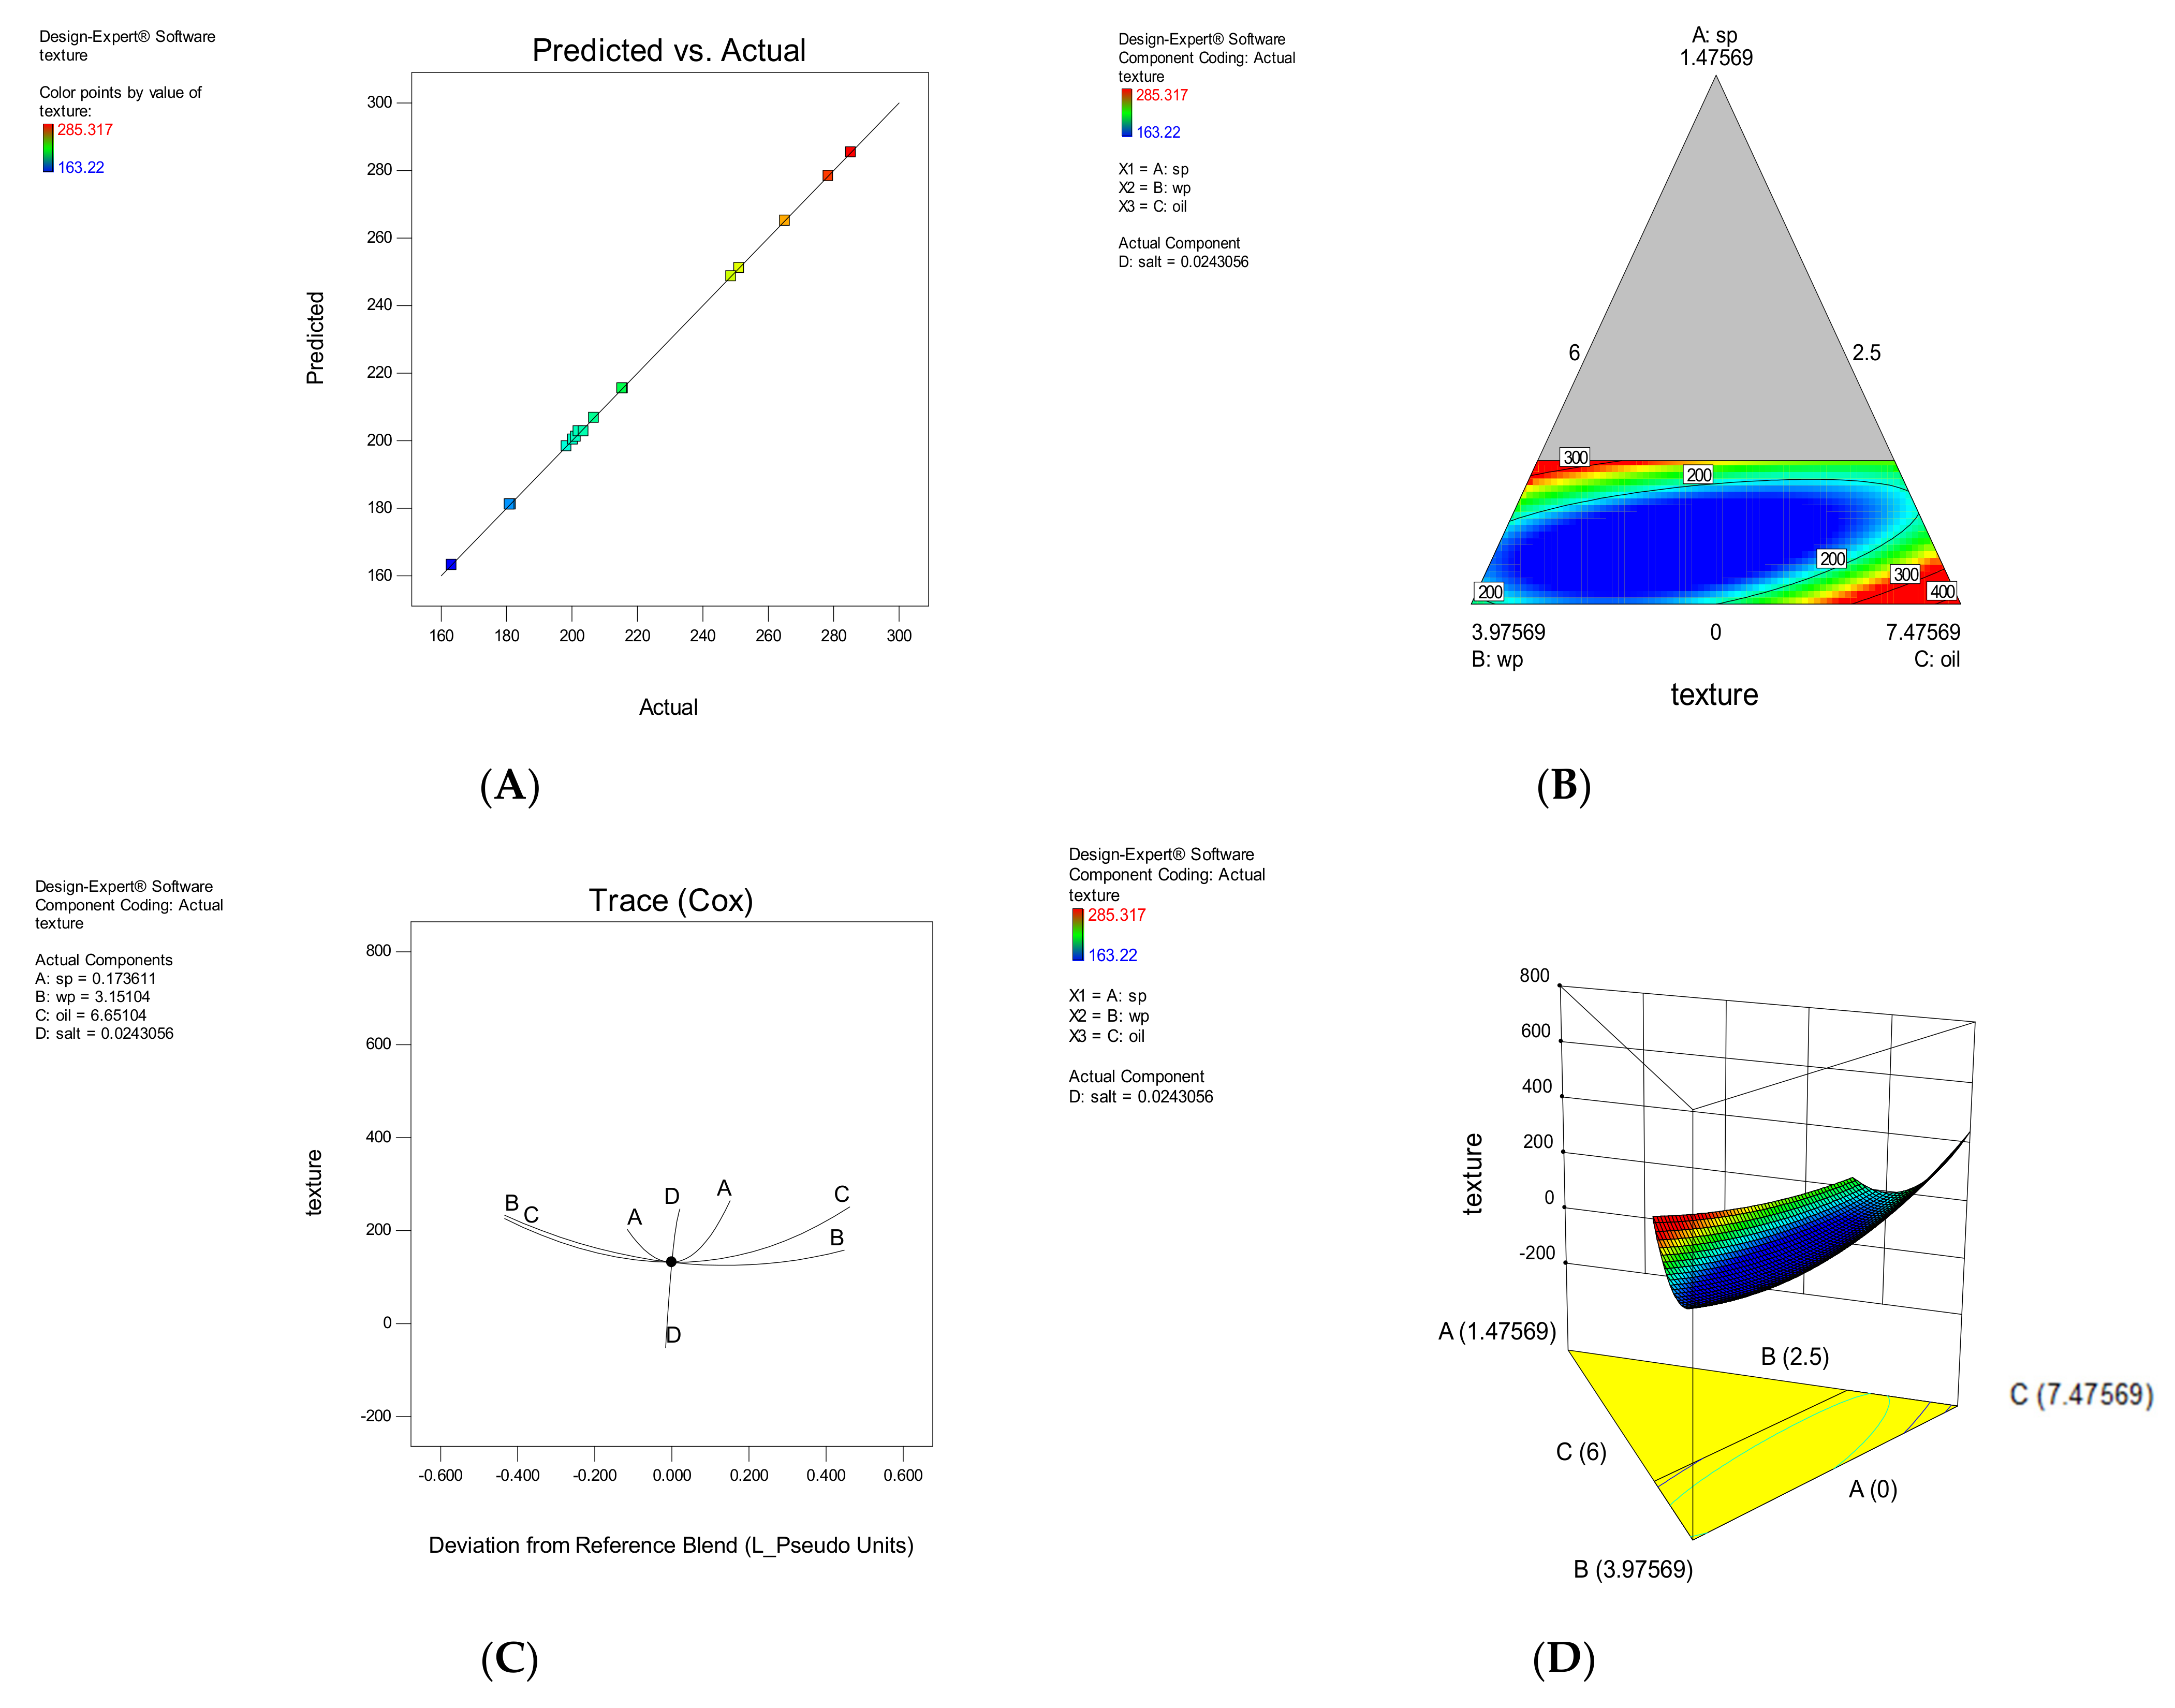
| TX | Special Qubic | 6118.35 | <0.0001 | 2.63 | 0.251 | 0.999 | 0.999 | +11,230.92A + 163.22B + 687.59C − 89,769.18D − 14,642.76AB − 17,612.64AC − 3.249E + 005AD − 514.12BC + 94,476.01BD + 76,190.44CD + 1026.78ABC + 5.800E + 005ABD + 6.746E + 005ACD + 0.000BCD |
| Number | SP | SWP | Oil | Salt | IA | TFC | TAC | Color | Hardness | Desirability | |
|---|---|---|---|---|---|---|---|---|---|---|---|
| 1 | 0.40 | 3.60 | 6.00 | 0.00 | 308.18 | 0.67 | 0.63 | −9.97 | 259.40 | 0.955 | Selected |
| 2 | 0.36 | 3.62 | 6.00 | 0.01 | 298.18 | 0.63 | 0.53 | −9.86 | 259.71 | 0.851 | |
| 3 | 0.38 | 3.31 | 6.27 | 0.02 | 298.18 | 0.70 | 0.57 | −11.47 | 246.18 | 0.805 | |
| 4 | 0.32 | 3.65 | 6.00 | 0.02 | 298.18 | 0.58 | 0.47 | −9.33 | 251.97 | 0.765 |
| Parameters | C | O |
|---|---|---|
| pH | 5.98 ± 0.15 b | 6.85 ± 0.18 a |
| Moisture% | 4.38 ± 0.03 a | 3.78 ± 0.19 b |
| Ash% | 0.92 ± 0.50 b | 8.17 ± 0.22 a |
| Fat% | 1.97 ± 0.10 b | 4.74 ± 0.06 a |
| Protein% | 1.42 ± 0.31 b | 7.90 ± 0.06 a |
| Carbohydrate a | 91.29 ± 0.29 a | 75.39 ± 0.06 b |
| Energy | 487.36 ± 0.47 a | 370.84 ± 0.85 b |
| TPC | 0.08 ± 0.03 b | 0.55 ± 0.50 a |
| TFC | 0.043 ± 0.04 b | 0.69 ± 0.01 a |
| RSA | 0.74 ± 0.54 b | 2.85 ± 0.13 a |
| Amino Acids (g/100 g Protein) | Values | Fatty Acids | Values | ||
|---|---|---|---|---|---|
| Essential amino acids | C | O | C | O | |
| Isoleucine | 0.14 ± 0.03 a | 6.51 ± 0.05 b | Myristic (C14:0) | 12.15 ± 0.02 c | 0.42 ± 0.06 d |
| Leucine | 0.53 ± 0.01 a | 8.01 ± 0.06 b | Palmitic (C16:0) | 14.22 ± 0.01 c | 36.98 ± 0.03 d |
| Lysine | 0.12 ± 0.05 a | 3.74 ± 0.14 b | Palmitoleic (C16:1 ω 6) | 0.006 ± 0.04 c | 5.97 ± 0.06 d |
| Methionine | 0.08 ± 0.00 a | 2.64 ± 0.01 b | Stearic (C18:0) | 3.63 ± 0.14 c | 1.96 ± 0.10 d |
| Phenylalanine | 0.21 ± 0.04 a | 4.15 ± 0.30 b | Oleic (C18:1 ω 6) | 0.03 ± 0.17 c | 1.69 ± 0.20 d |
| Threonine | 0.14 ± 0.12 a | 3.97 ± 0.13 b | Linoleic (C18:2 ω 6) | 1.30 ± 0.51 c | 17.01 ± 0.13 d |
| Tryptophan | 0.03 ± 0.30 a | 2.01 ± 0.25 b | Gamma-linolenic (C18:3 ω 6) | 0.09 ± 0.18 c | 26.13 ± 0.50 d |
| Valine | 0.18 ± 0.08 a | 5.94 ± 0.17 b | Alpha-linolenic (C18:3 ω3) | 0.004 ± 0.04 c | 3.44 ± 0.14 d |
| Total | 1.43 ± 0.07 a | 36.97 ± 0.04 b | Erucic acid (C22:1) | ---- | 5.12 ± 0.08 |
| Non-essential amino acids | Lignoceric acid (C24:0) | ---- | 1.28 ± 0.36 | ||
| Alanine | 0.44 ± 0.14 a | 6.98 ± 0.01 b | Total saturate fatty acid | 30.00 ± 0.07 c | 40.64 ± 0.05 d |
| Aspartic | 0.37 ± 0.32 a | 10.62 ± 0.14 b | Total unsaturated fatty acid | 0.13 ± 0.15 c | 59.36 ± 0.12 d |
| Arginine | 0.19 ± 0.60 a | 7.63 ± 0.20 b | |||
| Cysteine | 0.09 ± 0.14 a | 1.09 ± 0.17 b | |||
| Glutamic | 0.48 ± 0.08 a | 13.24 ± 0.13 b | |||
| Histidine | 0.12 ± 0.24 a | 2.67 ± 0.61 b | |||
| Glycine | 0.29 ± 0.21 a | 5.12 ± 0.40 b | |||
| Proline | 0.45 ± 0.25 a | 4.14 ± 0.18 b | |||
| Serine | 0.28 ± 0.18 a | 4.62 ± 0.27 b | |||
| Tyrosin | 0.5 ± 0.05 a | 6.92 ± 0.04 b | |||
| Total | 3.21 ± 0.21 a | 63.03 ± 0.18 b | |||
| Vitamins | mg/100 g | Minerals | mg/100 g | ||
|---|---|---|---|---|---|
| C | O | C | O | ||
| Vitamin B1(Thiamine) | ---- | 4.60 ± 0.01 mg | Calcium | 1.02 ± 0.02 b | 936.12 ± 0.16 a |
| Vitamin B2 (Riboflavin) | ---- | 5.01 ± 0.05 mg | Copper | Trace | 1.13 ± 0.13 b |
| Vitamin B3 (Niacin) | ---- | 15.14 ± 0.03 mg | Zinc | 15.00 ± 0.09 b | 32.31 ± 0.02 a |
| Vitamin B6 (Pyridoxine) | ---- | 1.01 ± 0.08 mg | Sodium | 1.56 ± 0.46 b | 1601.32 ± 41 a |
| Vitamin B12 (Analogue) | 23.80 ± 0.08 b | 162.30 ± 0.08 a μg | Potassium | ---- | 1994.38 ± 0.38 |
| Folic acid | ---- | 9.84 ± 0.08 mg | Iron | 13.00 ± 0.32 b | 269.98 ± 0.34 a |
| Vitamin K | ---- | 1102 ± 0.09 μg | |||
| Vitamin E | 0.90 ± 0.03 b | 8.34 ± 0.12 a mg | |||
| Biotin | ---- | 7.85 ± 0.61 μg | |||
| Parameters | Control | Optimal |
|---|---|---|
| L* | 32.54 ± 0.11 a | 24.65 ± 0.04 b |
| a* | −13.62 ± 0.01 b | −11.40 ± 0.02 a |
| b* | 9.14 ± 0.08 a | 5.60 ± 0.00 b |
| C | 16.40 ± 0.04 a | 12.71 ± 0.02 b |
| h | 98.39 ± 0.26 b | 121.00 ± 0.50 a |
| ΔE | ----- | 8.91 ± 0.073 |
| WI | 30.57 ± 0.12 a | 23.59 ± 0.04 b |
| Flavor | Color | Odor | Texture | Overall Acceptance | Hardness * | |
|---|---|---|---|---|---|---|
| C | 62.90 ± 1.85 b | 57.90 ± 1.96 b | 78.80 ± 1.47 a | 81.20 ± 1.81 b | 82.20 ± 1.98 b | 196.71 ± 0.94 a |
| O | 75.10 ± 2.92 a | 72.90 ± 2.80 a | 78.10 ± 1.72 a | 91.80 ± 1.75 a | 91.20 ± 1.54 a | 134.15 ± 0.98 b |
Publisher’s Note: MDPI stays neutral with regard to jurisdictional claims in published maps and institutional affiliations. |
© 2022 by the authors. Licensee MDPI, Basel, Switzerland. This article is an open access article distributed under the terms and conditions of the Creative Commons Attribution (CC BY) license (https://creativecommons.org/licenses/by/4.0/).
Share and Cite
Bayat Tork, M.; Vazifedoost, M.; Hesarinejad, M.A.; Didar, Z.; Shafafi Zenoozian, M. Fabrication of Dragee Containing Spirulina platensis Microalgae to Enrich Corn Snack and Evaluate Its Sensorial, Physicochemical and Nutritional Properties. Foods 2022, 11, 1909. https://doi.org/10.3390/foods11131909
Bayat Tork M, Vazifedoost M, Hesarinejad MA, Didar Z, Shafafi Zenoozian M. Fabrication of Dragee Containing Spirulina platensis Microalgae to Enrich Corn Snack and Evaluate Its Sensorial, Physicochemical and Nutritional Properties. Foods. 2022; 11(13):1909. https://doi.org/10.3390/foods11131909
Chicago/Turabian StyleBayat Tork, Maryam, Mohsen Vazifedoost, Mohammad Ali Hesarinejad, Zohreh Didar, and Masoud Shafafi Zenoozian. 2022. "Fabrication of Dragee Containing Spirulina platensis Microalgae to Enrich Corn Snack and Evaluate Its Sensorial, Physicochemical and Nutritional Properties" Foods 11, no. 13: 1909. https://doi.org/10.3390/foods11131909
APA StyleBayat Tork, M., Vazifedoost, M., Hesarinejad, M. A., Didar, Z., & Shafafi Zenoozian, M. (2022). Fabrication of Dragee Containing Spirulina platensis Microalgae to Enrich Corn Snack and Evaluate Its Sensorial, Physicochemical and Nutritional Properties. Foods, 11(13), 1909. https://doi.org/10.3390/foods11131909