
Food on the Move: The Impact of Implied Motion in Pictures on Food Perceptions through Anticipated Pleasure of Consumption


Abstract
:1. Introduction
1.1. The Strength of Visuals in Food Advertising
1.2. (Un)healthy Food Associations and the Concept of Food Pleasure
1.3. Motion Perception and Dynamic Imagery
1.4. The Use of Implied Motion in Food Pictures
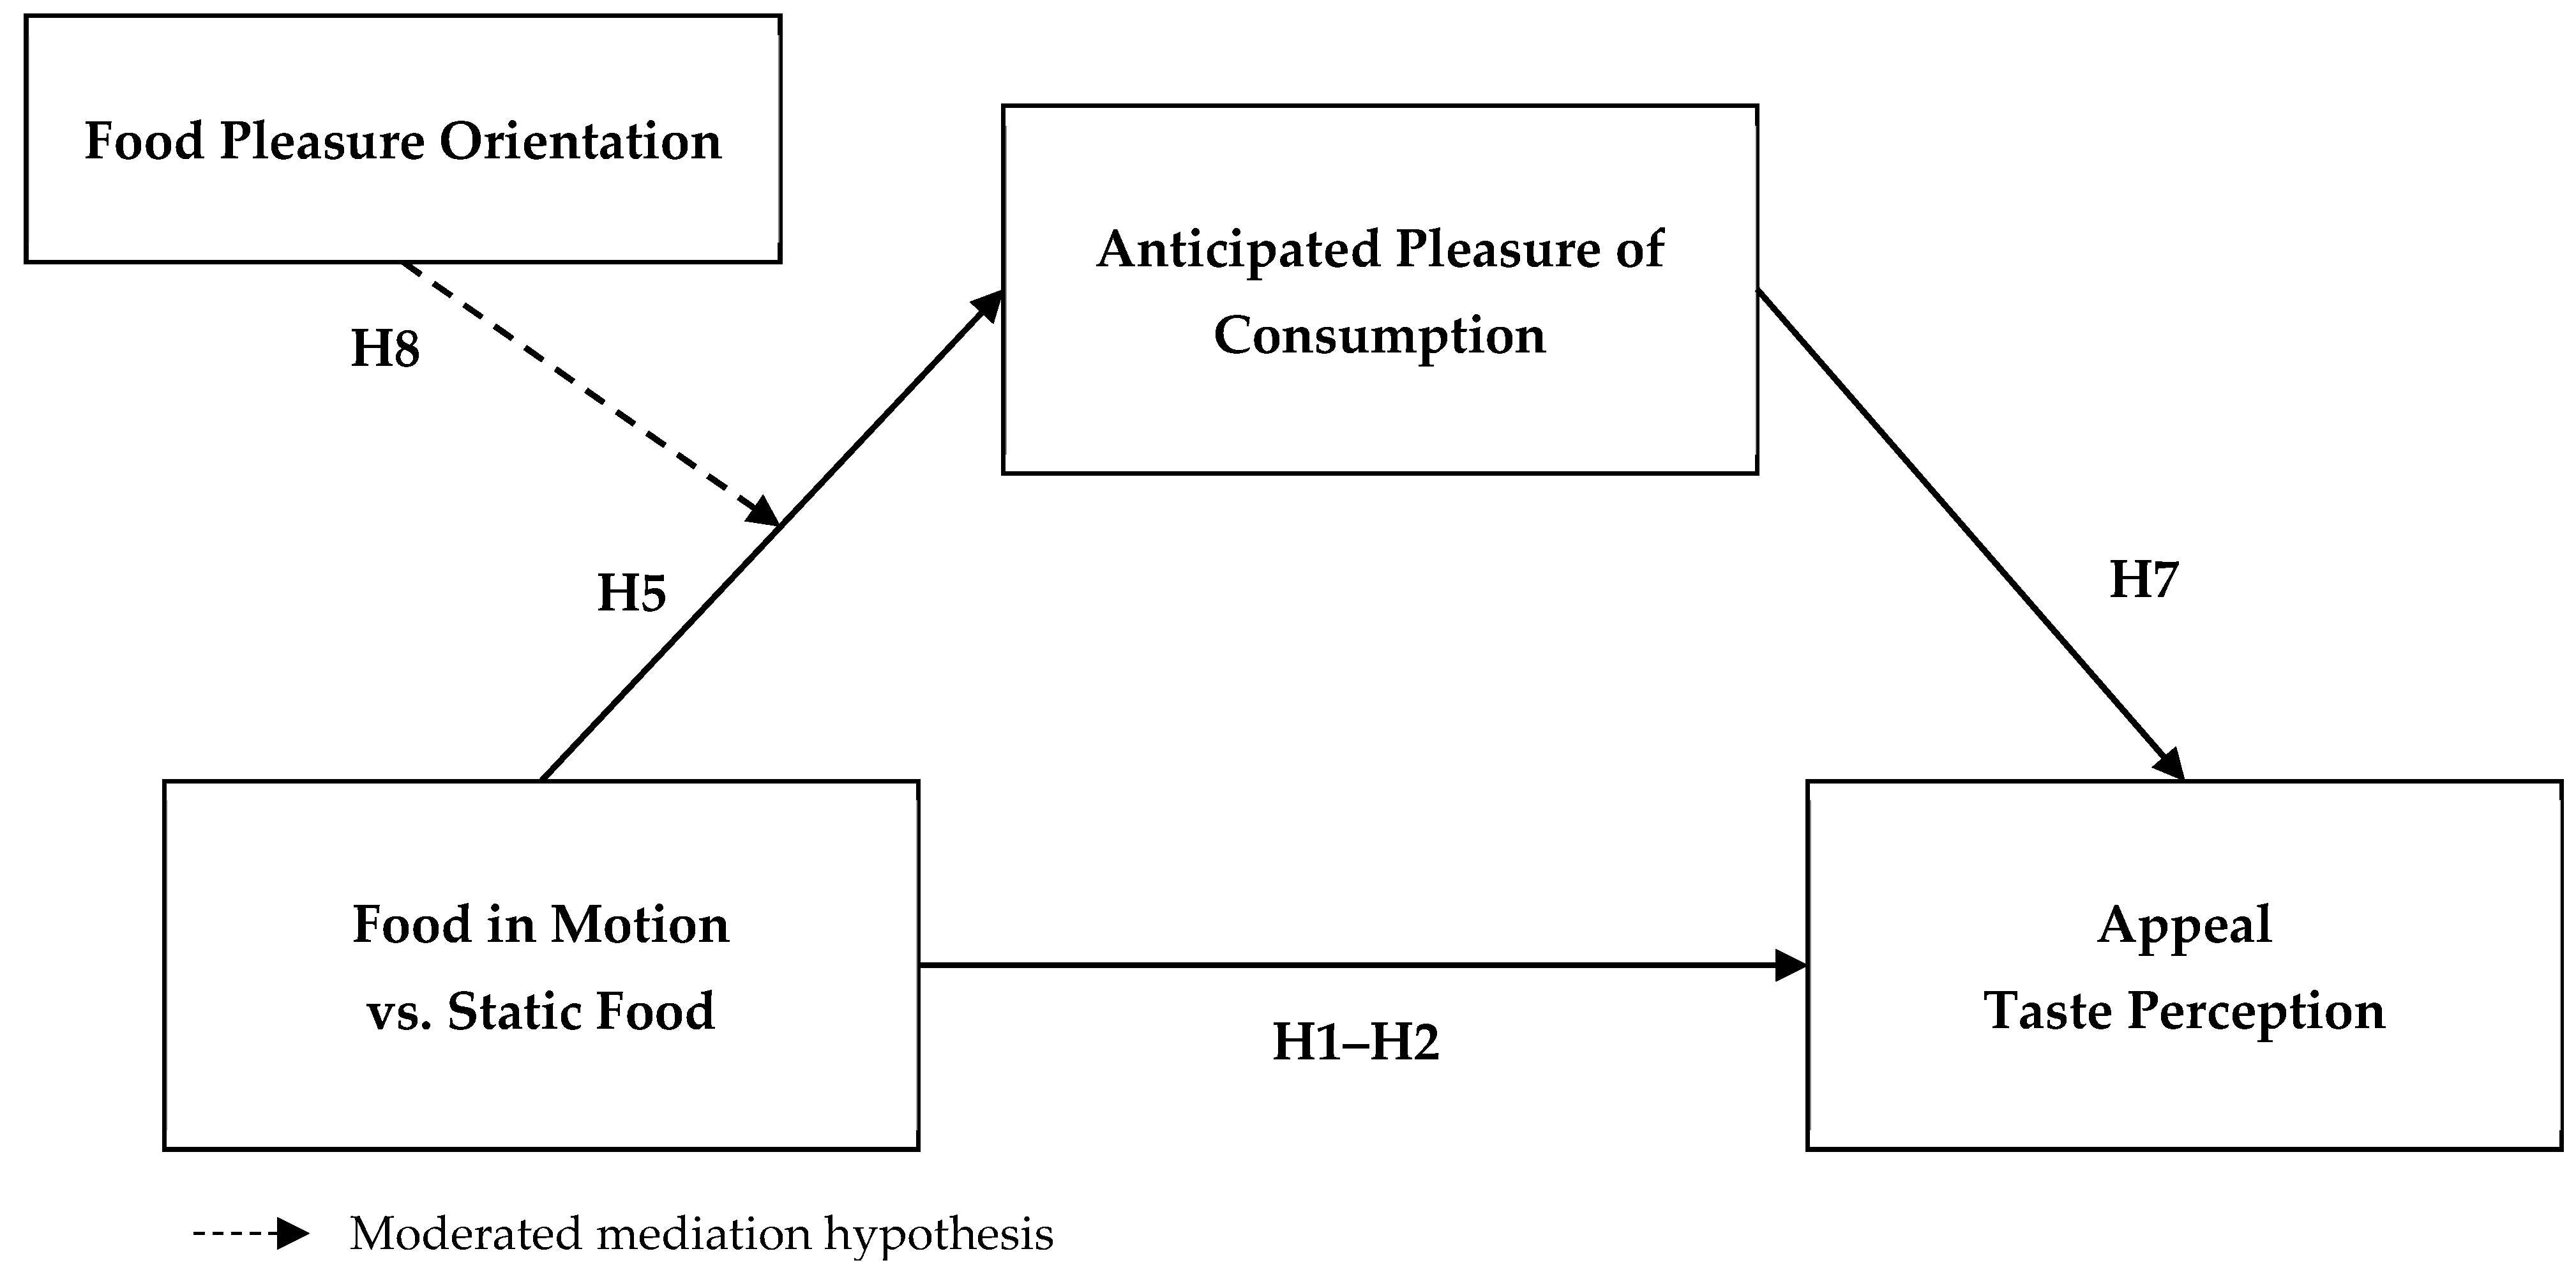
1.5. Research Aims and Hypotheses
2. Study Overview
3. Study 1
3.1. Stimuli and Pretest
3.2. Participants
3.3. Procedure, Measurements, and Reliability
3.4. Data Analysis
3.5. Results and Discussion
3.5.1. Main Effects Analyses
3.5.2. Mediation and Moderated Mediation Analyses
4. Study 2a
4.1. Stimuli and Pretest
4.2. Participants
4.3. Procedure, Measurements, and Reliability
4.4. Data Analysis
4.5. Results and Discussion
4.5.1. Main Effects and Interaction Effects Analyses
4.5.2. Mediation and Moderated Mediation Analyses
5. Study 2b
5.1. Stimuli and Pretest
5.2. Participants
5.3. Procedure, Measurements, and Reliability
5.4. Data Analysis
5.5. Results and Discussion
5.5.1. Main Effects and Interaction Effects Analyses
5.5.2. Mediation and Moderated Mediation Analyses
6. Discussion
6.1. Overview of the Findings
6.2. Theoretical and Practical Contributions
6.3. Limitations and Suggestions for Future Research
7. Conclusions
Author Contributions
Funding
Institutional Review Board Statement
Informed Consent Statement
Data Availability Statement
Acknowledgments
Conflicts of Interest
Appendix A

| Food Stimulus | Healthiness | Appeal | Realism | |||
|---|---|---|---|---|---|---|
| M | (SD) | M | (SD) | M | (SD) | |
| Avocado salad with lime juice in bowl * | 8.00 | (1.01) | 7.38 | (1.48) | 6.71 | (1.69) |
| Brussels sprouts in colander * | 8.11 | (1.12) | 6.03 | (2.10) | 5.32 | (2.05) |
| Coffee beans | 5.07 | (1.97) | 6.04 | (2.06) | 6.38 | (1.82) |
| Fruit salad in bowl * | 8.31 | (0.96) | 7.85 | (1.38) | 7.77 | (1.38) |
| Herbal tea in cup * | 7.57 | (1.43) | 6.25 | (2.00) | 6.50 | (1.81) |
| Honey in bowl | 5.11 | (2.15) | 5.87 | (2.14) | 5.83 | (1.92) |
| Lemons cut on plate | 7.98 | (1.37) | 7.39 | (1.46) | 7.76 | (1.36) |
| Lettuce salad with dressing on plate | 7.52 | (1.45) | 6.26 | (1.95) | 6.15 | (1.87) |
| Lime squeezed | 7.98 | (1.14) | 7.53 | (1.52) | 7.07 | (1.88) |
| Milk in glass | 6.73 | (1.86) | 5.07 | (2.20) | 6.55 | (1.90) |
| Muesli with milk in bowl * | 7.48 | (1.50) | 6.52 | (1.75) | 6.55 | (1.64) |
| Muesli with milk in glass * | 7.06 | (1.60) | 7.45 | (1.40) | 6.46 | (1.77) |
| Olive oil in bowl | 5.89 | (1.84) | 6.27 | (1.78) | 6.20 | (1.95) |
| Orange juice in glass | 5.62 | (2.19) | 6.20 | (1.93) | 7.57 | (1.45) |
| Red berry smoothie in glass * | 7.49 | (1.51) | 7.64 | (1.47) | 6.27 | (1.88) |
| Tomato juice in glass * | 7.80 | (1.30) | 5.77 | (2.26) | 6.31 | (1.72) |
| Water in glass 1 * | 8.56 | (0.91) | 7.07 | (1.64) | 6.78 | (1.97) |
| Water in glass 2 | 8.15 | (1.39) | 6.12 | (2.04) | 6.22 | (2.20) |
| Water in glass 3 | 8.12 | (1.50) | 6.84 | (1.93) | 6.11 | (2.06) |
| Beer in glass 1 * | 2.93 | (1.64) | 5.07 | (2.52) | 5.76 | (2.06) |
| Beer in glass 2 | 2.80 | (1.73) | 5.25 | (2.59) | 5.31 | (2.09) |
| Beer in glass 3 | 2.99 | (1.45) | 5.00 | (1.94) | 5.61 | (2.28) |
| Cake with glaze on plate * | 2.84 | (1.22) | 5.84 | (2.21) | 5.10 | (2.02) |
| Chocolate cake with pink glaze on plate * | 2.38 | (1.30) | 6.54 | (1.90) | 5.92 | (1.80) |
| Coffee in mug | 4.70 | (1.85) | 5.11 | (2.27) | 5.83 | (2.01) |
| Coffee in thermos | 4.36 | (1.60) | 5.27 | (2.04) | 6.28 | (1.82) |
| Donuts with powdered sugar on plate * | 2.46 | (1.46) | 6.42 | (1.92) | 5.24 | (1.72) |
| Ice cream in cone * | 2.46 | (1.37) | 6.65 | (1.90) | 6.84 | (1.60) |
| Lemonade in glass * | 4.37 | (1.71) | 5.14 | (2.16) | 6.61 | (1.65) |
| Muffin with chocolate sauce * | 2.43 | (1.22) | 5.89 | (2.03) | 6.56 | (1.68) |
| Pancakes with honey on plate * | 2.96 | (1.37) | 6.99 | (1.93) | 5.40 | (1.97) |
| Pancakes with syrup * | 2.11 | (1.20) | 7.07 | (2.03) | 5.09 | (2.13) |
| Red grenadine in glass | 3.69 | (1.83) | 5.28 | (2.30) | 4.98 | (2.06) |
| Red wine in glass | 3.63 | (1.79) | 5.67 | (2.47) | 5.53 | (2.44) |
| Yellow grenadine in glass | 3.49 | (1.90) | 5.47 | (2.48) | 5.41 | (1.94) |
| Food Stimulus | Healthiness | Appeal | Realism | |||
|---|---|---|---|---|---|---|
| M | (SD) | M | (SD) | M | (SD) | |
| Broccoli with olive oil on plate | 8.42 | (1.07) | 6.18 | (2.04) | 7.57 | (1.57) |
| Bruschetta with balsamico on plate | 6.71 | (1.44) | 7.94 | (1.39) | 7.85 | (1.12) |
| Chicken stew with raisins in pot | 6.78 | (1.36) | 7.08 | (2.07) | 7.08 | (1.74) |
| Lemon water in glass | 8.12 | (1.34) | 6.98 | (1.82) | 7.22 | (1.97) |
| Lettuce salad with croutons in bowl | 7.31 | (1.29) | 5.91 | (1.90) | 7.37 | (1.31) |
| Orange juice in glass | 6.94 | (1.73) | 7.56 | (1.41) | 7.78 | (1.60) |
| Cheesecake with syrup on plate | 4.55 | (1.90) | 7.64 | (1.41) | 7.40 | (1.47) |
| Ice cream with caramel sauce in glass | 2.76 | (1.51) | 6.82 | (2.12) | 6.91 | (1.83) |
| Lime cake with glaze on plate | 3.54 | (1.45) | 6.16 | (2.23) | 6.66 | (1.64) |
| Moelleux with chocolate sauce | 2.51 | (1.57) | 7.09 | (1.93) | 6.98 | (1.89) |
| Pancakes with syrup on plate | 3.67 | (1.88) | 7.89 | (1.50) | 7.75 | (1.48) |
| Profiteroles with chocolate sauce on plate | 2.49 | (1.38) | 6.20 | (2.09) | 6.38 | (1.92) |
References
- Holmberg, C.; Chaplin, J.E.; Hillman, T.; Berg, C. Adolescents’ presentation of food in social media: An explorative study. Appetite 2016, 99, 121–129. [Google Scholar] [CrossRef] [PubMed]
- Rousseau, S. Food “porn” in media. In Encyclopedia of Food and Agricultural Ethics, 1st ed.; Thompson, P.B., Kaplan, D.M., Eds.; Springer: Dordrecht, The Netherlands, 2014; pp. 1–8. [Google Scholar]
- Rousseau, S. Food and Social Media: You Are What You Tweet, 1st ed.; Altamira Press: Lanham, MD, USA, 2012. [Google Scholar]
- Freeland-Graves, J.H.; Nitzke, S. Position of the academy of nutrition and dietetics: Total diet approach to healthy eating. J. Acad. Nutr. Diet. 2013, 113, 307–317. [Google Scholar] [CrossRef] [PubMed]
- Obesity and Overweight. Available online: https://www.who.int/en/news-room/fact-sheets/detail/obesity-and-overweight (accessed on 30 June 2021).
- Meersseman, E.; Vermeir, I.; Geuens, M. The effect of perspectives in food pictures on unhealthy food choices. Food Qual. Prefer. 2021, 89, 104140. [Google Scholar] [CrossRef]
- Liaukonyte, J.; Rickard, B.J.; Kaiser, H.M.; Okrent, A.M.; Richards, T.J. Economic and health effects of fruit and vegetable advertising: Evidence from lab experiments. Food Policy 2012, 37, 543–553. [Google Scholar] [CrossRef]
- Huyghe, E.; Verstraeten, J.; Geuens, M.; Van Kerckhove, A. Clicks as a healthy alternative to bricks: How online grocery shopping reduces vice purchases. J. Mark. Res. 2017, 54, 61–74. [Google Scholar] [CrossRef]
- Trudel-Guy, C.; Bédard, A.; Corneau, L.; Bélanger-Gravel, A.; Desroches, S.; Bégin, C.; Provencher, V.; Lemieux, S. Impact of pleasure-oriented messages on food choices: Is it more effective than traditional health-oriented messages to promote healthy eating? Appetite 2019, 143, 104392. [Google Scholar] [CrossRef]
- Rekhy, R.; McConchie, R. Promoting consumption of fruit and vegetables for better health: Have campaigns delivered on the goals? Appetite 2014, 79, 113–123. [Google Scholar] [CrossRef] [PubMed]
- Witham, M.D.; Avenell, A. Interventions to achieve long-term weight loss in obese older people: A systematic review and meta-analysis. Age Ageing 2010, 39, 176–184. [Google Scholar] [CrossRef] [PubMed] [Green Version]
- Pettigrew, S. Pleasure: An under-utilised ‘P’ in social marketing for healthy eating. Appetite 2016, 104, 60–69. [Google Scholar] [CrossRef]
- Kaiyun, L.; Xu, L.-H.; Xuan, Y.; Xiaolan, F. Cognitive and neural mechanisms of implied motion. Prog. Biochem. Biophys. 2015, 42, 519–532. [Google Scholar] [CrossRef]
- Gvili, Y.; Tal, A.; Amar, M.; Hallak, Y.; Wansink, B. All the right moves: Why motion increases appeal of food products. In NA—Advances in Consumer Research Volume 43, Proceedings of the Association for Consumer Research Conference, New Orleans, LA, USA, 1–4 October 2015; Diehl, K., Yoon, C., Eds.; Association for Consumer Research: Duluth, MN, USA, 2015; pp. 352–357. [Google Scholar]
- Gvili, Y.; Tal, A.; Amar, M.; Hallak, Y.; Wansink, B.; Giblin, M.; Bommelaer, C. Fresh from the tree: Implied motion improves food evaluation. Food Qual. Prefer. 2015, 46, 160–165. [Google Scholar] [CrossRef]
- Gvili, Y.; Tal, A.; Amar, M.; Wansink, B. Moving up in taste: Enhanced projected taste and freshness of moving food products. Psychol. Market. 2017, 34, 671–683. [Google Scholar] [CrossRef]
- Amar, M.; Gvili, Y.; Tal, A. Moving towards healthy: Cuing food healthiness and appeal. J. Soc. Mark. 2021, 11, 44–63. [Google Scholar] [CrossRef]
- Pawel, S.; Held, L. Probabilistic forecasting of replication studies. PLoS ONE 2020, 15, e0231416. [Google Scholar] [CrossRef] [Green Version]
- Ha, O.; Bruce, A.; Pruitt, S.; Cherry, J.; Smith, T.; Burkart, D.; Lim, S. Healthy eating decisions require efficient dietary self-control in children: A mouse-tracking food decision study. Appetite 2016, 105, 575–581. [Google Scholar] [CrossRef] [PubMed]
- Stevenson, C.; Doherty, G.; Barnett, J.; Muldoon, O.; Trew, K. Adolescents’ views of food and eating: Identifying barriers to healthy eating. J. Adolesc. 2007, 30, 417–434. [Google Scholar] [CrossRef] [Green Version]
- Detenber, B.H.; Simons, R.F.; Bennett, G.G. Roll ‘em!: The effects of picture motion on emotional responses. J. Broadcast. Electron. 1998, 42, 113–127. [Google Scholar] [CrossRef]
- Simons, R.F.; Detenber, B.H.; Reiss, J.E.; Shults, C.W. Image motion and context: A between- and within-subjects comparison. Psychophysiology 2000, 37, 706–710. [Google Scholar] [CrossRef] [PubMed]
- Sundar, S.S.; Kalyanaraman, S. Arousal, memory, and impression-formation effects of animation speed in Web advertising. J. Advert. 2004, 33, 7–17. [Google Scholar] [CrossRef]
- Sundar, S.S.; Kim, J. Interactivity and persuasion: Influencing attitudes with information and involvement. J. Interact. Advert. 2005, 5, 5–18. [Google Scholar] [CrossRef]
- Spence, C.; Okajima, K.; Cheok, A.D.; Petit, O.; Michel, C. Eating with our eyes: From visual hunger to digital satiation. Brain Cogn. 2016, 110, 53–63. [Google Scholar] [CrossRef] [Green Version]
- van der Laan, L.N.; de Ridder, D.T.D.; Viergever, M.A.; Smeets, P.A.M. The first taste is always with the eyes: A meta-analysis on the neural correlates of processing visual food cues. NeuroImage 2011, 55, 296–303. [Google Scholar] [CrossRef] [PubMed]
- Greenleaf, E.; Raghubir, P. Geometry in the marketplace. In Visual Marketing: From Attention to Action; Wedel, M., Pieters, R., Eds.; Erlbaum: New York, NY, USA, 2008; pp. 113–142. [Google Scholar]
- Deroy, O.; Michel, C.; Piqueras-Fiszman, B.; Spence, C. The plating manifesto (I): From decoration to creation. Flavour 2014, 3, 6. [Google Scholar] [CrossRef] [Green Version]
- Linné, Y.; Barkeling, B.; Rössner, S.; Rooth, P. Vision and Eating Behavior. Obes. Res. 2002, 10, 92–95. [Google Scholar] [CrossRef]
- Michel, C.; Velasco, C.; Gatti, E.; Spence, C. A taste of Kandinsky: Assessing the influence of the artistic visual presentation of food on the dining experience. Flavour 2014, 3, 7. [Google Scholar] [CrossRef] [Green Version]
- Spence, C.; Piqueras-Fiszman, B.; Michel, C.; Deroy, O. Plating manifesto (II): The art and science of plating. Flavour 2014, 3, 4. [Google Scholar] [CrossRef] [Green Version]
- Vermeir, I.; Roose, G. Visual design cues impacting food choice: A review and future research agenda. Foods 2020, 9, 1495. [Google Scholar] [CrossRef]
- Zellner, D.A.; Loss, C.R.; Zearfoss, J.; Remolina, S. It tastes as good as it looks! The effect of food presentation on liking for the flavor of food. Appetite 2014, 77, 31–35. [Google Scholar] [CrossRef]
- Roose, G.; Mulier, L. Healthy advertising coming to its senses: The effectiveness of sensory appeals in healthy food advertising. Foods 2020, 9, 51. [Google Scholar] [CrossRef] [Green Version]
- Curtis, K.R.; Cowee, M.W. Direct marketing local food to chefs: Chef preferences and perceived obstacles. J. Food Distrib. Res. 2009, 40, 26–36. [Google Scholar] [CrossRef]
- Hansen, T. Understanding consumer perception of food quality: The cases of shrimps and cheese. Br Food J. 2005, 107, 500–525. [Google Scholar] [CrossRef]
- Wandel, M.; Bugge, A. Environmental concern in consumer evaluation of food quality. Food Qual. Prefer. 1997, 8, 19–26. [Google Scholar] [CrossRef]
- Péneau, S.; Linke, A.; Escher, F.; Nuessli, J. Freshness of fruits and vegetables: Consumer language and perception. Br Food J. 2009, 111, 243–256. [Google Scholar] [CrossRef]
- Elder, R.S.; Krishna, A. The effects of advertising copy on sensory thoughts and perceived taste. J. Consum. Res. 2010, 36, 748–756. [Google Scholar] [CrossRef]
- Verbeke, W. Functional foods: Consumer willingness to compromise on taste for health? Food Qual. Prefer. 2006, 17, 126–131. [Google Scholar] [CrossRef]
- Howlett, E.A.; Burton, S.; Bates, K.; Huggins, K. Coming to a restaurant near you? Potential consumer responses to nutrition information disclosure on menus. J. Consum. Res. 2009, 36, 494–503. [Google Scholar] [CrossRef]
- Mai, R.; Hoffmann, S. How to combat the unhealthy = tasty intuition: The influencing role of health consciousness. J. Public Policy Mark. 2015, 34, 63–83. [Google Scholar] [CrossRef]
- Van Rompay, T.; Deterink, F.; Fenko, A. Healthy package, healthy product? Effects of packaging design as a function of purchase setting. Food Qual. Prefer. 2016, 43, 84–89. [Google Scholar] [CrossRef]
- Fenko, A.; Lotterman, H.; Galetzka, M. What’s in a name? The effects of sound symbolism and package shape on consumer responses to food products. Food Qual. Prefer. 2016, 51, 100–108. [Google Scholar] [CrossRef]
- Provencher, V.; Polivy, J.; Herman, C.P. Perceived healthiness of food. If it’s healthy, you can eat more! Appetite 2009, 52, 340–344. [Google Scholar] [CrossRef]
- Liem, D.G.; Aydin, N.T.; Zandstra, E.H. Effects of health labels on expected and actual taste perception of soup. Food Qual. Prefer. 2012, 25, 192–197. [Google Scholar] [CrossRef]
- Raghunathan, R.; Naylor, R.W.; Hoyer, W.D. The unhealthy equal tasty intuition and its effects on taste inferences, enjoyment, and choice of food products. J. Mark. 2006, 70, 170–184. [Google Scholar] [CrossRef]
- Werle, C.O.C.; Trendel, O.; Ardito, G. Unhealthy food is not tastier for everybody: The “healthy = tasty” French intuition. Food Qual. Prefer. 2013, 28, 116–121. [Google Scholar] [CrossRef]
- Remick, A.K.; Pliner, P.; McLean, K.C. The relationship between restrained eating, pleasure associated with eating, and well-being re-visited. Eat. Behav. 2009, 10, 42–44. [Google Scholar] [CrossRef] [PubMed]
- Huang, Y.H.; Wu, J. Food pleasure orientation diminishes the “healthy = less tasty” intuition. Food Qual. Prefer. 2016, 54, 75–78. [Google Scholar] [CrossRef]
- Rozin, P.; Kabnick, K.; Pete, E.; Fischler, C.; Shields, C. The ecology of eating: Smaller portion sizes in France than in the United States help explain the French paradox. Psychol. Sci. 2003, 14, 450–454. [Google Scholar] [CrossRef] [PubMed]
- Bublitz, M.G.; Peracchio, L.A. Applying industry practices to promote healthy foods: An exploration of positive marketing outcomes. J. Bus. Res. 2015, 68, 2484–2493. [Google Scholar] [CrossRef]
- Tuorila, H. From sensory evaluation to sensory and consumer research of food: An autobiographical perspective. Food Qual. Pref. 2014, 40, 255–262. [Google Scholar] [CrossRef]
- Elliott, C.D. Healthy food looks serious: How children interpret packaged food products. Can. J. Commun. 2009, 34, 359–380. [Google Scholar] [CrossRef] [Green Version]
- Mela, D.J. Eating for pleasure or just wanting to eat? Reconsidering sensory hedonic responses as a driver of obesity. Appetite 2006, 47, 10–17. [Google Scholar] [CrossRef]
- Blakemore, S.J.; Decety, J. From the perception of action to the understanding of intention. Nat. Rev. Neurosci. 2001, 2, 561–567. [Google Scholar] [CrossRef]
- Thompson, J.; Parasuraman, R. Attention, biological motion, and action recognition. Neuroimage 2012, 59, 4–13. [Google Scholar] [CrossRef]
- Mackert, M.; Lazard, A.; Guadagno, M.; Wagner, H.J. The role of implied motion in engaging audiences for health promotion: Encouraging naps on a college campus. J. Am. Coll. Health 2014, 62, 542–551. [Google Scholar] [CrossRef]
- Cian, L.; Krishna, A.; Elder, R.S. This logo moves me: Dynamic imagery from static images. J. Mark. Res. 2014, 51, 184–197. [Google Scholar] [CrossRef] [Green Version]
- Krekelberg, B.; Vatakis, A.; Kourtzi, Z. Implied motion from form in the human visual cortex. J. Neurophysiol. 2005, 94, 4373–4386. [Google Scholar] [CrossRef]
- Kourtzi, Z.; Kanwisher, N. Activation in human MT/MST by static images with implied motion. J. Cogn. Neurosci 2000, 12, 48–55. [Google Scholar] [CrossRef] [Green Version]
- Winawer, J.; Huk, A.C.; Boroditsky, L. A motion aftereffect from still photographs depicting motion. Psychol. Sci. 2008, 19, 276–283. [Google Scholar] [CrossRef]
- Acik, A.; Bartel, A.; Konig, P. Real and implied motion at the center of gaze. J. Vision 2014, 14, 1–19. [Google Scholar] [CrossRef] [PubMed] [Green Version]
- Ads of the World. Available online: https://www.adsoftheworld.com/ (accessed on 8 August 2021).
- Giblin, M.; Tal, A.; Wansink, B. Food in motion. In NA—Advances in Consumer Research Volume 40, Proceedings of the Association for Consumer Research Conference, Vancouver, BC, Canada, 4–7 October 2012; Gürhan-Canli, Z., Otnes, C., Zhu, R., Eds.; Association for Consumer Research: Duluth, MN, USA, 2012; p. 1108. [Google Scholar]
- Lautenschlager, K.; Boon, N.; Wang, Y.; Egli, T.; Hammes, F. Overnight stagnation of drinking water in household taps induces microbial growth and changes in community composition. Water Res. 2010, 44, 4868–4877. [Google Scholar] [CrossRef] [PubMed]
- Rossini, J.C. Looming motion and visual attention. Psychol. Neurosci. 2014, 7, 1–7. [Google Scholar] [CrossRef] [Green Version]
- Schlaepfer, M.A.; Runge, M.C.; Sherman, P.W. Ecological and evolutionary traps. Trends Ecol. Evol. 2002, 17, 474–480. [Google Scholar] [CrossRef]
- Camerer, C.F.; Dreber, A.; Holzmeister, F.; Ho, T.-H.; Huber, J.; Johannesson, M.; Wu, H. Evaluating the replicability of social science experiments in Nature and Science between 2010 and 2015. Nat. Hum. Behav. 2018, 2, 637–644. [Google Scholar] [CrossRef] [Green Version]
- Klein, R.A.; Ratliff, K.A.; Vianello, M.; Adams, R.B.; Bahník, Š.; Bernstein, M.J.; Nosek, B.A. Investigating variation in replicability: A “many labs” replication project. Soc. Psychol. 2014, 45, 142–152. [Google Scholar] [CrossRef]
- Maxwell, S.E.; Lau, M.Y.; Howard, G.S. Is psychology suffering from a replication crisis? What does “failure to replicate” really mean? Am. Psychol. 2015, 70, 487–498. [Google Scholar] [CrossRef] [PubMed]
- Altmejd, A.; Dreber, A.; Forsell, E.; Huber, J.; Id, T.I.; Johannesson, M.; Camerer, C. Predicting the replicability of social science lab experiments. PLoS ONE 2019, 14, e0225826. [Google Scholar] [CrossRef] [PubMed]
- LeBel, E.P.; Vanpaemel, W.; Cheung, I.; Campbell, L. A brief guide to evaluate replications. Meta-Psychology 2018, 541, 1–17. [Google Scholar] [CrossRef] [Green Version]
- Faul, F.; Erdfelder, E.; Lang, A.G.; Buchner, A. G*Power 3: A flexible statistical power analysis program for the social, behavioral, and biomedical sciences. Behav. Res. Methods 2007, 39, 175–191. [Google Scholar] [CrossRef] [PubMed]
- Perugini, M.; Gallucci, M.; Costantini, G. Safeguard power as a protection against imprecise power estimates. Perspect. Psychol. Sci. 2014, 9, 319–332. [Google Scholar] [CrossRef] [Green Version]
- Rozin, P.; Fischler, C.; Imada, S.; Sarubin, A.; Wrzesniewski, A. Attitudes to food and the role of food in life in the USA, Japan, Flemish Belgium and France: Possible implications for the diet–health debate. Appetite 1999, 33, 163–180. [Google Scholar] [CrossRef]
- Becker, M.H.; Maiman, L.A.; Kirscht, J.P.; Haefner, D.P.; Drachman, R.H. The health belief model and prediction of dietary compliance: A field experiment. J. Health Soc. Behav. 1977, 18, 348–366. [Google Scholar] [CrossRef]
- Gould, S.J. Consumer attitudes toward health and health care: A differential perspective. J. Consum. Aff. 1988, 22, 96–118. [Google Scholar] [CrossRef]
- Hoque, M.Z.; Alam, M.N.; Nahid, K.A. Health consciousness and its effect on perceived knowledge, and belief in the purchase intent of liquid milk: Consumer insights from an emerging market. Foods 2018, 7, 150. [Google Scholar] [CrossRef] [Green Version]
- Gould, S.J. Health consciousness and health behavior: The application of a new Health Consciousness Scale. Am. J. Prev. Med. 1990, 6, 228–237. [Google Scholar] [CrossRef]
- Rockwood, N.J.; Hayes, A.F. MLmed: An SPSS macro for multilevel mediation and conditional process analysis. In Proceedings of the 29th Annual Convention of the Association for Psychological Science (APS), Boston, MA, USA, 25–28 May 2017. [Google Scholar]
- Hayes, A.F.; Rockwood, N.J. Conditional process analysis: Concepts, computation, and advances in the modeling of the contingencies of mechanisms. Am. Behav. Sci. 2020, 64, 19–54. [Google Scholar] [CrossRef] [Green Version]
- Rockwood, N.J.; Hayes, A.F. Multilevel mediation analysis. In Multilevel Modeling Methods with Introductory and Advanced Applications; O’Connell, A.A., McCoach, D.B., Bell, B., Eds.; Information Age Publishing: Charlotte, NC, USA, in press.
- De Paepe, A.L.; Crombez, G.; Legrain, V. What’s coming near? The influence of dynamical visual stimuli on nociceptive processing. PLoS ONE 2016, 11, e0155864. [Google Scholar] [CrossRef] [Green Version]
- Bouquet, C.A.; Gaurier, V.; Shipley, T.; Toussaint, L.; Blandin, Y. Influence of the perception of biological or non-biological motion on movement execution. J. Sports Sci. 2007, 25, 519–530. [Google Scholar] [CrossRef] [PubMed]
- Pratt, J.; Radulescu, P.V.; Guo, R.M.; Abrams, R.A. It’s alive! Animate motion captures visual attention. Psychol. Sci. 2010, 21, 1724–1730. [Google Scholar] [CrossRef] [Green Version]

| Study | Experimental Design | Between-Subjects Conditions | Experimental Stimuli | Measurements |
|---|---|---|---|---|
| Study 1 | Lab experiment (N = 159) | Food in motion vs. Static food | 26 food pictures | Appeal Perceptions of taste, healthiness, and freshnessAnticipated pleasure of consumption |
| Study 2a | Online panel experiment (N = 251) | 2 (Food in motion vs. Static food) X 2 (Healthy food vs. Unhealthy food) | 9 healthy or unhealthy food pictures | Appeal Perceptions of taste, healthiness, and freshnessAnticipated pleasure of consumption |
| Study 2b | Online panel experiment (N = 216) | 2 (Food in motion vs. Static food) X 2 (Healthy food vs. Unhealthy food) | 6 healthy or unhealthy food pictures | Appeal Perceptions of taste, healthiness, and freshnessAnticipated pleasure of consumption |
| Healthy Food | Unhealthy Food | |||
|---|---|---|---|---|
| Food in motion |  | 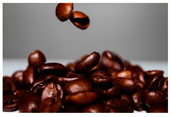 |  | 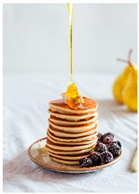 |
| Static food |  |  | 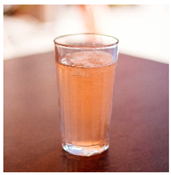 |  |
| Appeal | Taste Perception | Healthiness Perception | Freshness Perception | Anticipated Pleasure | ||||||
|---|---|---|---|---|---|---|---|---|---|---|
| Condition | M | (SD) | M | (SD) | M | (SD) | M | (SD) | M | (SD) |
| Food in Motion | 6.16 | (0.65) | 6.07 | (0.68) | 5.47 | (0.55) | 6.15 | (0.71) | 5.90 | (0.71) |
| Static Food | 6.00 | (0.84) | 5.99 | (0.87) | 5.54 | (0.66) | 6.05 | (0.76) | 5.81 | (0.89) |
| F(1, 154) | ||||||||||
| Motion | 1.48 | 0.29 | 0.74 | 0.45 | 0.23 | |||||
| Covariates | F(1, 154) | |||||||||
| HC | 5.12 * | 1.00 | 0.75 | 1.31 | 1.50 | |||||
| Hunger Level | 0.01 | 0.91 | 0.22 | 0.00 | 3.33 (*) | |||||
| Thirst Level | 10.35 ** | 3.94 * | 1.78 | 2.30 | 5.89 * | |||||
| Healthy Food | Unhealthy Food | |||
|---|---|---|---|---|
| Food in motion | 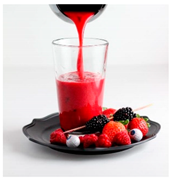 | 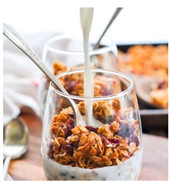 |  |  |
| Static food |  | 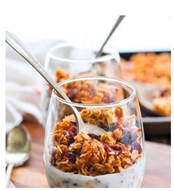 | 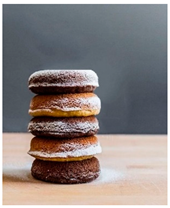 |  |
| Appeal | Taste Perception | Healthiness Perception | Freshness Perception | Anticipated Pleasure | ||||||
|---|---|---|---|---|---|---|---|---|---|---|
| Condition | M | (SD) | M | (SD) | M | (SD) | M | (SD) | M | (SD) |
| Food in Motion | 6.13 | (1.47) | 5.78 | (1.35) | 5.12 | (2.63) | 6.14 | (1.88) | 5.55 | (1.37) |
| Static Food | 5.95 | (1.43) | 5.71 | (1.34) | 4.81 | (2.69) | 6.01 | (1.73) | 5.44 | (1.38) |
| F(1, 244) | ||||||||||
| Motion | 0.70 | 0.13 | 0.92 | 0.05 | 0.31 | |||||
| Covariates | F(1, 244) | |||||||||
| HC | 10.30 ** | 11.12 ** | 0.53 | 0.47 | 7.66 ** | |||||
| Hunger Level | 0.19 | 1.86 | 0.20 | 0.15 | 1.04 | |||||
| Thirst Level | 2.68 | 1.26 | 1.29 | 1.23 | 6.34 * | |||||
| Healthy Food | Unhealthy Food | |||
|---|---|---|---|---|
| Food in motion | 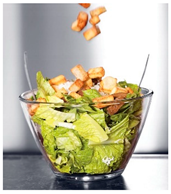 | 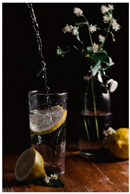 | 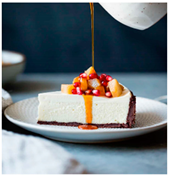 | 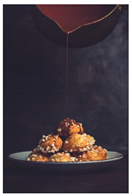 |
| Static food | 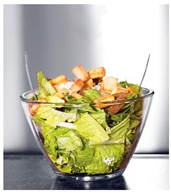 | 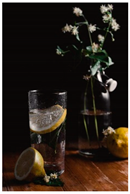 | 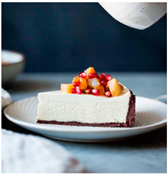 |  |
| Appeal | Taste Perception | Healthiness Perception | Freshness Perception | Anticipated Pleasure | ||||||
|---|---|---|---|---|---|---|---|---|---|---|
| Condition | M | (SD) | M | (SD) | M | (SD) | M | (SD) | M | (SD) |
| Food in Motion | 6.57 | (1.25) | 6.33 | (1.28) | 5.09 | (2.29) | 6.33 | (1.68) | 5.99 | (1.26) |
| Static Food | 6.39 | (1.29) | 6.27 | (1.33) | 5.11 | (2.42) | 6.62 | (1.76) | 5.79 | (1.47) |
| F(1, 209) | ||||||||||
| Motion | 1.58 | 0.48 | 0.12 | 1.05 | 1.90 | |||||
| Covariates | F(1, 209) | |||||||||
| HC | 6.51 * | 5.62 * | 8.12 ** | 12.07 ** | 2.18 | |||||
| Hunger Level | 0.14 | 0.72 | 1.08 | 0.32 | 0.07 | |||||
| Thirst Level | 1.35 | 7.33 ** | 1.12 | 4.05* | 3.35 (*) | |||||
Publisher’s Note: MDPI stays neutral with regard to jurisdictional claims in published maps and institutional affiliations. |
© 2021 by the authors. Licensee MDPI, Basel, Switzerland. This article is an open access article distributed under the terms and conditions of the Creative Commons Attribution (CC BY) license (https://creativecommons.org/licenses/by/4.0/).
Share and Cite
Mulier, L.; Meersseman, E.; Vermeir, I.; Slabbinck, H. Food on the Move: The Impact of Implied Motion in Pictures on Food Perceptions through Anticipated Pleasure of Consumption. Foods 2021, 10, 2194. https://doi.org/10.3390/foods10092194
Mulier L, Meersseman E, Vermeir I, Slabbinck H. Food on the Move: The Impact of Implied Motion in Pictures on Food Perceptions through Anticipated Pleasure of Consumption. Foods. 2021; 10(9):2194. https://doi.org/10.3390/foods10092194
Chicago/Turabian StyleMulier, Lana, Eva Meersseman, Iris Vermeir, and Hendrik Slabbinck. 2021. "Food on the Move: The Impact of Implied Motion in Pictures on Food Perceptions through Anticipated Pleasure of Consumption" Foods 10, no. 9: 2194. https://doi.org/10.3390/foods10092194
APA StyleMulier, L., Meersseman, E., Vermeir, I., & Slabbinck, H. (2021). Food on the Move: The Impact of Implied Motion in Pictures on Food Perceptions through Anticipated Pleasure of Consumption. Foods, 10(9), 2194. https://doi.org/10.3390/foods10092194