Promoting Healthier Drinking Habits: Using Sound to Encourage the Choice for Non-Alcoholic Beers in E-Commerce


Abstract
:1. Introduction
Theoretical Framework
2. Experiment 1
2.1. Materials and Methods
2.1.1. Participants
2.1.2. Materials and Stimuli
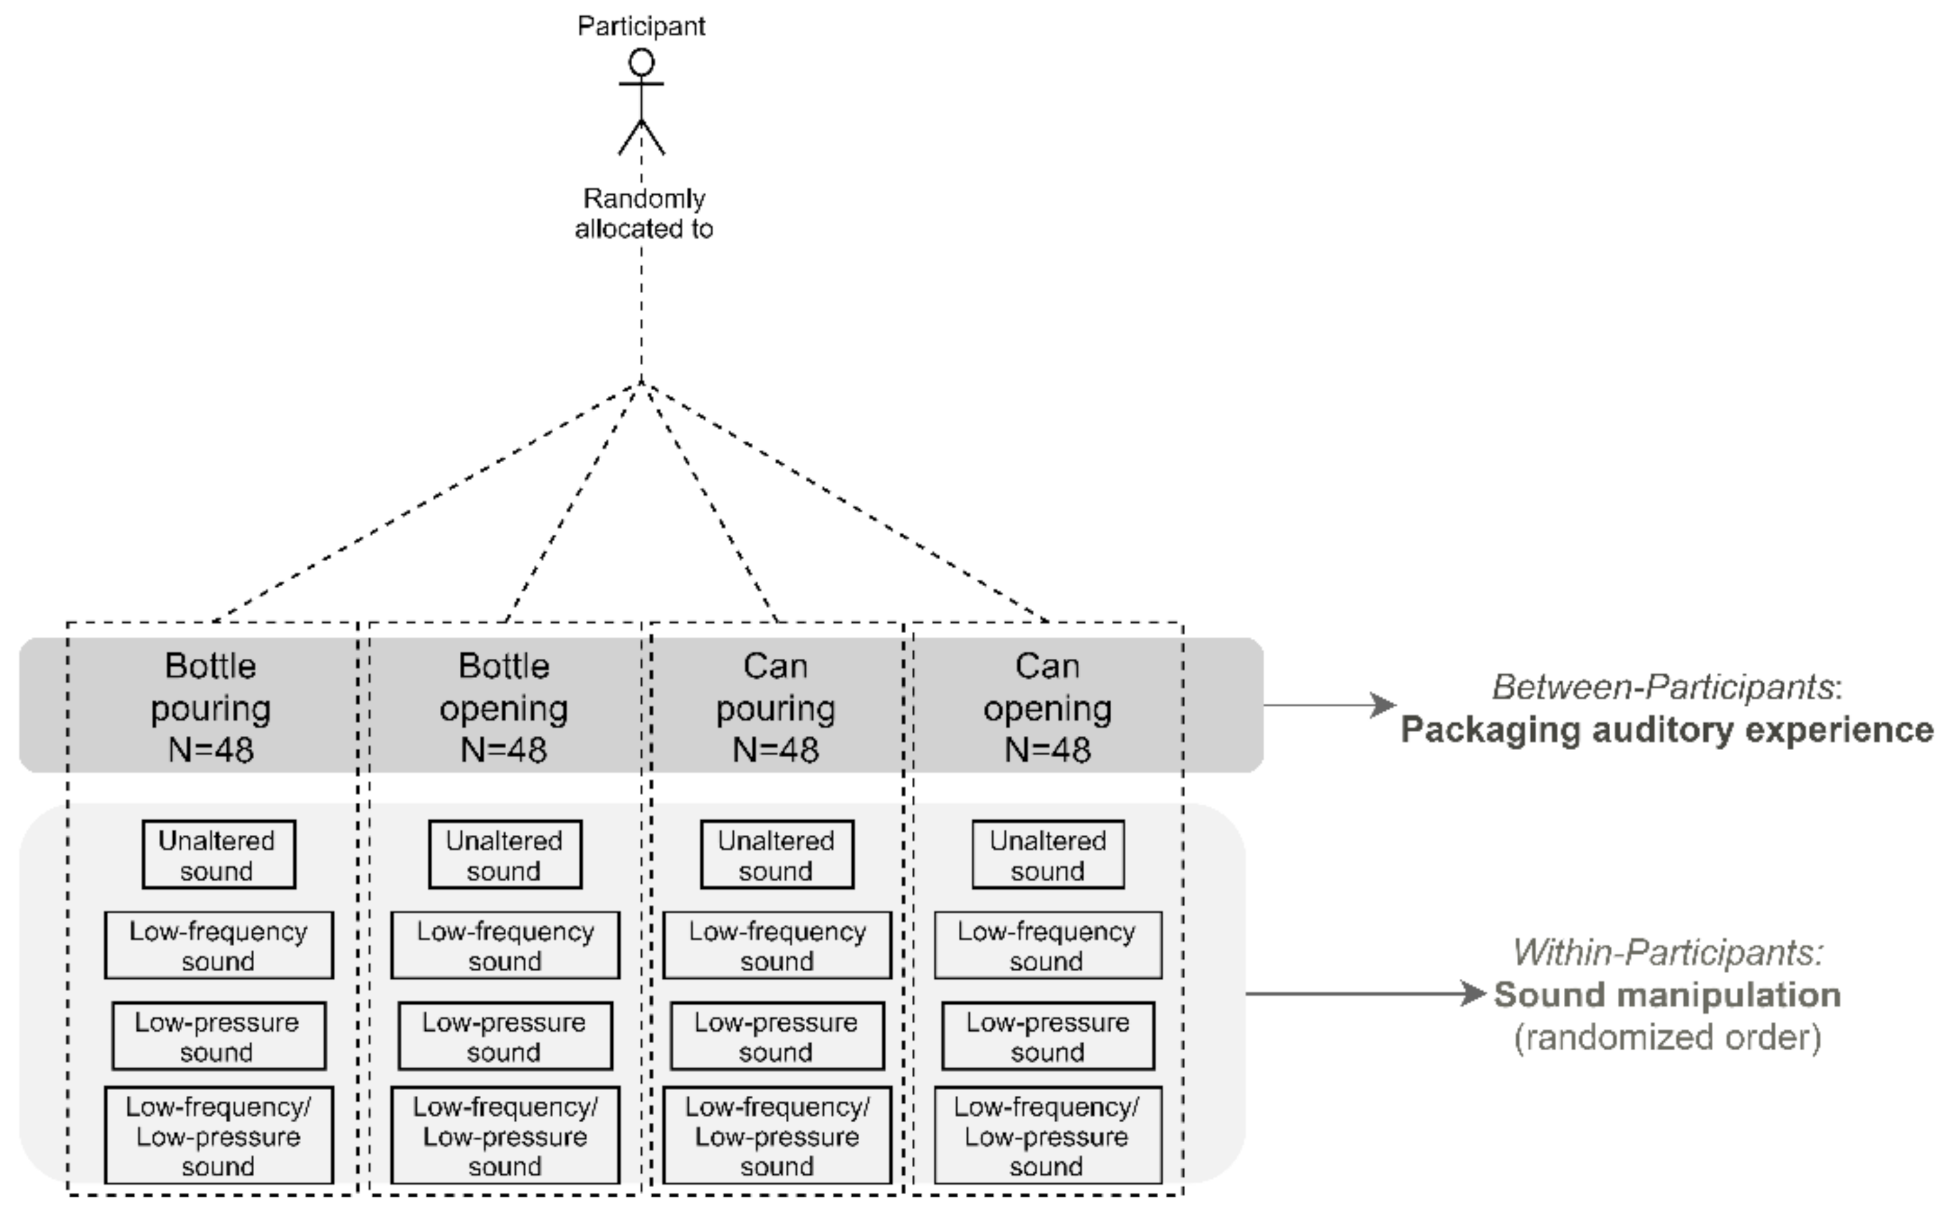
2.1.3. Experimental Design
2.1.4. Procedure
2.1.5. Measures
2.1.6. Data Analysis
2.2. Results
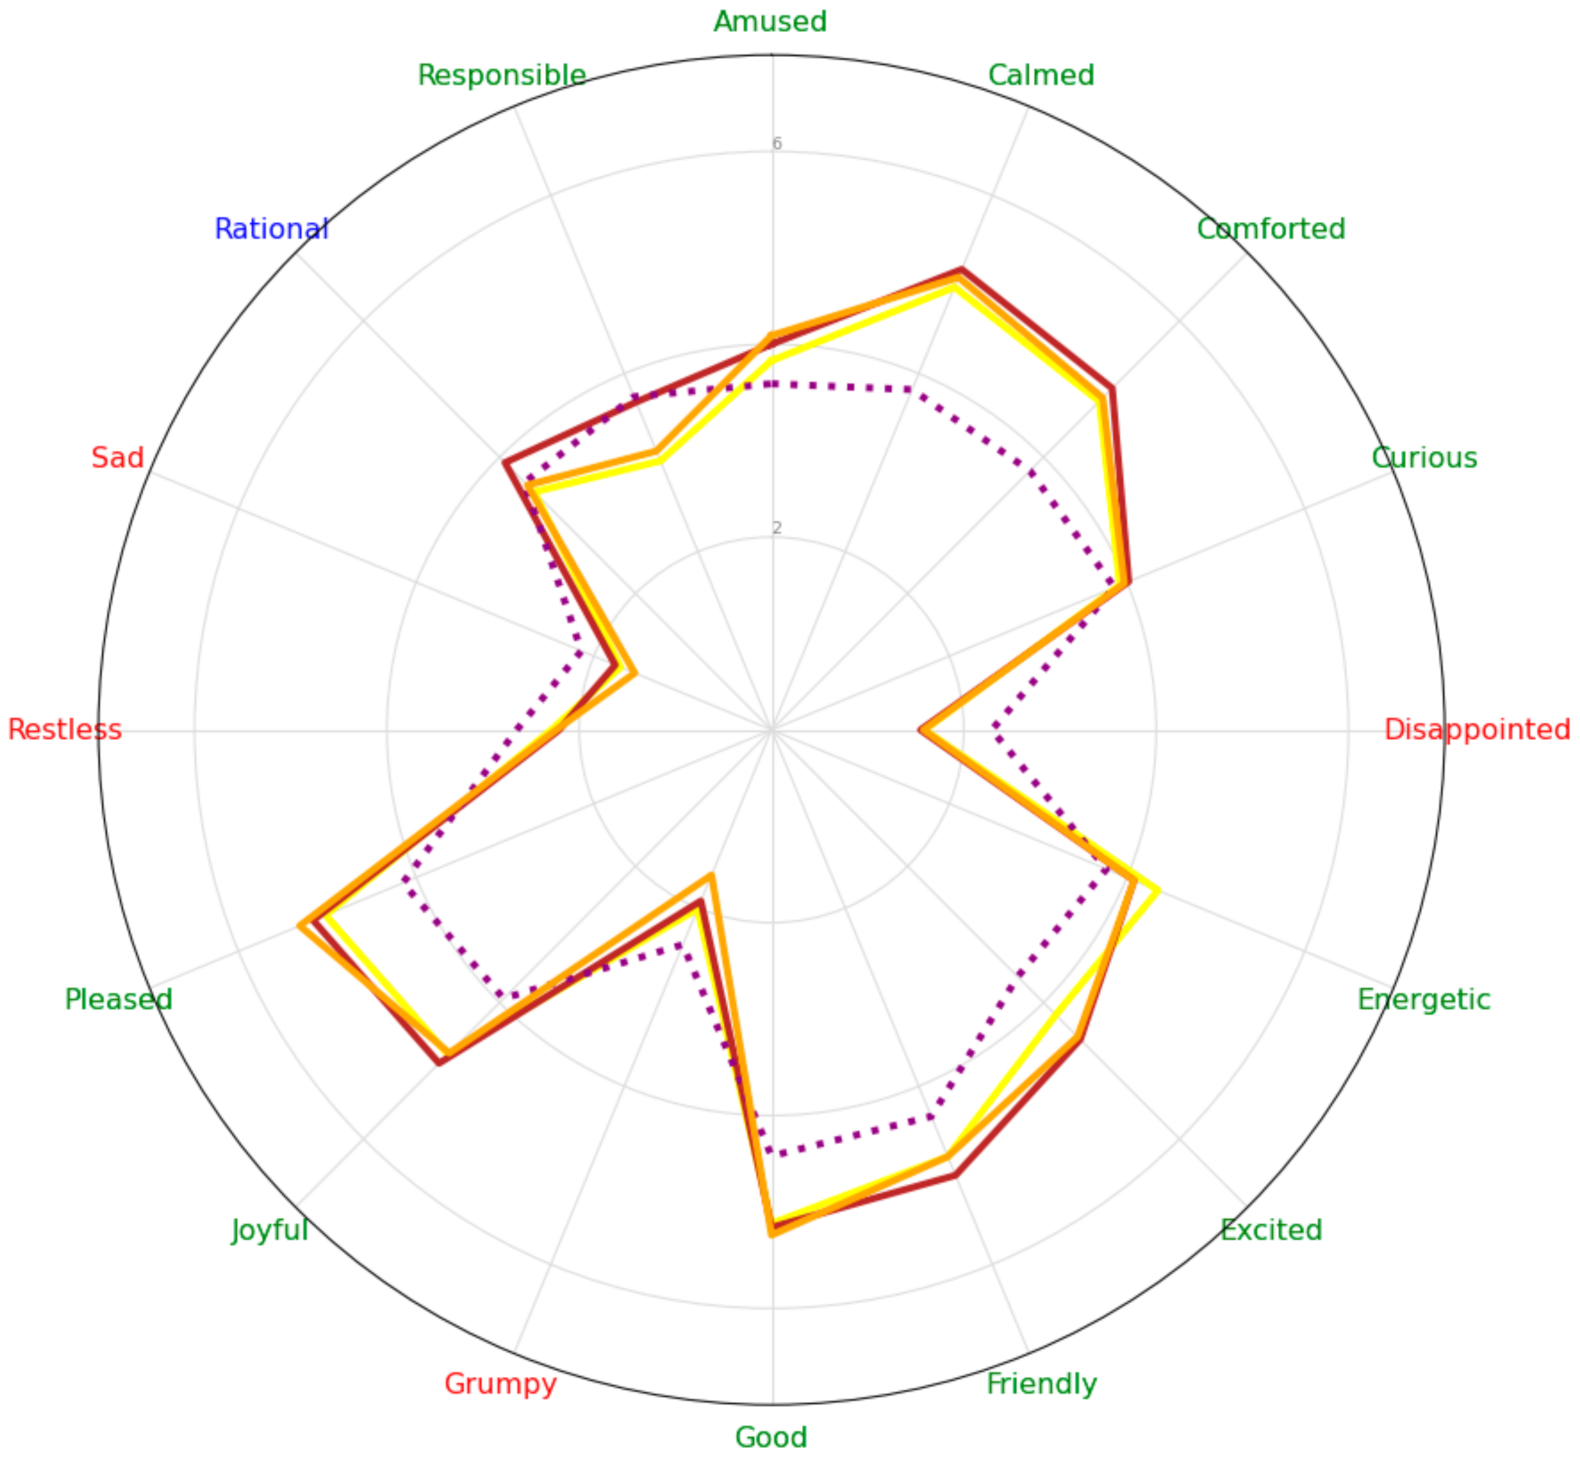
2.2.1. Emotion Scores
2.2.2. Sensory Expectations
3. Experiment 2
3.1. Participants
3.2. Materials and Stimuli
3.2.1. Auditory Stimuli
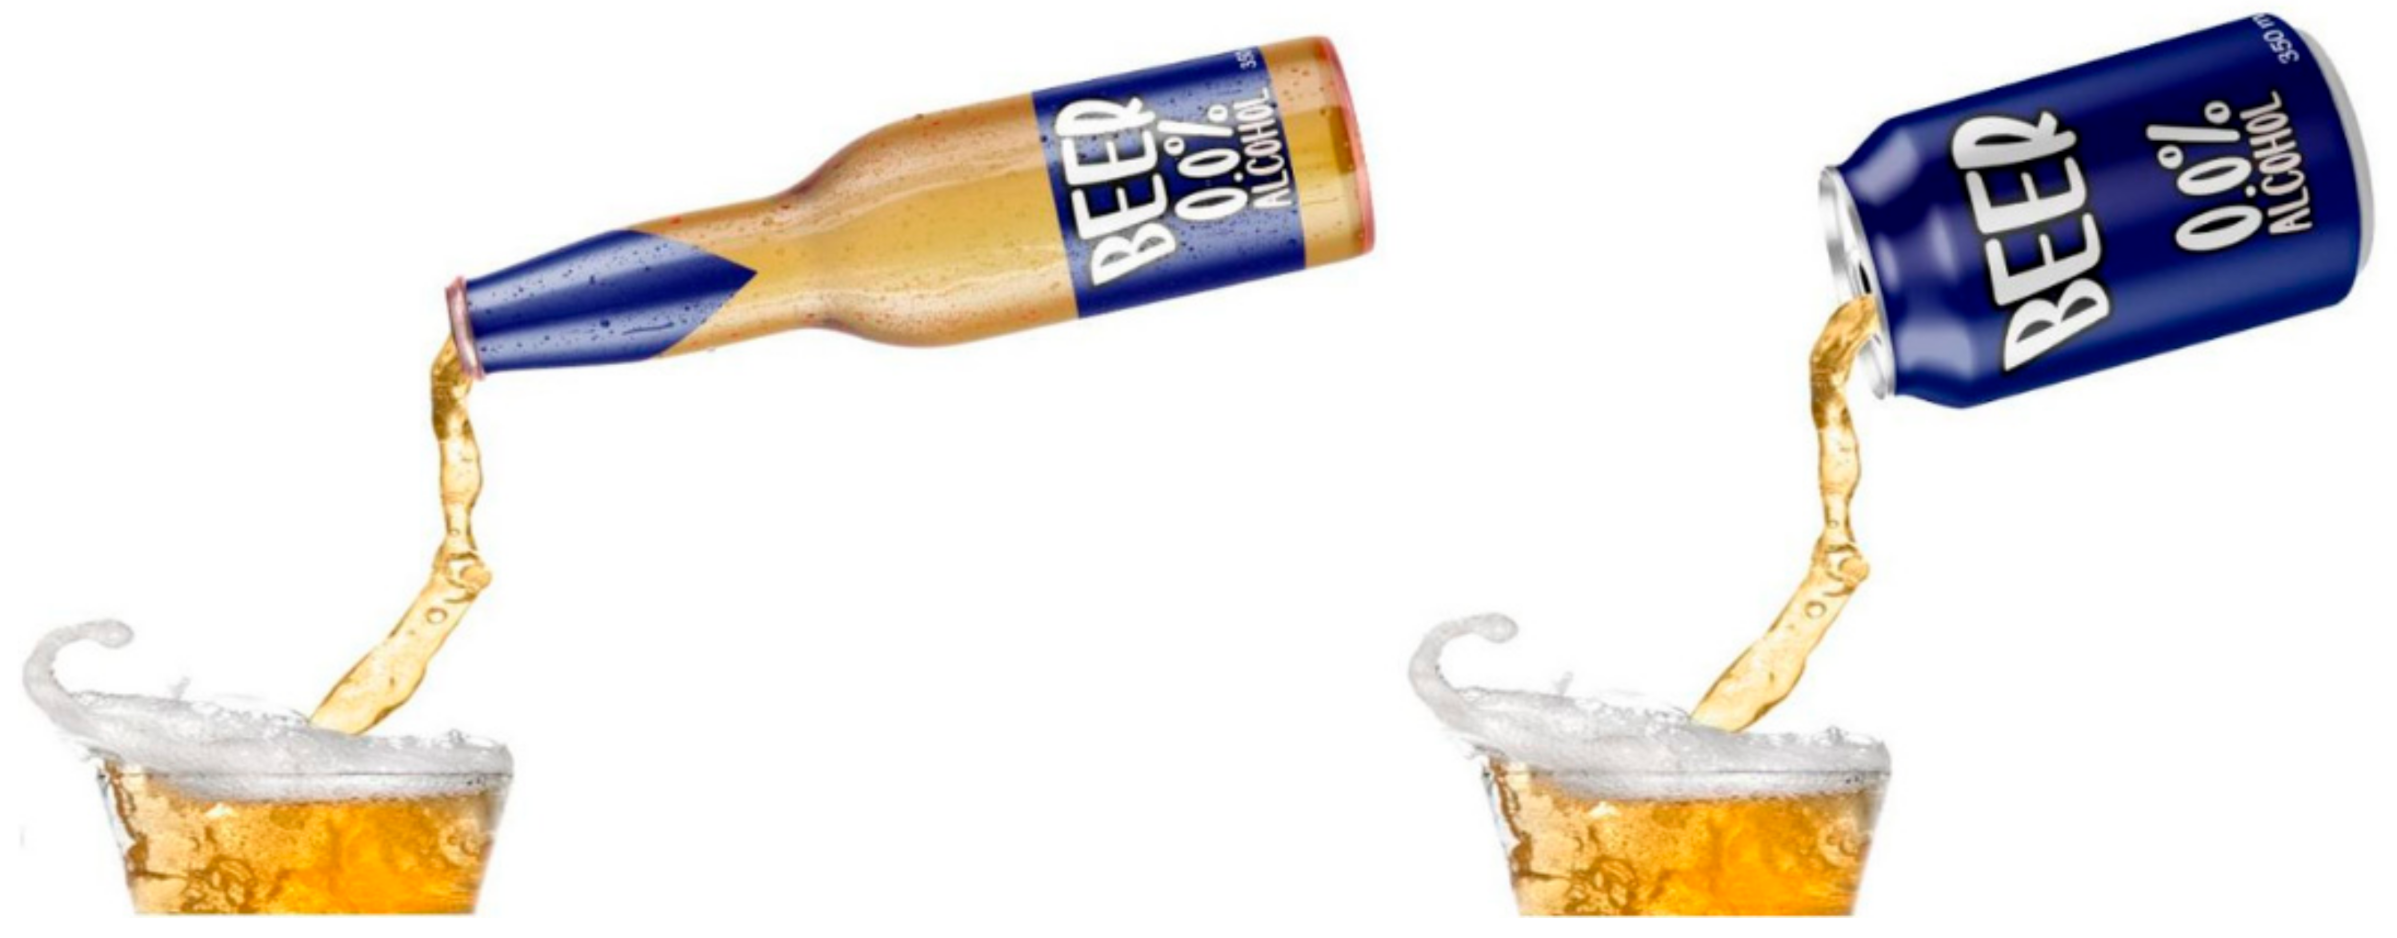
3.2.2. Visual Stimuli
3.3. Methods
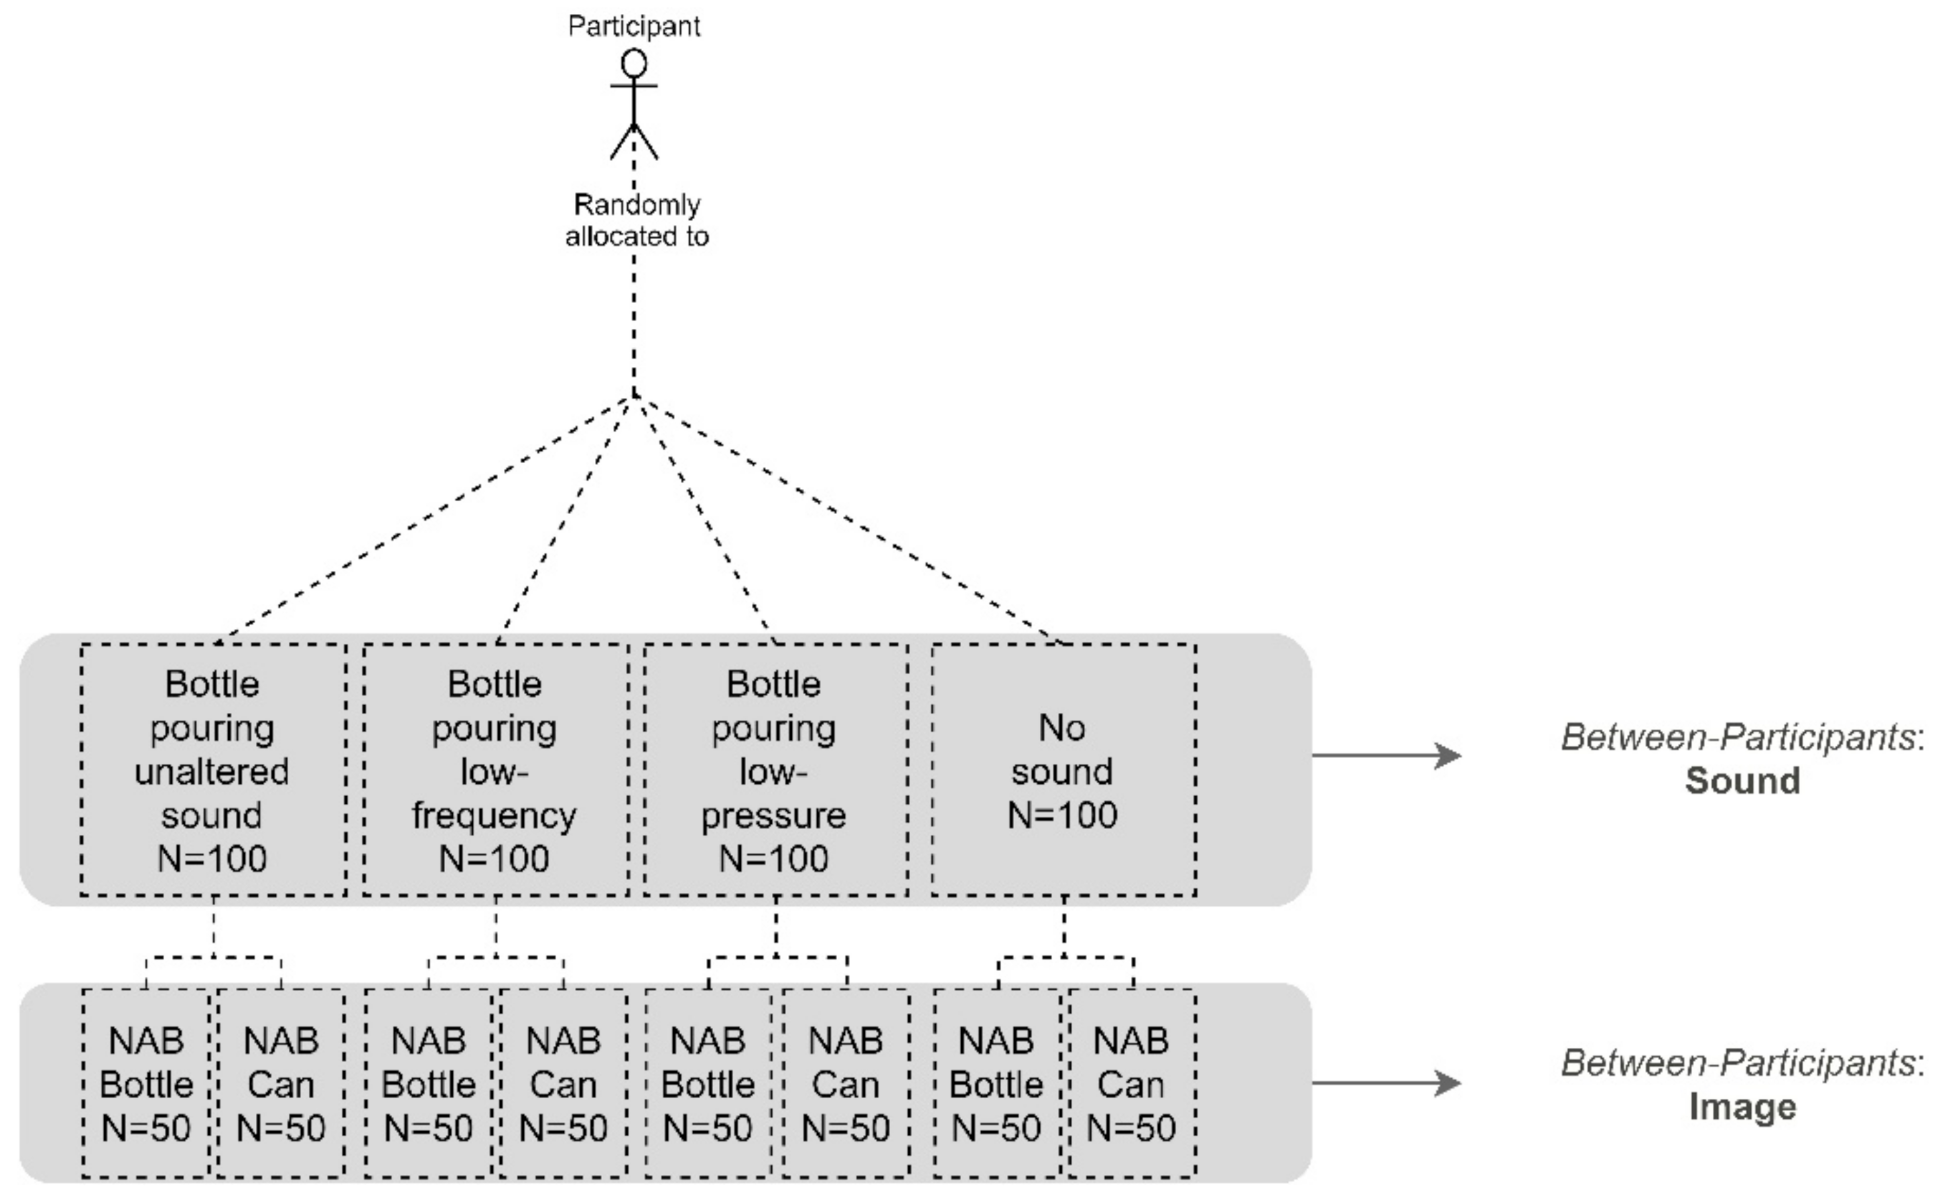
3.3.1. Design
3.3.2. Procedure
3.3.3. Data Analysis
3.4. Results
3.4.1. Emotion Scores
3.4.2. Sensory Expectations
4. Summary of All the Obtained Results
5. Discussion
5.1. The Positive Effect That Experiential Beer Sounds Can Bring to the Experience of Consumers (H1)
5.2. Using Experiential Beer Sounds to Nudge Consumers towards NAB Choices in Digital Shopping Environments (H2)
5.3. General Implications
5.4. Limitations and Future Work
Author Contributions
Funding
Institutional Review Board Statement
Informed Consent Statement
Data Availability Statement
Conflicts of Interest
Appendix A

| Measure | Stimuli | Mean Difference | Std. Error | p-Value | |
|---|---|---|---|---|---|
| Amused | Low-frequency | Low-frequency/low-pressure | 0.73 | 0.14 | <0.01 |
| Low-pressure | 0.46 | 0.14 | 0.01 | ||
| Unaltered | −0.14 | 0.11 | 1.00 | ||
| Low-frequency/low-pressure | Low-frequency | −0.73 | 0.14 | <0.01 | |
| Low-pressure | −0.27 | 0.11 | 0.10 | ||
| Unaltered | −0.87 | 0.13 | <0.01 | ||
| Low-pressure | Low-frequency | −0.46 | 0.14 | 0.01 | |
| Low-frequency/low-pressure | 0.27 | 0.11 | 0.10 | ||
| Unaltered | −0.60 | 0.13 | <0.01 | ||
| Unaltered | Low-frequency | 0.14 | 0.11 | 1.00 | |
| Low-frequency/low-pressure | 0.87 | 0.13 | <0.01 | ||
| Low-pressure | 0.60 | 0.13 | <0.01 | ||
| Calmed | Low-frequency | Low-frequency/low-pressure | 0.03 | 0.13 | 1.00 |
| Low-pressure | −0.18 | 0.13 | 1.00 | ||
| Unaltered | −0.18 | 0.13 | 1.00 | ||
| Low-frequency/low-pressure | Low-frequency | −0.03 | 0.13 | 1.00 | |
| Low-pressure | −0.21 | 0.13 | 0.68 | ||
| Unaltered | −0.21 | 0.13 | 0.69 | ||
| Low-pressure | Low-frequency | 0.18 | 0.13 | 1.00 | |
| Low-frequency/low-pressure | 0.21 | 0.13 | 0.68 | ||
| Unaltered | 0.00 | 0.14 | 1.00 | ||
| Unaltered | Low-frequency | 0.18 | 0.13 | 1.00 | |
| Low-frequency/low-pressure | 0.21 | 0.13 | 0.69 | ||
| Low-pressure | 0.00 | 0.14 | 1.00 | ||
| Comforted | Low-frequency | Low-frequency/low-pressure | 0.49 | 0.14 | <0.01 |
| Low-pressure | 0.14 | 0.15 | 1.00 | ||
| Unaltered | −0.19 | 0.14 | 1.00 | ||
| Low-frequency/low-pressure | Low-frequency | −0.49 | 0.14 | <0.01 | |
| Low-pressure | −0.35 | 0.12 | 0.02 | ||
| Unaltered | −0.68 | 0.14 | <0.01 | ||
| Low-pressure | Low-frequency | −0.14 | 0.15 | 1.00 | |
| Low-frequency/low-pressure | 0.35 | 0.12 | 0.02 | ||
| Unaltered | −0.32 | 0.14 | 0.14 | ||
| Unaltered | Low-frequency | 0.19 | 0.14 | 1.00 | |
| Low-frequency/low-pressure | 0.68 | 0.14 | <0.01 | ||
| Low-pressure | 0.32 | 0.14 | 0.14 | ||
| Curious | Low-frequency | Low-frequency/low-pressure | 0.41 | 0.14 | 0.02 |
| Low-pressure | 0.22 | 0.13 | 0.59 | ||
| Unaltered | −0.15 | 0.14 | 1.00 | ||
| Low-frequency/low-pressure | Low-frequency | −0.41 | 0.14 | 0.02 | |
| Low-pressure | −0.19 | 0.12 | 0.73 | ||
| Unaltered | −0.56 | 0.15 | <0.01 | ||
| Low-pressure | Low-frequency | −0.22 | 0.13 | 0.59 | |
| Low-frequency/low-pressure | 0.19 | 0.12 | 0.73 | ||
| Unaltered | −0.37 | 0.13 | 0.02 | ||
| Unaltered | Low-frequency | 0.15 | 0.14 | 1.00 | |
| Low-frequency/low-pressure | 0.56 | 0.15 | <0.01 | ||
| Low-pressure | 0.37 | 0.13 | 0.02 | ||
| Disappointed | Low-frequency | Low-frequency/low-pressure | −0.40 | 0.14 | 0.03 |
| Low-pressure | −0.05 | 0.14 | 1.00 | ||
| Unaltered | 0.29 | 0.12 | 0.12 | ||
| Low-frequency/low-pressure | Low-frequency | 0.40 | 0.14 | 0.03 | |
| Low-pressure | 0.35 | 0.12 | 0.03 | ||
| Unaltered | 0.69 | 0.15 | <0.01 | ||
| Low-pressure | Low-frequency | 0.05 | 0.14 | 1.00 | |
| Low-frequency/low-pressure | −0.35 | 0.12 | 0.03 | ||
| Unaltered | 0.34 | 0.13 | 0.08 | ||
| Unaltered | Low-frequency | −0.29 | 0.12 | 0.12 | |
| Low-frequency/low-pressure | −0.69 | 0.15 | <0.01 | ||
| Low-pressure | −0.34 | 0.13 | 0.08 | ||
| Energetic | Low-frequency | Low-frequency/low-pressure | 0.70 | 0.13 | <0.01 |
| Low-pressure | 0.38 | 0.13 | 0.03 | ||
| Unaltered | −0.35 | 0.12 | 0.03 | ||
| Low-frequency/low-pressure | Low-frequency | −0.70 | 0.13 | <0.01 | |
| Low-pressure | −0.32 | 0.10 | 0.02 | ||
| Unaltered | −1.05 | 0.14 | <0.01 | ||
| Low-pressure | Low-frequency | −0.38 | 0.13 | 0.03 | |
| Low-frequency/low-pressure | 0.32 | 0.10 | 0.02 | ||
| Unaltered | −0.73 | 0.13 | <0.01 | ||
| Unaltered | Low-frequency | 0.35 | 0.12 | 0.03 | |
| Low-frequency/low-pressure | 1.05 | 0.14 | <0.01 | ||
| Low-pressure | 0.73 | 0.13 | <0.01 | ||
| Excited | Low-frequency | Low-frequency/low-pressure | 0.60 | 0.13 | <0.01 |
| Low-pressure | 0.30 | 0.14 | 0.17 | ||
| Unaltered | −0.11 | 0.12 | 1.00 | ||
| Low-frequency/low-pressure | Low-frequency | −0.60 | 0.13 | <0.01 | |
| Low-pressure | −0.30 | 0.11 | 0.05 | ||
| Unaltered | −0.71 | 0.15 | <0.01 | ||
| Low-pressure | Low-frequency | −0.30 | 0.14 | 0.17 | |
| Low-frequency/low-pressure | 0.30 | 0.11 | 0.05 | ||
| Unaltered | −0.42 | 0.14 | 0.02 | ||
| Unaltered | Low-frequency | 0.11 | 0.12 | 1.00 | |
| Low-frequency/low-pressure | 0.71 | 0.15 | <0.01 | ||
| Low-pressure | 0.42 | 0.14 | 0.02 | ||
| Friendly | Low-frequency | Low-frequency/low-pressure | 0.45 | 0.13 | <0.01 |
| Low-pressure | 0.06 | 0.12 | 1.00 | ||
| Unaltered | −0.23 | 0.11 | 0.21 | ||
| Low-frequency/low-pressure | Low-frequency | −0.45 | 0.13 | <0.01 | |
| Low-pressure | −0.39 | 0.10 | <0.01 | ||
| Unaltered | −0.68 | 0.13 | <0.01 | ||
| Low-pressure | Low-frequency | −0.06 | 0.12 | 1.00 | |
| Low-frequency/low-pressure | 0.39 | 0.10 | <0.01 | ||
| Unaltered | −0.30 | 0.11 | 0.06 | ||
| Unaltered | Low-frequency | 0.23 | 0.11 | 0.21 | |
| Low-frequency/low-pressure | 0.68 | 0.13 | <0.01 | ||
| Low-pressure | 0.30 | 0.11 | 0.06 | ||
| Good | Low-frequency | Low-frequency/low-pressure | 0.31 | 0.12 | 0.06 |
| Low-pressure | 0.09 | 0.12 | 1.00 | ||
| Unaltered | −0.18 | 0.11 | 0.60 | ||
| Low-frequency/low-pressure | Low-frequency | −0.31 | 0.12 | 0.06 | |
| Low-pressure | −0.22 | 0.11 | 0.24 | ||
| Unaltered | −0.50 | 0.13 | <0.01 | ||
| Low-pressure | Low-frequency | −0.09 | 0.12 | 1.00 | |
| Low-frequency/low-pressure | 0.22 | 0.11 | 0.24 | ||
| Unaltered | −0.28 | 0.13 | 0.21 | ||
| Unaltered | Low-frequency | 0.18 | 0.11 | 0.60 | |
| Low-frequency/low-pressure | 0.50 | 0.13 | <0.01 | ||
| Low-pressure | 0.28 | 0.13 | 0.21 | ||
| Grumpy | Low-frequency | Low-frequency/low-pressure | −0.06 | 0.12 | 1.00 |
| Low-pressure | 0.24 | 0.11 | 0.21 | ||
| Unaltered | 0.18 | 0.12 | 0.78 | ||
| Low-frequency/low-pressure | Low-frequency | 0.06 | 0.12 | 1.00 | |
| Low-pressure | 0.30 | 0.10 | 0.03 | ||
| Unaltered | 0.23 | 0.12 | 0.32 | ||
| Low-pressure | Low-frequency | −0.24 | 0.11 | 0.21 | |
| Low-frequency/low-pressure | −0.30 | 0.10 | 0.03 | ||
| Unaltered | −0.06 | 0.12 | 1.00 | ||
| Unaltered | Low-frequency | −0.18 | 0.12 | 0.78 | |
| Low-frequency/low-pressure | −0.23 | 0.12 | 0.32 | ||
| Low-pressure | 0.06 | 0.12 | 1.00 | ||
| Joyful | Low-frequency | Low-frequency/low-pressure | 0.58 | 0.13 | <0.01 |
| Low-pressure | 0.23 | 0.12 | 0.31 | ||
| Unaltered | −0.16 | 0.11 | 0.86 | ||
| Low-frequency/low-pressure | Low-frequency | −0.58 | 0.13 | <0.01 | |
| Low-pressure | −0.34 | 0.11 | 0.01 | ||
| Unaltered | −0.74 | 0.14 | <0.01 | ||
| Low-pressure | Low-frequency | −0.23 | 0.12 | 0.31 | |
| Low-frequency/low-pressure | 0.34 | 0.11 | 0.01 | ||
| Unaltered | −0.40 | 0.13 | 0.02 | ||
| Unaltered | Low-frequency | 0.16 | 0.11 | 0.86 | |
| Low-frequency/low-pressure | 0.74 | 0.14 | <0.01 | ||
| Low-pressure | 0.40 | 0.13 | 0.02 | ||
| Pleased | Low-frequency | Low-frequency/low-pressure | 0.62 | 0.14 | <0.01 |
| Low-pressure | 0.31 | 0.14 | 0.18 | ||
| Unaltered | −0.18 | 0.13 | 0.96 | ||
| Low-frequency/low-pressure | Low-frequency | −0.62 | 0.14 | <0.01 | |
| Low-pressure | −0.31 | 0.13 | 0.11 | ||
| Unaltered | −0.80 | 0.16 | <0.01 | ||
| Low-pressure | Low-frequency | −0.31 | 0.14 | 0.18 | |
| Low-frequency/low-pressure | 0.31 | 0.13 | 0.11 | ||
| Unaltered | −0.50 | 0.14 | <0.01 | ||
| Unaltered | Low-frequency | 0.18 | 0.13 | 0.96 | |
| Low-frequency/low-pressure | 0.80 | 0.16 | <0.01 | ||
| Low-pressure | 0.50 | 0.14 | <0.01 | ||
| Restless | Low-frequency | Low-frequency/low-pressure | 0.11 | 0.13 | 1.00 |
| Low-pressure | 0.12 | 0.12 | 1.00 | ||
| Unaltered | 0.10 | 0.12 | 1.00 | ||
| Low-frequency/low-pressure | Low-frequency | −0.11 | 0.13 | 1.00 | |
| Low-pressure | 0.01 | 0.13 | 1.00 | ||
| Unaltered | −0.01 | 0.13 | 1.00 | ||
| Low-pressure | Low-frequency | −0.12 | 0.12 | 1.00 | |
| Low-frequency/low-pressure | −0.01 | 0.13 | 1.00 | ||
| Unaltered | −0.02 | 0.13 | 1.00 | ||
| Unaltered | Low-frequency | −0.10 | 0.12 | 1.00 | |
| Low-frequency/low-pressure | 0.01 | 0.13 | 1.00 | ||
| Low-pressure | 0.02 | 0.13 | 1.00 | ||
| Sad | Low-frequency | Low-frequency/low-pressure | −0.30 | 0.10 | 0.03 |
| Low-pressure | 0.05 | 0.10 | 1.00 | ||
| Unaltered | 0.22 | 0.09 | 0.11 | ||
| Low-frequency/low-pressure | Low-frequency | 0.30 | 0.10 | 0.03 | |
| Low-pressure | 0.35 | 0.11 | 0.01 | ||
| Unaltered | 0.52 | 0.10 | <0.01 | ||
| Low-pressure | Low-frequency | −0.05 | 0.10 | 1.00 | |
| Low-frequency/low-pressure | −0.35 | 0.11 | 0.01 | ||
| Unaltered | 0.17 | 0.09 | 0.32 | ||
| Unaltered | Low-frequency | −0.22 | 0.09 | 0.11 | |
| Low-frequency/low-pressure | −0.52 | 0.10 | <0.01 | ||
| Low-pressure | −0.17 | 0.09 | 0.32 | ||
| Rational | Low-frequency | Low-frequency/low-pressure | 0.10 | 0.11 | 1.00 |
| Low-pressure | 0.19 | 0.10 | 0.40 | ||
| Unaltered | 0.07 | 0.12 | 1.00 | ||
| Low-frequency/low-pressure | Low-frequency | −0.10 | 0.11 | 1.00 | |
| Low-pressure | 0.09 | 0.11 | 1.00 | ||
| Unaltered | −0.03 | 0.11 | 1.00 | ||
| Low-pressure | Low-frequency | −0.19 | 0.10 | 0.40 | |
| Low-frequency/low-pressure | −0.09 | 0.11 | 1.00 | ||
| Unaltered | −0.12 | 0.12 | 1.00 | ||
| Unaltered | Low-frequency | −0.07 | 0.12 | 1.00 | |
| Low-frequency/low-pressure | 0.03 | 0.11 | 1.00 | ||
| Low-pressure | 0.12 | 0.12 | 1.00 | ||
| Responsible | Low-frequency | Low-frequency/low-pressure | −0.10 | 0.11 | 1.00 |
| Low-pressure | −0.08 | 0.10 | 1.00 | ||
| Unaltered | 0.18 | 0.09 | 0.36 | ||
| Low-frequency/low-pressure | Low-frequency | 0.10 | 0.11 | 1.00 | |
| Low-pressure | 0.02 | 0.10 | 1.00 | ||
| Unaltered | 0.28 | 0.10 | 0.04 | ||
| Low-pressure | Low-frequency | 0.08 | 0.10 | 1.00 | |
| Low-frequency/low-pressure | −0.02 | 0.10 | 1.00 | ||
| Unaltered | 0.26 | 0.10 | 0.08 | ||
| Unaltered | Low-frequency | −0.18 | 0.09 | 0.36 | |
| Low-frequency/low-pressure | −0.28 | 0.10 | 0.04 | ||
| Low-pressure | −0.26 | 0.10 | 0.08 | ||
| Measure | Stimuli | Mean Difference | Std. Error | p-Value | |
|---|---|---|---|---|---|
| Amused | Bottle opening | Bottle pouring | −0.82 | 0.31 | 0.05 |
| Can opening | 0.15 | 0.31 | 1.00 | ||
| Can pouring | −0.22 | 0.31 | 1.00 | ||
| Bottle pouring | Bottle opening | 0.82 | 0.31 | 0.05 | |
| Can opening | 0.97 | 0.31 | 0.01 | ||
| Can pouring | 0.59 | 0.31 | 0.33 | ||
| Can opening | Bottle opening | −0.15 | 0.31 | 1.00 | |
| Bottle pouring | −0.97 | 0.31 | 0.01 | ||
| Can pouring | −0.38 | 0.31 | 1.00 | ||
| Can pouring | Bottle opening | 0.22 | 0.31 | 1.00 | |
| Bottle pouring | −0.59 | 0.31 | 0.33 | ||
| Can opening | 0.38 | 0.31 | 1.00 | ||
| Calmed | Bottle opening | Bottle pouring | −0.78 | 0.28 | 0.03 |
| Can opening | 0.14 | 0.28 | 1.00 | ||
| Can pouring | −0.16 | 0.28 | 1.00 | ||
| Bottle pouring | Bottle opening | 0.78 | 0.28 | 0.03 | |
| Can opening | 0.92 | 0.28 | 0.01 | ||
| Can pouring | 0.62 | 0.28 | 0.16 | ||
| Can opening | Bottle opening | −0.14 | 0.28 | 1.00 | |
| Bottle pouring | −0.92 | 0.28 | 0.01 | ||
| Can pouring | −0.30 | 0.28 | 1.00 | ||
| Can pouring | Bottle opening | 0.16 | 0.28 | 1.00 | |
| Bottle pouring | −0.62 | 0.28 | 0.16 | ||
| Can opening | 0.30 | 0.28 | 1.00 | ||
| Comforted | Bottle opening | Bottle pouring | −1.09 | 0.29 | <0.01 |
| Can opening | −0.07 | 0.29 | 1.00 | ||
| Can pouring | −0.36 | 0.29 | 1.00 | ||
| Bottle pouring | Bottle opening | 1.09 | 0.29 | <0.01 | |
| Can opening | 1.02 | 0.29 | <0.01 | ||
| Can pouring | 0.72 | 0.29 | 0.07 | ||
| Can opening | Bottle opening | 0.07 | 0.29 | 1.00 | |
| Bottle pouring | −1.02 | 0.29 | <0.01 | ||
| Can pouring | −0.30 | 0.29 | 1.00 | ||
| Can pouring | Bottle opening | 0.36 | 0.29 | 1.00 | |
| Bottle pouring | −0.72 | 0.29 | 0.07 | ||
| Can opening | 0.30 | 0.29 | 1.00 | ||
| Curious | Bottle opening | Bottle pouring | −0.64 | 0.31 | 0.24 |
| Can opening | 0.07 | 0.31 | 1.00 | ||
| Can pouring | −0.52 | 0.31 | 0.56 | ||
| Bottle pouring | Bottle opening | 0.64 | 0.31 | 0.24 | |
| Can opening | 0.71 | 0.31 | 0.13 | ||
| Can pouring | 0.12 | 0.31 | 1.00 | ||
| Can opening | Bottle opening | −0.07 | 0.31 | 1.00 | |
| Bottle pouring | −0.71 | 0.31 | 0.13 | ||
| Can pouring | −0.59 | 0.31 | 0.33 | ||
| Can pouring | Bottle opening | 0.52 | 0.31 | 0.56 | |
| Bottle pouring | −0.12 | 0.31 | 1.00 | ||
| Can opening | 0.59 | 0.31 | 0.33 | ||
| Disappointed | Bottle opening | Bottle pouring | 0.39 | 0.25 | 0.72 |
| Can opening | −0.64 | 0.25 | 0.07 | ||
| Can pouring | −0.23 | 0.25 | 1.00 | ||
| Bottle pouring | Bottle opening | −0.39 | 0.25 | 0.72 | |
| Can opening | −10.03 | 0.25 | <0.01 | ||
| Can pouring | −0.62 | 0.25 | 0.08 | ||
| Can opening | Bottle opening | 0.64 | 0.25 | 0.07 | |
| Bottle pouring | 10.03 | 0.25 | <0.01 | ||
| Can pouring | 0.41 | 0.25 | 0.61 | ||
| Can pouring | Bottle opening | 0.23 | 0.25 | 1.00 | |
| Bottle pouring | 0.62 | 0.25 | 0.08 | ||
| Can opening | −0.41 | 0.25 | 0.61 | ||
| Energetic | Bottle opening | Bottle pouring | −0.25 | 0.31 | 1.00 |
| Can opening | 0.47 | 0.31 | 0.76 | ||
| Can pouring | 0.16 | 0.31 | 1.00 | ||
| Bottle pouring | Bottle opening | 0.25 | 0.31 | 1.00 | |
| Can opening | 0.72 | 0.31 | 0.12 | ||
| Can pouring | 0.41 | 0.31 | 1.00 | ||
| Can opening | Bottle opening | −0.47 | 0.31 | 0.76 | |
| Bottle pouring | −0.72 | 0.31 | 0.12 | ||
| Can pouring | −0.31 | 0.31 | 1.00 | ||
| Can pouring | Bottle opening | −0.16 | 0.31 | 1.00 | |
| Bottle pouring | −0.41 | 0.31 | 1.00 | ||
| Can opening | 0.31 | 0.31 | 1.00 | ||
| Excited | Bottle opening | Bottle pouring | −0.74 | 0.31 | 0.11 |
| Can opening | 0.37 | 0.31 | 1.00 | ||
| Can pouring | 0.22 | 0.31 | 1.00 | ||
| Bottle pouring | Bottle opening | 0.74 | 0.31 | 0.11 | |
| Can opening | 10.11 | 0.31 | <0.01 | ||
| Can pouring | 0.96 | 0.31 | 0.01 | ||
| Can opening | Bottle opening | −0.37 | 0.31 | 1.00 | |
| Bottle pouring | −1.11 | 0.31 | <0.01 | ||
| Can pouring | −0.15 | 0.31 | 1.00 | ||
| Can pouring | Bottle opening | −0.22 | 0.31 | 1.00 | |
| Bottle pouring | −0.96 | 0.31 | 0.01 | ||
| Can opening | 0.15 | 0.31 | 1.00 | ||
| Friendly | Bottle opening | Bottle pouring | −0.77 | 0.32 | 0.09 |
| Can opening | 0.35 | 0.32 | 1.00 | ||
| Can pouring | −0.05 | 0.32 | 1.00 | ||
| Bottle pouring | Bottle opening | 0.77 | 0.32 | 0.09 | |
| Can opening | 1.12 | 0.32 | <0.01 | ||
| Can pouring | 0.72 | 0.32 | 0.14 | ||
| Can opening | Bottle opening | −0.35 | 0.32 | 1.00 | |
| Bottle pouring | −1.12 | 0.32 | <0.01 | ||
| Can pouring | −0.40 | 0.32 | 1.00 | ||
| Can pouring | Bottle opening | 0.05 | 0.32 | 1.00 | |
| Bottle pouring | −0.72 | 0.32 | 0.14 | ||
| Can opening | 0.40 | 0.32 | 1.00 | ||
| Good | Bottle opening | Bottle pouring | −0.74 | 0.27 | 0.04 |
| Can opening | 0.50 | 0.27 | 0.39 | ||
| Can pouring | −0.02 | 0.27 | 1.00 | ||
| Bottle pouring | Bottle opening | 0.74 | 0.27 | 0.04 | |
| Can opening | 1.24 | 0.27 | <0.01 | ||
| Can pouring | 0.72 | 0.27 | 0.05 | ||
| Can opening | Bottle opening | −0.50 | 0.27 | 0.39 | |
| Bottle pouring | −1.24 | 0.27 | <0.01 | ||
| Can pouring | −0.52 | 0.27 | 0.35 | ||
| Can pouring | Bottle opening | 0.02 | 0.27 | 1.00 | |
| Bottle pouring | −0.72 | 0.27 | 0.05 | ||
| Can opening | 0.52 | 0.27 | 0.35 | ||
| Grumpy | Bottle opening | Bottle pouring | 0.30 | 0.22 | 1.00 |
| Can opening | −0.24 | 0.22 | 1.00 | ||
| Can pouring | −0.46 | 0.22 | 0.23 | ||
| Bottle pouring | Bottle opening | −0.30 | 0.22 | 1.00 | |
| Can opening | −0.54 | 0.22 | 0.10 | ||
| Can pouring | −0.76 | 0.22 | <0.01 | ||
| Can opening | Bottle opening | 0.24 | 0.22 | 1.00 | |
| Bottle pouring | 0.54 | 0.22 | 0.10 | ||
| Can pouring | −0.22 | 0.22 | 1.00 | ||
| Can pouring | Bottle opening | 0.46 | 0.22 | 0.23 | |
| Bottle pouring | 0.76 | 0.22 | <0.01 | ||
| Can opening | 0.22 | 0.22 | 1.00 | ||
| Joyful | Bottle opening | Bottle pouring | −0.61 | 0.31 | 0.28 |
| Can opening | 0.31 | 0.31 | 1.00 | ||
| Can pouring | 0.08 | 0.31 | 1.00 | ||
| Bottle pouring | Bottle opening | 0.61 | 0.31 | 0.28 | |
| Can opening | 0.92 | 0.31 | 0.02 | ||
| Can pouring | 0.69 | 0.31 | 0.15 | ||
| Can opening | Bottle opening | −0.31 | 0.31 | 1.00 | |
| Bottle pouring | −0.92 | 0.31 | 0.02 | ||
| Can pouring | −0.23 | 0.31 | 1.00 | ||
| Can pouring | Bottle opening | −0.08 | 0.31 | 1.00 | |
| Bottle pouring | −0.69 | 0.31 | 0.15 | ||
| Can opening | 0.23 | 0.31 | 1.00 | ||
| Pleased | Bottle opening | Bottle pouring | −1.08 | 0.29 | <0.01 |
| Can opening | 0.22 | 0.29 | 1.00 | ||
| Can pouring | −0.15 | 0.29 | 1.00 | ||
| Bottle pouring | Bottle opening | 1.08 | 0.29 | <0.01 | |
| Can opening | 1.30 | 0.29 | <0.01 | ||
| Can pouring | 0.93 | 0.29 | 0.01 | ||
| Can opening | Bottle opening | −0.22 | 0.29 | 1.00 | |
| Bottle pouring | −1.30 | 0.29 | <0.01 | ||
| Can pouring | −0.37 | 0.29 | 1.00 | ||
| Can pouring | Bottle opening | 0.15 | 0.29 | 1.00 | |
| Bottle pouring | −0.93 | 0.29 | 0.01 | ||
| Can opening | 0.37 | 0.29 | 1.00 | ||
| Restless | Bottle opening | Bottle pouring | 0.27 | 0.25 | 1.00 |
| Can opening | −0.27 | 0.25 | 1.00 | ||
| Can pouring | −0.61 | 0.25 | 0.09 | ||
| Bottle pouring | Bottle opening | −0.27 | 0.25 | 1.00 | |
| Can opening | −0.54 | 0.25 | 0.20 | ||
| Can pouring | −0.89 | 0.25 | <0.01 | ||
| Can opening | Bottle opening | 0.27 | 0.25 | 1.00 | |
| Bottle pouring | 0.54 | 0.25 | 0.20 | ||
| Can pouring | −0.35 | 0.25 | 1.00 | ||
| Can pouring | Bottle opening | 0.61 | 0.25 | 0.09 | |
| Bottle pouring | 0.89 | 0.25 | <0.01 | ||
| Can opening | 0.35 | 0.25 | 1.00 | ||
| Sad | Bottle opening | Bottle pouring | 0.24 | 0.20 | 1.00 |
| Can opening | −0.24 | 0.20 | 1.00 | ||
| Can pouring | −0.25 | 0.20 | 1.00 | ||
| Bottle pouring | Bottle opening | −0.24 | 0.20 | 1.00 | |
| Can opening | −0.48 | 0.20 | 0.09 | ||
| Can pouring | −0.49 | 0.20 | 0.08 | ||
| Can opening | Bottle opening | 0.24 | 0.20 | 1.00 | |
| Bottle pouring | 0.48 | 0.20 | 0.09 | ||
| Can pouring | −0.01 | 0.20 | 1.00 | ||
| Can pouring | Bottle opening | 0.25 | 0.20 | 1.00 | |
| Bottle pouring | 0.49 | 0.20 | 0.08 | ||
| Can opening | 0.01 | 0.20 | 1.00 | ||
| Rational | Bottle opening | Bottle pouring | −0.52 | 0.28 | 0.37 |
| Can opening | −0.05 | 0.28 | 1.00 | ||
| Can pouring | −0.71 | 0.28 | 0.07 | ||
| Bottle pouring | Bottle opening | 0.52 | 0.28 | 0.37 | |
| Can opening | 0.47 | 0.28 | 0.56 | ||
| Can pouring | −0.19 | 0.28 | 1.00 | ||
| Can opening | Bottle opening | 0.05 | 0.28 | 1.00 | |
| Bottle pouring | −0.47 | 0.28 | 0.56 | ||
| Can pouring | −0.66 | 0.28 | 0.12 | ||
| Can pouring | Bottle opening | 0.71 | 0.28 | 0.07 | |
| Bottle pouring | 0.19 | 0.28 | 1.00 | ||
| Can opening | 0.66 | 0.28 | 0.12 | ||
| Responsible | Bottle opening | Bottle pouring | −0.49 | 0.29 | 0.53 |
| Can opening | −0.01 | 0.29 | 1.00 | ||
| Can pouring | −0.21 | 0.29 | 1.00 | ||
| Bottle pouring | Bottle opening | 0.49 | 0.29 | 0.53 | |
| Can opening | 0.48 | 0.29 | 0.55 | ||
| Can pouring | 0.28 | 0.29 | 1.00 | ||
| Can opening | Bottle opening | 0.01 | 0.29 | 1.00 | |
| Bottle pouring | −0.48 | 0.29 | 0.55 | ||
| Can pouring | −0.21 | 0.29 | 1.00 | ||
| Can pouring | Bottle opening | 0.21 | 0.29 | 1.00 | |
| Bottle pouring | −0.28 | 0.29 | 1.00 | ||
| Can opening | 0.21 | 0.29 | 1.00 | ||
| Measure | Stimuli | Mean Difference | Std. Error | p-Value | |
|---|---|---|---|---|---|
| Alcohol | Low-frequency | Low-frequency/low-pressure | 0.50 | 0.13 | <0.01 |
| Low-pressure | 0.56 | 0.13 | <0.01 | ||
| Unaltered | 0.08 | 0.10 | 1.00 | ||
| Low-frequency/low-pressure | Low-frequency | −0.50 | 0.13 | <0.01 | |
| Low-pressure | 0.06 | 0.10 | 1.00 | ||
| Unaltered | −0.42 | 0.12 | <0.01 | ||
| Low-pressure | Low-frequency | −0.56 | 0.13 | <0.01 | |
| Low-frequency/low-pressure | −0.06 | 0.10 | 1.00 | ||
| Unaltered | −0.48 | 0.11 | <0.01 | ||
| Unaltered | Low-frequency | −0.08 | 0.10 | 1.00 | |
| Low-frequency/low-pressure | 0.42 | 0.12 | <0.01 | ||
| Low-pressure | 0.48 | 0.11 | <0.01 | ||
| Refreshing | Low-frequency | Low-frequency/low-pressure | 1.00 | 0.17 | <0.01 |
| Low-pressure | 0.45 | 0.15 | 0.02 | ||
| Unaltered | −0.14 | 0.13 | 1.00 | ||
| Low-frequency/low-pressure | Low-frequency | −1.00 | 0.17 | <0.01 | |
| Low-pressure | −0.54 | 0.13 | <0.01 | ||
| Unaltered | −1.13 | 0.16 | <0.01 | ||
| Low-pressure | Low-frequency | −0.45 | 0.15 | 0.02 | |
| Low-frequency/low-pressure | 0.54 | 0.13 | <0.01 | ||
| Unaltered | −0.59 | 0.15 | <0.01 | ||
| Unaltered | Low-frequency | 0.14 | 0.13 | 1.00 | |
| Low-frequency/low-pressure | 1.13 | 0.16 | <0.01 | ||
| Low-pressure | 0.59 | 0.15 | <0.01 | ||
| Sweetness | Low-frequency | Low-frequency/low-pressure | −0.12 | 0.13 | 1.00 |
| Low-pressure | −0.44 | 0.14 | 0.02 | ||
| Unaltered | −0.26 | 0.12 | 0.21 | ||
| Low-frequency/low-pressure | Low-frequency | 0.12 | 0.13 | 1.00 | |
| Low-pressure | −0.32 | 0.14 | 0.12 | ||
| Unaltered | −0.14 | 0.13 | 1.00 | ||
| Low-pressure | Low-frequency | 0.44 | 0.14 | 0.02 | |
| Low-frequency/low-pressure | 0.32 | 0.14 | 0.12 | ||
| Unaltered | 0.18 | 0.14 | 1.00 | ||
| Unaltered | Low-frequency | 0.26 | 0.12 | 0.21 | |
| Low-frequency/low-pressure | 0.14 | 0.13 | 1.00 | ||
| Low-pressure | −0.18 | 0.14 | 1.00 | ||
| Bitterness | Low-frequency | Low-frequency/low-pressure | 0.20 | 0.14 | 1.00 |
| Low-pressure | 0.49 | 0.15 | 0.01 | ||
| Unaltered | 0.27 | 0.14 | 0.33 | ||
| Low-frequency/low-pressure | Low-frequency | −0.20 | 0.14 | 1.00 | |
| Low-pressure | 0.29 | 0.15 | 0.28 | ||
| Unaltered | 0.07 | 0.15 | 1.00 | ||
| Low-pressure | Low-frequency | −0.49 | 0.15 | 0.01 | |
| Low-frequency/low-pressure | −0.29 | 0.15 | 0.28 | ||
| Unaltered | −0.22 | 0.15 | 0.77 | ||
| Unaltered | Low-frequency | −0.27 | 0.14 | 0.33 | |
| Low-frequency/low-pressure | −0.07 | 0.15 | 1.00 | ||
| Low-pressure | 0.22 | 0.15 | 0.77 | ||
| Measure | Stimuli | Mean Difference | Std. Error | p-Value | |
|---|---|---|---|---|---|
| Alcohol | Bottle opening | Bottle pouring | 0.07 | 0.33 | 1.00 |
| Can opening | 0.39 | 0.33 | 1.00 | ||
| Can pouring | −0.12 | 0.33 | 1.00 | ||
| Bottle pouring | Bottle opening | −0.07 | 0.33 | 1.00 | |
| Can opening | 0.32 | 0.33 | 1.00 | ||
| Can pouring | −0.19 | 0.33 | 1.00 | ||
| Can opening | Bottle opening | −0.39 | 0.33 | 1.00 | |
| Bottle pouring | −0.32 | 0.33 | 1.00 | ||
| Can pouring | −0.51 | 0.33 | 0.75 | ||
| Can pouring | Bottle opening | 0.12 | 0.33 | 1.00 | |
| Bottle pouring | 0.19 | 0.33 | 1.00 | ||
| Can opening | 0.51 | 0.33 | 0.75 | ||
| Refreshing | Bottle opening | Bottle pouring | −1.09 | 0.28 | <0.01 |
| Can opening | 0.33 | 0.28 | 1.00 | ||
| Can pouring | −0.34 | 0.28 | 1.00 | ||
| Bottle pouring | Bottle opening | 1.09 | 0.28 | <0.01 | |
| Can opening | 1.42 | 0.28 | <0.01 | ||
| Can pouring | 0.75 | 0.28 | 0.05 | ||
| Can opening | Bottle opening | −0.33 | 0.28 | 1.00 | |
| Bottle pouring | −1.42 | 0.28 | <0.01 | ||
| Can pouring | −0.67 | 0.28 | 0.10 | ||
| Can pouring | Bottle opening | 0.34 | 0.28 | 1.00 | |
| Bottle pouring | −0.75 | 0.28 | 0.05 | ||
| Can opening | 0.67 | 0.28 | 0.10 | ||
| Sweetness | Bottle opening | Bottle pouring | −0.35 | 0.27 | 1.00 |
| Can opening | −0.27 | 0.27 | 1.00 | ||
| Can pouring | −0.69 | 0.27 | 0.06 | ||
| Bottle pouring | Bottle opening | 0.35 | 0.27 | 1.00 | |
| Can opening | 0.08 | 0.27 | 1.00 | ||
| Can pouring | −0.34 | 0.27 | 1.00 | ||
| Can opening | Bottle opening | 0.27 | 0.27 | 1.00 | |
| Bottle pouring | −0.08 | 0.27 | 1.00 | ||
| Can pouring | −0.42 | 0.27 | 0.69 | ||
| Can pouring | Bottle opening | 0.69 | 0.27 | 0.06 | |
| Bottle pouring | 0.34 | 0.27 | 1.00 | ||
| Can opening | 0.42 | 0.27 | 0.69 | ||
| Bitterness | Bottle opening | Bottle pouring | −0.20 | 0.30 | 1.00 |
| Can opening | −0.10 | 0.30 | 1.00 | ||
| Can pouring | −0.61 | 0.30 | 0.26 | ||
| Bottle pouring | Bottle opening | 0.20 | 0.30 | 1.00 | |
| Can opening | 0.10 | 0.30 | 1.00 | ||
| Can pouring | −0.41 | 0.30 | 1.00 | ||
| Can opening | Bottle opening | 0.10 | 0.30 | 1.00 | |
| Bottle pouring | −0.10 | 0.30 | 1.00 | ||
| Can pouring | −0.51 | 0.30 | 0.56 | ||
| Can pouring | Bottle opening | 0.61 | 0.30 | 0.26 | |
| Bottle pouring | 0.41 | 0.30 | 1.00 | ||
| Can opening | 0.51 | 0.30 | 0.56 | ||
| Measure | Stimuli | Mean Difference | Std. Error | p-Value | |
|---|---|---|---|---|---|
| Amused | No sound | Unaltered | −0.47 | 0.24 | 0.32 |
| Low-frequency | −0.22 | 0.24 | 1.00 | ||
| Low-pressure | −0.35 | 0.24 | 0.89 | ||
| Unaltered | No sound | 0.47 | 0.24 | 0.32 | |
| Low-frequency | 0.25 | 0.24 | 1.00 | ||
| Low-pressure | 0.12 | 0.24 | 1.00 | ||
| Low-frequency | No sound | 0.22 | 0.24 | 1.00 | |
| Unaltered | −0.25 | 0.24 | 1.00 | ||
| Low-pressure | −0.13 | 0.24 | 1.00 | ||
| Low-pressure | No sound | 0.35 | 0.24 | 0.89 | |
| Unaltered | −0.12 | 0.24 | 1.00 | ||
| Low-frequency | 0.13 | 0.24 | 1.00 | ||
| Calmed | No sound | Unaltered | −1.22 | 0.23 | <0.01 |
| Low-frequency | −1.09 | 0.23 | <0.01 | ||
| Low-pressure | −1.30 | 0.23 | <0.01 | ||
| Unaltered | No sound | 1.22 | 0.23 | <0.01 | |
| Low-frequency | 0.12 | 0.23 | 1.00 | ||
| Low-pressure | −0.08 | 0.23 | 1.00 | ||
| Low-frequency | No sound | 1.09 | 0.23 | <0.01 | |
| Unaltered | −0.12 | 0.23 | 1.00 | ||
| Low-pressure | −0.20 | 0.23 | 1.00 | ||
| Low-pressure | No sound | 1.30 | 0.23 | <0.01 | |
| Unaltered | 0.08 | 0.23 | 1.00 | ||
| Low-frequency | 0.20 | 0.23 | 1.00 | ||
| Comforted | No sound | Unaltered | −1.00 | 0.22 | <0.01 |
| Low-frequency | −0.91 | 0.22 | <0.01 | ||
| Low-pressure | −1.12 | 0.22 | <0.01 | ||
| Unaltered | No sound | 1.00 | 0.22 | <0.01 | |
| Low-frequency | 0.09 | 0.22 | 1.00 | ||
| Low-pressure | −0.12 | 0.22 | 1.00 | ||
| Low-frequency | No sound | 0.91 | 0.22 | <0.01 | |
| Unaltered | −0.09 | 0.22 | 1.00 | ||
| Low-pressure | −0.21 | 0.22 | 1.00 | ||
| Low-pressure | No sound | 1.12 | 0.22 | <0.01 | |
| Unaltered | 0.12 | 0.22 | 1.00 | ||
| Low-frequency | 0.21 | 0.22 | 1.00 | ||
| Curious | No sound | Unaltered | −0.10 | 0.24 | 1.00 |
| Low-frequency | −0.04 | 0.24 | 1.00 | ||
| Low-pressure | −0.13 | 0.24 | 1.00 | ||
| Unaltered | No sound | 0.10 | 0.24 | 1.00 | |
| Low-frequency | 0.06 | 0.24 | 1.00 | ||
| Low-pressure | −0.03 | 0.24 | 1.00 | ||
| Low-frequency | No sound | 0.04 | 0.24 | 1.00 | |
| Unaltered | −0.06 | 0.24 | 1.00 | ||
| Low-pressure | −0.09 | 0.24 | 1.00 | ||
| Low-pressure | No sound | 0.13 | 0.24 | 1.00 | |
| Unaltered | 0.03 | 0.24 | 1.00 | ||
| Low-frequency | 0.09 | 0.24 | 1.00 | ||
| Disappointed | No sound | Unaltered | 0.72 | 0.18 | <0.01 |
| Low-frequency | 0.70 | 0.18 | <0.01 | ||
| Low-pressure | 0.75 | 0.18 | <0.01 | ||
| Unaltered | No sound | −0.72 | 0.18 | <0.01 | |
| Low-frequency | −0.01 | 0.18 | 1.00 | ||
| Low-pressure | 0.03 | 0.18 | 1.00 | ||
| Low-frequency | No sound | −0.70 | 0.18 | <0.01 | |
| Unaltered | 0.01 | 0.18 | 1.00 | ||
| Low-pressure | 0.05 | 0.18 | 1.00 | ||
| Low-pressure | No sound | −0.75 | 0.18 | <0.01 | |
| Unaltered | −0.03 | 0.18 | 1.00 | ||
| Low-frequency | −0.05 | 0.18 | 1.00 | ||
| Energetic | No sound | Unaltered | −0.26 | 0.22 | 1.00 |
| Low-frequency | −0.48 | 0.22 | 0.17 | ||
| Low-pressure | −0.23 | 0.22 | 1.00 | ||
| Unaltered | No sound | 0.26 | 0.22 | 1.00 | |
| Low-frequency | −0.22 | 0.22 | 1.00 | ||
| Low-pressure | 0.03 | 0.22 | 1.00 | ||
| Low-frequency | No sound | 0.48 | 0.22 | 0.17 | |
| Unaltered | 0.22 | 0.22 | 1.00 | ||
| Low-pressure | 0.25 | 0.22 | 1.00 | ||
| Low-pressure | No sound | 0.23 | 0.22 | 1.00 | |
| Unaltered | −0.03 | 0.22 | 1.00 | ||
| Low-frequency | −0.25 | 0.22 | 1.00 | ||
| Excited | No sound | Unaltered | −0.80 | 0.23 | <0.01 |
| Low-frequency | −0.46 | 0.23 | 0.29 | ||
| Low-pressure | −0.79 | 0.23 | <0.01 | ||
| Unaltered | No sound | 0.80 | 0.23 | <0.01 | |
| Low-frequency | 0.34 | 0.23 | 0.86 | ||
| Low-pressure | 0.01 | 0.23 | 1.00 | ||
| Low-frequency | No sound | 0.46 | 0.23 | 0.29 | |
| Unaltered | −0.34 | 0.23 | 0.86 | ||
| Low-pressure | −0.33 | 0.23 | 0.93 | ||
| Low-pressure | No sound | 0.79 | 0.23 | <0.01 | |
| Unaltered | −0.01 | 0.23 | 1.00 | ||
| Low-frequency | 0.33 | 0.23 | 0.93 | ||
| Friendly | No sound | Unaltered | −0.42 | 0.21 | 0.30 |
| Low-frequency | −0.41 | 0.21 | 0.34 | ||
| Low-pressure | −0.61 | 0.21 | 0.03 | ||
| Unaltered | No sound | 0.42 | 0.21 | 0.30 | |
| Low-frequency | 0.01 | 0.21 | 1.00 | ||
| Low-pressure | −0.20 | 0.21 | 1.00 | ||
| Low-frequency | No sound | 0.41 | 0.21 | 0.34 | |
| Unaltered | −0.01 | 0.21 | 1.00 | ||
| Low-pressure | −0.20 | 0.21 | 1.00 | ||
| Low-pressure | No sound | 0.61 | 0.21 | 0.03 | |
| Unaltered | 0.20 | 0.21 | 1.00 | ||
| Low-frequency | 0.20 | 0.21 | 1.00 | ||
| Good | No sound | Unaltered | −0.76 | 0.20 | <0.01 |
| Low-frequency | −0.62 | 0.20 | 0.01 | ||
| Low-pressure | −0.65 | 0.20 | 0.01 | ||
| Unaltered | No sound | 0.76 | 0.20 | <0.01 | |
| Low-frequency | 0.15 | 0.20 | 1.00 | ||
| Low-pressure | 0.11 | 0.20 | 1.00 | ||
| Low-frequency | No sound | 0.62 | 0.20 | 0.01 | |
| Unaltered | −0.15 | 0.20 | 1.00 | ||
| Low-pressure | −0.04 | 0.20 | 1.00 | ||
| Low-pressure | No sound | 0.65 | 0.20 | 0.01 | |
| Unaltered | −0.11 | 0.20 | 1.00 | ||
| Low-frequency | 0.04 | 0.20 | 1.00 | ||
| Grumpy | No sound | Unaltered | 0.81 | 0.19 | <0.01 |
| Low-frequency | 0.41 | 0.19 | 0.18 | ||
| Low-pressure | 0.52 | 0.19 | 0.04 | ||
| Unaltered | No sound | −0.81 | 0.19 | <0.01 | |
| Low-frequency | −0.40 | 0.19 | 0.21 | ||
| Low-pressure | −0.29 | 0.19 | 0.76 | ||
| Low-frequency | No sound | −0.41 | 0.19 | 0.18 | |
| Unaltered | 0.40 | 0.19 | 0.21 | ||
| Low-pressure | 0.11 | 0.19 | 1.00 | ||
| Low-pressure | No sound | −0.52 | 0.19 | 0.04 | |
| Unaltered | 0.29 | 0.19 | 0.76 | ||
| Low-frequency | −0.11 | 0.19 | 1.00 | ||
| Joyful | No sound | Unaltered | −0.75 | 0.22 | <0.01 |
| Low-frequency | −0.74 | 0.22 | 0.01 | ||
| Low-pressure | −0.87 | 0.22 | <0.01 | ||
| Unaltered | No sound | 0.75 | 0.22 | <0.01 | |
| Low-frequency | 0.01 | 0.22 | 1.00 | ||
| Low-pressure | −0.12 | 0.22 | 1.00 | ||
| Low-frequency | No sound | 0.74 | 0.22 | 0.01 | |
| Unaltered | −0.01 | 0.22 | 1.00 | ||
| Low-pressure | −0.13 | 0.22 | 1.00 | ||
| Low-pressure | No sound | 0.87 | 0.22 | <0.01 | |
| Unaltered | 0.12 | 0.22 | 1.00 | ||
| Low-frequency | 0.13 | 0.22 | 1.00 | ||
| Pleased | No sound | Unaltered | −1.11 | 0.21 | <0.01 |
| Low-frequency | −0.82 | 0.21 | <0.01 | ||
| Low-pressure | −0.94 | 0.21 | <0.01 | ||
| Unaltered | No sound | 1.11 | 0.21 | <0.01 | |
| Low-frequency | 0.30 | 0.21 | 0.90 | ||
| Low-pressure | 0.18 | 0.21 | 1.00 | ||
| Low-frequency | No sound | 0.82 | 0.21 | <0.01 | |
| Unaltered | −0.30 | 0.21 | 0.90 | ||
| Low-pressure | −0.12 | 0.21 | 1.00 | ||
| Low-pressure | No sound | 0.94 | 0.21 | <0.01 | |
| Unaltered | −0.18 | 0.21 | 1.00 | ||
| Low-frequency | 0.12 | 0.21 | 1.00 | ||
| Restless | No sound | Unaltered | 0.42 | 0.21 | 0.29 |
| Low-frequency | 0.37 | 0.21 | 0.50 | ||
| Low-pressure | 0.44 | 0.21 | 0.23 | ||
| Unaltered | No sound | −0.42 | 0.21 | 0.29 | |
| Low-frequency | −0.05 | 0.21 | 1.00 | ||
| Low-pressure | 0.02 | 0.21 | 1.00 | ||
| Low-frequency | No sound | −0.37 | 0.21 | 0.50 | |
| Unaltered | 0.05 | 0.21 | 1.00 | ||
| Low-pressure | 0.07 | 0.21 | 1.00 | ||
| Low-pressure | No sound | −0.44 | 0.21 | 0.23 | |
| Unaltered | −0.02 | 0.21 | 1.00 | ||
| Low-frequency | −0.07 | 0.21 | 1.00 | ||
| Sad | No sound | Unaltered | 0.60 | 0.18 | <0.01 |
| Low-frequency | 0.44 | 0.18 | 0.08 | ||
| Low-pressure | 0.38 | 0.18 | 0.19 | ||
| Unaltered | No sound | −0.60 | 0.18 | <0.01 | |
| Low-frequency | −0.16 | 0.18 | 1.00 | ||
| Low-pressure | −0.22 | 0.18 | 1.00 | ||
| Low-frequency | No sound | −0.44 | 0.18 | 0.08 | |
| Unaltered | 0.16 | 0.18 | 1.00 | ||
| Low-pressure | −0.06 | 0.18 | 1.00 | ||
| Low-pressure | No sound | −0.38 | 0.18 | 0.19 | |
| Unaltered | 0.22 | 0.18 | 1.00 | ||
| Low-frequency | 0.06 | 0.18 | 1.00 | ||
| Rational | No sound | Unaltered | 0.10 | 0.22 | 1.00 |
| Low-frequency | 0.21 | 0.22 | 1.00 | ||
| Low-pressure | −0.19 | 0.22 | 1.00 | ||
| Unaltered | No sound | −0.10 | 0.22 | 1.00 | |
| Low-frequency | 0.12 | 0.22 | 1.00 | ||
| Low-pressure | −0.29 | 0.22 | 1.00 | ||
| Low-frequency | No sound | −0.21 | 0.22 | 1.00 | |
| Unaltered | −0.12 | 0.22 | 1.00 | ||
| Low-pressure | −0.41 | 0.22 | 0.38 | ||
| Low-pressure | No sound | 0.19 | 0.22 | 1.00 | |
| Unaltered | 0.29 | 0.22 | 1.00 | ||
| Low-frequency | 0.41 | 0.22 | 0.38 | ||
| Responsible | No sound | Unaltered | 0.65 | 0.23 | 0.03 |
| Low-frequency | 0.79 | 0.24 | 0.01 | ||
| Low-pressure | 0.14 | 0.24 | 1.00 | ||
| Unaltered | No sound | −0.65 | 0.23 | 0.03 | |
| Low-frequency | 0.14 | 0.24 | 1.00 | ||
| Low-pressure | −0.51 | 0.23 | 0.17 | ||
| Low-frequency | No sound | −0.79 | 0.24 | 0.01 | |
| Unaltered | −0.14 | 0.24 | 1.00 | ||
| Low-pressure | −0.65 | 0.24 | 0.04 | ||
| Low-pressure | No sound | −0.14 | 0.24 | 1.00 | |
| Unaltered | 0.51 | 0.23 | 0.17 | ||
| Low-frequency | 0.65 | 0.24 | 0.04 | ||
| Measure | Stimuli | Mean Difference | Std. Error | p-Value | |
|---|---|---|---|---|---|
| Refreshing | No sound | Unaltered | −0.66 | 0.17 | <0.01 |
| Low-frequency | −0.43 | 0.18 | 0.09 | ||
| Low-pressure | −0.64 | 0.18 | <0.01 | ||
| Unaltered | No sound | 0.66 | 0.17 | <0.01 | |
| Low-frequency | 0.23 | 0.18 | 1.00 | ||
| Low-pressure | 0.02 | 0.17 | 1.00 | ||
| Low-frequency | No sound | 0.43 | 0.18 | 0.09 | |
| Unaltered | −0.23 | 0.18 | 1.00 | ||
| Low-pressure | −0.21 | 0.18 | 1.00 | ||
| Low-pressure | No sound | 0.64 | 0.18 | <0.01 | |
| Unaltered | −0.02 | 0.17 | 1.00 | ||
| Low-frequency | 0.21 | 0.18 | 1.00 | ||
| Sweetness | No sound | Unaltered | −0.27 | 0.23 | 1.00 |
| Low-frequency | −0.19 | 0.23 | 1.00 | ||
| Low-pressure | −0.36 | 0.23 | 0.74 | ||
| Unaltered | No sound | 0.27 | 0.23 | 1.00 | |
| Low-frequency | 0.07 | 0.23 | 1.00 | ||
| Low-pressure | −0.09 | 0.23 | 1.00 | ||
| Low-frequency | No sound | 0.19 | 0.23 | 1.00 | |
| Unaltered | −0.07 | 0.23 | 1.00 | ||
| Low-pressure | −0.16 | 0.23 | 1.00 | ||
| Low-pressure | No sound | 0.36 | 0.23 | 0.74 | |
| Unaltered | 0.09 | 0.23 | 1.00 | ||
| Low-frequency | 0.16 | 0.23 | 1.00 | ||
| Bitterness | No sound | Unaltered | 0.20 | 0.24 | 1.00 |
| Low-frequency | 0.57 | 0.25 | 0.13 | ||
| Low-pressure | 0.22 | 0.25 | 1.00 | ||
| Unaltered | No sound | −0.20 | 0.24 | 1.00 | |
| Low-frequency | 0.37 | 0.24 | 0.78 | ||
| Low-pressure | 0.02 | 0.24 | 1.00 | ||
| Low-frequency | No sound | −0.57 | 0.25 | 0.13 | |
| Unaltered | −0.37 | 0.24 | 0.78 | ||
| Low-pressure | −0.35 | 0.24 | 0.91 | ||
| Low-pressure | No sound | −0.22 | 0.25 | 1.00 | |
| Unaltered | −0.02 | 0.24 | 1.00 | ||
| Low-frequency | 0.35 | 0.24 | 0.91 | ||
| Refreshing | No sound | Unaltered | −0.66 | 0.17 | <0.01 |
| Low-frequency | −0.43 | 0.18 | 0.09 | ||
| Low-pressure | −0.64 | 0.18 | <0.01 | ||
| Unaltered | No sound | 0.66 | 0.17 | <0.01 | |
| Low-frequency | 0.23 | 0.18 | 1.00 | ||
| Low-pressure | 0.02 | 0.17 | 1.00 | ||
| Low-frequency | No sound | 0.43 | 0.18 | 0.09 | |
| Unaltered | −0.23 | 0.18 | 1.00 | ||
| Low-pressure | −0.21 | 0.18 | 1.00 | ||
| Low-pressure | No sound | 0.64 | 0.18 | <0.01 | |
| Unaltered | −0.02 | 0.17 | 1.00 | ||
| Low-frequency | 0.21 | 0.18 | 1.00 | ||
References
- Ritchie, H.; Roser, M. Alcohol Consumption. Our World Data. 2018. Available online: https://ourworldindata.org/alcohol-consumption (accessed on 4 July 2021).
- Non-Alcoholic Beer Market Share, Size Global Forecast to 2030|insightSLICE. Available online: https://www.insightslice.com/non-alcoholic-beer-market (accessed on 4 July 2021).
- Verma, V.; Rawat, A. Non-Alcoholic Beer Market Size by Product, Technology, Sales Channel, Low Alcohol by Technology and Sales Channel, Industry Analysis Report, Regional Outlook, Growth Potential, Price Trends, Competitive Market Share & Forecast, 2017–2024; Global Market Insights: Selbyville, DE, USA, 2018; Available online: https://www.gminsights.com/industry-analysis/non-alcoholic-beer-market (accessed on 4 July 2021).
- Attitudes towards Low- and Non-alcoholic Drink—UK—August 2019—Market Research Report. Available online: https://reports.mintel.com/display/919650/ (accessed on 4 July 2021).
- IWSR Report: No- And Low-Alcohol Products Gaining Market Share. Available online: https://www.forbes.com/sites/chrisfurnari/2021/02/09/iwsr-report-noand-low-alcohol-products-gaining-market-share/ (accessed on 4 July 2021).
- Global Market Size of Non-Alcoholic Beer 2016–2024|Statista. Available online: https://www.statista.com/statistics/1091389/non-alcoholic-beer-market-size-worldwide/ (accessed on 26 June 2021).
- Update: Beer Global Market Report 2021 Including Market Size, Share & Growth Analysis, Global Beer Consumption Statistics. Available online: https://www.globenewswire.com/en/news-release/2021/04/01/2203506/0/en/Update-Beer-Global-Market-Report-2021-Including-Market-Size-Share-Growth-Analysis-Global-Beer-Consumption-Statistics.html (accessed on 26 June 2021).
- Alcohol. Available online: https://www.who.int/health-topics/alcohol#tab=tab_1 (accessed on 4 July 2021).
- Sohrabvandi, S.; Mousavi, S.M.; Razavi, S.H.; Mortazavian, A.M.; Rezaei, K. Alcohol-free Beer: Methods of Production, Sensorial Defects, and Healthful Effects. Food Rev. Int. 2010, 26, 335–352. [Google Scholar] [CrossRef]
- Silva, A.P.; Jager, G.; van Bommel, R.; van Zyl, H.; Voss, H.P.; Hogg, T.; Pintado, M.; de Graaf, C. Functional or emotional? How Dutch and Portuguese conceptualise beer, wine and non-alcoholic beer consumption. Food Qual. Prefer. 2016, 49, 54–65. [Google Scholar] [CrossRef]
- Silva, A.P.; Jager, G.; Voss, H.P.; van Zyl, H.; Hogg, T.; Pintado, M.; de Graaf, C. What’s in a name? The effect of congruent and incongruent product names on liking and emotions when consuming beer or non-alcoholic beer in a bar. Food Qual. Prefer. 2017, 55, 58–66. [Google Scholar] [CrossRef]
- Blackmore, H.; Hidrio, C.; Godineau, P.; Yeomans, M.R. The effect of implicit and explicit extrinsic cues on hedonic and sensory expectations in the context of beer. Food Qual. Prefer. 2020, 81, 103855. [Google Scholar] [CrossRef]
- Spence, C. Sound Design: Using Brain Science to Enhance Auditory & Multisensory Product & Brand Development. In (((ABA))) Audio Branding Academy Yearbook 2010/2011; Nomos Verlagsgesellschaft mbH & Co. KG: Baden, Germany, 2013; pp. 33–51. [Google Scholar]
- Sensory Experiences Increase In-Store Sales by 10 Percent, Finds New Research from Mood Media. Available online: https://www.businesswire.com/news/home/20191112005413/en/Sensory-Experiences-Increase-In-Store-Sales-10-Percent (accessed on 4 July 2021).
- Wang, Q.J.; Spence, C. Sonic Packaging: How Packaging Sounds Influence Multisensory Product Evaluation. In Multisensory Packaging; Springer International Publishing: Cham, Switzerland, 2018; pp. 103–125. [Google Scholar]
- Spence, C.; Wang, Q. Sensory expectations elicited by the sounds of opening the packaging and pouring a beverage. Flavour 2015, 4, 35. [Google Scholar] [CrossRef] [Green Version]
- Almiron, P.; Escobar, F.B.; Pathak, A.; Spence, C.; Velasco, C. Searching for the sound of premium beer. Food Qual. Prefer. 2021, 88, 104088. [Google Scholar] [CrossRef]
- Komatsuzaki, T.; Han, J.; Uchida, H. Approach for combining physical properties and sensibility for pleasant beverage can-opening sound. Appl. Acoust. 2016, 103, 64–70. [Google Scholar] [CrossRef] [Green Version]
- Bleier, R.; Fischer, F.; Hiltmann, T.; Viehhauser, G.; Vogeler, G. Digitale Mediävistik und der deutschsprachige Raum. Das Mittelalt. 2019, 24, 1–12. [Google Scholar] [CrossRef]
- Ringler, C.; Sirianni, N.J.; Christenson, B. The Power of Consequential Product Sounds. J. Retail. 2021, 97, 288–300. [Google Scholar] [CrossRef]
- Velasco, C.; Obrist, M.; Petit, O.; Spence, C. Multisensory Technology for Flavor Augmentation: A Mini Review. Front. Psychol. 2018, 9, 26. [Google Scholar] [CrossRef] [Green Version]
- Fiore, S.G.; Kelly, S. Surveying the use of sound in online stores: Practices, possibilities and pitfalls for user experience. Int. J. Retail. Distrib. Manag. 2007, 35, 600–611. [Google Scholar] [CrossRef]
- Petit, O.; Velasco, C.; Spence, C. Digital Sensory Marketing: Integrating New Technologies Into Multisensory Online Experience. J. Interact. Mark. 2019, 45, 42–61. [Google Scholar] [CrossRef] [Green Version]
- Hwang, A.H.-C.; Oh, J.; Scheinbaum, A.C. Interactive music for multisensory e-commerce: The moderating role of online consumer involvement in experiential value, cognitive value, and purchase intention. Psychol. Mark. 2020, 37, 1031–1056. [Google Scholar] [CrossRef]
- Mobile: The Closest You Can Get to Your Consumers. Available online: https://www.mmaglobal.com/case-study-hub/case_studies/view/56399 (accessed on 27 July 2021).
- Desmet, P. Designing Emotions. Ph.D. Thesis, Department of Industrial Design, Delft University of Technology, Delft, The Netherlands, 2002. [Google Scholar]
- Özcan, E.; Van Egmond, R.; Jacobs, J.J. Product sounds: Basic concepts and categories. Int. J. Des. 2014, 8, 97–111. [Google Scholar]
- Özcan, E.; van Egmond, R. Basic Semantics of Product Sounds. Int. J. Des. 2012, 6, 41–54. [Google Scholar]
- Velasco, C.; Salgado-Montejo, A.; Marmolejo-Ramos, F.; Spence, C. Predictive packaging design: Tasting shapes typefaces, names, and sounds. Food Qual. Prefer. 2014, 34, 88–95. [Google Scholar] [CrossRef]
- Simner, J.; Cuskley, C.; Kirby, S. What Sound Does That Taste? Cross-Modal Mappings across Gustation and Audition. Perception 2010, 39, 553–569. [Google Scholar] [CrossRef] [Green Version]
- Roque, J.; Lafraire, J.; Auvray, M. Audiovisual Crossmodal Correspondence between Bubbles’ Size and Pouring Sounds’ Pitch in Carbonated Beverages. Foods 2020, 9, 966. [Google Scholar] [CrossRef] [PubMed]
- Bleier, A.; Harmeling, C.M.; Palmatier, R.W. Creating Effective Online Customer Experiences. J. Mark. 2018, 83, 98–119. [Google Scholar] [CrossRef]
- Friedman, H. Simplified Determinations of Statistical Power, Magnitude of Effect and Research Sample Sizes. Educ. Psychol. Meas. 1982, 42, 521–526. [Google Scholar] [CrossRef]
- Tijssen, I.; Zandstra, E.H.; de Graaf, C.; Jager, G. Why a ‘light’ product package should not be light blue: Effects of package colour on perceived healthiness and attractiveness of sugar- and fat-reduced products. Food Qual. Prefer. 2017, 59, 46–58. [Google Scholar] [CrossRef]
- Huang, L.; Lu, J. The Impact of Package Color and the Nutrition Content Labels on the Perception of Food Healthiness and Purchase Intention. J. Food Prod. Mark. 2015, 22, 191–218. [Google Scholar] [CrossRef]
- Huang, L.; Lu, J. Eat with Your Eyes: Package Color Influences the Perceptions of Food Taste and Healthiness Moderated by External Eating. Mark. Manag. 2015, 25, 71–87. [Google Scholar]
- Wang, Q.J.; Spence, C. The Role of Pitch and Tempo in Sound-Temperature Crossmodal Correspondences. Multisens. Res. 2017, 30, 307–320. [Google Scholar] [CrossRef] [Green Version]
- Desira, B.; Watson, S.; Van Doorn, G.; Timora, J.; Spence, C. Happy Hour? A Preliminary Study of the Effect of Induced Joviality and Sadness on Beer Perception. Beverages 2020, 6, 35. [Google Scholar] [CrossRef]
- Reinoso-Carvalho, F.; Dakduk, S.; Wagemans, J.; Spence, C. Not Just Another Pint! The Role of Emotion Induced by Music on the Consumer’s Tasting Experience. Multisens. Res. 2019, 32, 367–400. [Google Scholar] [CrossRef] [PubMed]
- Peng-Li, D.; Mathiesen, S.L.; Chan, R.C.K.; Byrne, D.V.; Wang, Q.J. Sounds Healthy: Modelling sound-evoked consumer food choice through visual attention. Appetite 2021, 164, 105264. [Google Scholar] [CrossRef] [PubMed]
- Biswas, D.; Lund, K.; Szocs, C. Sounds like a healthy retail atmospheric strategy: Effects of ambient music and background noise on food sales. J. Acad. Mark. Sci. 2018, 47, 37–55. [Google Scholar] [CrossRef]
- Spence, C.; Velasco, C. Packaging Colour and Its Multiple Roles. In Multisensory Packaging; Springer International Publishing: Cham, Switzerland, 2018; pp. 21–48. [Google Scholar]
- Müller, M.; Bellut, K.; Tippmann, J.; Becker, T. Physikalische Verfahren zur Entalkoholisierung verschiedener Getränkematrizes und deren Einfluss auf qualitätsrelevante Merkmale. Chem. Ing. Tech. 2016, 88, 1911–1928. [Google Scholar] [CrossRef]
- Madjid, R. The influence store atmosphere towards customer emotions and purchase decisions. Int. J. Humanit. Soc. Sci. Invent. 2014, 3, 11–19. [Google Scholar]
- Bagozzi, R.P.; Belanche, D.; Casaló, L.V.; Flavián, C. The Role of Anticipated Emotions in Purchase Intentions. Psychol. Mark. 2016, 33, 629–645. [Google Scholar] [CrossRef]


| Source | Degrees of Freedom | Mean Square | F | p-Value | Partial Eta Squared | |
|---|---|---|---|---|---|---|
| Sound manipulation | Amused | 2.71 | 34.89 | 20.11 | <0.01 | 0.10 |
| Calmed | 2.97 | 2.43 | 1.41 | 0.24 | 0.01 | |
| Comforted | 2.87 | 16.40 | 8.65 | <0.01 | 0.04 | |
| Curious | 2.84 | 12.12 | 6.61 | <0.01 | 0.03 | |
| Disappointed | 2.79 | 16.40 | 8.69 | <0.01 | 0.04 | |
| Energetic | 2.76 | 43.24 | 25.66 | <0.01 | 0.12 | |
| Excited | 2.68 | 22.09 | 11.56 | <0.01 | 0.06 | |
| Friendly | 2.70 | 17.08 | 11.23 | <0.01 | 0.06 | |
| Good | 2.76 | 8.84 | 5.83 | <0.01 | 0.03 | |
| Grumpy | 2.89 | 3.97 | 2.97 | 0.03 | 0.02 | |
| Joyful | 2.73 | 21.78 | 13.34 | <0.01 | 0.07 | |
| Pleased | 2.82 | 25.54 | 12.55 | <0.01 | 0.06 | |
| Restless | 2.95 | 0.60 | 0.38 | 0.76 | <0.01 | |
| Sad | 2.88 | 9.41 | 9.51 | <0.01 | 0.05 | |
| Rational | 2.95 | 1.24 | 1.03 | 0.38 | 0.01 | |
| Responsible | 2.92 | 3.11 | 3.00 | 0.03 | 0.02 |
| Source | Degrees of Freedom | Mean Square | F | p-Value | Partial Eta Squared | |
|---|---|---|---|---|---|---|
| Packaging auditory experience | Amused | 3.00 | 34.77 | 3.81 | 0.01 | 0.06 |
| Calmed | 3.00 | 31.70 | 4.24 | 0.01 | 0.06 | |
| Comforted | 3.00 | 47.63 | 6.06 | <0.01 | 0.09 | |
| Curious | 3.00 | 25.01 | 2.74 | 0.04 | 0.04 | |
| Disappointed | 3.00 | 35.72 | 5.97 | <0.01 | 0.09 | |
| Energetic | 3.00 | 17.38 | 1.94 | 0.12 | 0.03 | |
| Excited | 3.00 | 46.46 | 5.08 | <0.01 | 0.07 | |
| Friendly | 3.00 | 42.40 | 4.44 | <0.01 | 0.07 | |
| Good | 3.00 | 49.98 | 7.13 | <0.01 | 0.10 | |
| Grumpy | 3.00 | 20.52 | 4.31 | 0.01 | 0.06 | |
| Joyful | 3.00 | 29.40 | 3.29 | 0.02 | 0.05 | |
| Pleased | 3.00 | 62.96 | 7.93 | <0.01 | 0.11 | |
| Restless | 3.00 | 27.44 | 4.54 | <0.01 | 0.07 | |
| Sad | 3.00 | 10.55 | 2.82 | 0.04 | 0.04 | |
| Rational | 3.00 | 23.38 | 3.15 | 0.03 | 0.05 | |
| Responsible | 3.00 | 10.23 | 1.31 | 0.27 | 0.02 |
| Source | Degrees of Freedom | Mean Square | F | p-Value | Partial Eta Squared | |
|---|---|---|---|---|---|---|
| Sound manipulation | Alcohol | 2.64 | 17.60 | 12.04 | <0.01 | 0.06 |
| Refreshing | 2.60 | 57.69 | 23.97 | <0.01 | 0.11 | |
| Sweetness | 2.94 | 6.96 | 3.98 | 0.01 | 0.02 | |
| Bitterness | 2.98 | 7.89 | 3.88 | 0.01 | 0.02 |
| Source | Degrees of Freedom | Mean Square | F | p-Value | Partial Eta Squared | |
|---|---|---|---|---|---|---|
| Packaging auditory experience | Alcohol | 3.00 | 9.14 | 0.87 | 0.46 | 0.01 |
| Refreshing | 3.00 | 70.78 | 9.64 | <0.01 | 0.13 | |
| Sweetness | 3.00 | 15.65 | 2.29 | 0.08 | 0.04 | |
| Bitterness | 3.00 | 13.91 | 1.58 | 0.20 | 0.02 |
| Effect | Value | F | Hypothesis Degrees of Freedom | Error Degrees of Freedom | p-Value | Partial Eta Squared |
|---|---|---|---|---|---|---|
| Beer consumption habit | 0.06 | 1.61 | 16.00 | 373.00 | 0.06 | 0.06 |
| NAB consumption habit | 0.07 | 1.82 | 16.00 | 373.00 | 0.03 | 0.07 |
| Age | 0.12 | 3.16 | 16.00 | 373.00 | <0.01 | 0.12 |
| Gender | 0.06 | 1.45 | 16.00 | 373.00 | 0.11 | 0.06 |
| Image | 0.06 | 1.57 | 16.00 | 373.00 | 0.07 | 0.06 |
| Sound | 0.28 | 2.43 | 48.00 | 1125.00 | <0.01 | 0.09 |
| Image * Sound 1 | 0.12 | 0.95 | 48.00 | 1125.00 | 0.58 | 0.04 |
| Source | Degrees of Freedom | Mean Square | F | p-Value | Partial Eta Squared | |
|---|---|---|---|---|---|---|
| NAB consumption habit | Amused | 1.00 | 9.12 | 3.10 | 0.08 | 0.01 |
| Calmed | 1.00 | 3.42 | 1.32 | 0.25 | 0.00 | |
| Comforted | 1.00 | 16.19 | 6.53 | 0.01 | 0.02 | |
| Curious | 1.00 | 0.60 | 0.21 | 0.65 | 0.00 | |
| Disappointed | 1.00 | 0.57 | 0.35 | 0.55 | 0.00 | |
| Energetic | 1.00 | 9.37 | 3.96 | 0.05 | 0.01 | |
| Excited | 1.00 | 32.32 | 12.18 | <0.01 | 0.03 | |
| Friendly | 1.00 | 0.14 | 0.06 | 0.80 | 0.00 | |
| Good | 1.00 | 11.19 | 5.70 | 0.02 | 0.01 | |
| Grumpy | 1.00 | 0.54 | 0.31 | 0.58 | 0.00 | |
| Joyful | 1.00 | 5.09 | 2.11 | 0.15 | 0.01 | |
| Pleased | 1.00 | 6.46 | 3.06 | 0.08 | 0.01 | |
| Restless | 1.00 | 0.07 | 0.03 | 0.86 | 0.00 | |
| Sad | 1.00 | 0.09 | 0.06 | 0.81 | 0.00 | |
| Rational | 1.00 | 26.11 | 11.04 | <0.01 | 0.03 | |
| Responsible | 1.00 | 12.94 | 4.72 | 0.03 | 0.01 | |
| Age | Amused | 1.00 | 0.32 | 0.11 | 0.74 | 0.00 |
| Calmed | 1.00 | 3.67 | 1.41 | 0.24 | 0.00 | |
| Comforted | 1.00 | 11.60 | 4.68 | 0.03 | 0.01 | |
| Curious | 1.00 | 8.60 | 2.96 | 0.09 | 0.01 | |
| Disappointed | 1.00 | 0.96 | 0.59 | 0.44 | 0.00 | |
| Energetic | 1.00 | 11.99 | 5.08 | 0.02 | 0.01 | |
| Excited | 1.00 | 0.11 | 0.04 | 0.84 | 0.00 | |
| Friendly | 1.00 | 0.36 | 0.16 | 0.69 | 0.00 | |
| Good | 1.00 | 0.52 | 0.26 | 0.61 | 0.00 | |
| Grumpy | 1.00 | 14.40 | 8.27 | <0.01 | 0.02 | |
| Joyful | 1.00 | 5.07 | 2.10 | 0.15 | 0.01 | |
| Pleased | 1.00 | 0.14 | 0.07 | 0.80 | 0.00 | |
| Restless | 1.00 | 4.31 | 1.97 | 0.16 | 0.01 | |
| Sad | 1.00 | 1.02 | 0.66 | 0.42 | 0.00 | |
| Rational | 1.00 | 2.70 | 1.14 | 0.29 | 0.00 | |
| Responsible | 1.00 | 7.93 | 2.89 | 0.09 | 0.01 | |
| Sound | Amused | 3.00 | 4.05 | 1.38 | 0.25 | 0.01 |
| Calmed | 3.00 | 36.32 | 14.01 | <0.01 | 0.10 | |
| Comforted | 3.00 | 25.63 | 10.34 | <0.01 | 0.07 | |
| Curious | 3.00 | 0.34 | 0.12 | 0.95 | 0.00 | |
| Disappointed | 3.00 | 12.94 | 8.03 | <0.01 | 0.06 | |
| Energetic | 3.00 | 3.85 | 1.63 | 0.18 | 0.01 | |
| Excited | 3.00 | 13.99 | 5.27 | <0.01 | 0.04 | |
| Friendly | 3.00 | 6.52 | 2.91 | 0.03 | 0.02 | |
| Good | 3.00 | 11.71 | 5.97 | <0.01 | 0.04 | |
| Grumpy | 3.00 | 11.07 | 6.36 | <0.01 | 0.05 | |
| Joyful | 3.00 | 15.59 | 6.47 | <0.01 | 0.05 | |
| Pleased | 3.00 | 24.03 | 11.39 | <0.01 | 0.08 | |
| Restless | 3.00 | 4.15 | 1.89 | 0.13 | 0.01 | |
| Sad | 3.00 | 6.44 | 4.20 | 0.01 | 0.03 | |
| Rational | 3.00 | 2.93 | 1.24 | 0.30 | 0.01 | |
| Responsible | 3.00 | 14.56 | 5.31 | <0.01 | 0.04 |
| Effect | Value | F | Hypothesis Degrees of Freedom | Error Degrees of Freedom | p-Value | Partial Eta Squared |
|---|---|---|---|---|---|---|
| Beer consumption habit | 0.01 | 0.98 | 3.00 | 386.00 | 0.40 | 0.01 |
| NAB consumption habit | 0.05 | 6.82 | 3.00 | 386.00 | <0.01 | 0.05 |
| Age | 0.01 | 1.41 | 3.00 | 386.00 | 0.24 | 0.01 |
| Gender | 0.02 | 2.04 | 3.00 | 386.00 | 0.11 | 0.02 |
| Image | 0.00 | 0.54 | 3.00 | 386.00 | 0.65 | 0.00 |
| Sound | 0.06 | 2.68 | 9.00 | 1164.00 | <0.01 | 0.02 |
| Image * Sound 1 | 0.02 | 0.82 | 9.00 | 1164.00 | 0.59 | 0.01 |
| Source | Degrees of Freedom | Mean Square | F | p-Value | Partial Eta Squared | |
|---|---|---|---|---|---|---|
| NAB consumption habit | Refreshing | 1.00 | 2.02 | 1.33 | 0.25 | 0.00 |
| Sweetness | 1.00 | 41.41 | 15.84 | <0.01 | 0.04 | |
| Bitterness | 1.00 | 6.33 | 2.13 | 0.15 | 0.01 | |
| Sound | Refreshing | 3.00 | 9.28 | 6.10 | <0.01 | 0.05 |
| Sweetness | 3.00 | 2.26 | 0.87 | 0.46 | 0.01 | |
| Bitterness | 3.00 | 5.52 | 1.86 | 0.14 | 0.01 |
Publisher’s Note: MDPI stays neutral with regard to jurisdictional claims in published maps and institutional affiliations. |
© 2021 by the authors. Licensee MDPI, Basel, Switzerland. This article is an open access article distributed under the terms and conditions of the Creative Commons Attribution (CC BY) license (https://creativecommons.org/licenses/by/4.0/).
Share and Cite
Rodríguez, B.; Arroyo, C.; Reyes, L.H.; Reinoso-Carvalho, F. Promoting Healthier Drinking Habits: Using Sound to Encourage the Choice for Non-Alcoholic Beers in E-Commerce. Foods 2021, 10, 2063. https://doi.org/10.3390/foods10092063
Rodríguez B, Arroyo C, Reyes LH, Reinoso-Carvalho F. Promoting Healthier Drinking Habits: Using Sound to Encourage the Choice for Non-Alcoholic Beers in E-Commerce. Foods. 2021; 10(9):2063. https://doi.org/10.3390/foods10092063
Chicago/Turabian StyleRodríguez, Brayan, Christian Arroyo, Luis H. Reyes, and Felipe Reinoso-Carvalho. 2021. "Promoting Healthier Drinking Habits: Using Sound to Encourage the Choice for Non-Alcoholic Beers in E-Commerce" Foods 10, no. 9: 2063. https://doi.org/10.3390/foods10092063
APA StyleRodríguez, B., Arroyo, C., Reyes, L. H., & Reinoso-Carvalho, F. (2021). Promoting Healthier Drinking Habits: Using Sound to Encourage the Choice for Non-Alcoholic Beers in E-Commerce. Foods, 10(9), 2063. https://doi.org/10.3390/foods10092063