
Development of Time-Resolved Fluorescence Immunochromatographic Assays for Simultaneously Detecting Tylosin and Tilmicosin in Milk in Group-Screening Manner

 , , and
Abstract
:
1. Introduction
2. Materials and Methods
2.1. Materials and Instruments
2.2. Activation and Coupling of TRFM
2.3. Optimizing the Amount of Monoclonal Antibody Conjugated to Fluorescent Microspheres
2.4. Selection of Microsphere-Labeled Antibody
2.5. Selection of Coating Antigen on Test Lines
2.6. Selection of Goat Anti-Mouse IgG on Control Lines
2.7. Principle and Procedure of the TRFICA
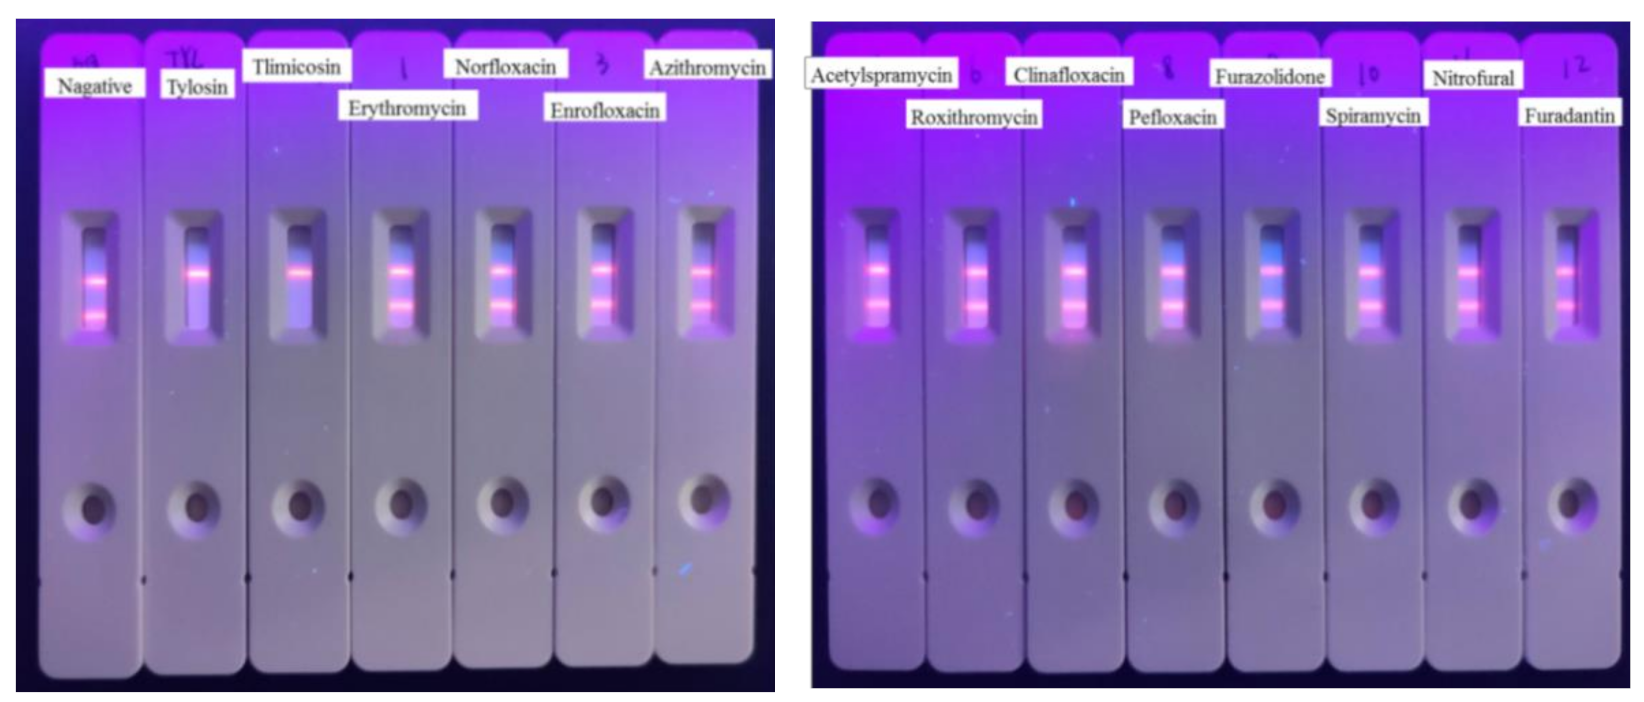
2.8. The Specificity of Developed TRFICA
2.9. The Stability of Developed TRFICA Strip
2.10. Sample Pretreatment Method
2.11. Recovery of the Developed TRFICA for Spiked Samples
2.12. Comparison of the TRFICA with ELISA and HPLC-MS/MS
3. Results and Discussion
3.1. SelectionPreparation of the MAb Labeled Fluorescent Microspheres
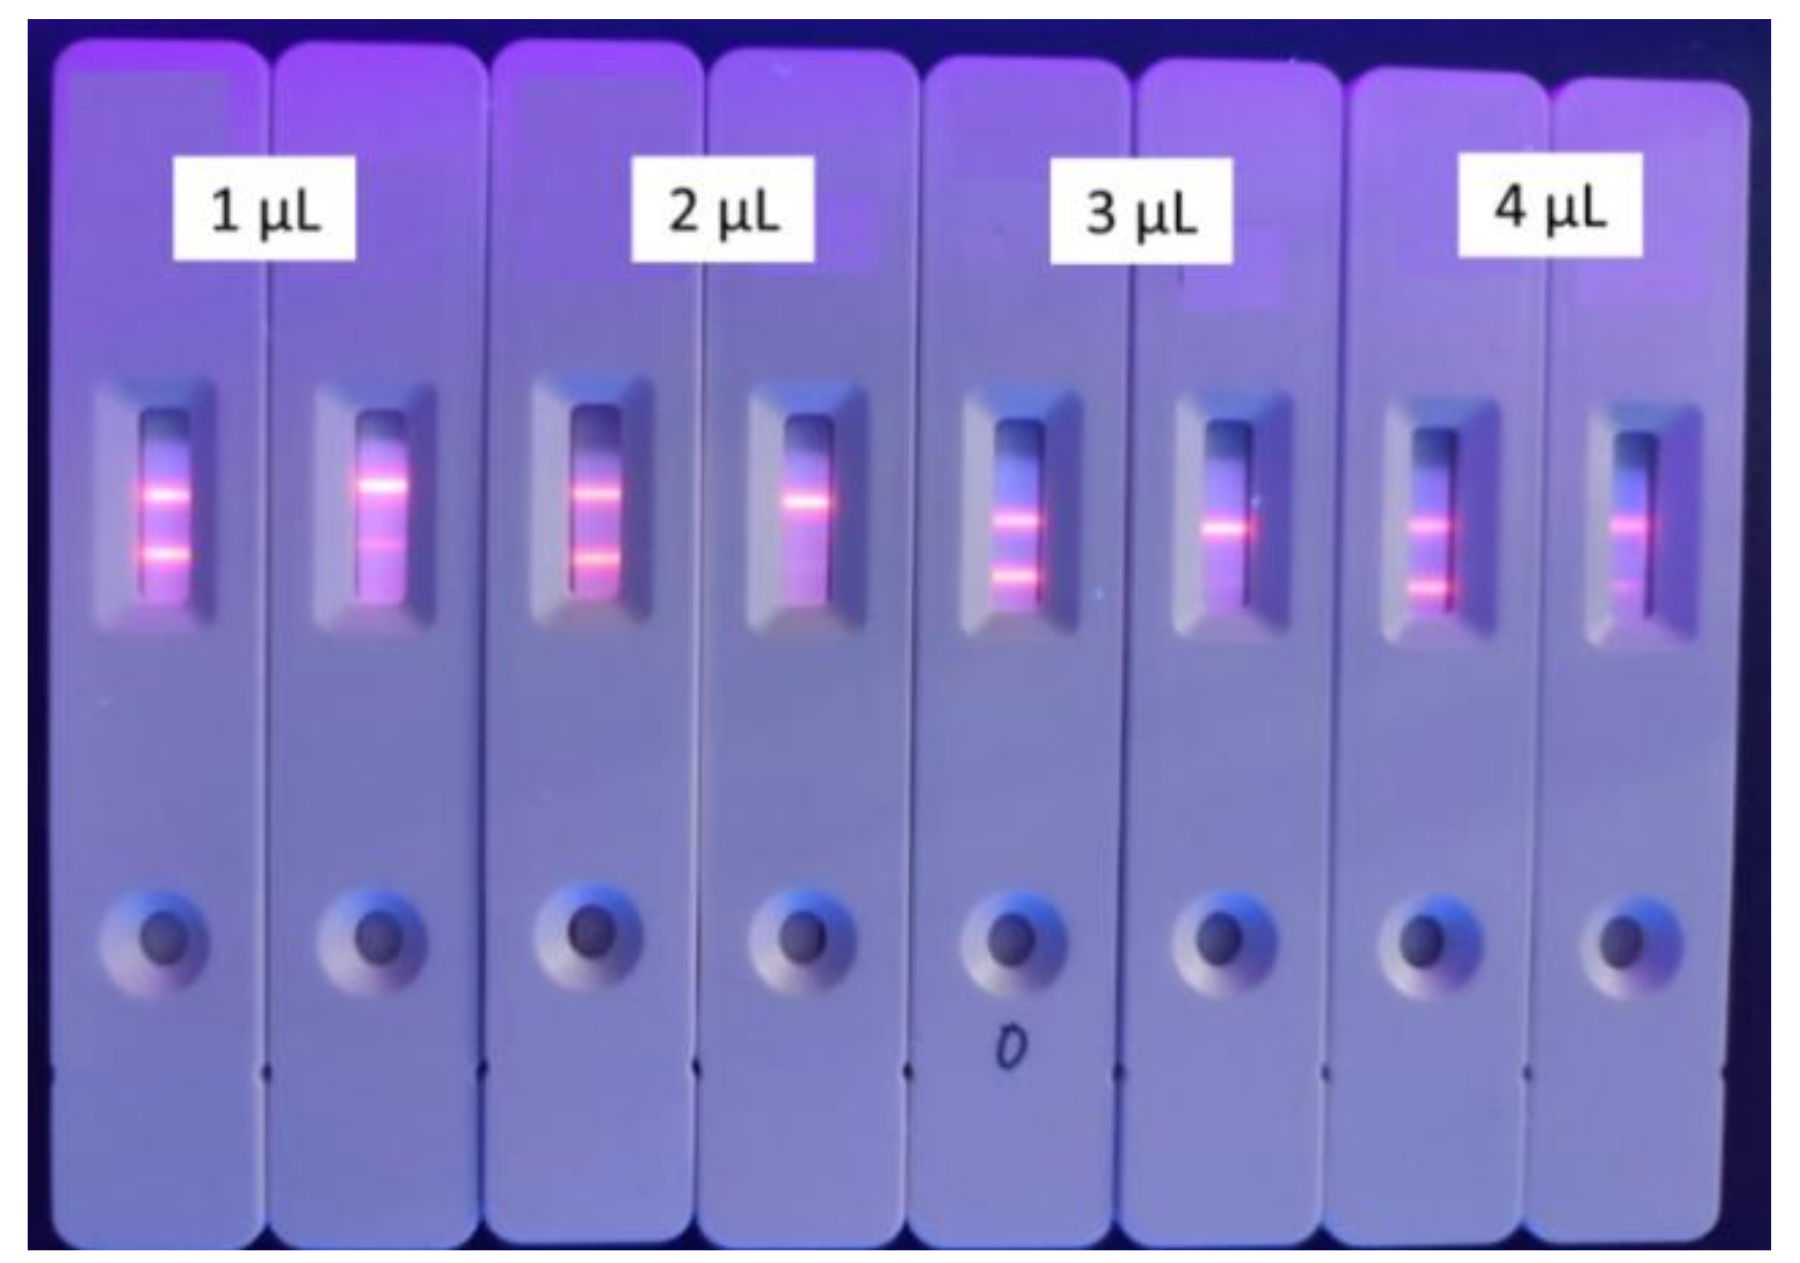
3.2. Selection of the Amount of Microsphere-Labeled Antibody
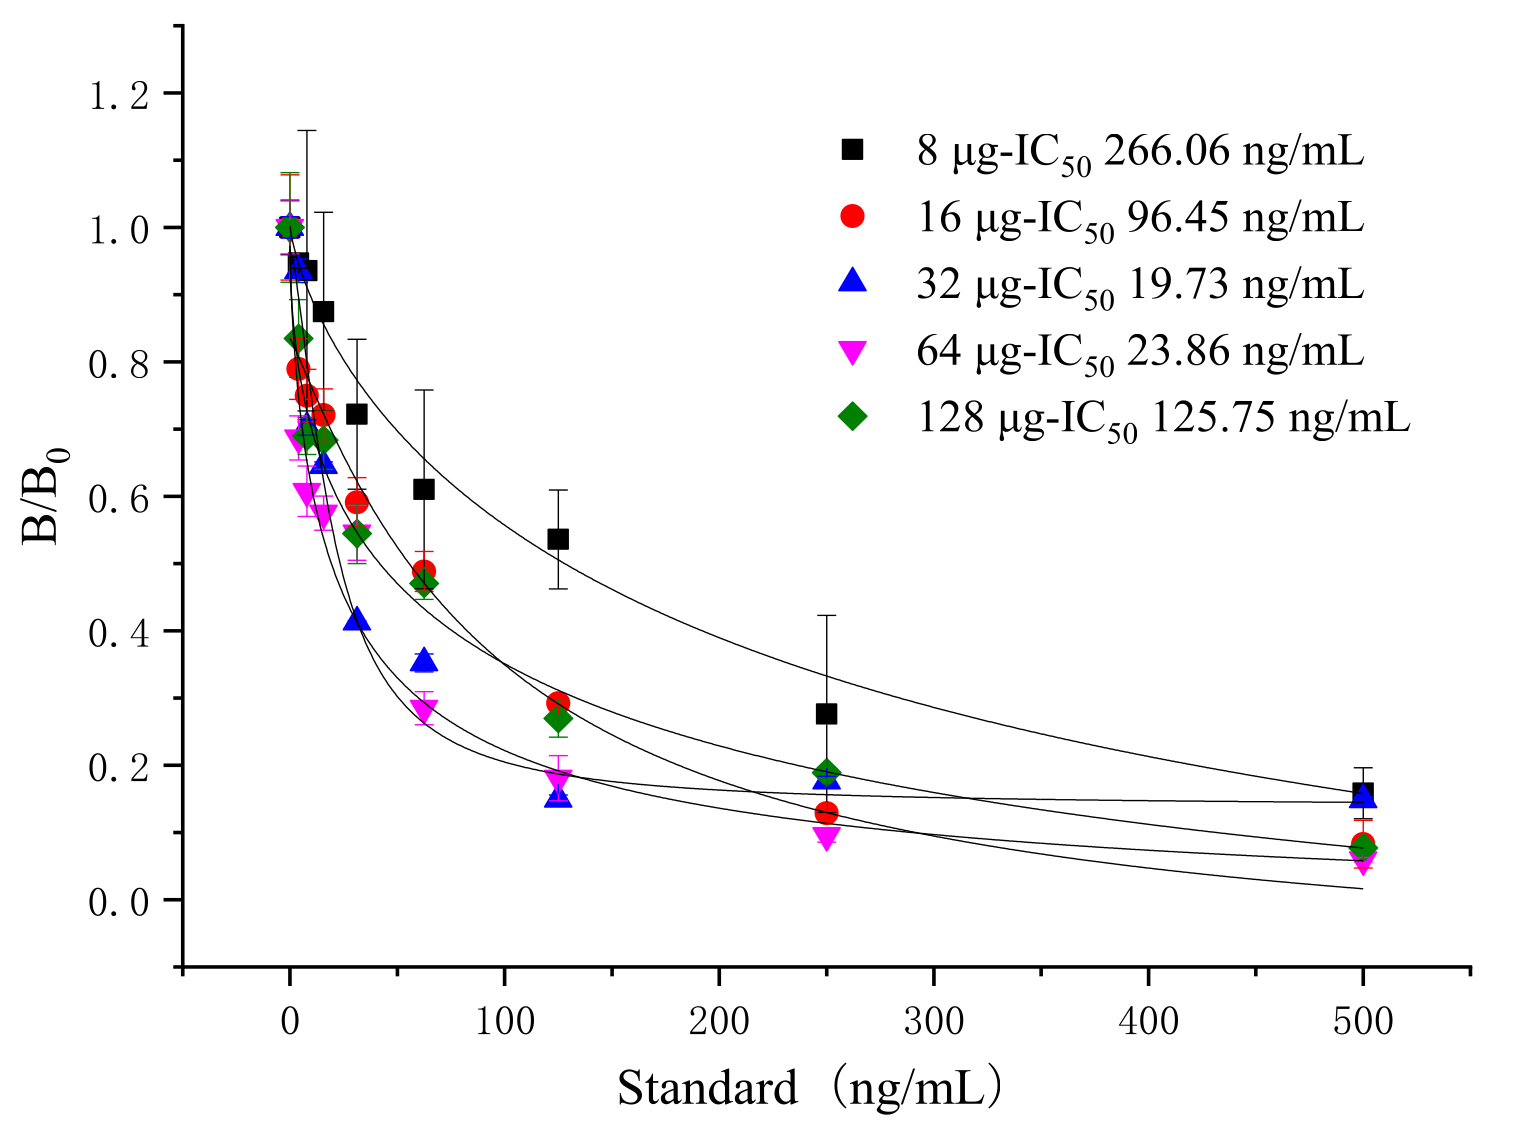
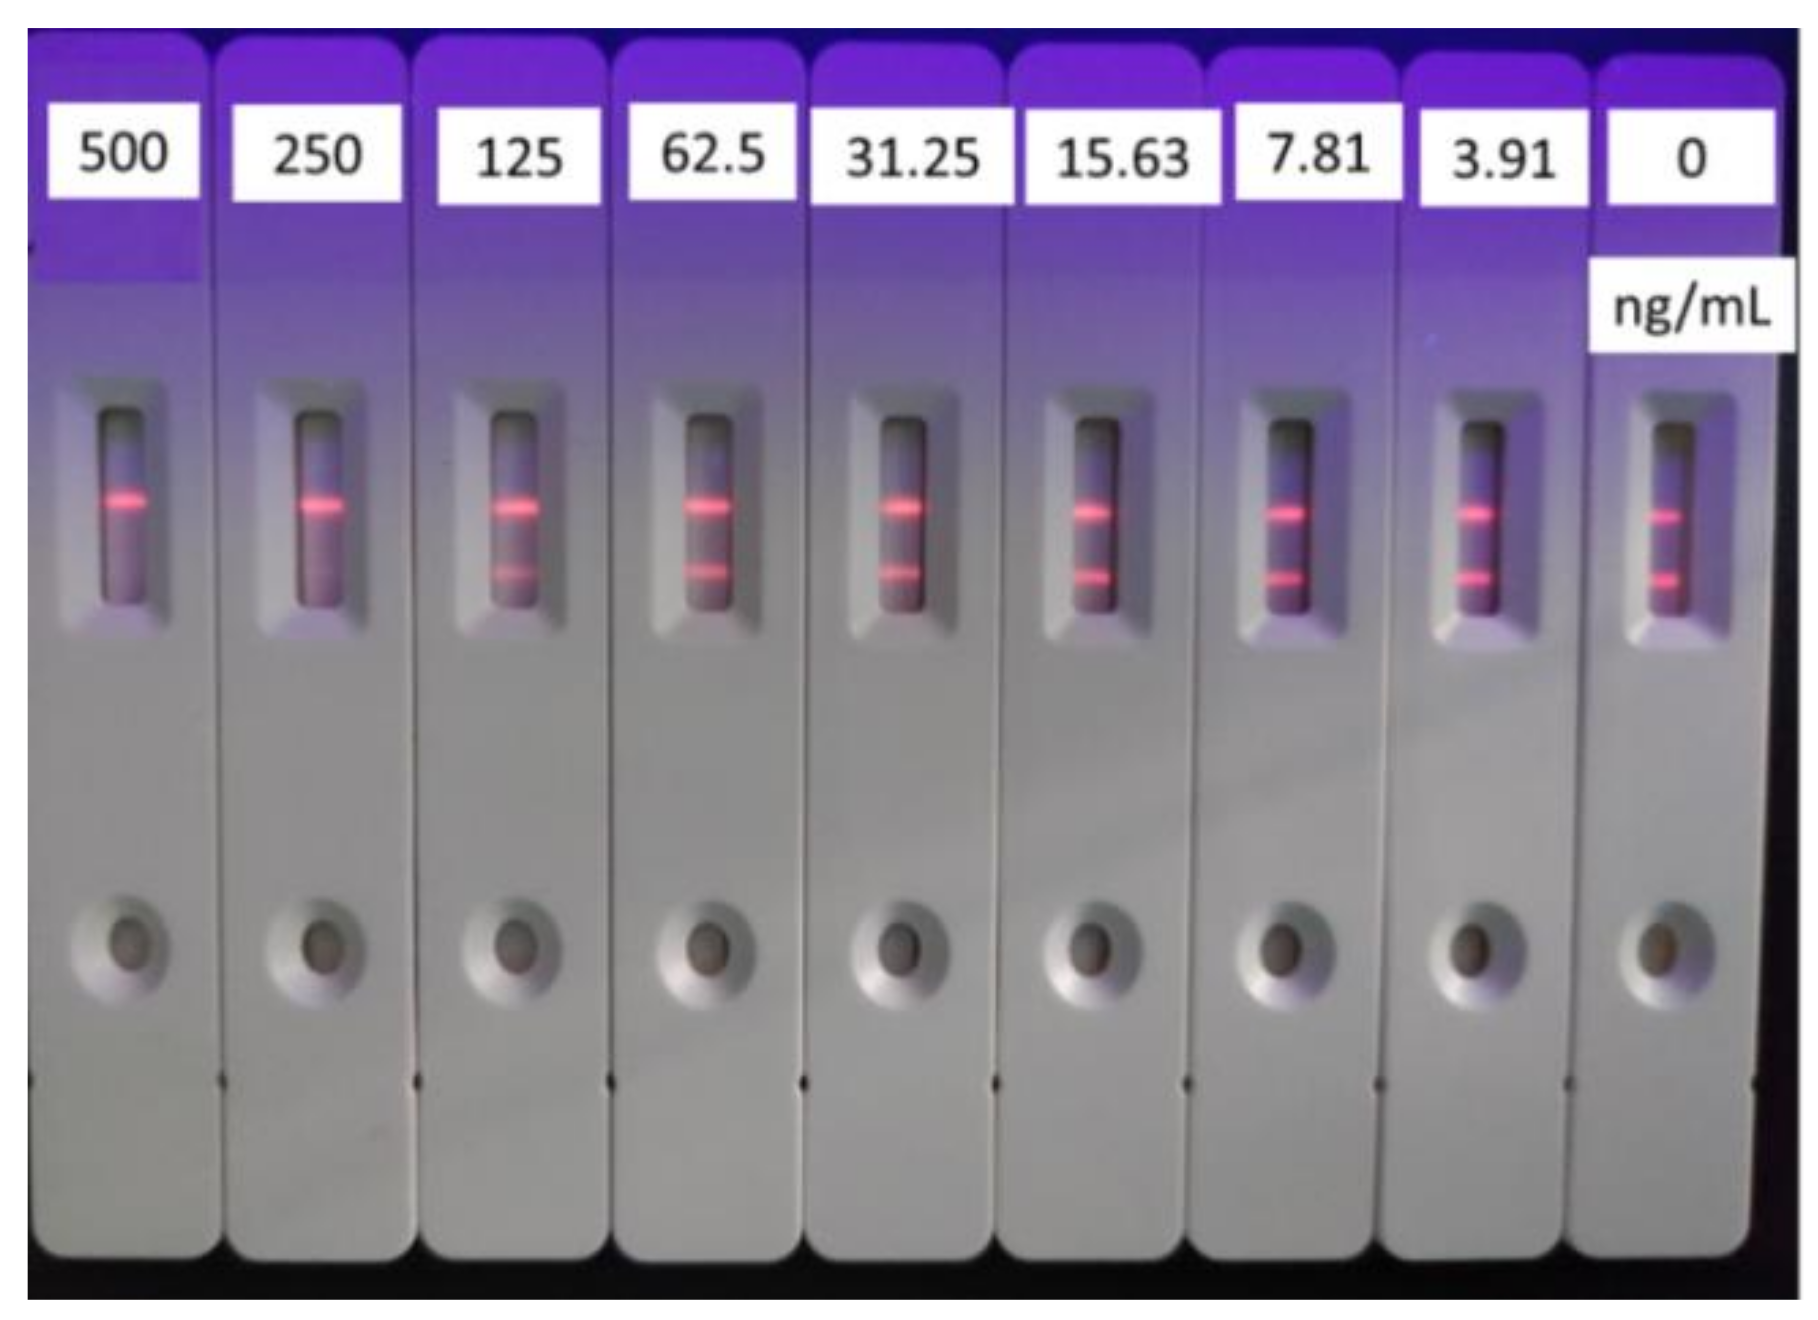
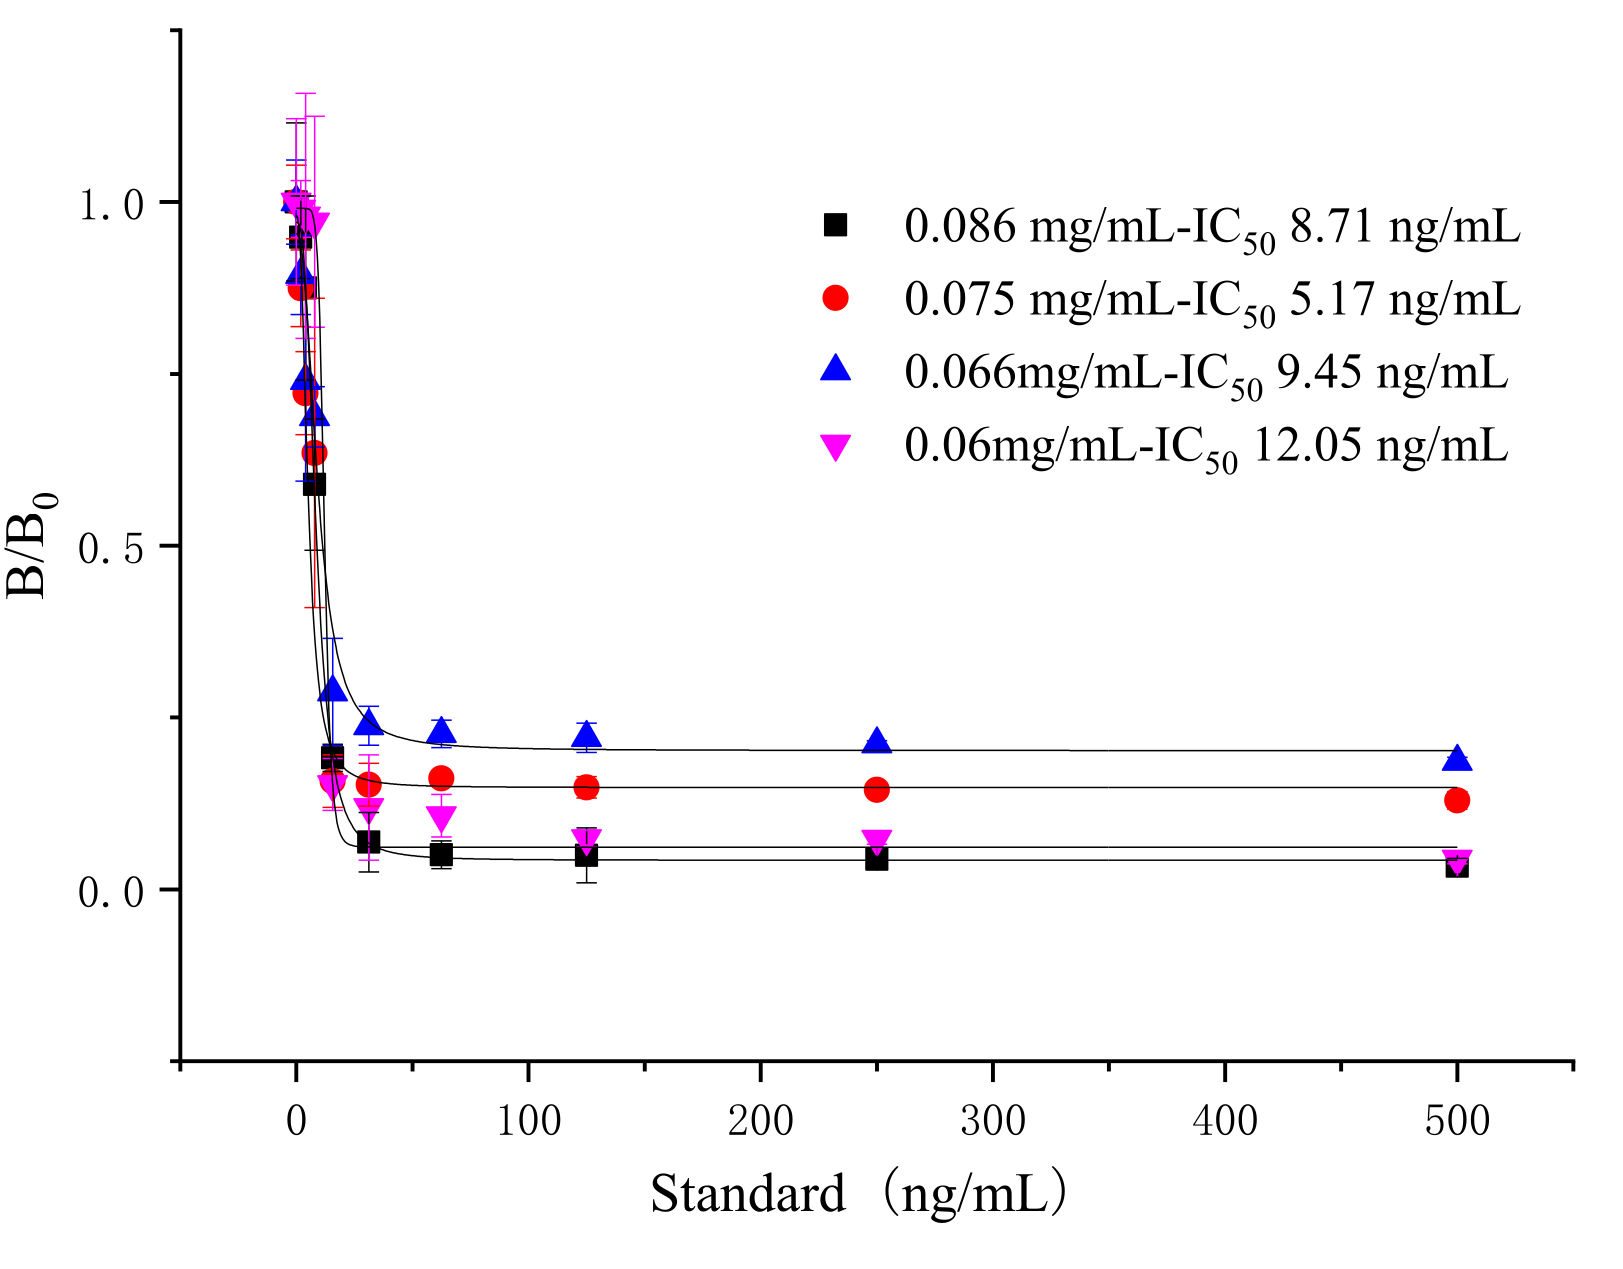
3.3. Selection of the Amount of Coating Antigen on Test Line
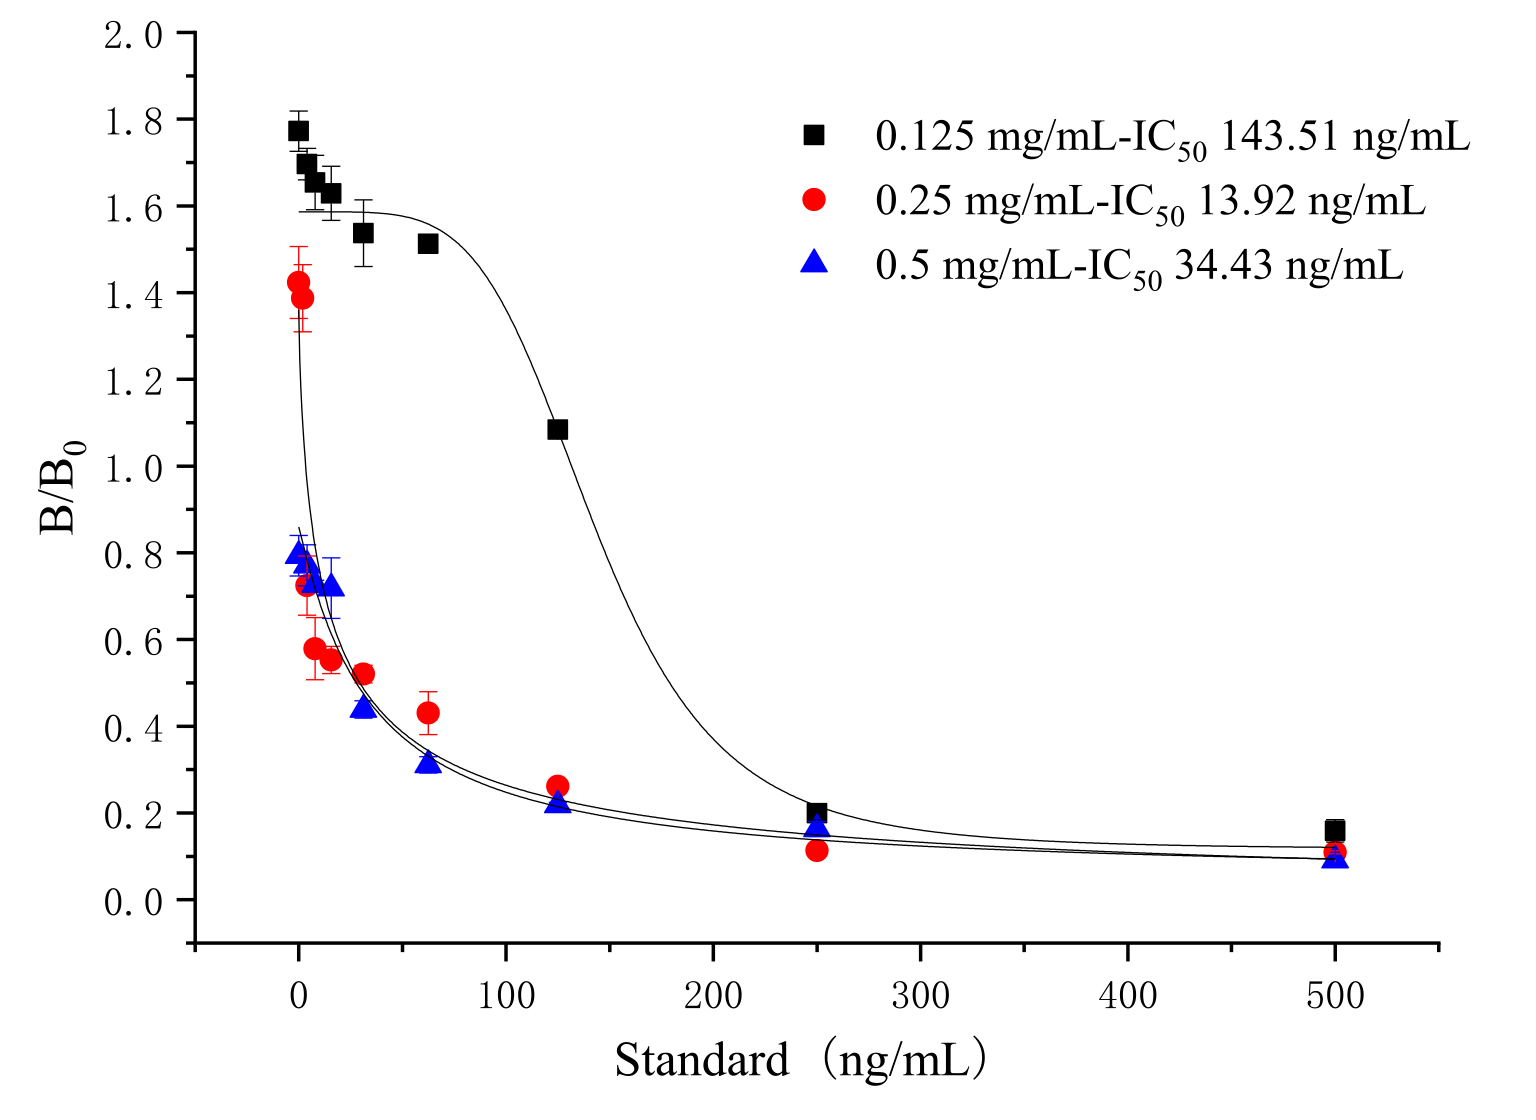
3.4. Selection of the Amount of Goat Anti-Mouse IgG on Control Line
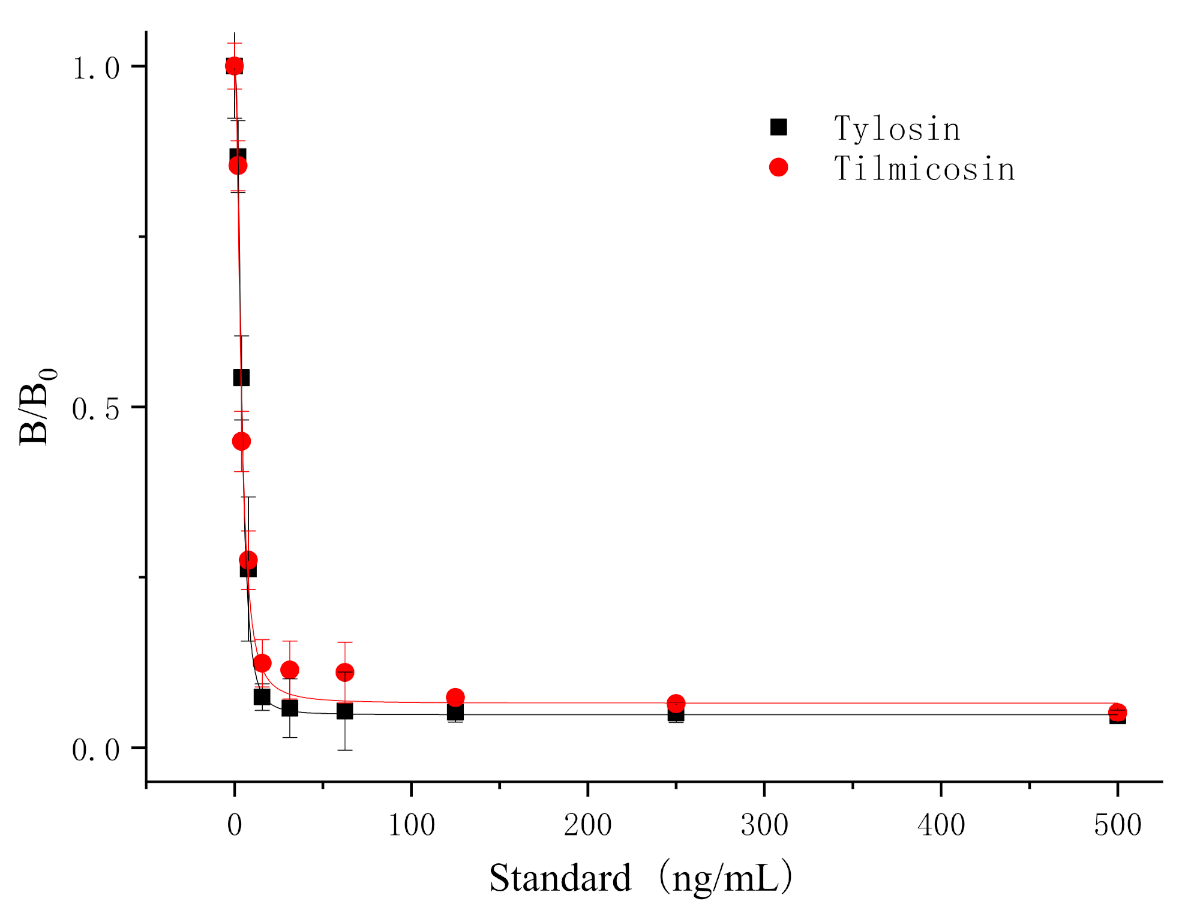
3.5. Cross-Reactivities of TRFIA
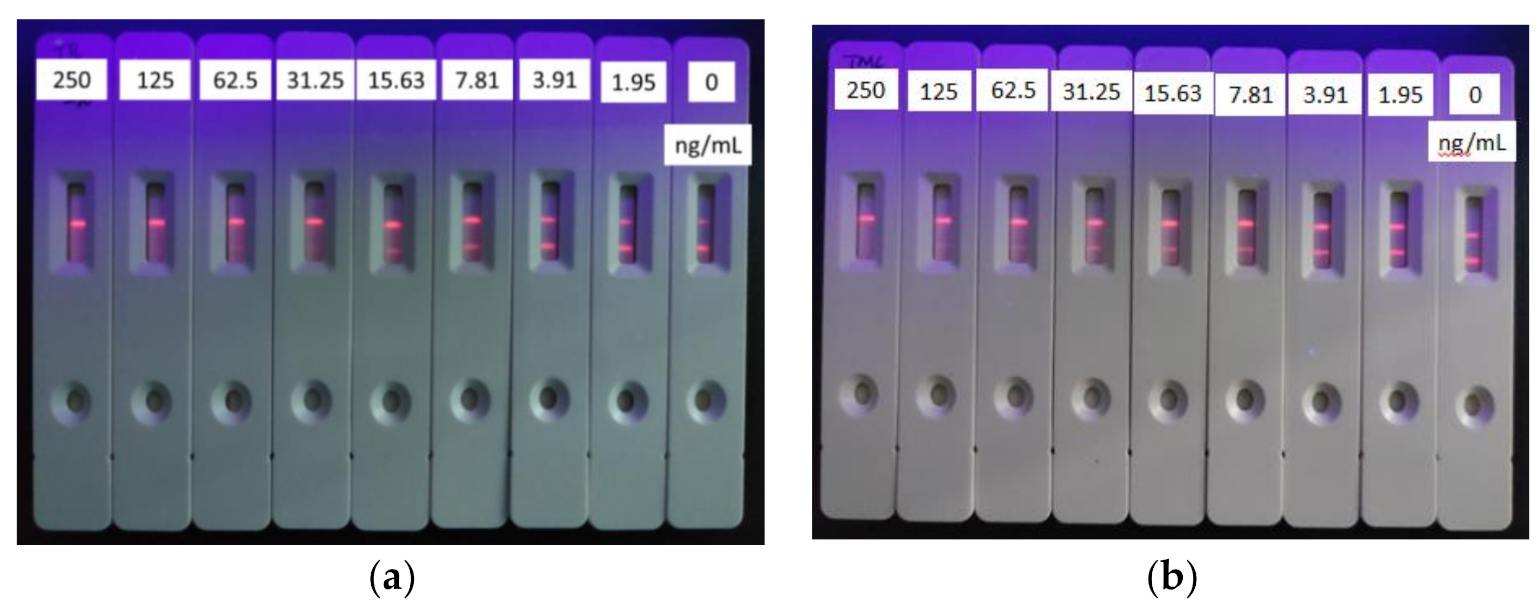
3.6. Detection of T&T in Milk Using the TRFIA Method
3.7. Test in Spiked Samples and Real Positive Sample
4. Conclusions
Author Contributions
Funding
Institutional Review Board Statement
Data Availability Statement
Conflicts of Interest
References
- Le, T.; He, H.; Niu, X.; Chen, Y.; Xu, J. Development of an immunochromatographic assay for detection of tylosin and tilmicosin in muscle, liver, fish and eggs. Food Agric. Immunol. 2013, 24, 467–480. [Google Scholar] [CrossRef]
- Council Regulation (EC) No 2821/98 of 17 December 1998 amending, as regards withdrawal of the authorisation of certain antibiotics, Directive 70/524/EEC concerning additives in feeding stuffs. Off. J. Eur. Communities 1998, L351, 4–8.
- Arsic, B.; Barber, J.; Cikos, A.; Mladenovic, M.; Stankovic, N.; Novak, P. 16-membered macrolide antibiotics: A review. Int. J. Antimicrob. Agents 2017, 51, 283–298. [Google Scholar] [CrossRef] [PubMed]
- Jones, P.W.; Tarrant, M.E. The effect of various factors on the efficacy of tylosin as a growth promoter in clinically healthy pigs. Anim. Prod. 2010, 34, 115–121. [Google Scholar] [CrossRef]
- Cusack, P.M.V. Effect of mass medication with antibiotics at feedlot entry on the health and growth rate of cattle destined for the Australian domestic market. Aust. Vet. J. 2004, 82, 154–156. [Google Scholar] [CrossRef]
- Avci, T.; Elmas, M. Milk and blood pharmacokinetics of tylosin and tilmicosin following parenteral administrations to cows. Sci. World J. 2014, 2014, 869096. [Google Scholar] [CrossRef]
- National Standard of China. GB 31650-2019 National Food Safety Standard-Maximum Residue Limits for Veterinary Drugs in Foods; The People’s Republic of China: Beijng, China, 2020. [Google Scholar]
- Gautier-Bouchardon, A.V.; Reinhardt, A.K.; Kobisch, M.; Kempf, I. In vitro development of resistance to enrofloxacin, erythromycin, tylosin, tiamulin and oxytetracycline in Mycoplasma gallisepticum, Mycoplasma iowae and Mycoplasma synoiae. Vet. Microbiol. 2002, 88, 47–58. [Google Scholar] [CrossRef]
- Tong, J.; Rao, Q.; Zhu, K.; Jiang, Z.; Ding, S. Simultaneous determination of five tetracycline and macrolide antibiotics in feeds using HPCE. J. Sep. Sci. 2009, 32, 4254–4260. [Google Scholar] [CrossRef] [PubMed]
- Hao, H.; Yao, J.; Wu, Q.; Wei, Y.; Dai, M.; Iqbal, Z.; Wang, X.; Wang, Y.; Huang, L.; Chen, D.; et al. Microbiological toxicity of tilmicosin on human colonic microflora in chemostats. Regul. Toxicol. Pharmacol. 2015, 73, 201–208. [Google Scholar] [CrossRef]
- Wang, H.; Ren, L.; Yu, X.; Hu, J.; Chen, Y.; He, G.; Jiang, Q. Antibiotic residues in meat, milk and aquatic products in Shanghai and human exposure assessment. Food Control 2017, 80, 217–225. [Google Scholar] [CrossRef]
- Chebira, B.; Boultif, L.; Agabou, A.; Mekroud, A. Validation of a high performance liquid chromatography (HPLC) method to detect and quantify some antibiotics residues in honey. Adv. Anim. Vet. Sci. 2015, 3, 295–301. [Google Scholar] [CrossRef]
- Hong, Y.Q.; Guo, X.; Chen, G.H.; Zhou, J.W.; Zou, X.M.; Liao, X.; Hou, T. Determination of five macrolide antibiotic residues in milk by micellar electrokinetic capillary chromatography with field amplified sample stacking. J. Food Saf. 2018, 38, e12382. [Google Scholar] [CrossRef]
- Schwaiger, B.; König, J.; Lesueur, C. Development and validation of a multi-class UHPLC-MS/MS method for determination of antibiotic residues in dairy products. Food Anal. Methods 2018, 11, 1417–1434. [Google Scholar] [CrossRef]
- Grutes, J.V.; Ferreira, R.G.; Pereira, M.U.; Candido, F.S.; Spisso, B.F. Development and validation of an LC-MS/MS screening method for macrolide and quinolone residues in baby food. J. Environ. Sci. Health B 2021, 56, 197–211. [Google Scholar] [CrossRef] [PubMed]
- Hoff, R.B.; Molognoni, L.; Deolindo, C.T.P.; Vargas, M.O.; Kleemann, C.R.; Daguer, H. Determination of 62 veterinary drugs in feedingstuffs by novel pressurized liquid extraction methods and LC-MS/MS. J. Chromatogr. B. 2020, 1152, 122232. [Google Scholar] [CrossRef] [PubMed]
- Chiesa, L.M.; DeCastelli, L.; Nobile, M.; Martucci, F.; Mosconi, G.; Fontana, M.; Castrica, M.; Arioli, F.; Panseri, S. Analysis of antibiotic residues in raw bovine milk and their impact toward food safety and on milk starter cultures in cheese-making process. LWT Food Sci. Technol. 2020, 131, 109783. [Google Scholar] [CrossRef]
- Delia, C.F.; David, M.G.; Miriam, B.C.; Antonio, M.D. Critical assessment of two sample treatment methods for multiresidue determination of veterinary drugs in milk by UHPLC-MS/MS. Anal. Bioanal. Chem. 2019, 411, 1433–1442. [Google Scholar]
- Zhang, C.; Deng, Y.; Zheng, J.; Zhang, Y.; Yang, L.; Liao, C.; Su, L.; Zhou, Y.Y.; Gong, D.X.; Chen, L.; et al. The application of the QuEChERS methodology in the determination of antibiotics in food: A review. TRAC Trends Anal. Chem. 2019, 118, 517–537. [Google Scholar] [CrossRef]
- Mirecki, S.; Nikolić, N. Influence of preservative concentration, pH Value and fat content in raw milk at detection limit of microbial inhibitor tests (Delvotest® Accelerator) for amoxicillin and oxytetracycline. Food Anal. Methods 2016, 9, 2864–2871. [Google Scholar] [CrossRef]
- Litterio, N.J.; Calvinho, L.F.; Floresl, M.M.; Tarabla, H.D.; Boggio, J.C. Microbiological screening test validation for detection of tylosin excretion in milk of cows with low and high somatic cell counts. J. Vet. Med. A 2007, 54, 30–35. [Google Scholar] [CrossRef]
- Du, B.; Wen, F.; Guo, X.; Zheng, N.; Zhang, Y.; Li, S.; Zhao, S.; Liu, H.; Meng, L.; Xu, Q.; et al. Evaluation of an ELISA-based visualization microarray chip technique for the detection of veterinary antibiotics in milk. Food Control 2019, 106, 106713. [Google Scholar] [CrossRef]
- Huang, J.X.; Yao, C.Y.; Yang, J.Y.; Li, Z.F.; He, F.; Tian, Y.X.; Wang, H.; Xu, Z.L.; Shen, Y.D. Design of novel haptens and development of monoclonal antibody-based immunoassays for the simultaneous detection of tylosin and tilmicosin in milk and water samples. Biomolecules 2019, 9, 770. [Google Scholar] [CrossRef]
- Peng, D.P.; Ye, S.Q.; Wang, Y.L.; Chen, D.M.; Tao, Y.F.; Huang, L.L.; Liu, Z.L.; Dai, M.H.; Wang, X.Q.; Yuan, Z.H. Development and validation of an indirect competitive enzyme-linked immunosorbent assay for the screening of tylosin and tilmicosin in muscle, liver, milk, honey and eggs. J. Agric. Food Chem. 2012, 60, 44–51. [Google Scholar] [CrossRef] [PubMed]
- Raysyan, A.; Galvidis, I.A.; Schneider, R.J.; Eremin, S.A.; Burkin, M.A. Development of a latex particles-based lateral flow immunoassay for group determination of macrolide antibiotics in breast milk. J. Pharm. Biomed. Anal. 2020, 189, 113450. [Google Scholar] [CrossRef]
- Shen, J.Z.; Zhang, Z.; Yao, Y.; Shi, W.M.; Liu, Y.B.; Zhang, S.X. A monoclonal antibody-based time-resolved fluoroimmunoassay for chloramphenicol in shrimp and chicken muscle. Anal. Chim. Acta 2006, 575, 262–266. [Google Scholar] [CrossRef]
- Zhang, J.; Gao, L.; Zhou, B.; Zhu, L.; Zhang, Y.; Huang, B. Simultaneous detection of deoxynivalenol and zearalenone by dual-label time-resolved fluorescence immunoassay. J. Sci. Food Agric. 2011, 91, 193–197. [Google Scholar] [CrossRef]
- Song, Y.H.; Song, S.S.S.; Liu, L.Q.; Kuang, H.; Guo, L.L.; Xu, C.L. Simultaneous detection of tylosin and tilmicosin in honey using a novel immunoassay and immunochromatographic strip based on an innovative hapten. Food Agric. Immunol. 2016, 27, 1–15. [Google Scholar] [CrossRef]
- Lai, X.C.; Lv, X.; Zhang, G.G.; Xiong, Z.J.; Lai, W.H.; Peng, J. Highly specific anti-tylosin monoclonal antibody and its application in the quantum dot bead-based iImmunochromatographic assay. Food Anal. Methods 2020, 13, 2258–2268. [Google Scholar] [CrossRef]
- Zhang, Z.; Liu, J.F.; Yao, Y.; Jiang, G.B. A competitive dual-labelled time-resolved fluoroimmunoassay for simultaneous determination of chloramphenicol and ractopamine in swine tissues. Chin. Sci. Bull 2011, 56, 1543–1547. [Google Scholar] [CrossRef]
- Wei, S.; Le, T.; Chen, Y.; Xu, J.; He, H.Q.; Niu, X.D.; Luo, J.H. Time-resolved fluoroimmunoassay for quantitative determination of tylosin and tilmicosin in edible animal tissues. Chin. Sci. Bull 2013, 58, 1838–1842. [Google Scholar] [CrossRef]
- Li, X.M.; Wu, X.Z.; Wang, J.; Hua, Q.C.; Wu, J.X.; Shen, X.; Sun, Y.M.; Lei, H.T. Three lateral flow immunochromatographic assays based on different nanoparticle probes for on-site detection of tylosin and tilmicosin in milk and pork. Sens. Actuators B Chemical. 2019, 301, 127059. [Google Scholar] [CrossRef]
- Tang, X.; Zhang, Q.; Zhang, Z.; Ding, X.; Jiang, J.; Zhang, W.; Li, P. Rapid, on-site and quantitative paper-based immunoassay platform for concurrent determination of pesticide residues and mycotoxins. Anal. Chim. Acta 2019, 1078, 142–150. [Google Scholar] [CrossRef] [PubMed]
- Wang, D.; Zhu, J.G.; Zhang, Z.W.; Zhang, Q.; Zhang, W.; Yu, L.; Jiang, J.; Chen, X.M.; Wang, X.F.; Li, P.W. Simultaneous lateral flow immunoassay for multi-class chemical contaminants in maize and peanut with one-stop sample preparation. Toxins 2019, 11, 56. [Google Scholar] [CrossRef]
- Zhang, Y.; Wang, W.; Liu, J.W.; Wang, S. Study on the colloidal gold-based immunoassays for the rapid detection of chloramphenicol residues in animal derived food. J. Chin. Inst. Food Sci. Technol. 2009, 9, 196–200. [Google Scholar]


| Labeled Antibodies | 1 μL | 2 μL | 3 μL | 4 μL | ||||
|---|---|---|---|---|---|---|---|---|
| Analyst | Negative | 125 ng/mL | Negative | 125 ng/mL | Negative | 125 ng/mL | Negative | 125 ng/mL |
| T/C (M ± SD a) | 1.2514 ± 0.12 | 0.4188 ± 0.23 | 0.8171 ± 0.14 | 0.2815 ± 0.08 | 1.3649 ± 0.18 | 0.2451 ± 0.07 | 1.3868 ± 0.19 | 0.3470 ± 0.04 |
| Inhibition Rate | 66.5% | 65.5% | 82.0% | 75.0% | ||||
| Compounds | Chemical Structure | IC50 (ng/mL) | Cross-Reactivity (%) |
|---|---|---|---|
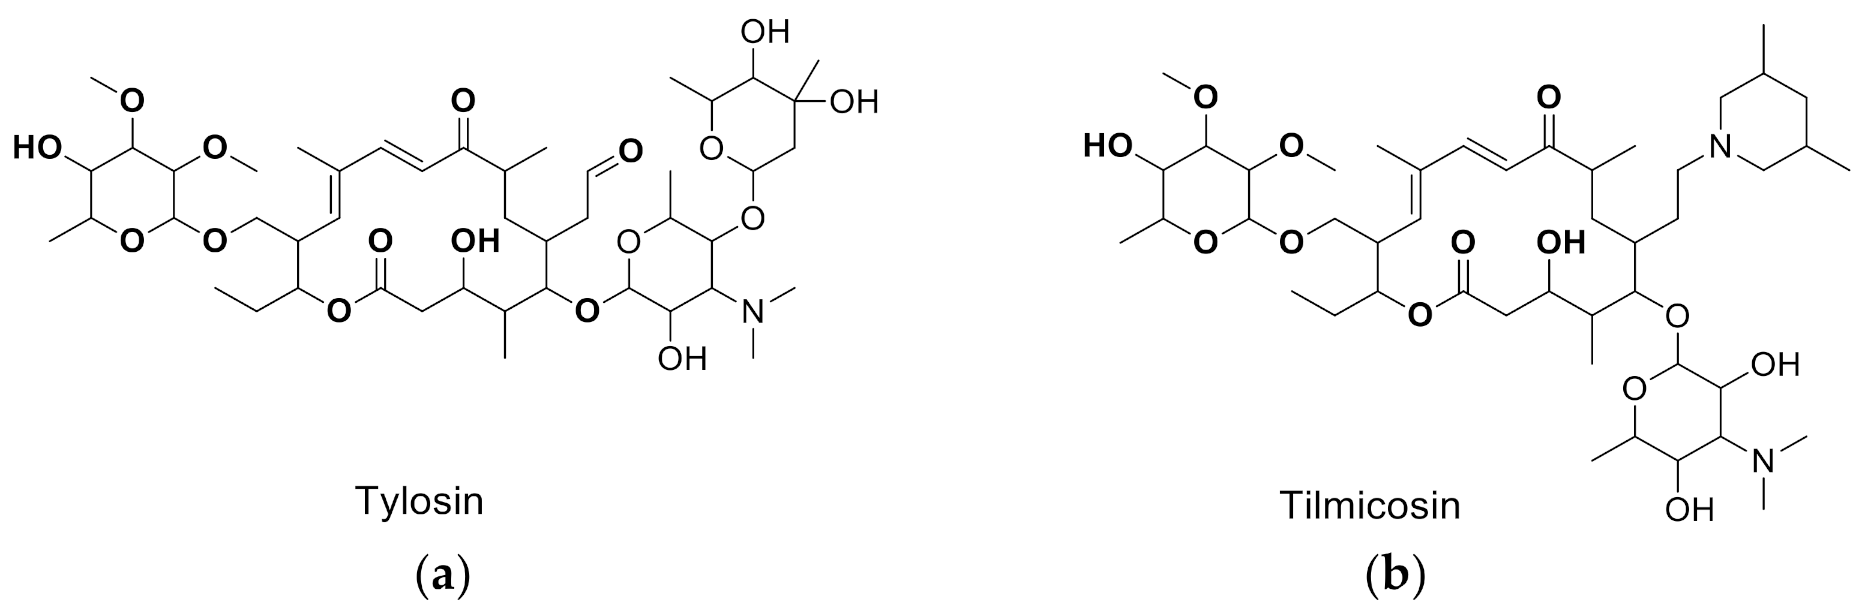
| Tylosin |  | 5.76 | 100 |
| Tilmicosin | 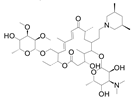 | 4.63 | 124.4 |
| Erythromycin | 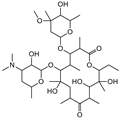 | >4000 | <0.1 |
| Norfloxacin | 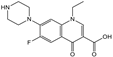 | >4000 | <0.1 |
| Norfloxacin | 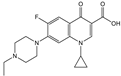 | >4000 | <0.1 |
| Azithromycin |  | >4000 | <0.1 |
| Acetylspramycin | 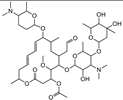 | >4000 | <0.1 |
| Roxithromycin | 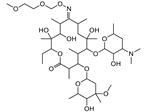 | >4000 | <0.1 |
| Clinafloxacin | 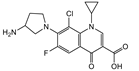 | >4000 | <0.1 |
| Pefloxacin | 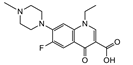 | >4000 | <0.1 |
| Furazolidone | 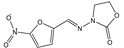 | >4000 | <0.1 |
| Spiramycin | 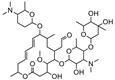 | >4000 | <0.1 |
| Nitrofural |  | >4000 | <0.1 |
| Furadantin | 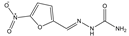 | >4000 | <0.1 |
| Days | Negative Samples | Positive Samples | Inhibition Rate (%) |
|---|---|---|---|
| (Mean ± SD a) | (Mean ± SD) | ||
| 1 | 1.2523 ± 0.19 | 0.1188 ± 0.07 | 90.5 |
| 3 | 1.3621 ± 0.16 | 0.0872 ± 0.04 | 93.6 |
| 5 | 1.2398 ± 0.21 | 0.1002 ± 0.09 | 91.9 |
| 7 | 1.2478 ± 0.15 | 0.0983 ± 0.11 | 92.0 |
| TRFICA | Commercial ELISA Kit | |||||||
|---|---|---|---|---|---|---|---|---|
| Samples | Spiked | Spiked Level (ng/mL) | Measured (Mean ± SD) (ng/mL) | Recoveries (%) | CV (%) | Measured (Mean ± SD) (ng/mL) | Recoveries (%) | CV (%) |
| Milk | Tylosin | 5 | 5.98 ± 0.05 | 119.6 | 12.1 | 6.15 ± 0.08 | 122.9 | 1.3 |
| 10 | 12.45 ± 0.04 | 124.5 | 10.1 | 11.39 ± 0.03 | 113.9 | 0.2 | ||
| 20 | 24.08 ± 0.18 | 120.4 | 1.9 | 18.41 ± 0.01 | 92.1 | 0.1 | ||
| Tilmicosin | 5 | 5.56 ± 0.03 | 111.2 | 13.9 | 5.40 ± 0.08 | 108.1 | 1.5 | |
| 10 | 8.05 ± 0.02 | 80.6 | 7.2 | 11.21 ± 0.01 | 112.1 | 0.1 | ||
| 20 | 17.12 ± 0.04 | 85.7 | 4.1 | 19.38 ± 0.01 | 96.9 | 0.1 | ||
| Samples | Analytes | TRFICA (mg/L) | HPLC-MS/MS (mg/L) |
|---|---|---|---|
| Milk 1 | Tylosin and Tilmicosin | ND | ND |
| Milk 2 | Tilmicosin | 10.99 | 10.21 |
| Milk 3 | Tilmicosin | 24.08 | 25.93 |
Publisher’s Note: MDPI stays neutral with regard to jurisdictional claims in published maps and institutional affiliations. |
© 2021 by the authors. Licensee MDPI, Basel, Switzerland. This article is an open access article distributed under the terms and conditions of the Creative Commons Attribution (CC BY) license (https://creativecommons.org/licenses/by/4.0/).
Share and Cite
Wang, Y.; Yang, J.-Y.; He, Y.; Li, L.; Huang, J.-X.; Tian, Y.-X.; Wang, H.; Xu, Z.-L.; Shen, Y.-D. Development of Time-Resolved Fluorescence Immunochromatographic Assays for Simultaneously Detecting Tylosin and Tilmicosin in Milk in Group-Screening Manner. Foods 2021, 10, 1838. https://doi.org/10.3390/foods10081838
Wang Y, Yang J-Y, He Y, Li L, Huang J-X, Tian Y-X, Wang H, Xu Z-L, Shen Y-D. Development of Time-Resolved Fluorescence Immunochromatographic Assays for Simultaneously Detecting Tylosin and Tilmicosin in Milk in Group-Screening Manner. Foods. 2021; 10(8):1838. https://doi.org/10.3390/foods10081838
Chicago/Turabian StyleWang, Yu, Jin-Yi Yang, Ying He, Lu Li, Jian-Xin Huang, Yuan-Xin Tian, Hong Wang, Zhen-Lin Xu, and Yu-Dong Shen. 2021. "Development of Time-Resolved Fluorescence Immunochromatographic Assays for Simultaneously Detecting Tylosin and Tilmicosin in Milk in Group-Screening Manner" Foods 10, no. 8: 1838. https://doi.org/10.3390/foods10081838
APA StyleWang, Y., Yang, J.-Y., He, Y., Li, L., Huang, J.-X., Tian, Y.-X., Wang, H., Xu, Z.-L., & Shen, Y.-D. (2021). Development of Time-Resolved Fluorescence Immunochromatographic Assays for Simultaneously Detecting Tylosin and Tilmicosin in Milk in Group-Screening Manner. Foods, 10(8), 1838. https://doi.org/10.3390/foods10081838