
Diving Deep into the Data: A Review of Deep Learning Approaches and Potential Applications in Foodomics


Abstract
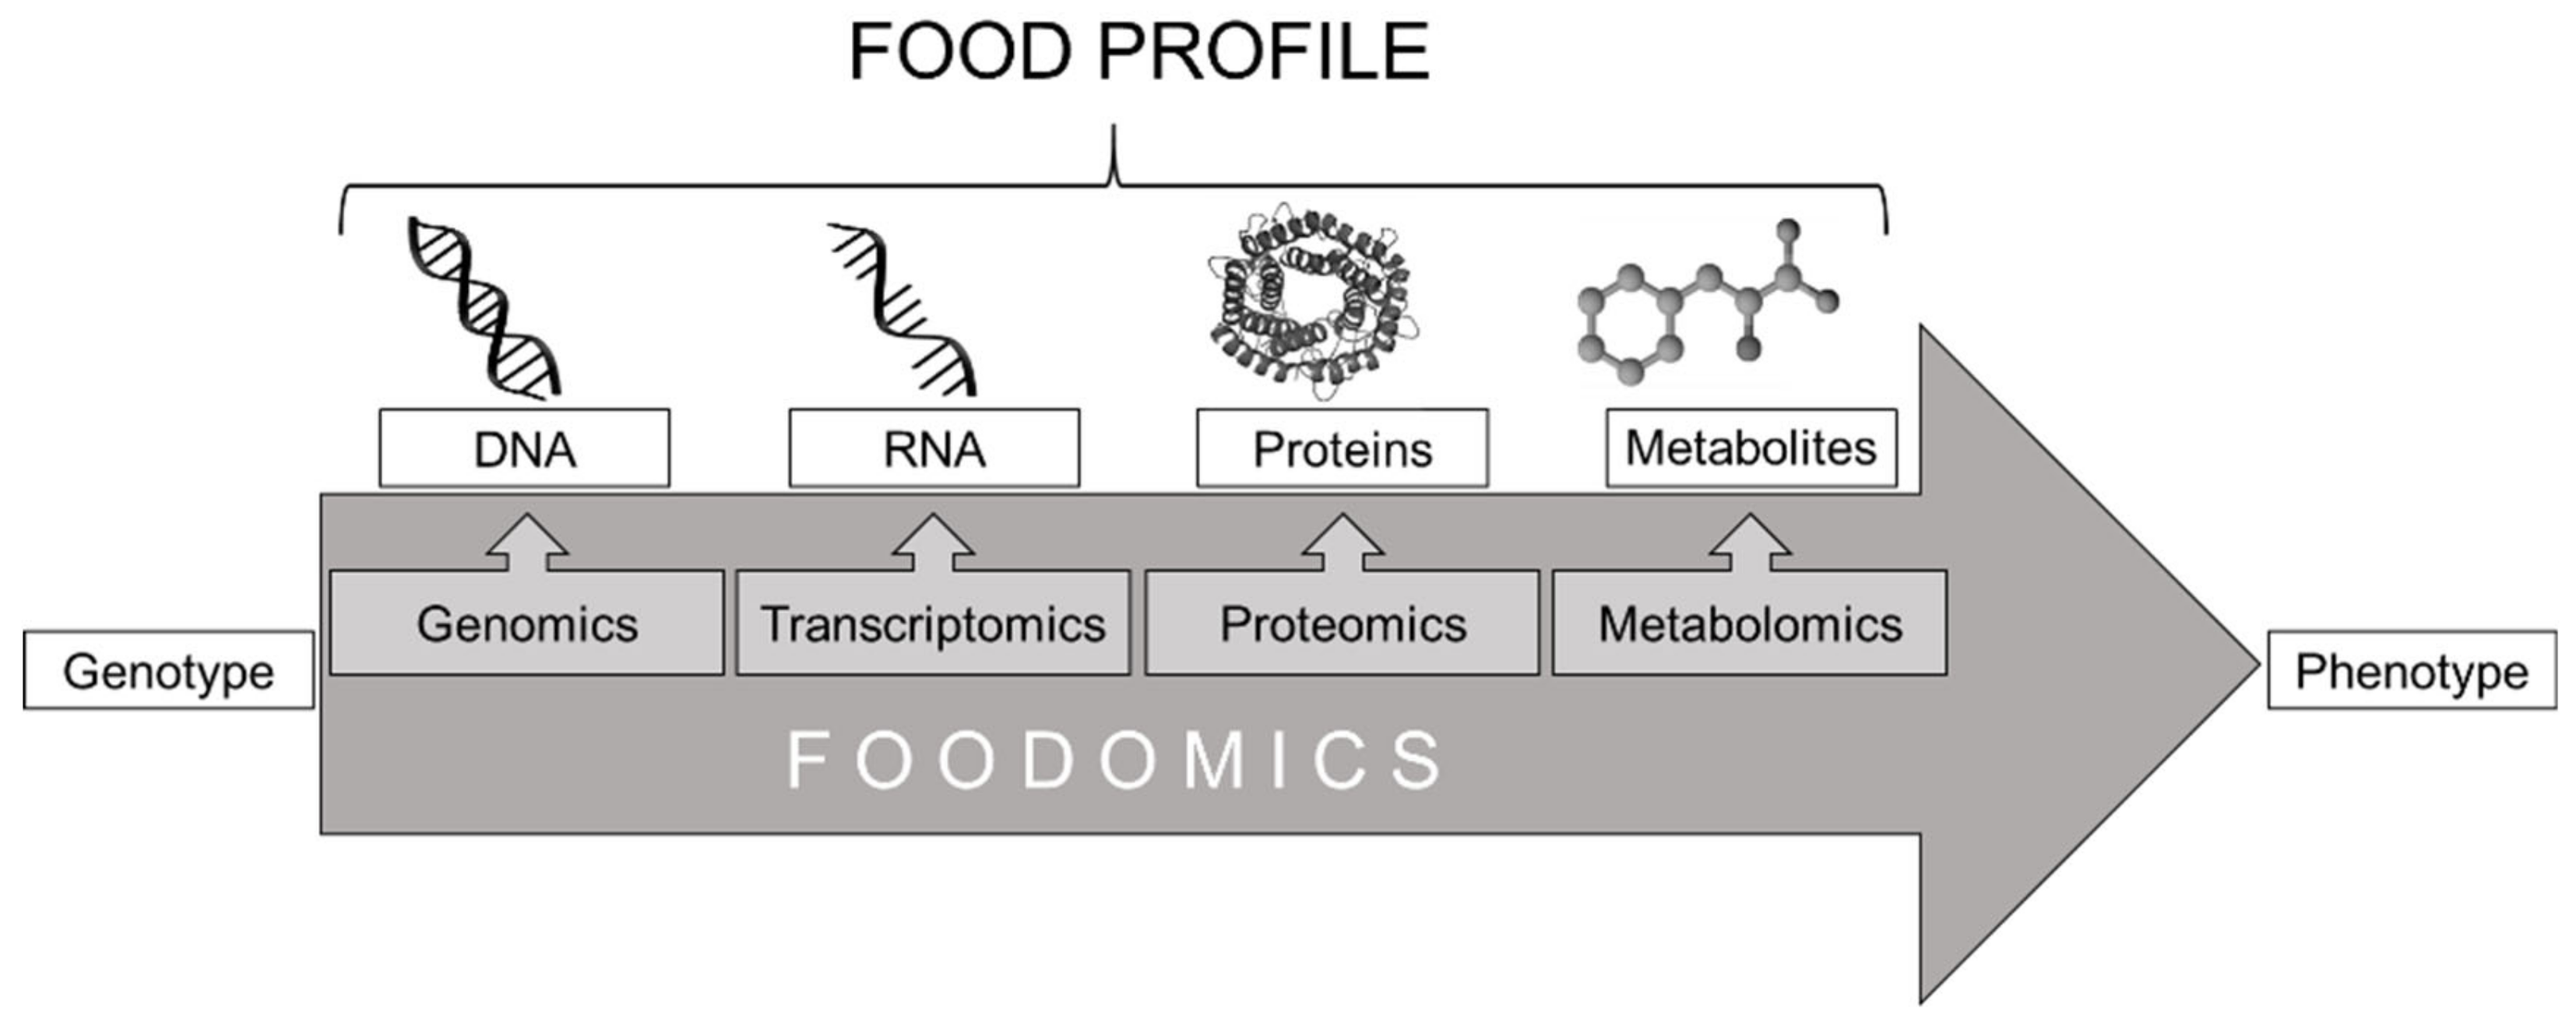
:1. Introduction
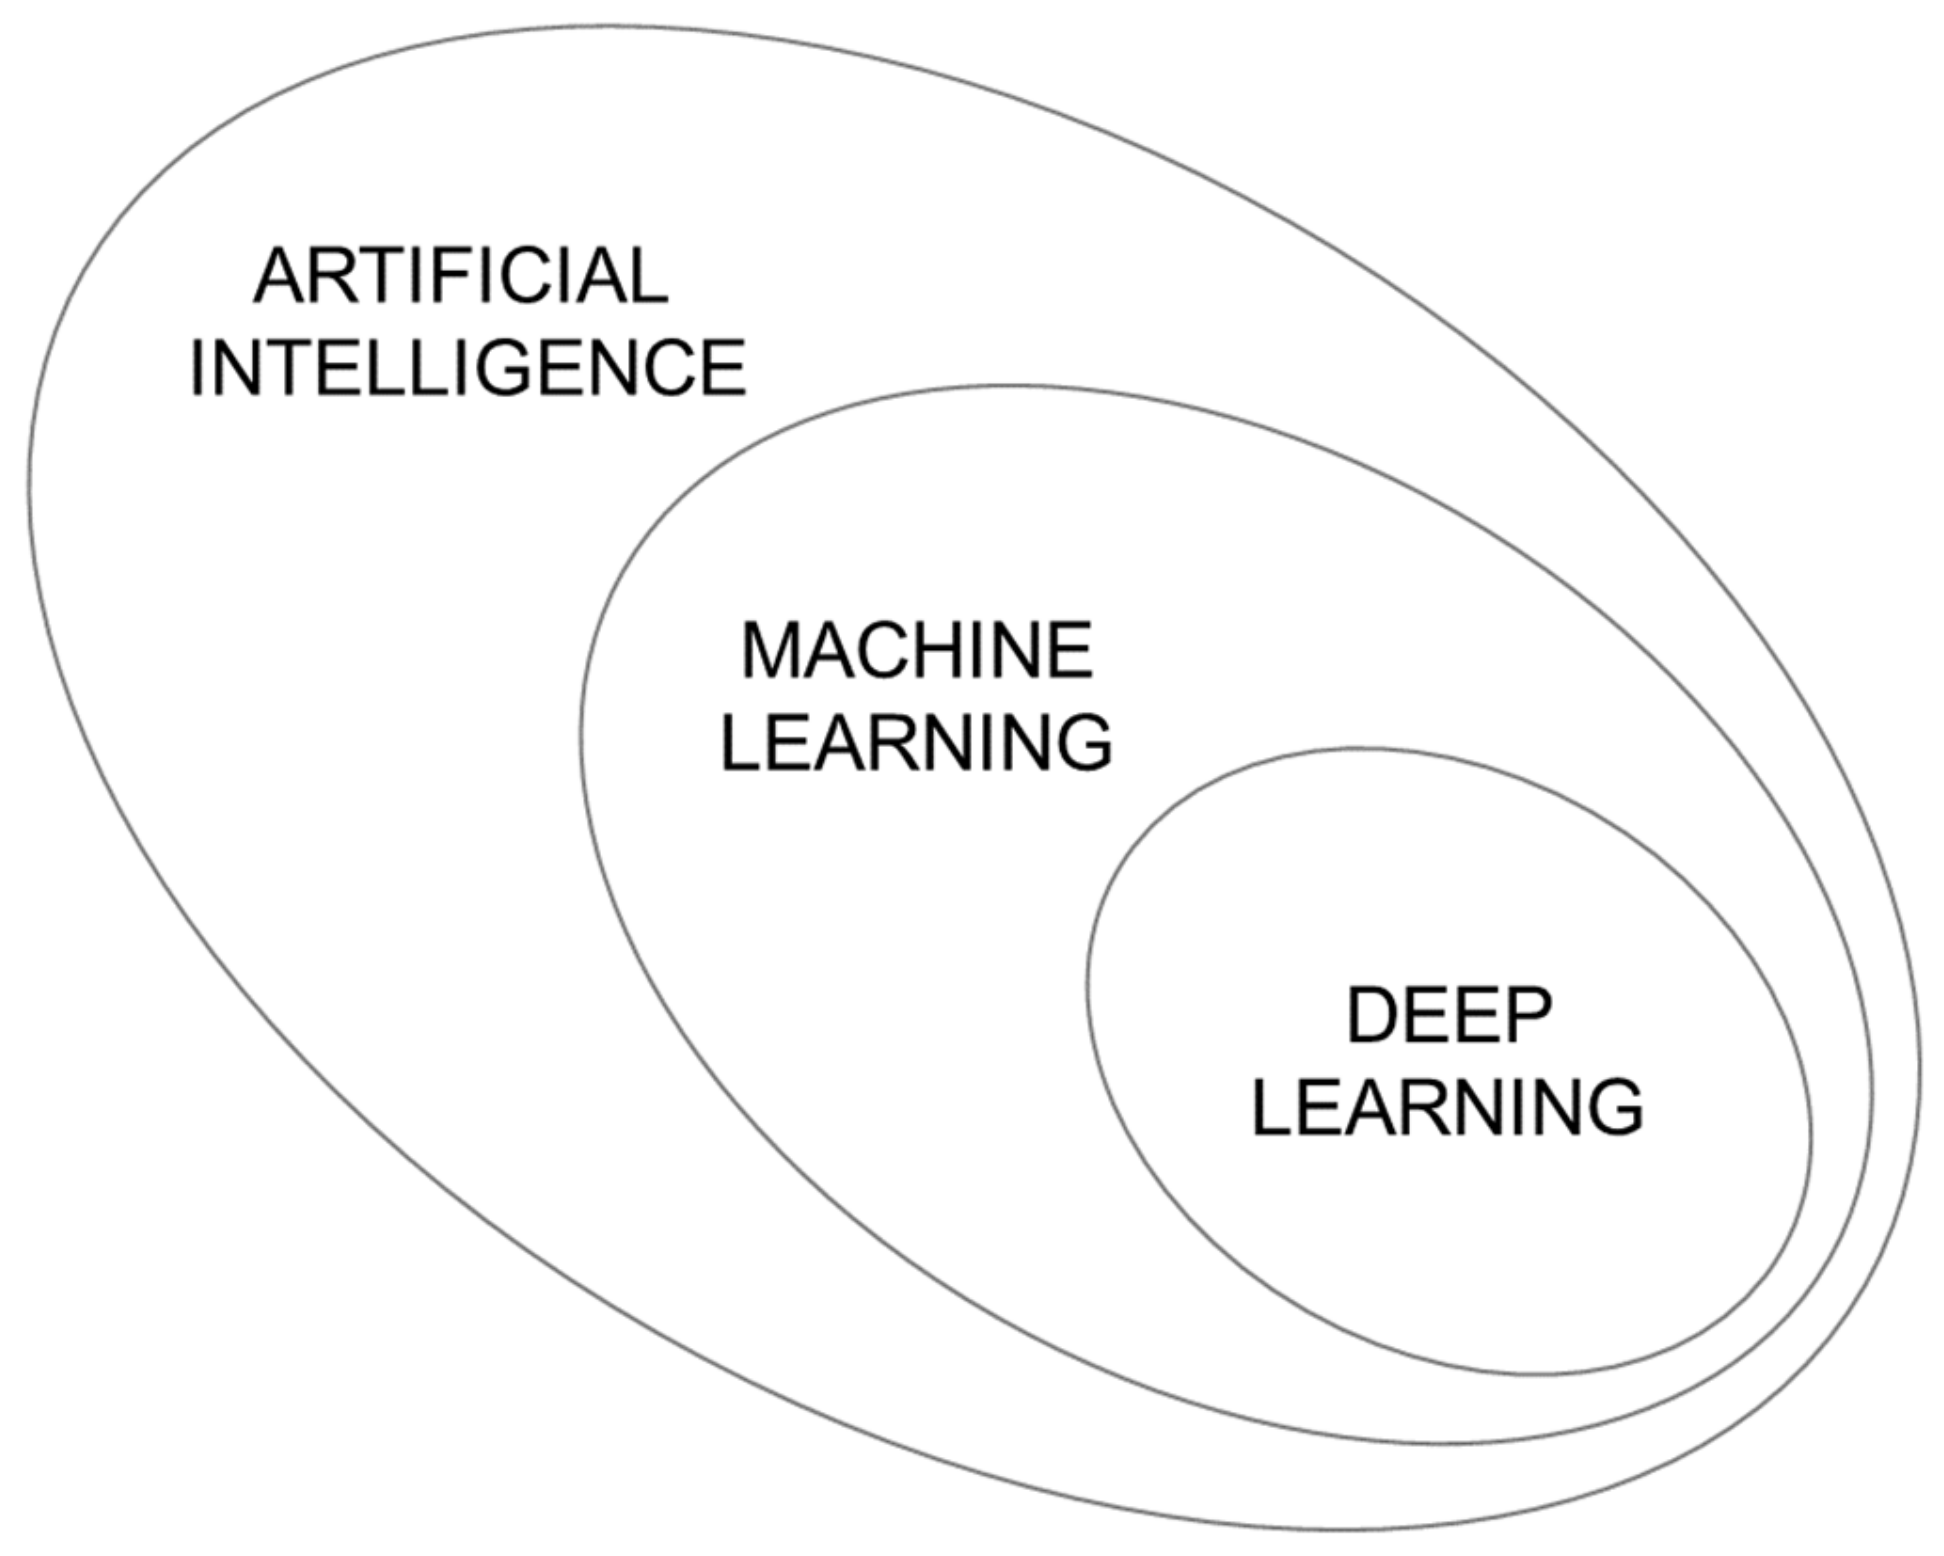
2. Chemometrics, Artificial Intelligence, and Machine Learning
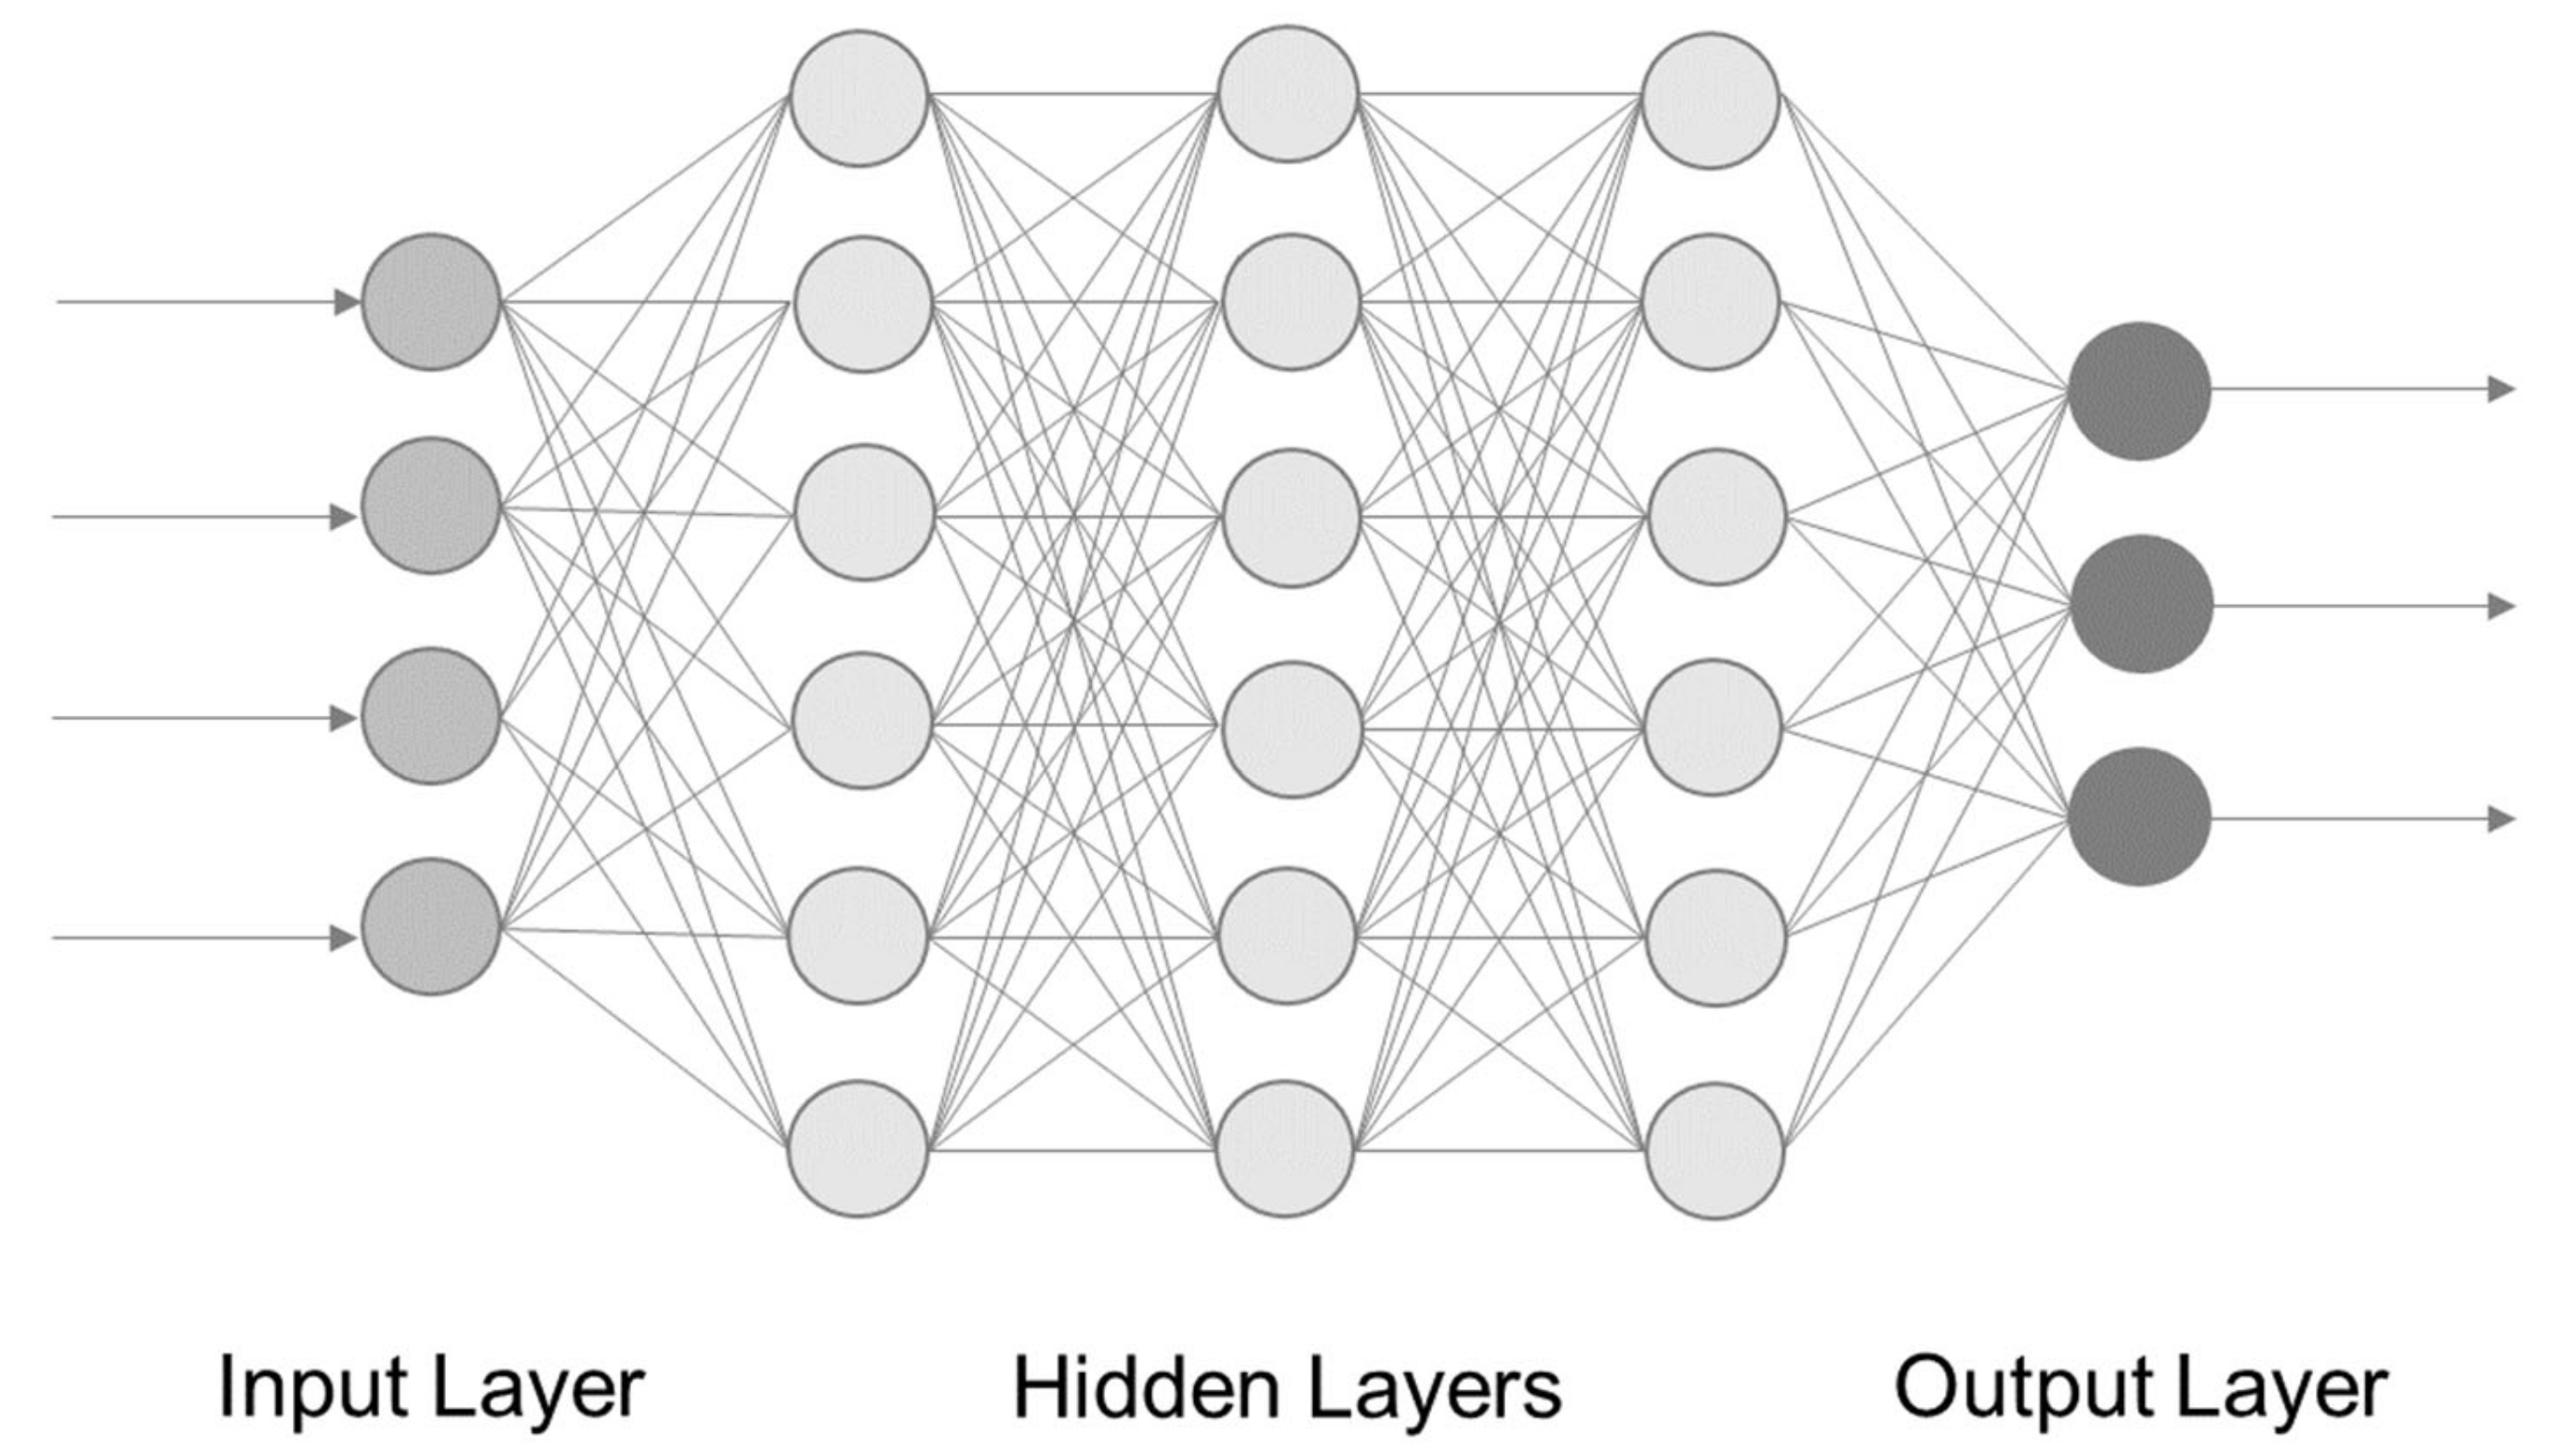
3. Deep Learning
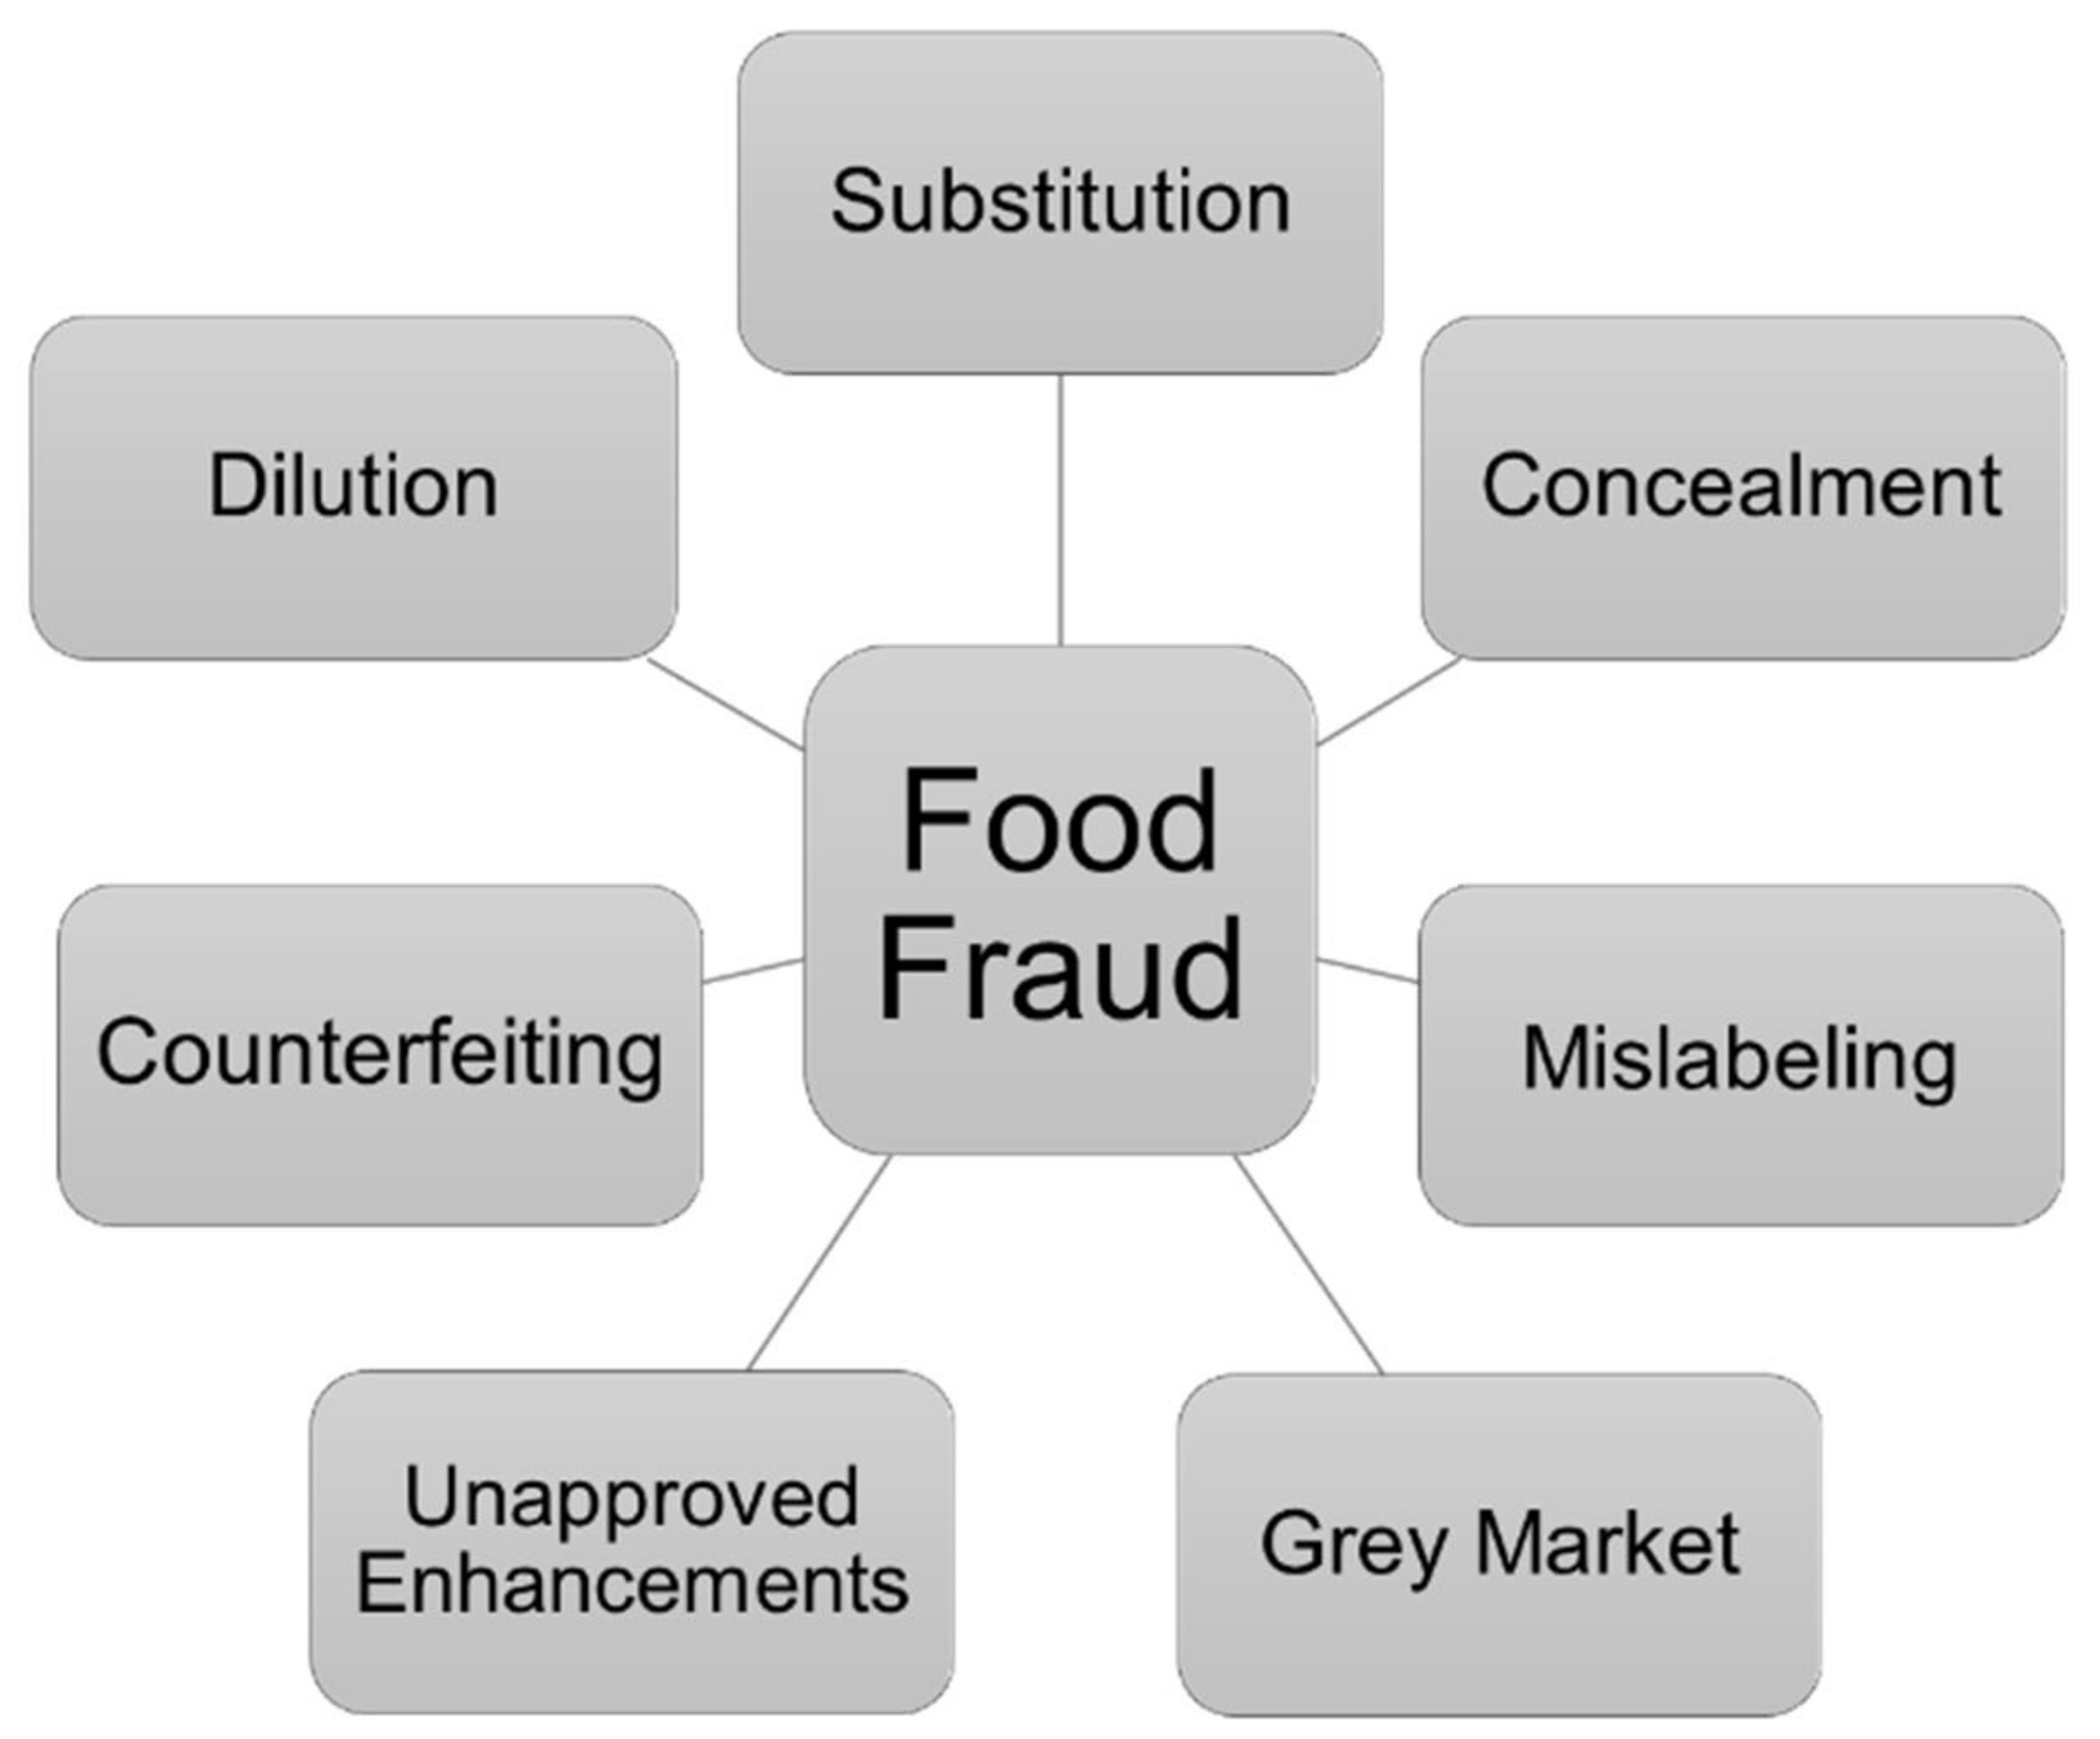
4. Food Fraud and Food Authenticity
5. Prediction of Shelf-Life
6. Peptide Sequencing
7. Conclusions and Future Perspectives
Author Contributions
Funding
Institutional Review Board Statement
Informed Consent Statement
Conflicts of Interest
References
- García-Cañas, V.; Simó, C.; Herrero, M.; Ibáñez, E.; Cifuentes, A. Present and future challenges in food analysis: Foodomics. Anal. Chem. 2012, 84, 10150–10159. [Google Scholar] [CrossRef] [Green Version]
- Chammem, N.; Issaoui, M.; De Almeida, A.I.D.; Delgado, A.M. Food Crises and Food Safety Incidents in European Union, United States, and Maghreb Area: Current Risk Communication Strategies and New Approaches. J. AOAC Int. 2018, 101, 923–938. [Google Scholar] [CrossRef] [PubMed]
- Cifuentes, A. Food analysis and foodomics. J. Chromatogr. A 2009, 1216, 7109. [Google Scholar] [CrossRef] [PubMed] [Green Version]
- Baumann, F.; Buschhausen-Denker, G.; Butschke, A.; Fischer, M.; Fritsche, J.; Holle, M.; Von Holleben, K.; Krause, I.; Van der Meulen, B.; Riehn, K.; et al. Lebensmittelsicherheit & Verpackung Food Science Dialog der Hochschule für Angewandte Wissenschaft (HAW) Hamburg, 15–19. September 2014. J. Verbraucherschutz Leb. 2014, 9, 391–420. [Google Scholar] [CrossRef]
- Hasin, Y.; Seldin, M.; Lusis, A. Multi-omics approaches to disease. Genome Biol. 2017, 18, 1–15. [Google Scholar] [CrossRef]
- Schneider, M.V.; Orchard, S. Omics Technologies, Data and Bioinformatics Principles; Mayer, B., Ed.; Humana Press: Totowa, NJ, USA, 2011; Volume 719, ISBN 978-1-61779-026-3. [Google Scholar]
- Matissek, R.; Fischer, M.; Steiner, G. Lebensmittelanalytik; Springer: Berlin/Heidelberg, Germany, 2018; ISBN 9783662557211. [Google Scholar]
- Wang, Z.; Gerstein, M.; Snyder, M. RNA-Seq: A revolutionary tool for transcriptomics. Nat. Rev. Genet. 2009, 10, 57–63. [Google Scholar] [CrossRef]
- Smith, L.M.; Kelleher, N.L. Proteoform: A single term describing protein complexity. Nat. Methods 2013, 10, 186–187. [Google Scholar] [CrossRef] [PubMed] [Green Version]
- Pruitt, K.D.; Tatusova, T.; Maglott, D.R. NCBI reference sequences (RefSeq): A curated non-redundant sequence database of genomes, transcripts and proteins. Nucleic Acids Res. 2007, 35, 61–65. [Google Scholar] [CrossRef] [PubMed] [Green Version]
- Schlüter, H.; Apweiler, R.; Holzhütter, H.G.; Jungblut, P.R. Finding one’s way in proteomics: A protein species nomenclature. Chem. Cent. J. 2009, 3, 1–10. [Google Scholar] [CrossRef] [Green Version]
- Marshall, A.G.; Hendrickson, C.L. High-Resolution Mass Spectrometers. Annu. Rev. Anal. Chem. 2008, 1, 579–599. [Google Scholar] [CrossRef]
- Bogdanov, B.; Smith, R.D. Proteomics by fticr mass spectrometry: TOP down and bottom up. Mass Spectrom. Rev. 2005, 24, 168–200. [Google Scholar] [CrossRef] [PubMed] [Green Version]
- Creydt, M.; Fischer, M. Omics-Approaches for Food Authentication. Electrophoresis 2018, 39, 1569–1581. [Google Scholar] [CrossRef]
- Fiehn, O. Metabolomics—The link between genotypes and phenotypes. Plant Mol. Biol. 2002, 48, 155–171. [Google Scholar] [CrossRef] [PubMed]
- Valdes, A.M.; Glass, D.; Spector, T.D. Omics technologies and the study of human ageing. Nat. Rev. Genet. 2013, 14, 601–607. [Google Scholar] [CrossRef] [PubMed]
- Alvarez-Rivera, G.; Ballesteros-Vivas, D.; Parada-Alfonso, F.; Ibañez, E.; Cifuentes, A. Recent applications of high resolution mass spectrometry for the characterization of plant natural products. TrAC Trends Anal. Chem. 2019, 112, 87–101. [Google Scholar] [CrossRef]
- Aydoğan, C. Recent advances and applications in LC-HRMS for food and plant natural products: A critical review. Anal. Bioanal. Chem. 2020, 412, 1973–1991. [Google Scholar] [CrossRef]
- Zendong, Z.; McCarron, P.; Herrenknecht, C.; Sibat, M.; Amzil, Z.; Cole, R.B.; Hess, P. High resolution mass spectrometry for quantitative analysis and untargeted screening of algal toxins in mussels and passive samplers. J. Chromatogr. A 2015, 1416, 10–21. [Google Scholar] [CrossRef] [Green Version]
- Celma, A.; Ahrens, L.; Gago-Ferrero, P.; Hernández, F.; López, F.; Lundqvist, J.; Pitarch, E.; Sancho, J.V.; Wiberg, K.; Bijlsma, L. The relevant role of ion mobility separation in LC-HRMS based screening strategies for contaminants of emerging concern in the aquatic environment. Chemosphere 2021, 280, 130799. [Google Scholar] [CrossRef]
- Zenezini Chiozzi, R.; Capriotti, A.L.; Cavaliere, C.; La Barbera, G.; Piovesana, S.; Laganà, A. Identification of three novel angiotensin-converting enzyme inhibitory peptides derived from cauliflower by-products by multidimensional liquid chromatography and bioinformatics. J. Funct. Foods 2016, 27, 262–273. [Google Scholar] [CrossRef]
- Xian, F.; Hendrickson, C.L.; Marshall, A.G. High-Resolution Mass Spectrometry. Anal. Chem. 2012, 84, 708–719. [Google Scholar] [CrossRef]
- Tauler, R.; Parastar, H. Big (Bio)Chemical Data Mining Using Chemometric Methods: A Need for Chemists. Angew. Chemie Int. Ed. 2018, 1–62. [Google Scholar] [CrossRef]
- Bevilacqua, M.; Bro, R.; Marini, F.; Rinnan, Å.; Rasmussen, M.A.; Skov, T. Recent chemometrics advances for foodomics. TrAC Trends Anal. Chem. 2017, 96, 42–51. [Google Scholar] [CrossRef]
- Hibbert, D.B.; Minkkinen, P.; Faber, N.M.; Wise, B.M. IUPAC project: A glossary of concepts and terms in chemometrics. Anal. Chim. Acta 2009, 642, 3–5. [Google Scholar] [CrossRef]
- Hibbert, D.B. Vocabulary of concepts and terms in chemometrics (IUPAC Recommendations 2016). Pure Appl. Chem. 2016, 88, 407–443. [Google Scholar] [CrossRef]
- Kingston, H.M.; Kingston, M.L. Nomenclature in laboratory robotics and automation. J. Automat. Chem. 1994, 16, 43–57. [Google Scholar] [CrossRef] [PubMed] [Green Version]
- Murphy, K.P. Machine Learning: A Probabilistic Perspective; MIT Press: Cambridge, MA, USA, 2012; ISBN 978-0-262-30524-2. [Google Scholar]
- Fayyad, U.; Piatetsky-Shapiro, G.; Smyth, P. From Data Mining to Knowledge Discovery in Databases. AI Mag. 1996, 17, 637–648. [Google Scholar] [CrossRef]
- Goodfellow, I.; Bengio, Y.; Courville, A. Deep Learning; MIT Press: Cambridge, MA, USA, 2016; ISBN 978-0262035613. [Google Scholar]
- Géron, A. Hands-On Machine Learning with Scikit-Learn, Keras & Temsorflow, 2nd ed.; O’Reilly: Sebastopol, CA, USA, 2019; ISBN 978-1-49203264-9. [Google Scholar]
- Hawkins, D.M. The Problem of Overfitting. J. Chem. Inf. Comput. Sci. 2004, 44, 1–12. [Google Scholar] [CrossRef] [PubMed]
- Bro, R.; Smilde, A.K. Principal component analysis. Anal. Methods 2014, 6, 2812–2831. [Google Scholar] [CrossRef] [Green Version]
- Ballabio, D.; Consonni, V. Classification tools in chemistry. Part 1: Linear models. PLS-DA. Anal. Methods 2013, 5, 3790–3798. [Google Scholar] [CrossRef]
- Breimann, L. Random forests. Mach. Learn. 2001, 45, 5–32. [Google Scholar] [CrossRef] [Green Version]
- Myles, A.J.; Feudale, R.N.; Liu, Y.; Woody, N.A.; Brown, S.D. An introduction to decision tree modeling. J. Chemom. 2004, 18, 275–285. [Google Scholar] [CrossRef]
- Cunningham, P.; Delany, S.J. k-Nearest Neighbour Classifiers, 2nd Edition (with Python examples). arXiv 2020, arXiv:2004.04523. [Google Scholar]
- Jiménez-Carvelo, A.M.; González-Casado, A.; Bagur-González, M.G.; Cuadros-Rodríguez, L. Alternative data mining/machine learning methods for the analytical evaluation of food quality and authenticity—A review. Food Res. Int. 2019, 122, 25–39. [Google Scholar] [CrossRef]
- Lecun, Y.; Bengio, Y.; Hinton, G. Deep learning. Nature 2015, 521, 436–444. [Google Scholar] [CrossRef] [PubMed]
- Svozil, D.; Kvasnička, V.; Pospíchal, J. Introduction to multi-layer feed-forward neural networks. Chemom. Intell. Lab. Syst. 1997, 39, 43–62. [Google Scholar] [CrossRef]
- Schmidhuber, J. Deep Learning in neural networks: An overview. Neural Netw. 2015, 61, 85–117. [Google Scholar] [CrossRef] [Green Version]
- Pascanu, R.; Gulcehre, C.; Cho, K.; Bengio, Y. How to construct deep recurrent neural networks. In Proceedings of the 2nd International Conference on Learning Representations, ICLR 2014, Banff, AB, Canada, 14–16 April 2014; pp. 1–13. [Google Scholar]
- Hochreiter, S.; Schmidhuber, J. Long Short-Term Memory. Neural Comput. 1997, 9, 1735–1780. [Google Scholar] [CrossRef]
- Rumelhart, D.E.; Hinton, G.E.; Williams, R.J. Learning Internal Representations by Error Propagation; Defense Technical Information Center Technical Report; Defense Technical Information Center: Fort Belvoir, VA, USA, 1985; pp. 1–33. [Google Scholar]
- Chollet, F. Deep Learning with Python; Manning Publications Co.: Shelter Island, NY, USA, 2018; ISBN 978-1-61729-443-3. [Google Scholar]
- Chollet, F.; Allaire, J.J. Deep Learning with R; Manning Publications Co.: Shelter Island, NY, USA, 2018; ISBN 978-1-61729-554-6. [Google Scholar]
- Kim, P. MATLAB Deep Learning: With Machine Learning, Neural Networks and Artificial Intelligence; Apress: Berkeley, CA, USA, 2017; ISBN 978-1-4842-2845-6. [Google Scholar]
- Abadi, M.; Barham, P.; Chen, J.; Chen, Z.; Davis, A.; Dean, J.; Devin, M.; Ghemawat, S.; Irving, G.; Isard, M.; et al. TensorFlow: A System for Large-Scale Machine Learning. In Proceedings of the 12th USENIX Symposium on Operating Systems Design and Implementation (OSDI ’16), USENIX Association, Savannah, GA, USA, 2–4 November 2016; pp. 265–283. [Google Scholar]
- Paszke, A.; Gross, S.; Massa, F.; Lerer, A.; Bradbury, J.; Chanan, G.; Killeen, T.; Lin, Z.; Gimelshein, N.; Antiga, L.; et al. PyTorch: An imperative style, high-performance deep learning library. In Proceedings of the 33rd Conference on Neural Information Processing Systems (NeurIPS 2019), Vancouver, BC, Canada, 8–14 December 2019; pp. 1–12. [Google Scholar]
- Spink, J.; Moyer, D.C. Defining the Public Health Threat of Food Fraud. J. Food Sci. 2011, 76. [Google Scholar] [CrossRef]
- FDA Economically Motivated Adulteration; Public Meeting. Fed. Regist. 2009, 74, 15497–15499.
- Valdés, A.; Beltrán, A.; Mellinas, C.; Jiménez, A.; Garrigós, M.C. Analytical methods combined with multivariate analysis for authentication of animal and vegetable food products with high fat content. Trends Food Sci. Technol. 2018, 77, 120–130. [Google Scholar] [CrossRef] [Green Version]
- Pei, X.; Tandon, A.; Alldrick, A.; Giorgi, L.; Huang, W.; Yang, R. The China melamine milk scandal and its implications for food safety regulation. Food Policy 2011, 36, 412–420. [Google Scholar] [CrossRef]
- Wei, Y.; Liu, D. Review of melamine scandal: Still a long way ahead. Toxicol. Ind. Health 2011, 28, 579–582. [Google Scholar] [CrossRef] [PubMed]
- Huck, C.W.; Pezzei, C.K.; Huck-Pezzei, V.A. An industry perspective of food fraud. Curr. Opin. Food Sci. 2016, 10, 32–37. [Google Scholar] [CrossRef]
- Sharma, K.; Paradakar, M. The melamine adulteration scandal. Food Secur. 2010, 2, 97–107. [Google Scholar] [CrossRef]
- Picouet, P.A.; Gou, P.; Hyypiö, R.; Castellari, M. Implementation of NIR technology for at-line rapid detection of sunflower oil adulterated with mineral oil. J. Food Eng. 2018, 230, 18–27. [Google Scholar] [CrossRef]
- Schieber, A. Introduction to Food Authentication. In Modern Techniques for Food Authentication; Elsevier Inc.: Amsterdam, The Netherland, 2018; pp. 1–21. ISBN 9780128142646. [Google Scholar]
- Armstrong, D.J. Food Chemistry and U.S. Food Regulations. J. Agric. Food Chem. 2009, 57, 8180–8186. [Google Scholar] [CrossRef]
- Shears, P. Food fraud—A current issue but an old problem. Br. Food J. 2010, 112, 198–213. [Google Scholar] [CrossRef] [Green Version]
- Abbas, O.; Zadravec, M.; Baeten, V.; Mikuš, T.; Lešić, T.; Vulić, A.; Prpić, J.; Jemeršić, L.; Pleadin, J. Analytical methods used for the authentication of food of animal origin. Food Chem. 2018, 246, 6–17. [Google Scholar] [CrossRef]
- Morin, J.-F.; Lees, M. (Eds.) Food Integrity Handbook A Guide to Food Authenticity Issues and Analytical Solutions; Eurofins Analytics France: Nantes, France, 2018; Volume 53, ISBN 9788578110796. [Google Scholar]
- The Global Food Safety Initiative. GFSI Tackling Food Fraud through Food Safety Management Systems; The Global Food Safety Initiative: Paris, France, 2018; pp. 1–10. [Google Scholar]
- Danezis, G.P.; Tsagkaris, A.S.; Camin, F.; Brusic, V.; Georgiou, C.A. Food authentication: Techniques, trends & emerging approaches. TrAC Trends Anal. Chem. 2016, 85, 123–132. [Google Scholar] [CrossRef] [Green Version]
- Ortea, I.; O’Connor, G.; Maquet, A. Review on proteomics for food authentication. J. Proteomics 2016, 147, 212–225. [Google Scholar] [CrossRef] [PubMed]
- Du, H.; Wang, J.; Hu, Z.; Yao, X.; Zhang, X. Prediction of fungicidal activities of rice blast disease based on least-squares support vector machines and project pursuit regression. J. Agric. Food Chem. 2008, 56, 10785–10792. [Google Scholar] [CrossRef] [PubMed]
- Svetnik, V.; Liaw, A.; Tong, C.; Christopher Culberson, J.; Sheridan, R.P.; Feuston, B.P. Random Forest: A Classification and Regression Tool for Compound Classification and QSAR Modeling. J. Chem. Inf. Comput. Sci. 2003, 43, 1947–1958. [Google Scholar] [CrossRef] [PubMed]
- Tay, A.; Singh, R.K.; Krishnan, S.S.; Gore, J.P. Authentication of olive oil adulterated with vegetable oils using Fourier transform infrared spectroscopy. LWT Food Sci. Technol. 2002, 35, 99–103. [Google Scholar] [CrossRef]
- Tokalıoğlu, Ş.; Dokan, F.K.; Köprü, S. ICP-MS multi-element analysis for determining the origin by multivariate analysis of red pepper flakes from three different regions of Turkey. LWT 2019, 103, 301–307. [Google Scholar] [CrossRef]
- Farres, S.; Srata, L.; Fethi, F.; Kadaoui, A. Argan oil authentication using visible/near infrared spectroscopy combined to chemometrics tools. Vib. Spectrosc. 2019, 102, 79–84. [Google Scholar] [CrossRef]
- Borràs, E.; Mestres, M.; Aceña, L.; Busto, O.; Ferré, J.; Boqué, R.; Calvo, A. Identification of olive oil sensory defects by multivariate analysis of mid infrared spectra. Food Chem. 2015, 187, 197–203. [Google Scholar] [CrossRef]
- Barbosa, R.M.; Batista, B.L.; Barião, C.V.; Varrique, R.M.; Coelho, V.A.; Campiglia, A.D.; Barbosa, F. A simple and practical control of the authenticity of organic sugarcane samples based on the use of machine-learning algorithms and trace elements determination by inductively coupled plasma mass spectrometry. Food Chem. 2015, 184, 154–159. [Google Scholar] [CrossRef]
- Tahri, K.; Tiebe, C.; El Bari, N.; Hübert, T.; Bouchikhi, B. Geographical provenience differentiation and adulteration detection of cumin by means of electronic sensing systems and SPME-GC-MS in combination with different chemometric approaches. Anal. Methods 2016, 8, 7638–7649. [Google Scholar] [CrossRef]
- Kim, N.; Kim, K.; Choi, B.Y.; Lee, D.; Shin, Y.S.; Bang, K.H.; Cha, S.W.; Lee, J.W.; Choi, H.K.; Jang, D.S.; et al. Metabolomic approach for age discrimination of Panax ginseng using UPLC-Q-Tof MS. J. Agric. Food Chem. 2011, 59, 10435–10441. [Google Scholar] [CrossRef] [PubMed]
- Lo Feudo, G.; Naccarato, A.; Sindona, G.; Tagarelli, A. Investigating the origin of tomatoes and triple concentrated tomato pastes through multielement determination by inductively coupled plasma mass spectrometry and statistical analysis. J. Agric. Food Chem. 2010, 58, 3801–3807. [Google Scholar] [CrossRef] [PubMed]
- Gerhardt, N.; Birkenmeier, M.; Sanders, D.; Rohn, S.; Weller, P. Resolution-optimized headspace gas chromatography-ion mobility spectrometry (HS-GC-IMS) for non-targeted olive oil profiling. Anal. Bioanal. Chem. 2017, 409, 3933–3942. [Google Scholar] [CrossRef] [PubMed]
- Vega-Márquez, B.; Nepomuceno-Chamorro, I.; Jurado-Campos, N.; Rubio-Escudero, C. Deep Learning Techniques to Improve the Performance of Olive Oil Classification. Front. Chem. 2020, 7, 1–10. [Google Scholar] [CrossRef]
- Long, N.P.; Lim, D.K.; Mo, C.; Kim, G.; Kwon, S.W. Development and assessment of a lysophospholipid-based deep learning model to discriminate geographical origins of white rice. Sci. Rep. 2017, 7, 1–10. [Google Scholar] [CrossRef] [Green Version]
- Lim, D.K.; Mo, C.; Long, N.P.; Kim, G.; Kwon, S.W. Simultaneous profiling of lysoglycerophospholipids in rice (Oryza sativa L) using direct infusion-tandem mass spectrometry with multiple reaction monitoring. J. Agric. Food Chem. 2017, 65, 2628–2634. [Google Scholar] [CrossRef] [PubMed]
- Ji, H.; Xu, Y.; Lu, H.; Zhang, Z. Deep MS/MS-Aided Structural-Similarity Scoring for Unknown Metabolite Identification. Anal. Chem. 2019, 91, 5629–5637. [Google Scholar] [CrossRef] [PubMed]
- Augustin, M.A.; Riley, M.; Stockmann, R.; Bennett, L.; Kahl, A.; Lockett, T.; Osmond, M.; Sanguansri, P.; Stonehouse, W.; Zajac, I.; et al. Role of food processing in food and nutrition security. Trends Food Sci. Technol. 2016, 56, 115–125. [Google Scholar] [CrossRef]
- Jedermann, R.; Nicometo, M.; Uysal, I.; Lang, W. Reducing food losses by intelligent food logistics. Philos. Trans. R. Soc. A Math. Phys. Eng. Sci. 2014, 372. [Google Scholar] [CrossRef]
- DeFries, R.; Fanzo, J.; Remans, R.; Palm, C.; Wood, S.; Aderman, T.L. Global nutrition. Metrics for land-scarce agriculture. Science 2015, 349, 238–240. [Google Scholar] [CrossRef]
- Corradini, M.G. Shelf Life of Food Products: From Open Labeling to Real-Time Measurements. Annu. Rev. Food Sci. Technol. 2018, 9, 251–269. [Google Scholar] [CrossRef]
- Eriksson, M.; Strid, I.; Hansson, P.A. Food waste reduction in supermarkets—Net costs and benefits of reduced storage temperature. Resour. Conserv. Recycl. 2016, 107, 73–81. [Google Scholar] [CrossRef]
- Spada, A.; Conte, A.; Del Nobile, M.A. The influence of shelf life on food waste: A model-based approach by empirical market evidence. J. Clean. Prod. 2017, 172, 3410–3414. [Google Scholar] [CrossRef]
- Kilcast, D.; Subramaniam, P. (Eds.) The Stability and Shelf Life of Food; Woodhead Publishing Limited: Cambridge, UK, 2016; ISBN 9780081004357. [Google Scholar]
- Nicoli, M.C. Shelf Life Assessment of Food; Barbosa-Cánovas, G.V., Ed.; Taylor & Francis Group: Boca Raton, FL, USA, 2012; ISBN 9781439846032. [Google Scholar]
- Calligaris, S.; Manzocco, L.; Anese, M.; Nicoli, M.C. Shelf-life Assessment of Food Undergoing Oxidation–A Review. Crit. Rev. Food Sci. Nutr. 2016, 56, 1903–1912. [Google Scholar] [CrossRef]
- European Commission (EC). Die Lebensmittelinformationsverordnung Nr. 1169/2011 des Europäischen Parlaments und des Rates vom 25. Oktober 2011; European Commission (EC): Brussels, Belgium, 2011. [Google Scholar]
- Jena, S.; Das, H. Shelf life prediction of aluminum foil laminated polyethylene packed vacuum dried coconut milk powder. J. Food Eng. 2012, 108, 135–142. [Google Scholar] [CrossRef]
- Vallejo-Cordoba, B.; Nakai, S. Keeping-Quality Assessment of Pasteurized Milk by Multivariate Analysis of Dynamic Headspace Gas Chromatographic Data. 1. Shelf-Life Prediction by Principal Component Regression. J. Agric. Food Chem. 1994, 42, 989–993. [Google Scholar] [CrossRef]
- Beckmann, S.; Scheller, S. Bestimmung des Mindesthaltbarkeitsdatums. Ernährung Aktuell 2011, 22, 3. [Google Scholar]
- Dalgaard, P. Modelling of microbial activity and prediction of shelf life for packed fresh fish. Int. J. Food Microbiol. 1995, 26, 305–317. [Google Scholar] [CrossRef]
- Martin, N.H.; Ranieri, M.L.; Murphy, S.C.; Ralyea, R.D.; Wiedmann, M.; Boor, K.J. Results from raw milk microbiological tests do not predict the shelf-life performance of commercially pasteurized fluid milk. J. Dairy Sci. 2011, 94, 1211–1222. [Google Scholar] [CrossRef] [PubMed]
- Condurso, C.; Cincotta, F.; Tripodi, G.; Merlino, M.; Giarratana, F.; Verzera, A. A new approach for the shelf-life definition of minimally processed carrots. Postharvest Biol. Technol. 2020, 163, 111138. [Google Scholar] [CrossRef]
- Bishop, J.R.; White, C.H. Assessment of Dairy Product Quality and Potential Shelf-Life—A Review. J. Food Prot. 1986, 49, 739–753. [Google Scholar] [CrossRef]
- Frank, D.; Hughes, J.; Piyasiri, U.; Zhang, Y.; Kaur, M.; Li, Y.; Mellor, G.; Stark, J. Volatile and non-volatile metabolite changes in 140-day stored vacuum packaged chilled beef and potential shelf life markers. Meat Sci. 2020, 161, 108016. [Google Scholar] [CrossRef]
- Frank, D.; Zhang, Y.; Li, Y.; Luo, X.; Chen, X.; Kaur, M.; Mellor, G.; Stark, J.; Hughes, J. Shelf life extension of vacuum packaged chilled beef in the Chinese supply chain. A feasibility study. Meat Sci. 2019, 153, 135–143. [Google Scholar] [CrossRef]
- Rocchetti, G.; Barba, F.J.; Lorenzo, J.M.; Munekata, P.E.S.; Bernardo, L.; Tomasevic, I.; Pateiro, M.; Lucini, L. Untargeted metabolomics to explore the oxidation processes during shelf life of pork patties treated with guarana seed extracts. Int. J. Food Sci. Technol. 2020, 55, 1002–1009. [Google Scholar] [CrossRef]
- Marsili, R.T. Shelf-life prediction of processed milk by solid-phase microextraction, mass spectrometry, and multivariate analysis. J. Agric. Food Chem. 2000, 48, 3470–3475. [Google Scholar] [CrossRef] [PubMed]
- Gómez, A.H.; Wang, J.; Hu, G.; Pereira, A.G. Monitoring storage shelf life of tomato using electronic nose technique. J. Food Eng. 2008, 85, 625–631. [Google Scholar] [CrossRef]
- Gaggiotti, S.; Della Pelle, F.; Masciulli, V.; Di Natale, C.; Compagnone, D. Monitoring Shelf Life of Carrots with a Peptides Based Electronic Nose. In Sensors, The Proceedings of the Fourth National Conference on Sensors, Catania, Italy, 21–23 February 2018; Andò, B., Baldini, F., di Natale, C., Ferrari, V., Marletta, V., Marrazza, G., Militello, V., Miolo, G., Rossi, M., Scalise, L., et al., Eds.; Springer International Publishing: Catania, Italy, 2019; ISBN 9783030043247. [Google Scholar]
- Kharbach, M.; Marmouzi, I.; Kamal, R.; Yu, H.; Barra, I.; Cherrah, Y.; Alaoui, K.; Heyden, Y.V.; Bouklouze, A. Extra virgin Argan oils’ shelf-life monitoring and prediction based on chemical properties or FTIR fingerprints and chemometrics. Food Control 2021, 121, 107607. [Google Scholar] [CrossRef]
- Bulik-Sullivan, B.; Busby, J.; Palmer, C.D.; Davis, M.J.; Murphy, T.; Clark, A.; Busby, M.; Duke, F.; Yang, A.; Young, L.; et al. Deep learning using tumor HLA peptide mass spectrometry datasets improves neoantigen identification. Nat. Biotechnol. 2019, 37, 55–71. [Google Scholar] [CrossRef]
- Alakwaa, F.M.; Chaudhary, K.; Garmire, L.X. Deep Learning Accurately Predicts Estrogen Receptor Status in Breast Cancer Metabolomics Data. J. Proteome Res. 2018, 17, 337–347. [Google Scholar] [CrossRef]
- Dutta, J.; Deshpande, P.; Rai, B. AI-based soft-sensor for shelf life prediction of ‘Kesar’ mango. SN Appl. Sci. 2021, 3, 1–9. [Google Scholar] [CrossRef]
- Fathizadeh, Z.; Aboonajmi, M.; Hassan-Beygi, S.R. Classification of Apples Based on the Shelf Life Using ANN and Data Fusion. Food Anal. Methods 2021, 14, 706–718. [Google Scholar] [CrossRef]
- Dalabasmaz, S.; Dittrich, D.; Kellner, I.; Drewello, T.; Pischetsrieder, M. Identification of peptides reflecting the storage of UHT milk by MALDI-TOF-MS peptide profiling. J. Proteomics 2019, 207, 103444. [Google Scholar] [CrossRef] [PubMed]
- Verhegghe, M.; De Block, J.; Heyndrickx, M.; Van Coillie, E.; Van Poucke, C.; Duquenne, B. Application of LC-HRMS identified marker peptides in an LC-MS/MS method for detection and quantification of heat-resistant proteolytic activity in raw milk. Int. J. Dairy Technol. 2020, 74, 286–296. [Google Scholar] [CrossRef]
- Chen, L.p.; Zhang, H.W.; Zhang, X.M.; Yu, F.; Zhang, F.; Xue, C.H.; Xue, Y.; Tang, Q.J.; Li, Z. Identification of potential peptide markers for the shelf-life of Pacific oysters (Crassostrea gigas) during anhydrous preservation via mass spectrometry-based peptidomics. Lwt 2020, 134, 109922. [Google Scholar] [CrossRef]
- Carrera, M.; Cañas, B.; Gallardo, J.M. Fish Authentication. In Proteomics in Foods; Springer: Boston, MA, USA, 2012; pp. 205–222. ISBN 978-1-4614-5626-1. [Google Scholar]
- Leni, G.; Prandi, B.; Varani, M.; Faccini, A.; Caligiani, A.; Sforza, S. Peptide fingerprinting of Hermetia illucens and Alphitobius diaperinus: Identification of insect species-specific marker peptides for authentication in food and feed. Food Chem. 2020, 320, 126681. [Google Scholar] [CrossRef]
- Kęska, P.; Rohn, S.; Halagarda, M.; Wójciak, K.M. Peptides from different carcass elements of organic and conventional pork—Potential source of antioxidant activity. Antioxidants 2020, 9, 835. [Google Scholar] [CrossRef]
- Perkins, D.N.; Pappin, D.J.C.; Creasy, D.M.; Cottrell, J.S. Probability-based protein identification by searching sequence databases using mass spectrometry data. Electrophoresis 1999, 20, 3551–3567. [Google Scholar] [CrossRef]
- Zhang, J.; Xin, L.; Shan, B.; Chen, W.; Xie, M.; Yuen, D.; Zhang, W.; Zhang, Z.; Lajoie, G.A.; Ma, B. PEAKS DB: De novo sequencing assisted database search for sensitive and accurate peptide identification. Mol. Cell. Proteomics 2012, 11, 1–8. [Google Scholar] [CrossRef] [PubMed] [Green Version]
- Eng, J.K.; McCormack, A.L.; Yates, J.R. An Approach to Correlate Tandem Mass Spectral Data of Peptides with Amino Acid Sequences in a Protein Database Jimmy. J. Am. Soc. Mass Spectrom. 1994, 5, 976–989. [Google Scholar] [CrossRef] [Green Version]
- Cox, J.; Mann, M. MaxQuant enables high peptide identification rates, individualized p.p.b.-range mass accuracies and proteome-wide protein quantification. Nat. Biotechnol. 2008, 26, 1367–1372. [Google Scholar] [CrossRef] [PubMed]
- Steen, H.; Mann, M. The ABC’s (and XYZ’s) of peptide sequencing. Nat. Rev. Mol. Cell Biol. 2004, 5, 699–711. [Google Scholar] [CrossRef] [PubMed]
- Johnson, R.S.; Martin, S.A.; Biemann, K.; Stults, J.T.; Watson, J.T. Novel Fragmentation Process of Peptides by Collision-Induced Decomposition in a Tandem Mass Spectrometer: Differentiation of Leucine and Isoleucine. Anal. Chem. 1987, 59, 2621–2625. [Google Scholar] [CrossRef] [PubMed]
- Xiao, Y.; Vecchi, M.M.; Wen, D. Distinguishing between Leucine and Isoleucine by Integrated LC-MS Analysis Using an Orbitrap Fusion Mass Spectrometer. Anal. Chem. 2016, 88, 10757–10766. [Google Scholar] [CrossRef]
- Armirotti, A.; Millo, E.; Damonte, G. How to Discriminate Between Leucine and Isoleucine by Low Energy ESI-TRAP MSn. J. Am. Soc. Mass Spectrom. 2007, 18, 57–63. [Google Scholar] [CrossRef] [Green Version]
- Muth, T.; Renard, B.Y. Evaluating de novo sequencing in proteomics: Already an accurate alternative to database-driven peptide identification? Brief. Bioinform. 2018, 19, 954–970. [Google Scholar] [CrossRef]
- Ma, B. Novor: Real-Time Peptide de Novo Sequencing Software. J. Am. Soc. Mass Spectrom. 2015, 26, 1885–1894. [Google Scholar] [CrossRef] [PubMed] [Green Version]
- Frank, A.; Pevzner, P. PepNovo: De novo peptide sequencing via probabilistic network modeling. Anal. Chem. 2005, 77, 964–973. [Google Scholar] [CrossRef] [PubMed]
- Ma, B.; Zhang, K.; Hendrie, C.; Liang, C.; Li, M.; Doherty-Kirby, A.; Lajoie, G. PEAKS: Powerful software for peptide de novo sequencing by tandem mass spectrometry. Rapid Commun. Mass Spectrom. 2003, 17, 2337–2342. [Google Scholar] [CrossRef]
- Tran, N.H.; Zhang, X.; Xin, L.; Shan, B.; Li, M. De novo peptide sequencing by deep learning. Proc. Natl. Acad. Sci. USA 2017, 114, 8247–8252. [Google Scholar] [CrossRef] [Green Version]
- Tran, N.H.; Qiao, R.; Xin, L.; Chen, X.; Liu, C.; Zhang, X.; Shan, B.; Ghodsi, A.; Li, M. Deep learning enables de novo peptide sequencing from data-independent-acquisition mass spectrometry. Nat. Methods 2019, 16, 63–66. [Google Scholar] [CrossRef]
- Yang, H.; Chi, H.; Zeng, W.F.; Zhou, W.J.; He, S.M. PNovo 3: Precise de novo peptide sequencing using a learning-to-rank framework. In Proceedings of the Bioinformatics; Oxford University Press: Oxford, UK, 2019; Volume 35, pp. i183–i190. [Google Scholar]
- Chi, H.; Chen, H.; He, K.; Wu, L.; Yang, B.; Sun, R.X.; Liu, J.; Zeng, W.F.; Song, C.Q.; He, S.M.; et al. PNovo+: De novo peptide sequencing using complementary HCD and ETD tandem mass spectra. J. Proteome Res. 2013, 12, 615–625. [Google Scholar] [CrossRef] [PubMed]
- Zhou, X.X.; Zeng, W.F.; Chi, H.; Luo, C.; Liu, C.; Zhan, J.; He, S.M.; Zhang, Z. PDeep: Predicting MS/MS Spectra of Peptides with Deep Learning. Anal. Chem. 2017, 89, 12690–12697. [Google Scholar] [CrossRef]
- Sentandreu, M.A.; Sentandreu, E. Peptide biomarkers as a way to determine meat authenticity. Meat Sci. 2011, 89, 280–285. [Google Scholar] [CrossRef]
- Sentandreu, M.A.; Fraser, P.D.; Halket, J.; Patel, R.; Bramley, P.M. A proteomic-based approach for detection of chicken in meat mixes. J. Proteome Res. 2010, 9, 3374–3383. [Google Scholar] [CrossRef]
- Leitner, A.; Castro-Rubio, F.; Marina, M.L.; Lindner, W. Identification of marker proteins for the adulteration of meat products with soybean proteins by multidimensional liquid chromatography-tandem mass spectrometry. J. Proteome Res. 2006, 5, 2424–2430. [Google Scholar] [CrossRef]
- Chassaigne, H.; Nørgaard, J.V.; Van Hengel, A.J. Proteomics-based approach to detect and identify major allergens in processed peanuts by capillary LC-Q-TOF (MS/MS). J. Agric. Food Chem. 2007, 55, 4461–4473. [Google Scholar] [CrossRef] [PubMed]
- Carrera, M.; Cañas, B.; Piñeiro, C.; Vázquez, J.; Gallardo, J.M. De novo mass spectrometry sequencing and characterization of species-specific peptides from nucleoside diphosphate kinase B for the classification of commercial fish species belonging to the family merlucciidae. J. Proteome Res. 2007, 6, 3070–3080. [Google Scholar] [CrossRef] [PubMed]
- Gallardo, J.M.; Ortea, I.; Carrera, M. Proteomics and its applications for food authentication and food-technology research. TrAC Trends Anal. Chem. 2013, 52, 135–141. [Google Scholar] [CrossRef]
- Ma, C.; Ren, Y.; Yang, J.; Ren, Z.; Yang, H.; Liu, S. Improved Peptide Retention Time Prediction in Liquid Chromatography through Deep Learning. Anal. Chem. 2018, 90, 10881–10888. [Google Scholar] [CrossRef]
- Zeng, W.F.; Zhou, X.X.; Zhou, W.J.; Chi, H.; Zhan, J.; He, S.M. MS/MS Spectrum prediction for modified peptides using pDeep2 Trained by Transfer Learning. Anal. Chem. 2019, 91, 9724–9731. [Google Scholar] [CrossRef]
- Tiwary, S.; Levy, R.; Gutenbrunner, P.; Salinas Soto, F.; Palaniappan, K.K.; Deming, L.; Berndl, M.; Brant, A.; Cimermancic, P.; Cox, J. High-quality MS/MS spectrum prediction for data-dependent and data-independent acquisition data analysis. Nat. Methods 2019, 16, 519–525. [Google Scholar] [CrossRef] [PubMed]
- Wen, B.; Zeng, W.F.; Liao, Y.; Shi, Z.; Savage, S.R.; Jiang, W.; Zhang, B. Deep Learning in Proteomics. Proteomics 2020, 20, 1900335. [Google Scholar] [CrossRef] [PubMed]
- Henderson, P.; Islam, R.; Bachman, P.; Pineau, J.; Precup, D.; Meger, D. Deep reinforcement learning that matters. In Proceedings of the 32nd AAAI Conference on Artificial Intelligence, AAAI 2018, New Orleans, LA, USA, 2–7 February 2018; pp. 3207–3214. [Google Scholar]

Publisher’s Note: MDPI stays neutral with regard to jurisdictional claims in published maps and institutional affiliations. |
© 2021 by the authors. Licensee MDPI, Basel, Switzerland. This article is an open access article distributed under the terms and conditions of the Creative Commons Attribution (CC BY) license (https://creativecommons.org/licenses/by/4.0/).
Share and Cite
Class, L.-C.; Kuhnen, G.; Rohn, S.; Kuballa, J. Diving Deep into the Data: A Review of Deep Learning Approaches and Potential Applications in Foodomics. Foods 2021, 10, 1803. https://doi.org/10.3390/foods10081803
Class L-C, Kuhnen G, Rohn S, Kuballa J. Diving Deep into the Data: A Review of Deep Learning Approaches and Potential Applications in Foodomics. Foods. 2021; 10(8):1803. https://doi.org/10.3390/foods10081803
Chicago/Turabian StyleClass, Lisa-Carina, Gesine Kuhnen, Sascha Rohn, and Jürgen Kuballa. 2021. "Diving Deep into the Data: A Review of Deep Learning Approaches and Potential Applications in Foodomics" Foods 10, no. 8: 1803. https://doi.org/10.3390/foods10081803
APA StyleClass, L.-C., Kuhnen, G., Rohn, S., & Kuballa, J. (2021). Diving Deep into the Data: A Review of Deep Learning Approaches and Potential Applications in Foodomics. Foods, 10(8), 1803. https://doi.org/10.3390/foods10081803