Article

Chemical Elements and the Quality of Mānuka (Leptospermum scoparium) Honey

1
School of Physical and Chemical Sciences, University of Canterbury, Christchurch 8041, New Zealand
2
Institute of Environmental Science and Research Ltd. (ESR), Christchurch 8041, New Zealand
3
Lowe Environmental Impact Ltd., Palmerston North 4410, New Zealand
4
Department of Ecology, Lincoln University, Lincoln 7647, New Zealand
5
Ministry for Primary Industries, Wellington 6140, New Zealand
*
Author to whom correspondence should be addressed.
Foods 2021, 10(7), 1670; https://doi.org/10.3390/foods10071670
Submission received: 16 June 2021 / Revised: 6 July 2021 / Accepted: 13 July 2021 / Published: 20 July 2021
(This article belongs to the Section Food Nutrition)

Abstract

:
Soil properties in the foraging range of honeybees influence honey composition. We aimed to determine relationships between the antimicrobial properties of New Zealand mānuka (Leptospermum scoparium) honey and elemental concentrations in the honey, plants, and soils. We analyzed soils, plants, and fresh mānuka honey samples from the Wairarapa region of New Zealand for the chemical elements and the antimicrobial activity of the honey as indicated by methylglyoxal (MGO) and dihydroxyacetone (DHA). There were significant negative correlations between honey MGO and the concentrations of Mn, Cu, Mg, S, Na, Ba, K, Zn, and Al. These elements may provide a low-cost means of assessing mānuka honey quality. For individual elements, except for K, there were no correlations between the honeys, plants, and soils. Soil nitrate concentrations were negatively correlated with concentrations of MGO and DHA in the honey, which implies that soil fertility may be a determiner of mānuka honey quality.

Graphical Abstract

1. Introduction

Leptospermum scoparium J.R. et G. Forst. is the most widespread indigenous shrub species in New Zealand and is commonly known as mānuka or tea tree [1]. It is a member of the Myrtaceae family and one of 13 species in the Leptospermum myrtifolium subgroup [2]. Economically, L. scoparium is important due to production of its essential oil and mānuka honey. Most of the 8065 tons of honey exported from New Zealand in 2019, which created a revenue of NZD 355 M (approximately USD 250 M), was mono- or multi-floral mānuka honey [3].
Honey is naturally antiseptic because it is osmotically unfavorable to microbial growth and has a low pH [4]. Whilst honeys typically contain the antimicrobial compound hydrogen peroxide (H2O2), mānuka honey is unusual due to its non-peroxide antimicrobial activity (NPA) [5]. The dominant component responsible for NPA in mānuka honey is methylglyoxal (MGO) [6]. Other compounds, including leptosin and various phenolics, synergistically modulate mānuka honey NPA [7]. MGO is formed in the honey due to non-enzymatic dehydration of dihydroxyacetone (DHA) from L. scoparium nectar [8,9]. Therefore, the concentration of MGO increases simultaneously with a decrease in DHA during maturation and storage of mānuka honey in warm temperatures [10]. Mānuka honey can inhibit a range of pathogenic bacteria genera, including Enterococcus, Pseudomonas, Staphylococcus, and Streptococcus, among others [7]. Antimicrobial action may occur due to the disruption of regular cell division, impairment of cellular integrity, and reduction in cellular motility [11]. Its distinct antimicrobial characteristics mean that the market value of mānuka honey is primarily determined by its NPA, which is often commercially expressed as Unique Mānuka Factor (UMF™), though other marketing terms exist [6]. DHA concentration in L. scoparium nectar is affected by a plethora of genetic and environmental factors [12]. Although these have yet to be quantified, they may include the concentrations of the chemical elements in the nectar.
Soil is the ultimate source of many elements in the floral nectar [13,14]. The concentration of elements in honey is affected by soil characteristics, and honey composition can be used for geographical discrimination or as a soil element indicator [13,15,16,17]. The response of L. scoparium to soil properties is cultivar-dependent [18]. However, Williams et al. [19] found that soil properties do not affect the concentration of DHA in L. scoparium nectar. This is consistent with other studies which show that genetic factors and provenances are more relevant for L. scoparium nectar DHA [20,21]. Noe et al. [22], however, reported that L. scoparium nectar DHA varies more among plants than among sites. It is unclear how the environment affects the composition of L. scoparium nectar and, subsequently, mānuka honey.
There are no reports of the effect of soil and plant elemental concentrations on the elemental composition and NPA of mānuka honey. L. scoparium is typically found growing on low fertility soils [23], and increased soil fertility accelerates growth of the plant [24]. Nickless et al. [18] showed that increased soil nutrient concentration also improved floral density of L. scoparium. The link appears to be missing between soil parameters and mānuka honey MGO. Although DHA contents of L. scoparium plants within 1000 m from the apiary correlate well with MGO in honey [25], actual honey MGO contents are typically lower than nectar-DHA-based estimates [26]. Mānuka honey is rarely collected from 100% L. scoparium nectar, so it is vital for beekeepers to increase the availability of DHA-containing nectar to honeybees in order to achieve high MGO mānuka honeys [26]. Higher concentrations of soil nutrients within the foraging range of honeybees might therefore result in increased availability of L. scoparium nectar by increasing the floral density.
We aimed to determine the effect, if any, of the elemental composition of soils, plants, and honey on the quality of mānuka honey as indicated by MGO and DHA. Additionally, we sought to compare the chemical composition of mānuka honey from different sites in the Wairarapa region of New Zealand.

2. Materials and Methods

2.1. Sample Collection

Soil, plant foliage, and honey samples were collected from five sites in the Wairarapa region in the lower North Island of New Zealand (Figure 1). Soil and foliage samples were collected in April 2014. Five L. scoparium plants were sampled per hive location. Plants were between 1.5 and 3 m tall. Foliage was sampled at 2 m above ground where possible. A representative sample was taken by combining 10 individual twigs per tree. A soil sample was taken at the base of each sampled plant, within 0.5 m from the base. All sampling sites were within 1 km from the hive. This is within the foraging range of the honeybee Apis mellifera [27]. Soil and plant samples were immediately sent to the laboratory for further processing. Soils were kept cold in insulated containers with ice packs. Raw honey samples were extracted by Watson & Son Ltd. (Masterton, New Zealand, now Oha Honey LP) in January–February 2014. Honey samples from locations B, C, and D are composite samples, as multiple hives were within 1 km from each other at these sites.

2.2. Honey Analysis

Honey samples (0.5 g) were digested in 8 mL ARISTAR® 69% HNO3 with a microwave (MARS Xpress, CEM Corporation, Matthews, NC, USA). Total concentrations of Al, As, B, Ba, Ca, Cd, Cr, Cu, Fe, K, Mg, Mn, Na, P, Pb, S, and Zn were determined by ICP-OES (Varian 720-ES, Agilent Technologies, Santa Clara, CA, USA). Concentrations of honey DHA and MGO were simultaneously determined by HPLC at Watson & Son Ltd. (Masterton, New Zealand, now Oha Honey LP) following the method described by Windsor et al. [28]. The HPLC system consisted of a Dionex ACC-3000 autosampler, a Dionex LPG-3400SD quaternary pump, and a Dionex VWD-3100 detector (λ = 263 nm) (Thermo Fisher Scientific, Waltham, MA, USA). A Phenomenex Synergi Fusion 75 mm × 4.6 mm, 4 µm, 80Å reversed-phase column was used with a Phenomenex Synergi 4 mm × 3 mm guard column (Phenomenex, Torrance, CA, USA).

2.3. Soil and Plant Analysis

NH4+ and NO3 were extracted from fresh soil with 2 M KCl and analyzed by a flow injection analyzer (FIAstar 5000, FOSS, Hillerød, Denmark) [29]. Soils were dried at room temperature until a constant weight was achieved and then were sieved to 2 mm. Soil pH was determined in a 1:2.5 water extract [30]. In all, 0.5 g of soil was digested by microwave (CEM MARS Xpress) in 5 mL ARISTAR® 69% HNO3 and 1 mL ARISTAR® 30% H2O2. Pseudo-total Al, As, B, Ca, Cd, Cr, Cu, Fe, K, Li, Mg, Mn, Na, Ni, P, Pb, S, Sr, and Zn concentrations in the digest were analyzed by ICP-OES (Varian 720-ES). The exchangeable element fraction was determined in a 0.05 M Ca(NO3)2 extract using ICP-OES (Varian 720-ES) [31]. Total C and N were determined using an Elementar Vario Max CN elemental analyzer (Elementar, Langenselbold, Germany).
Foliage samples were rinsed with deionized water and dried at 65 °C until a constant weight was achieved. Leaves were separated from the twigs and ground using a Retch ZM200 mill. In all, 0.5 g of ground foliage was digested in 8 mL ARISTAR® 69% HNO3 by microwave (CEM MARS Xpress). Total Al, As, B, Ca, Cd, Co, Cr, Cu, Fe, K, Li, Mg, Mn, Na, Ni, P, Pb, S, Sr, and Zn concentrations in the digest were determined by ICP-OES (Varian 720-ES) [31]. Total C and N concentrations were determined using an Elementar Vario Max CN elemental analyzer.

2.4. Quality Control

Wageningen Evaluating Programmes for Analytical Laboratories (WEPAL) certified reference materials ISE 921 and IPE 100 were used for quality assurance in soil and plant digestions. Recoveries ranged from 91% to 108% of certified values. Analytical blanks were included in all analyses.

2.5. Statistical Analysis

Data were analyzed using R version 4.0.5. [32]. One-way analysis of variance (ANOVA) followed by Tukey’s honestly significant difference (HSD) test was used to assess site differences using the package multcomp. Data were log-transformed where the assumption of normality was not met. The significance level for all statistical analyses was p ≤ 0.05. A principal component analysis (PCA) was carried out for honey variables using the package factoextra. The packages ggplot2 and ggpubr were used to visualize results of correlation analysis. No statistical analyses were performed on honey Cd, As, and Pb concentrations as these were below detection limits (<0.001 mg kg−1).

3. Results and Discussion

3.1. Soil and Plants

The soils were typically yellow-brown loams [33]. Soil pH at all sites was moderately to strongly acidic (Table S1) and lower than typical soil pH under New Zealand pasture, which ranges from 4.8 to 6.9 [31]. L. scoparium is commonly found growing on acidic soils [34]. At low soil pH, some trace element cations, including Al, Cu, Fe, Mn, and Zn, are more soluble and more plant-available [35]. We found soil pH was negatively correlated with some extractable elements (Table S2), which included Al (r = −0.71, p ≤ 0.001), Cd (r = −0.49, p ≤ 0.005), Cr (r = −0.51, p ≤ 0.001), and Zn (r = −0.45, p ≤ 0.005). Soils were generally low in P (452–878 mg kg−1) when compared with New Zealand pasture soil, but had similar concentrations of N and C [31].
Plant samples were particularly high in Mn and Ni (Table S3) when compared with average plant shoots [36]. In contrast, the concentration of some of the P, K, and Mg was lower than average for plant dry matter concentrations [36]. Most plant parameters did not differ significantly between sites (C, N, C/N, As, B, Ca, Cd, Cu, Ni, and Zn). Site C differed from all other sites as it had significantly higher K and significantly lower Mn foliage concentrations.
Plant Mn in this study ranged from 53 to 1309 mg kg−1 with a median of 194 mg kg−1. This is comparable to studies by Gutierrez-Gines et al. [37] and Reis et al. [38], who reported 185–292 and 186–331 mg Mn kg−1 in non-fertilized L. scoparium, respectively. Both of these studies measured increased leaf Mn concentrations following the application of biosolids, which potentially reach phytotoxic levels at >400 mg Mn kg−1 [39]. In the present study, sites A and E exceeded this threshold with an average Mn concentration of 874 and 448 mg kg−1, respectively.
For the major nutrients N and P, higher soil concentrations that increase plant growth may result in a dilution of other elements in plant tissues [40]. However, we found significant positive correlations between extractable soil P and plant P (r = 0.42, p ≤ 0.005), extractable soil Mg and plant Mg (r = 0.40, p ≤ 0.01), and extractable soil Mn and plant Mn (r = 0.34, p ≤ 0.05).

3.2. Honey

Table 1 reports honey MGO, DHA, and elemental concentrations. The DHA concentrations in this study were similar to those reported in fresh mānuka honey by Atrott et al. [10] and Adams et al. [8]. MGO concentrations were in the low range, lower than those in fresh mānuka honeys (309–658 mg kg−1) reported by Stephens et al. [41]. There was a strong positive correlation (r = 0.99, p ≤ 0.001) between DHA and MGO, with MGO concentrations being on average 7% of DHA concentrations. Therefore, we henceforth report MGO as an indicator of mānuka honey quality.
The elemental concentrations in the honey were comparable to analyses of other fresh mānuka honey in New Zealand [42]. However, Na and Al were four and seven times higher, respectively, than concentrations reported by Vanhanen et al. [42]. The elemental concentrations in our fresh honey samples were lower than those in commercially available New Zealand mānuka honeys reported by international studies [43,44,45,46]. The concentration of chemical elements in honey may increase following moisture reduction during honey processing [47].
The most abundant element in the tested honeys was K, followed by Ca and P. These were the overall most abundant elements in mono-floral New Zealand honeys analyzed by Vanhanen et al. [42]. They were also the most prominent elements in various international honey types [48]. Mānuka honey in this study had higher concentrations of elements, particularly Na, Ca, Mg, P, and Mn, compared to other honey types [49]. In the case of Mn, mānuka honey was shown to have higher concentrations than other New Zealand mono-floral honeys, with the exception of rewarewa honey [42].
An increased elemental concentration as such can be beneficial for human nutrition [50], although, given the average daily consumption of honey (0.1–0.8 kg per annum), human health benefits from the elements contained in honey are negligible [49,51]. Heavy metals such as, Cd, and Pb were below the detection limit (<0.001 mg kg−1) in this study and therefore not of significance to human health.
A PCA was used to investigate similarities between mānuka honey quality parameters and elemental composition between sites (Figure 2). The honeys can be separated into three distinct groups at sites A, B, and C, with honey DHA and MGO having a positive weighting in PC1 (explaining 53.9% of variance) and other elements, dominated by Mg, Mn, Cu, Ba, Na, Zn, and K, having negative weightings. PC2 (explaining 16.5% of variance) separated the sites mainly based on Cr, Fe, Ca, and Ba concentrations.
MGO concentrations were 89–245% higher in site A compared to sites B, C, D, and E. The spatial variation of honey MGO concentrations aligns with inter- and intra-regional variation in L. scoparium nectar DHA previously observed by Williams et al. [19]. This is likely a result of genetic and environmental effects on nectar composition and yields [18,22]. Similarly, site A differed from other sites regarding the elemental composition of the honey. This is particularly true for Mn, which at site A was only 26–47% of the concentrations at sites B, C, D, and E. Furthermore, honey from site A had significantly lower Cu, K, Mg, Na, and S concentrations than sites B and C. Our findings are consistent with those of Grainger et al. [52], who showed that concentrations of Ca, K, Mg, Mn, and Na in honeys could be used to differentiate between the regions in New Zealand where the honeys were produced.
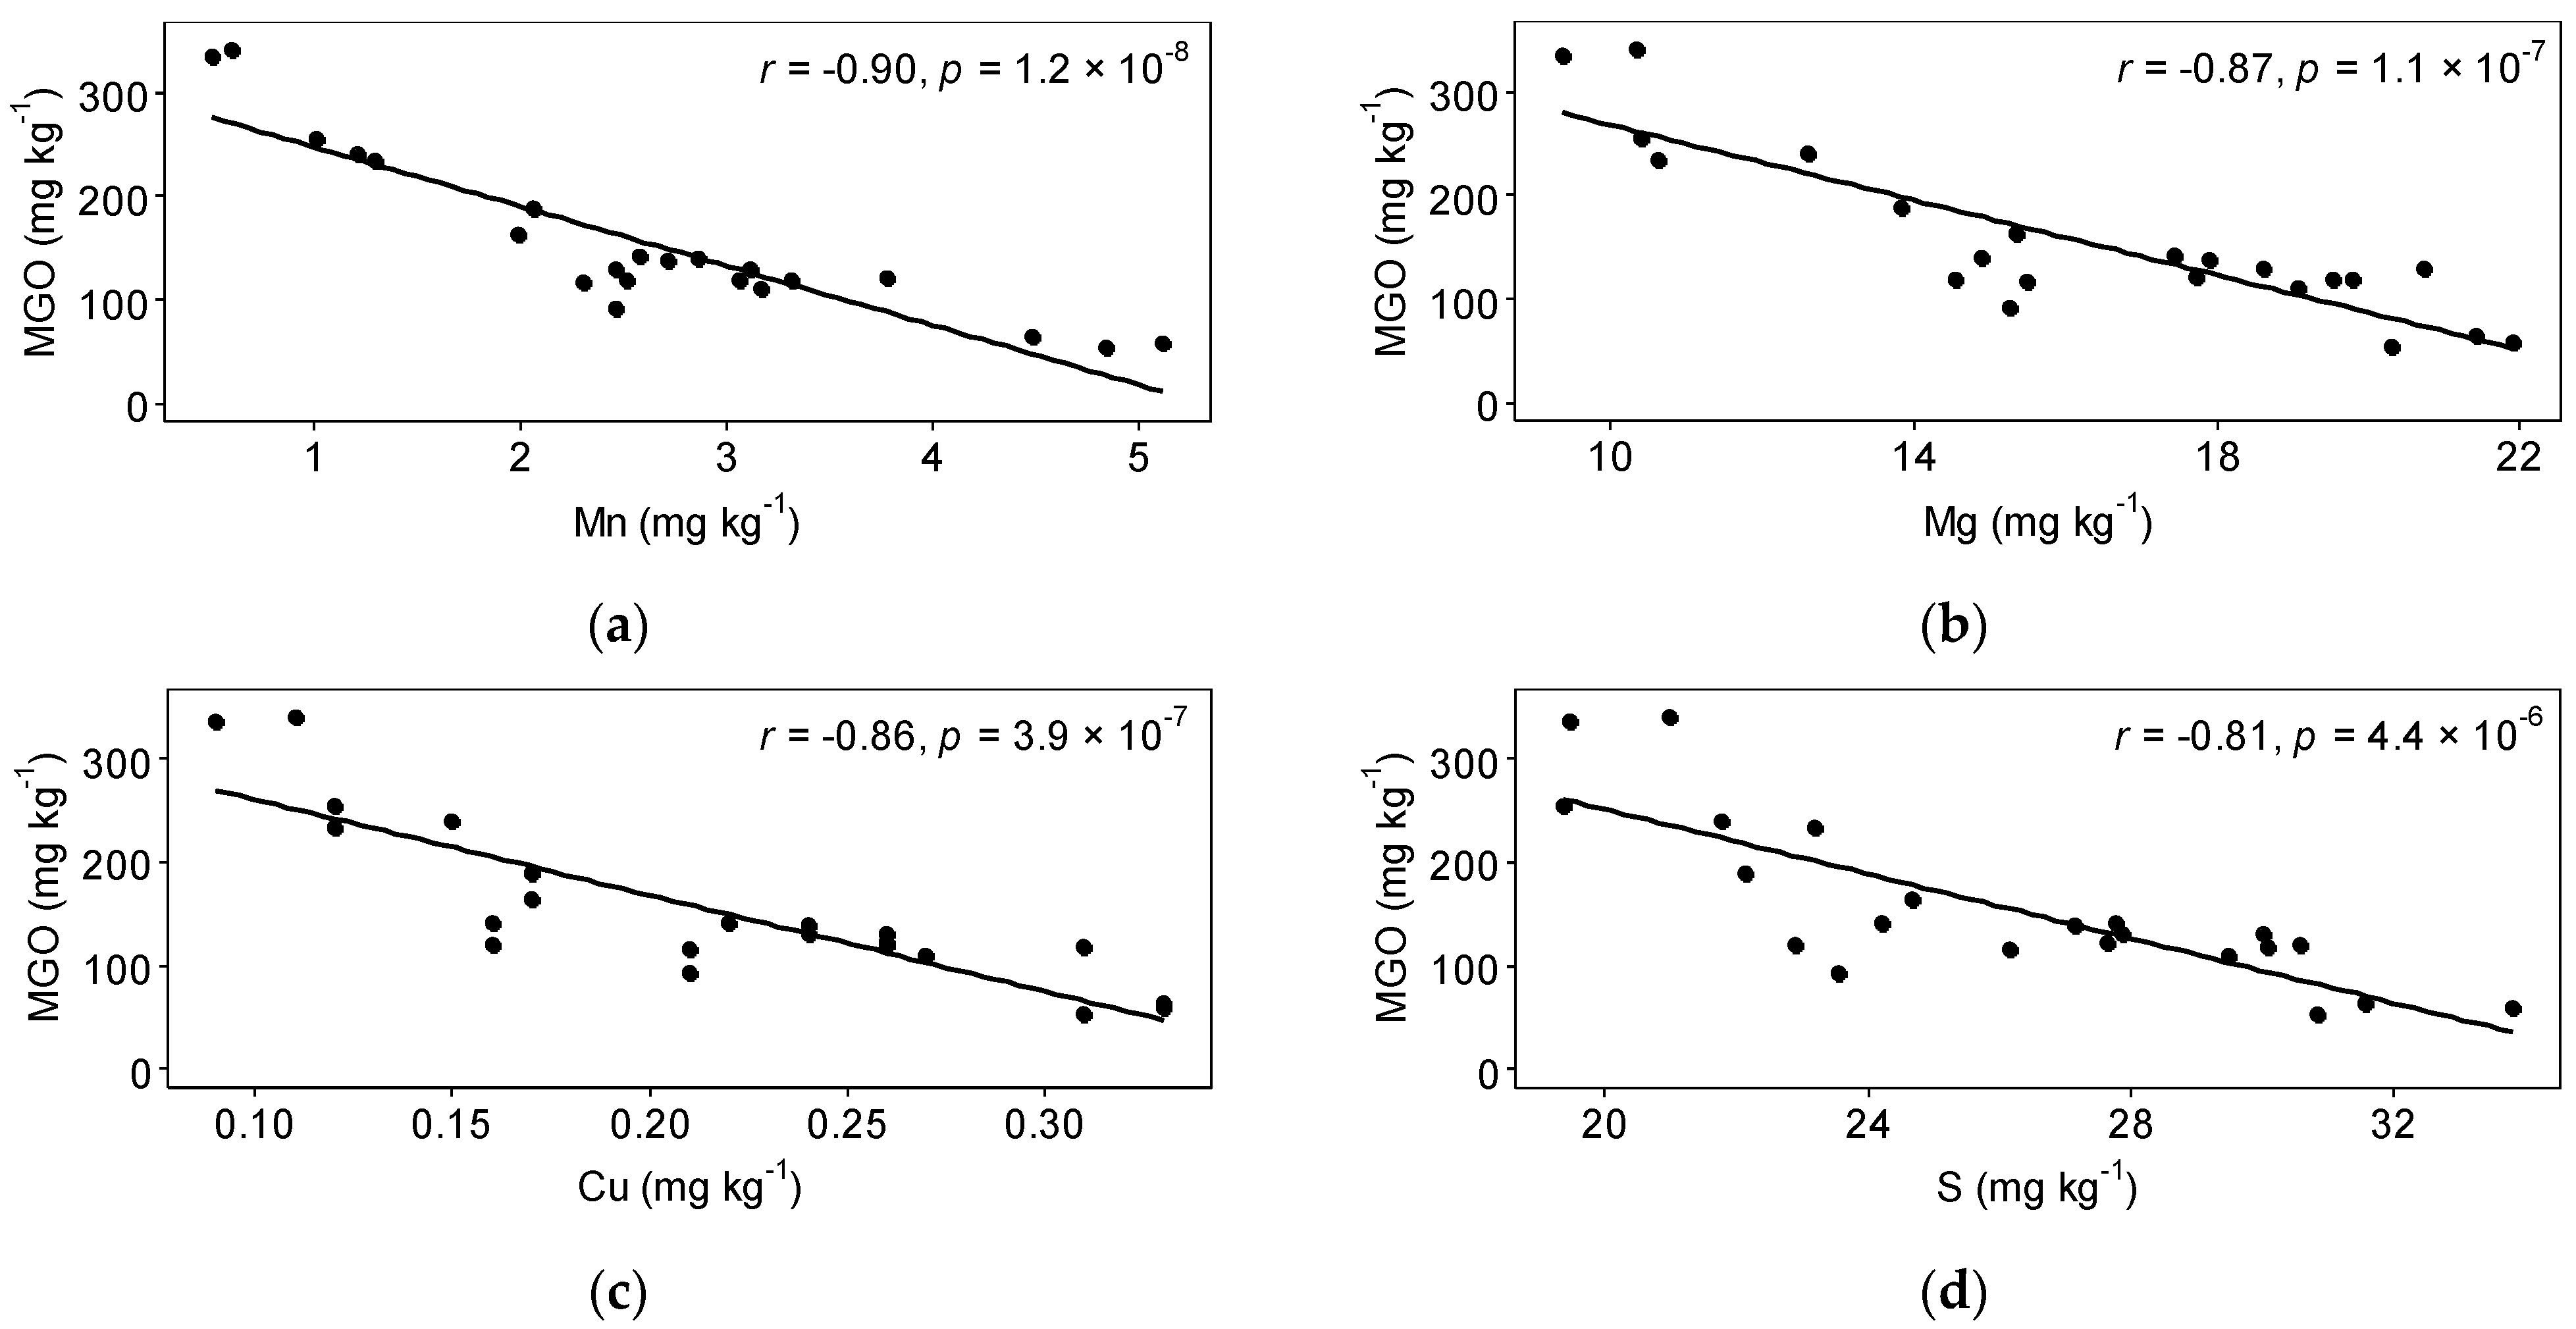
Negative correlations between honey elements and honey MGO were most pronounced for Mn, Cu, Mg, and S (Figure 3) but were also found for Na (r = −0.69, p ≤ 0.001), Ba (r = −0.61, p ≤ 0.01), K (r = −0.57, p ≤ 0.01), Zn (r = −0.57, p ≤ 0.01), and Al (r = −0.51, p ≤ 0.05). While there is no previous study correlating the concentration of mānuka honey elements and MGO, Alqarni et al. [43] studied the elemental composition of honeys in Saudi Arabia and included two New Zealand mānuka honeys with differing UMF. The UMF 18 honey in their study had lower concentrations of Mg, Mn, K, and Zn than the UMF 10 honey, but a higher Na concentration. They did not report Cu, S, Ba, and Al concentrations [43].

3.3. Interactions

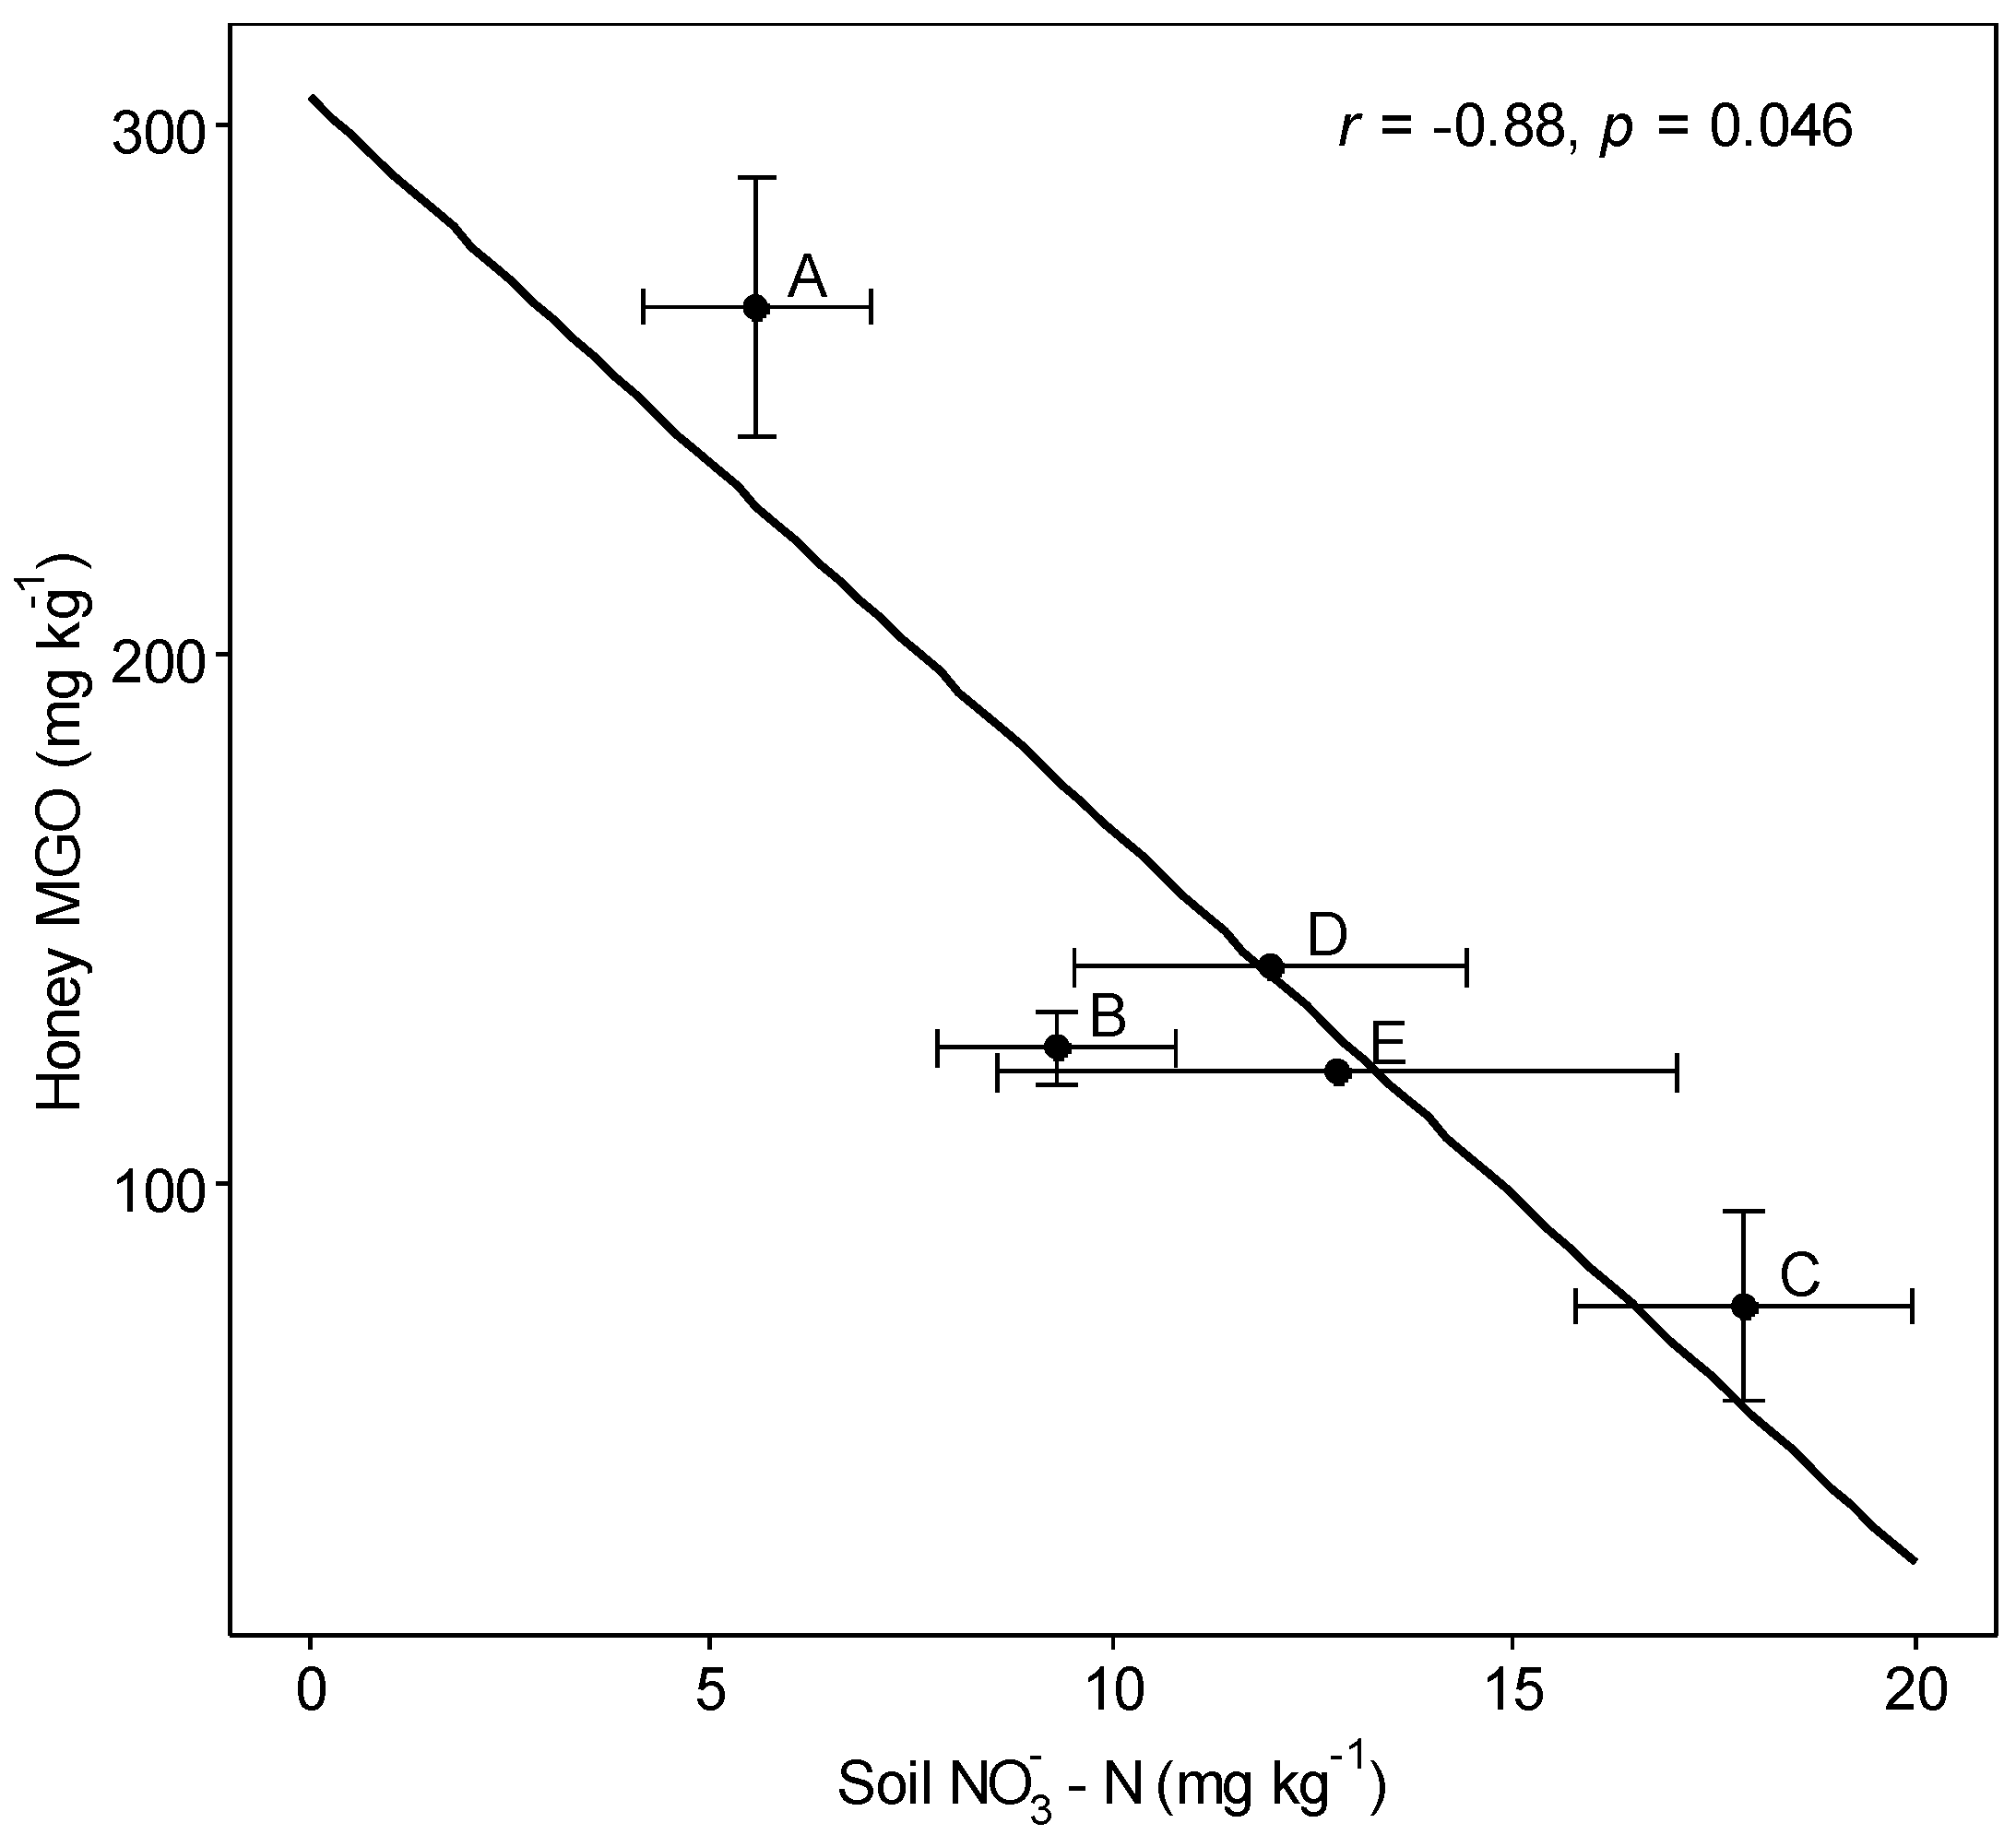
Contrary to studies on other honeys [13,50], there were no correlations between the elemental composition of mānuka honey and elemental concentrations in soils. The only soil factor that correlated with honey MGO was soil NO3 (r = −0.88, p < 0.05) (Figure 4). NO3 was shown to accelerate L. scoparium root growth [37,38] and could increase the accumulation of Fe, Mn, Zn, and Cu [53]. However, soil NO3 only correlated positively with plant Co (r = 0.49, p ≤ 0.005). It correlated negatively with plant Fe (r = −0.34, p ≤ 0.05). This could indicate a dilution of elements in the plants [40]. There was a positive correlation between the concentrations of K in plants and honeys (r = 0.91, p ≤ 0.01). Unlike most other elements tested, K is highly mobile in the plant phloem [54]. Therefore, elevated K concentrations in the plants may result in higher concentrations in the nectar.
The negative correlation between honey MGO and concentrations of Mn, Cu, Mg, S, Na, Ba, K, Zn, and Al does not necessarily indicate that these elements cause a reduction in honey antimicrobial activity. Both the honey MGO and elemental concentrations may correlate with another (unmeasured) factor. Direct effects of these elements in L. scoparium nectar on nectar DHA have not been described in the literature to date.
Smallfield et al. [55] found that DHA is not present in the phloem of L. scoparium, which indicates that its production is linked to nectar metabolism. Williams [26] suggested that DHA production might be associated with dihydroxyacetone phosphate production, which may occur in the floral nectaries [56]. The involved fructose 1, 6-bisphosphate requires Mg, Mn, Zn, or Co for activity [57]. In contrast, triosephosphate isomerase is inhibited by sulphate, phosphate, and arsenate [58]. Furthermore, in the nectar of Nicotiana spp., manganese superoxide dismutase generates high concentrations of H2O2 [59]. While H2O2 is only present at low levels in L. scoparium nectar [60], it can react with DHA to glycolate [61]. This indicates that, while the nectar and DHA production in L. scoparium is not understood, element-associated shifts in enzymatic reactions might affect levels of DHA in the nectar.
High concentrations of certain elements in nectar can also negatively affect the foraging behavior of honeybees. Xun et al. [62] showed that flowers treated with Zn, Cu, Ni, and Pb reduced the time honeybees spent foraging on these flowers and the amounts of nectar removal. Similarly, Meindl et al. [63] found that Ni-hyperaccumulation in plants reduced pollinator visitation. High concentrations of Mn and Cu in L. scoparium nectar might negatively affect the foraging behavior of honeybees and lead to more visitation of other nectar sources, which would therefore result in a lower MGO mānuka honey.
Previous studies have highlighted the importance of the botanical origin of honey as the main factor determining its elemental concentrations [64]. The lack of correlation between mānuka honey and L. scoparium foliage composition in this study indicates that honey elemental concentrations might have been diluted with other nectar. When honeybees gather nectar from different floral sources, the composition of the mānuka honey is affected. While mānuka honey has a higher total elemental concentration than non-native New Zealand honeys such as clover, native kāmahi (Weinmannia racemose) and rewarewa (Knightia excelsa) honeys have particularly high elemental concentrations [42]. High concentrations of chemical elements in this study could therefore be an indication of mānuka honey contamination with other floral nectar sources. K. excelsa is a common nectar contaminant that can result in dilution of mānuka honey [41]. Similarly, honeydew honey has high elemental concentrations [42]. L. scoparium is often infested by honeydew-producing scale insects, which leads to sooty mold development [65]. Sooty mold coverage was found to not directly affect the DHA concentration in L. scoparium nectar [19]. However, a dilution of mānuka honey with collected honeydew might affect the honey’s elemental composition. Furthermore, higher soil nutrient levels can be associated with increased exotic weed growth [66], which might in turn result in a dilution effect of mānuka honey with nectar from exotic species with high nectar elemental concentrations. It is therefore possible that the negative correlation between soil NO3 and mānuka honey MGO in our study is a result of accelerated growth of other non-native vegetation.
It is also possible that the elements in our mānuka honey samples did not originate from floral nectar. Elements in honey can derive from environmental pollution, agrochemicals, or natural non-nectar sources that the bees are in contact with when foraging, including air, water, and soil [52,67,68]. Elements can also be introduced during honey processing [27]. Mānuka honey has a low pH of about 3.5–4.5 [69], which can result in contamination of honey with Zn from galvanized metal or Cr and Ni from stainless steel [70,71]. Furthermore, elemental concentrations in the honey may be changed when beekeepers use other sugar sources as bee feed [72].
While the chemical elements in mānuka honey may not be causative of honey quality, they may provide a low-cost indication of MGO levels and may be used as a quality indicator for honey. The lack of correlation between plant chemistry and honey MGO concentrations may be due to the large number of plants whence honeybees forage. Future work should test the hypothesis that higher concentrations of Mn, Cu, Mg, S, Na, Ba, K, Zn, and Al are associated with a lower DHA concentration in L. scoparium nectar.

Supplementary Materials

The following are available online at https://www.mdpi.com/article/10.3390/foods10071670/s1, Table S1: Chemical characterization of soil at the different sites, Table S2: Soil exchangeable element concentrations at the different sites, Table S3: L. scoparium foliage elemental concentrations at the different sites.

Author Contributions

Conceptualization, B.R. and J.H.; sample collection, A.M. (Aydin Maxfield); statistical analysis: A.M. (Alexandra Meister); data curation, A.M. (Alexandra Meister); visualization, A.M. (Alexandra Meister); writing—original draft preparation, A.M. (Alexandra Meister); writing—review and editing, A.M. (Alexandra Meister), M.J.G.-G., A.M. (Aydin Maxfield), S.G., N.D., J.H. and B.R.; supervision, M.J.G.-G., S.G., N.D. and B.R. All authors have read and agreed to the published version of the manuscript.

Funding

This work is derived from the Centre for Integrated Biowaste Research funded by Strategic Science Investment Funding from Ministry of Business, Innovation and Employment, New Zealand (contract C03 × 1701).

Data Availability Statement

The data presented in this study are available on request from the corresponding author.

Acknowledgments

We gratefully acknowledge Watson & Son Ltd. for aid with the collection of the samples used in this study. The lead author acknowledges the receipt of a University of Canterbury Doctoral Scholarship.

Conflicts of Interest

The authors declare no conflict of interest.

References

  1. Stephens, J.M.C.; Molan, P.C.; Clarkson, B.D. A review of Leptospermum scoparium (Myrtaceae) in New Zealand. N. Z. J. Bot. 2005, 43, 431–449. [Google Scholar] [CrossRef]
  2. Thompson, J.A. A revision of the genus Leptospermum (Myrtaceae). Telopea 1989, 3, 301–449. [Google Scholar] [CrossRef]
  3. MPI (Ministry for Primary Industries). Apiculture. Ministry for Primary Industries 2019 Apiculture Monitoring Programme; Ministry for Primary Industries: Wellington, New Zealand, 2019. [Google Scholar]
  4. Molan, P.C. The antibacterial activity of honey: 2. Variation in the potency of the antibacterial activity. N. Z. Bee World 1992, 73, 59–76. [Google Scholar] [CrossRef]
  5. Adams, C.J.; Boult, C.H.; Deadman, B.J.; Farr, J.M.; Grainger, M.N.; Manley-Harris, M.; Snow, M.J. Isolation by HPLC and characterisation of the bioactive fraction of New Zealand manuka (Leptospermum scoparium) honey. Carbohydr. Res. 2008, 343, 651–659. [Google Scholar] [CrossRef] [PubMed]
  6. Mavric, E.; Wittmann, S.; Barth, G.; Henle, T. Identification and quantification of methylglyoxal as the dominant antibacterial constituent of manuka (Leptospermum scoparium) honeys from New Zealand. Mol. Nutr. Food Res. 2008, 52, 483–489. [Google Scholar] [CrossRef] [PubMed]
  7. Carter, D.A.; Blair, S.E.; Cokcetin, N.N.; Bouzo, D.; Brooks, P.; Schothauer, R.; Harry, E.J. Therapeutic Manuka Honey: No Longer So Alternative. Front. Microbiol. 2016, 7, 569. [Google Scholar] [CrossRef] [PubMed] [Green Version]
  8. Adams, C.J.; Manley-Harris, M.; Molan, P.C. The origin of methylglyoxal in New Zealand manuka (Leptospermum scoparium) honey. Carbohydr. Res. 2009, 344, 1050–1053. [Google Scholar] [CrossRef]
  9. Norton, A.M.; McKenzie, L.N.; Brooks, P.R.; Pappalardo, L.J. Quantitation of dihydroxyacetone in Australian Leptospermum nectar via High-Performance Liquid Chromatography. J. Agric. Food Chem. 2015, 63, 6513–6517. [Google Scholar] [CrossRef]
  10. Atrott, J.; Haberlau, S.; Henle, T. Studies on the formation of methylglyoxal from dihydroxyacetone in manuka (Leptospermum scoparium) honey. Carbohydr. Res. 2012, 361, 7–11. [Google Scholar] [CrossRef] [PubMed]
  11. Roberts, A.E.L.; Brown, H.L.; Jenkins, R.E. On the antibacterial effects of manuka honey: Mechanistic insights. Res. Rep. Biol. 2015, 6, 215–224. [Google Scholar]
  12. Clearwater, M.J.; Revell, M.; Noe, S.; Manley-Harris, M. Influence of genotype, floral stage, and water stress on floral nectar yield and composition of mānuka (Leptospermum scoparium). Ann. Bot. 2018, 121, 501–512. [Google Scholar] [CrossRef] [PubMed] [Green Version]
  13. Czipa, N.; Diosi, G.; Phillips, C.; Kovacs, B. Examination of honeys and flowers as soil element indicators. Environ. Monit. Assess 2017, 189, 412. [Google Scholar] [CrossRef] [Green Version]
  14. Xun, E.; Zhang, Y.; Zhao, J.; Guo, J. Translocation of heavy metals from soils into floral organs and rewards of Cucurbita pepo: Implications for plant reproductive fitness. Ecotoxicol. Environ. Saf. 2017, 145, 235–243. [Google Scholar] [CrossRef]
  15. Acquarone, C.; Buera, P.; Elizalde, B. Pattern of pH and electrical conductivity upon honey dilution as a complementary tool for discriminating geographical origin of honeys. Food Chem. 2007, 101, 695–703. [Google Scholar] [CrossRef]
  16. Baroni, M.V.; Podio, N.S.; Badini, R.G.; Inga, M.; Ostera, H.A.; Cagnoni, M.; Gautier, E.A.; Garcia, P.P.; Hoogewerff, J.; Wunderlin, D.A. Linking soil, water, and honey composition to assess the geographical origin of argentinean honey by multielemental and isotopic analyses. J. Agric. Food Chem. 2015, 63, 4638–4645. [Google Scholar] [CrossRef] [PubMed]
  17. Gonzalez-Porto, A.V.; Martin Arroyo, T.; Bartolome Esteban, C. How soil type (gypsum or limestone) influences the properties and composition of thyme honey. Springerplus 2016, 5, 1663. [Google Scholar] [CrossRef] [Green Version]
  18. Nickless, E.M.; Anderson, C.W.N.; Hamilton, G.; Stephens, J.M.; Wargent, J. Soil influences on plant growth, floral density and nectar yield in three cultivars of mānuka (Leptospermum scoparium). N. Z. J. Bot. 2017, 55, 100–117. [Google Scholar] [CrossRef]
  19. Williams, S.; King, J.; Revell, M.; Manley-Harris, M.; Balks, M.; Janusch, F.; Kiefer, M.; Clearwater, M.; Brooks, P.; Dawson, M. Regional, annual, and individual variations in the dihydroxyacetone content of the nectar of mānuka (Leptospermum scoparium) in New Zealand. J. Agric. Food Chem. 2014, 62, 10332–10340. [Google Scholar] [CrossRef]
  20. Hamilton, G.; Millner, J.P.; Robertson, A.; Stephens, J. Assessment of manuka provenances for production of high ‘unique manuka factor’ honey. Agron. N. Z. 2013, 43, 139–144. [Google Scholar]
  21. Millner, J.P.; Hamilton, G.; Ritchie, C.; Stephens, J. High UMF® honey production from manuka plantations. Hill Ctry. Grassl. Res. Pract. Ser. 2016, 16, 113–118. [Google Scholar]
  22. Noe, S.; Manley-Harris, M.; Clearwater, M.J. Floral nectar of wild mānuka (Leptospermum scoparium) varies more among plants than among sites. N. Z. J. Crop Hortic. Sci. 2019, 47, 282–296. [Google Scholar] [CrossRef]
  23. Stephens, J.M.C. The Factors Responsible for the Varying Levels of UMF® in Mānuka (Leptospermum scoparium) honey. Ph.D. Thesis, The University of Waikato, Hamilton, New Zealand, 2006. Available online: https://hdl.handle.net/10289/2655 (accessed on 1 May 2021).
  24. Esperschuetz, J.; Anderson, C.; Bulman, S.; Katamian, O.; Horswell, J.; Dickinson, N.M.; Robinson, B.H. Response of Leptospermum scoparium, Kunzea robusta and Pinus radiata to contrasting biowastes. Sci. Total Environ. 2017, 587–588, 258–265. [Google Scholar] [CrossRef] [PubMed]
  25. Gardner, R.C. Investigation of Geographical Correlations between Honey Methylglyoxal Content and Dihydroxacetone in Manuka Floral Nectar. Master’s Thesis, The University of Auckland, Auckland, New Zealand, 2014. Available online: http://hdl.handle.net/2292/22629 (accessed on 3 May 2021).
  26. Williams, S. Mapping Current and Potential Honey Production from the Leptospermum genus in Australia. Ph.D. Thesis, University of the Sunshine Coast, Sippy Downs, QLD, Australia, 2019. Available online: https://research.usc.edu.au/permalink/61USC_INST/3k4ahb/alma99450654802621 (accessed on 18 April 2021).
  27. Pohl, P.; Sergiel, I.; Stecka, H. Determination and fractionation of metals in honey. Crit. Rev. Anal. Chem. 2009, 39, 276–288. [Google Scholar] [CrossRef]
  28. Windsor, S.; Pappalardo, M.; Brooks, P.; Williams, S.; Manley-Harris, M. A convenient new analysis of dihydroxyacetone and methylglyoxal applied to Australian Leptospermum honeys. J. Pharmacogn. Phytother. 2012, 4, 6–11. [Google Scholar] [CrossRef]
  29. Esperschuetz, J.; Bulman, S.; Anderson, C.; Lense, O.; Horswell, J.; Dickinson, N.; Robinson, B.H. Production of biomass crops using biowastes on low-fertility soil: 2. Effect of biowastes on nitrogen transformation processes. J. Environ. Qual. 2016, 45, 1970–1978. [Google Scholar] [CrossRef] [PubMed] [Green Version]
  30. Blakemore, L.C.; Searle, P.L.; Daly, B.K. Methods for Chemical Analysis of Soils; NZ Soil Bureau Scientific Report 80; Department of Scientific and Industrial Research: Lower Hutt, New Zealand, 1987. [Google Scholar]
  31. Reiser, R.; Simmler, M.; Portmann, D.; Clucas, L.; Schulin, R.; Robinson, B. Cadmium concentrations in New Zealand pastures: Relationships to soil and climate variables. J. Environ. Qual. 2014, 43, 917–925. [Google Scholar] [CrossRef]
  32. R Core Team. R: A Language and Environment for Statistical Computing; R Foundation for Statistical Computing: Vienna, Austria, 2021; Available online: https://www.R-project.org/ (accessed on 1 April 2021).
  33. Cowie, J.D. Yellow-brown loams-definition and classification. In Soil Grups of New Zealand. Part 6, Yellow-Brown Loams; Neall, V.E., Ed.; New Zealand Society of Soil Science: Wellington, New Zealand, 1982. [Google Scholar]
  34. Berninger, E. Diversity of Tolerance to Soil pH in Leptospermum scoparium (J.R. and G.Forst) Populations from New Zealand. Acta Hortic. 1992, 320, 49–56. [Google Scholar] [CrossRef]
  35. Blume, H.-P.; Brümmer, G.W.; Fleige, H.; Horn, R.; Kandeler, E.; Kögel-Knabner, I.; Kretzschmar, R.; Stahr, K.; Wilke, B.-M. Scheffer/Schachtschabel Soil Science; Springer: Berlin/Heidelberg, Gernamy, 2016. [Google Scholar]
  36. Kirkby, E. Introduction, Definition and Classification of Nutrients. In Marschner’s Mineral Nutrition of Higher Plants, 3rd ed.; Marschner, P., Ed.; Academic Press: London, UK, 2012; pp. 3–5. [Google Scholar]
  37. Gutierrez-Gines, M.J.; Madejon, E.; Lehto, N.J.; McLenaghen, R.D.; Horswell, J.; Dickinson, N.; Robinson, B.H. Response of a pioneering species (Leptospermum scoparium J.R.Forst. & G.Forst.) to heterogeneity in a low-fertility soil. Front. Plant Sci. 2019, 10, 93. [Google Scholar] [CrossRef] [PubMed]
  38. Reis, F.V.P.; Gutiérrez-Ginés, M.J.; Smith, C.M.S.; Lehto, N.J.; Robinson, B.H. Mānuka ( Leptospermum scoparium ) roots forage biosolids in low fertility soil. Environ. Exp. Bot. 2017, 133, 151–158. [Google Scholar] [CrossRef]
  39. Chaney, R.L. Toxic element accumulation in soils and crops: Protecting soil fertility and agricultural food-chains. In Inorganic Contaminants in the Vadose Zone; Bar-Yosef, B., Barrow, N.J., Goldshmid, J., Eds.; Ecological Studies; Springer: Berlin, Germany, 1989; pp. 140–158. [Google Scholar]
  40. Jarrell, W.; Beverly, R. The dilution effect in plant nutrition studies. Adv. Agron. 1981, 34, 197–224. [Google Scholar]
  41. Stephens, J.M.; Schlothauer, R.C.; Morris, B.D.; Yang, D.; Fearnley, L.; Greenwood, D.R.; Loomes, K.M. Phenolic compounds and methylglyoxal in some New Zealand manuka and kanuka honeys. Food Chem. 2010, 120, 78–86. [Google Scholar] [CrossRef]
  42. Vanhanen, L.P.; Emmertz, A.; Savage, G.P. Mineral analysis of mono-floral New Zealand honey. Food Chem. 2011, 128, 236–240. [Google Scholar] [CrossRef] [PubMed]
  43. Alqarni, A.S.; Owayss, A.A.; Mahmoud, A.A.; Hannan, M.A. Mineral content and physical properties of local and imported honeys in Saudi Arabia. J. Saudi Chem. Soc. 2014, 18, 618–625. [Google Scholar] [CrossRef] [Green Version]
  44. Deng, J.; Liu, R.; Lu, Q.; Hao, P.; Xu, A.; Zhang, J.; Tan, J. Biochemical properties, antibacterial and cellular antioxidant activities of buckwheat honey in comparison to manuka honey. Food Chem. 2018, 252, 243–249. [Google Scholar] [CrossRef]
  45. Kek, S.P.; Chin, N.L.; Tan, S.W.; Yusof, Y.A.; Chua, L.S. Classification of honey from its bee origin via chemical profiles and mineral content. Food Anal. Methods 2016, 10, 19–30. [Google Scholar] [CrossRef]
  46. Moniruzzaman, M.; Chowdhury, M.A.; Rahman, M.A.; Sulaiman, S.A.; Gan, S.H. Determination of mineral, trace element, and pesticide levels in honey samples originating from different regions of Malaysia compared to manuka honey. Biomed. Res. Int. 2014, 2014, 359890. [Google Scholar] [CrossRef]
  47. Singh, I.; Singh, S. Honey moisture reduction and its quality. J. Food Sci. Technol. 2018, 55, 3861–3871. [Google Scholar] [CrossRef] [PubMed]
  48. Solayman, M.; Islam, M.A.; Paul, S.; Ali, Y.; Khalil, M.I.; Alam, N.; Gan, S.H. Physicochemical properties, minerals, trace elements, and heavy metals in honey of different origins: A comprehensive review. Compr. Rev. Food Sci. Food Saf. 2016, 15, 219–233. [Google Scholar] [CrossRef]
  49. Bogdanov, S.; Jurendic, T.; Sieber, R.; Gallmann, P. Honey for nutrition and health: A review. J. Am. Coll. Nutr. 2008, 27, 677–689. [Google Scholar] [CrossRef]
  50. González-Miret, M.L.; Terrab, A.; Hernanz, D.; Fernandéz-Recamales, M.Á.; Heredia, F.J. Multivariate correlation between color and mineral composition of honeys and by their botanical origin. J. Agric. Food Chem. 2005, 53, 2574–2580. [Google Scholar] [CrossRef]
  51. Machado De-Melo, A.A.; de Almeida-Muradian, L.B.; Sancho, M.T.; Pascual-Maté, A. Composition and properties of Apis mellifera honey: A review. J. Apic. Res. 2017, 57, 5–37. [Google Scholar] [CrossRef]
  52. Grainger, M.N.C.; Klaus, H.; Hewitt, N.; French, A.D. Investigation of inorganic elemental content of honey from regions of North Island, New Zealand. Food Chem. 2021, 361, 130110. [Google Scholar] [CrossRef] [PubMed]
  53. Klikocka, H.; Marks, M. Sulphur and Nitrogen Fertilization as a Potential Means of Agronomic Biofortification to Improve the Content and Uptake of Microelements in Spring Wheat Grain DM. J. Chem. 2018, 2018, 1–12. [Google Scholar] [CrossRef]
  54. Hawkesford, M.; Horst, W.; Kichey, T.; Lambers, H.; Schjoerring, J.; Møller, I.S.; White, P. Functions of macronutrients. In Marschner’s Mineral Nutrition of Higher Plants; Marschner, P., Ed.; Elsevier: Amsterdam, The Netherlands, 2012; pp. 135–189. [Google Scholar]
  55. Smallfield, B.M.; Joyce, N.I.; van Klink, J.W. Developmental and compositional changes in Leptospermum scoparium nectar and their relevance to mānuka honey bioactives and markers. N. Z. J. Bot. 2018, 56, 183–197. [Google Scholar] [CrossRef]
  56. Wenzler, M.; Holscher, D.; Oerther, T.; Schneider, B. Nectar formation and floral nectary anatomy of Anigozanthos flavidus: A combined magnetic resonance imaging and spectroscopy study. J. Exp. Bot. 2008, 59, 3425–3434. [Google Scholar] [CrossRef] [Green Version]
  57. Liang, J.-Y.; Zhang, Y.; Huang, S.; Lipscomb, W.N. Allosteric transition of fructose-1, 6-bisphosphatase. Proc. Natl. Acad. Sci. USA 1993, 90, 2132–2136. [Google Scholar] [CrossRef] [Green Version]
  58. Lambeir, A.M.; Opperdoes, F.R.; Wierenga, R.K. Kinetic properties of triose—Phosphate isomerase from Trypanosoma brucei brucei: A comparison with the rabbit muscle and yeast enzymes. Eur. J. Biochem. 1987, 168, 69–74. [Google Scholar] [CrossRef]
  59. Carter, C.; Thornburg, R.W. Is the nectar redox cycle a floral defense against microbial attack? Trends Plant Sci. 2004, 9, 320–324. [Google Scholar] [CrossRef]
  60. Brudzynski, K.; Abubaker, K.; Castle, A. Re-Examining the Role of Hydrogen Peroxide in Bacteriostatic and Bactericidal Activities of Honey. Front. Microbiol. 2011, 2, 213. [Google Scholar] [CrossRef] [Green Version]
  61. Maksimovic, V.; Mojovic, M.; Vucinic, Z. Monosaccharide-H2O2 reactions as a source of glycolate and their stimulation by hydroxyl radicals. Carbohydr. Res. 2006, 341, 2360–2369. [Google Scholar] [CrossRef]
  62. Xun, E.; Zhang, Y.; Zhao, J.; Guo, J. Heavy metals in nectar modify behaviors of pollinators and nectar robbers: Consequences for plant fitness. Environ. Pollut. 2018, 242, 1166–1175. [Google Scholar] [CrossRef] [PubMed]
  63. Meindl, G.A.; Bain, D.J.; Ashman, T.-L. Variation in nickel accumulation in leaves, reproductive organs and floral rewards in two hyperaccumulating Brassicaceae species. Plant Soil 2014, 383, 349–356. [Google Scholar] [CrossRef]
  64. Bogdanov, S.; Haldimann, M.; Luginbühl, W.; Gallmann, P. Minerals in honey: Environmental, geographical and botanical aspects. J. Apic. Res. Bee World 2007, 46, 269–275. [Google Scholar] [CrossRef]
  65. Porter, N.G.; Smale, P.E.; Nelson, M.A.; Hay, A.J.; Van Klink, J.W.; Dean, C.M. Variability in essential oil chemistry and plant morphology within a Leptospermum scoparium population. N. Z. J. Bot. 1998, 36, 125–133. [Google Scholar] [CrossRef] [Green Version]
  66. Prober, S.M.; Wiehl, G. Relationships among soil fertility, native plant diversity and exotic plant abundance inform restoration of forb-rich eucalypt woodlands. Divers. Distrib. 2012, 18, 795–807. [Google Scholar] [CrossRef]
  67. Porrini, C.; Ghini, S.; Girotti, S.; Sabatini, A.G.; Gattavecchia, E.; Celli, G. Use of honey bees as bioindicators of environmental pollution in Italy. In Honey Bees: Estimating the Environmental Impact of Chemicals; Devillers, J., Pham-Delegue, M.-H., Eds.; Taylor & Francis: London, UK, 2002. [Google Scholar]
  68. Scripca, L.A.; Amariei, S. The Influence of Chemical Contaminants on the Physicochemical Properties of Unifloral and Multifloral Honey. Foods 2021, 10, 1039. [Google Scholar] [CrossRef] [PubMed]
  69. Alvarez-Suarez, J.M.; Gasparrini, M.; Forbes-Hernandez, T.Y.; Mazzoni, L.; Giampieri, F. The Composition and Biological Activity of Honey: A Focus on Manuka Honey. Foods 2014, 3, 420–432. [Google Scholar] [CrossRef] [Green Version]
  70. Stoewsand, G.S.; Stamer, J.R.; Kosikowski, F.V.; Morse, R.A.; Bache, C.A.; Lisk, D.J. Chromium and nickel in acidic foods and by-products containing stainless steel during processing. Bull. Environ. Contam. Toxicol. 1979, 21, 600–603. [Google Scholar] [CrossRef]
  71. Tong, S.S.C.; Morse, R.A.; Bache, C.A.; Lisk, D.J. Elemental analysis of honey as an indicator of pollution. Arch. Environ. Health 1975, 30, 329–332. [Google Scholar] [CrossRef]
  72. Pita-Calvo, C.; Guerra-Rodriguez, M.E.; Vazquez, M. Analytical Methods Used in the Quality Control of Honey. J. Agric. Food Chem. 2017, 65, 690–703. [Google Scholar] [CrossRef] [PubMed]
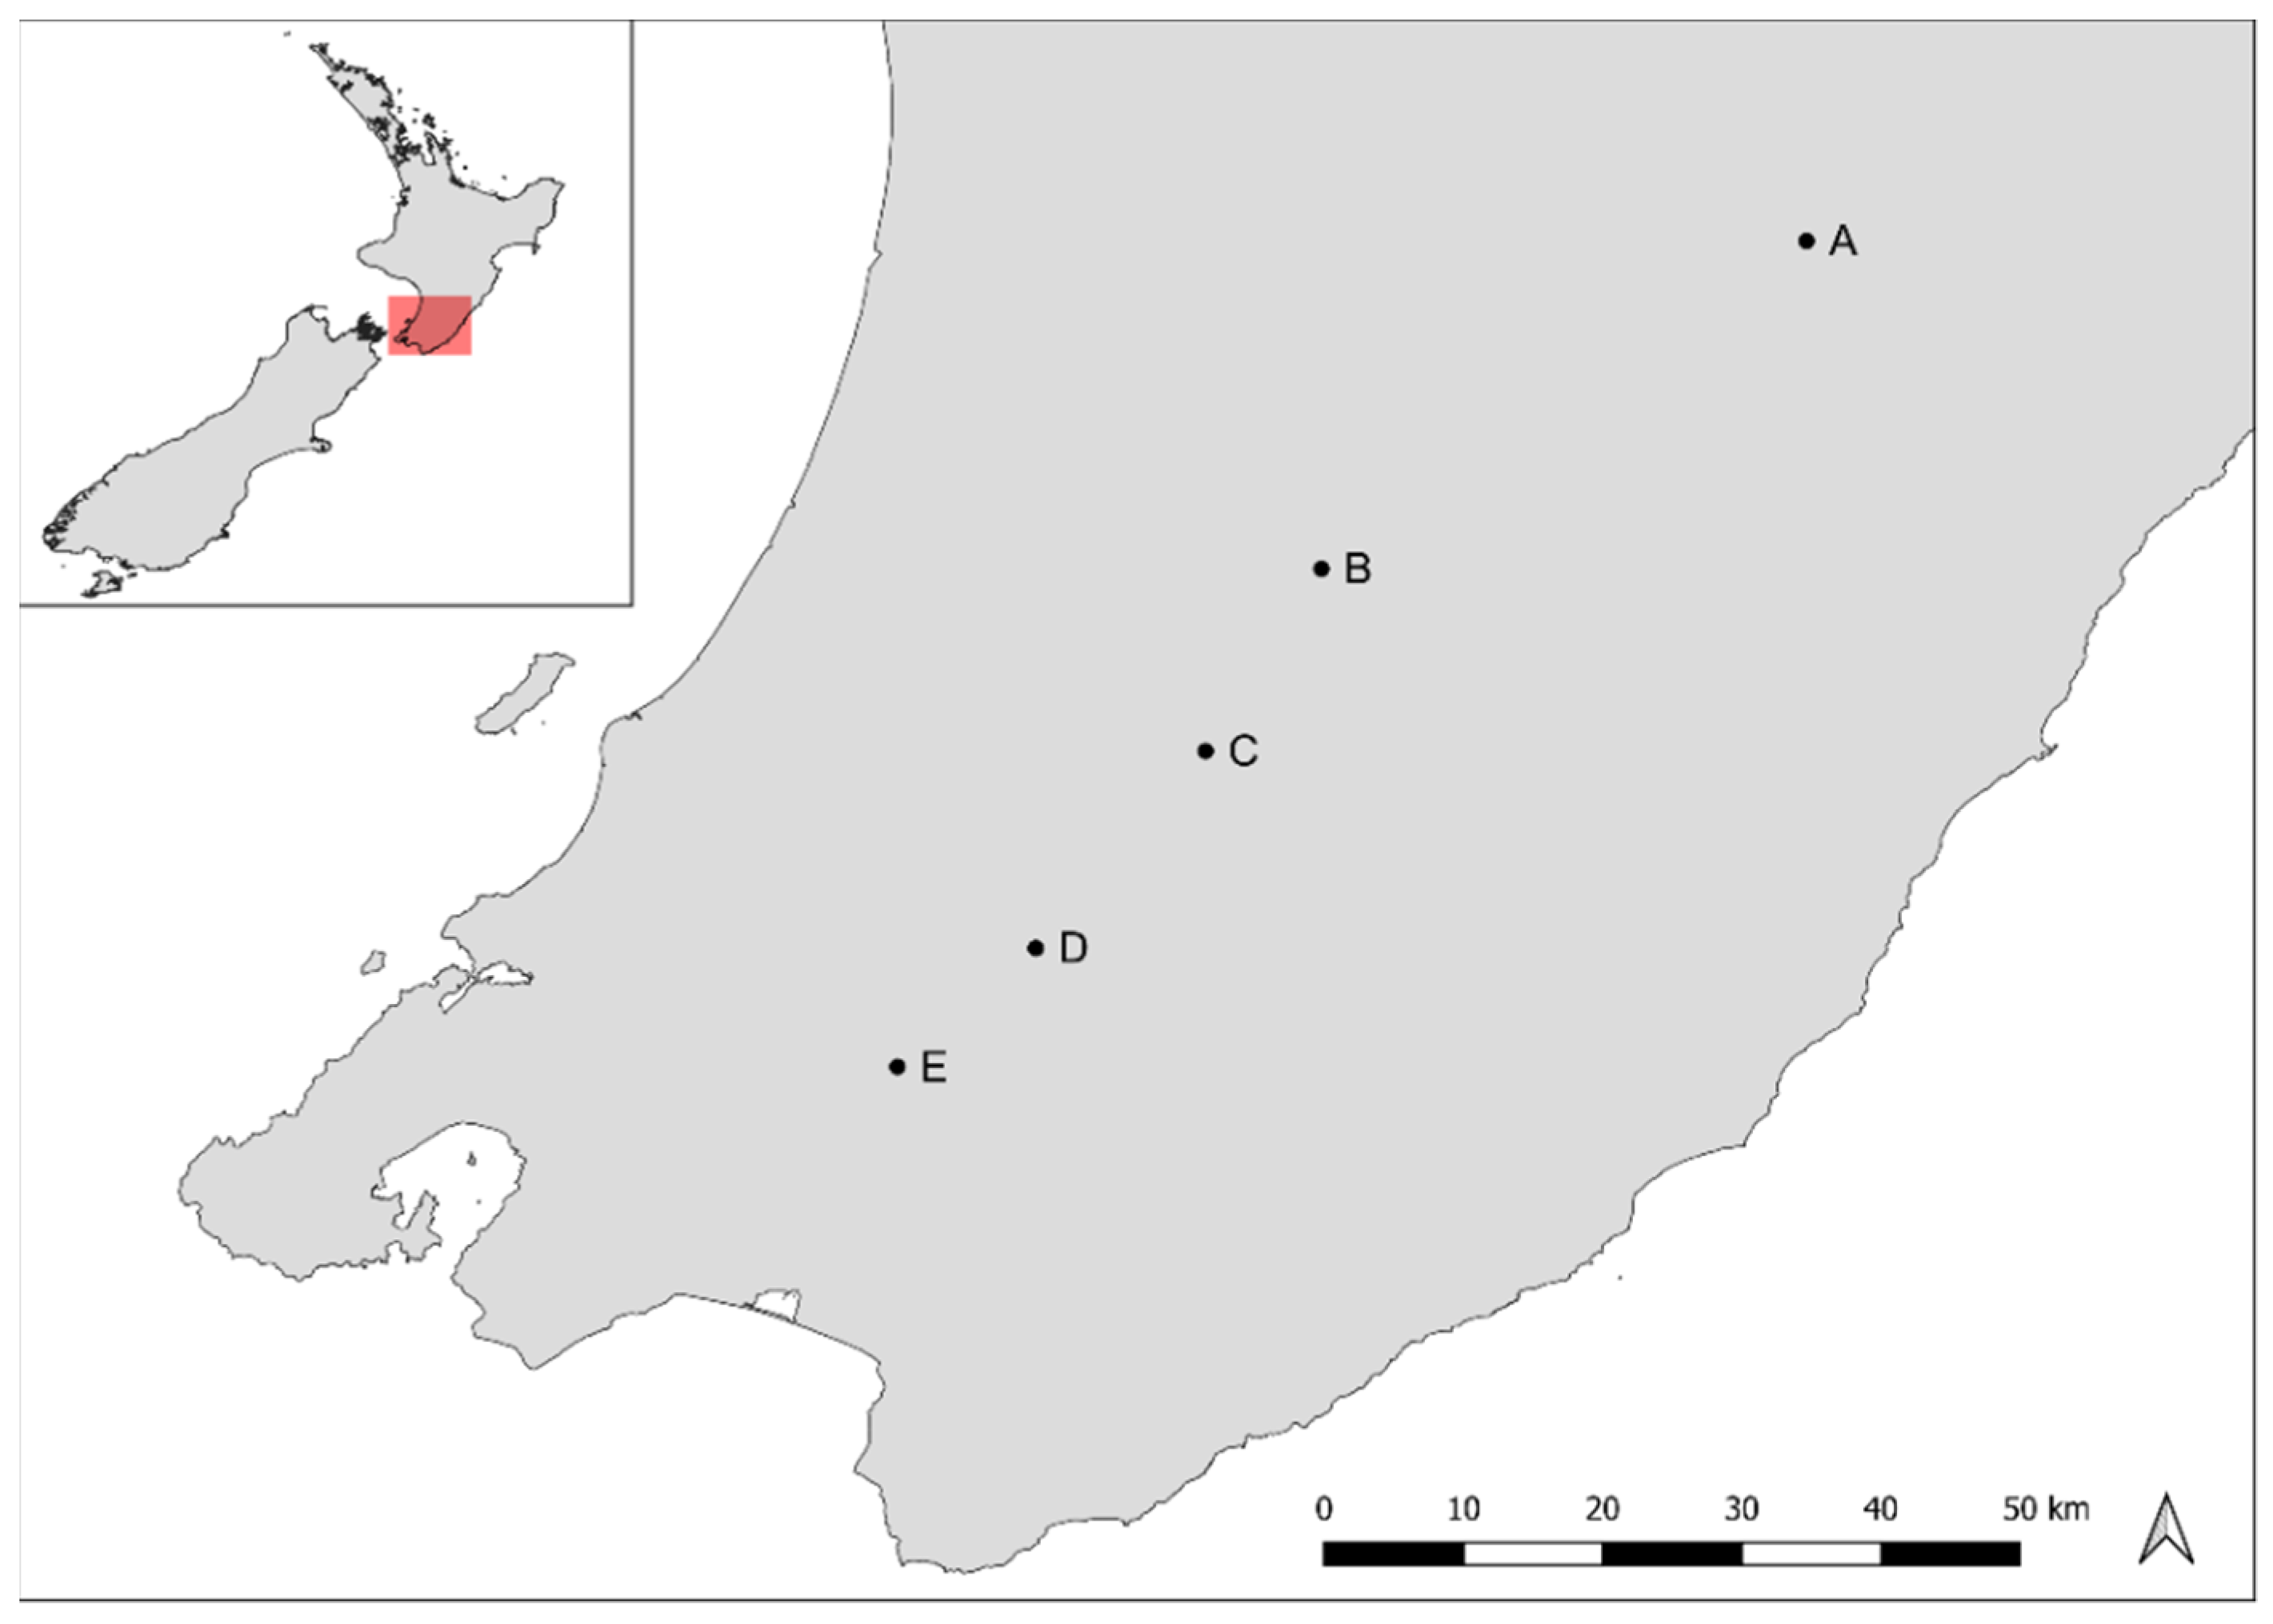
Figure 1. Sampling sites (A–E) in the Wairarapa region of New Zealand.
Foods 10 01670 g001
Figure 2. Principal component analysis (PCA) describing the variation of honey MGO, DHA, and elemental concentrations: (a) loading plot; (b) score plot. The ellipses are eye-guides to delineate the three distinct groupings.
Foods 10 01670 g002
Figure 3. Honey MGO versus honey elemental concentrations: (a) Mn; (b) Mg; (c) Cu; (d) S. The black lines are linear regression lines. R values are Pearson’s correlation coefficients.
Foods 10 01670 g003
Figure 4. Honey MGO versus soil NO3-N. Values are means for sites A-E (honey n = 1–9, soil n = 5–14). Bars represent the standard error of the mean. The black line is a linear regression line. R is the Pearson’s correlation coefficient.
Foods 10 01670 g004
Table 1. Methylglyoxal (MGO), dihydroxyacetone (DHA), and elemental concentrations in honeys from sites A–E. The locations of the sites are shown in Figure 1.
SiteABCDE
n = 6n = 9n = 4n = 1n = 2
MGO266 ± 25 a126 ± 6.9 b77 ± 18 b141121
DHA3246 ± 221 a1856 ± 71 b1293 ± 226 b19831642
Al6.5 ± 0.91 a11 ± 0.60 b9.1 ± 0.34 ab5.15.5
B2.8 ± 0.18 a2.8 ± 0.10 a2.5 ± 0.12 a2.82.8
Ba0.08 ± 0.01 a0.09 ± 0.00 a0.11 ± 0.00 b0.090.09
Ca61 ± 2.9 a60 ± 2.5 a61 ± 1.9 a6268
Cr0.02 ± 0.01 a0.02 ± 0.00 a0.02 ± 0.00 a0.020.03
Cu0.13 ± 0.01 a0.24 ± 0.01 b0.30 ± 0.02 c0.160.21
Fe1.2 ± 0.45 a1.1 ± 0.09 a0.91 ± 0.12 a0.720.95
K487 ± 14 a671 ± 25 b1108 ± 55 c463465
Mg11 ± 0.68 a18 ± 0.61 b21 ± 0.35 c1516
Mn1.1 ± 0.23 a2.7 ± 0.15 b4.2 ± 0.60 c2.93.2
Na27 ± 0.99 a34 ± 0.99 b47 ± 2.2 c3840
P54 ± 0.99 a50 ± 1.4 a65 ± 4.4 b6264
S21 ± 0.62 a28 ± 0.85 b31 ± 43 b2425
Zn0.32 ± 0.02 a0.36 ± 0.03 a0.47 ± 0.03 b0.370.47
Mean ± standard error. Different letters indicate significant differences between sites at p ≤ 0.05 according to Tukey’s HSD test. Values are in mg kg−1.
Publisher’s Note: MDPI stays neutral with regard to jurisdictional claims in published maps and institutional affiliations.