
Efficiency of DNA Mini-Barcoding to Assess Mislabeling in Commercial Fish Products in Italy: An Overview of the Last Decade


Abstract
:1. Introduction
2. Materials and Methods
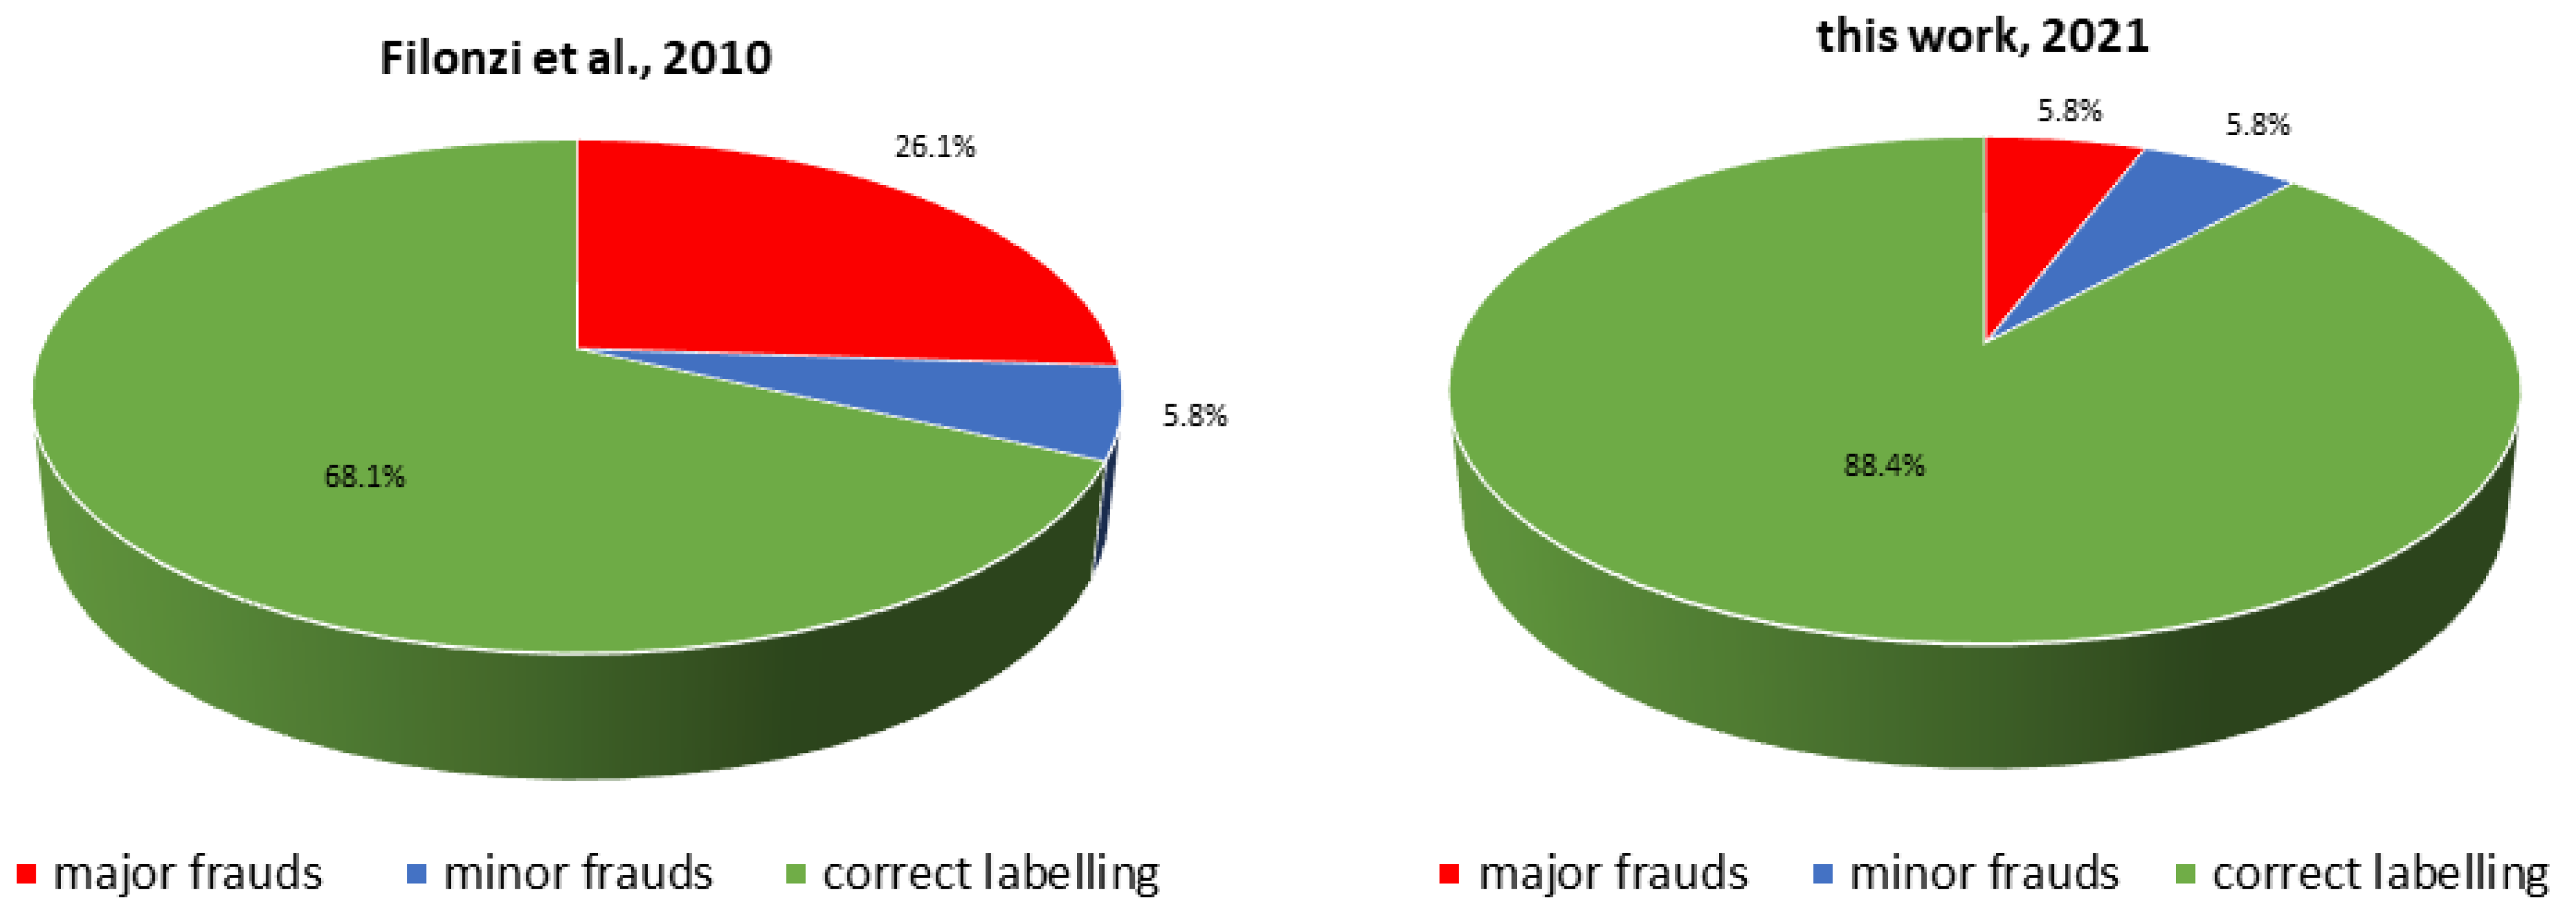
3. Results
4. Discussion
5. Conclusions
Author Contributions
Funding
Institutional Review Board Statement
Acknowledgments
Conflicts of Interest
References
- Food and Agriculture Organization of the United Nations (FAO). The State of World Fisheries and Aquaculture 2008; Fisheries and Aquaculture Department: Rome, Italy, 2009. [Google Scholar]
- Food and Agriculture Organization of the United Nations (FAO). The state of world fisheries and aquaculture 2016. In Contributing to Food Security and Nutrition for All; FAO: Rome, Italy, 2016. [Google Scholar]
- Marko, P.B.; Lee, S.C.; Rice, A.; Gramling, J.M.; Fitzhenry, T.M.; McAlister, J.S.; Harper, G.; Moran, A.L. Mislabelling of a depleted reef fish. Nature 2004, 430, 309–310. [Google Scholar] [CrossRef]
- van Leeuwen, S.P.J.; van Velzen, M.J.M.; Swart, C.P.; van der Veen, I.; Traag, W.A.; de Boer, J. Halogenated Contaminants in Farmed Salmon, Trout, Tilapia, Pangasius, and Shrimp. Environ. Sci. Technol. 2009, 43, 4009–4015. [Google Scholar] [CrossRef]
- Spink, J.; Moyer, D.C. Defining the Public Health Threat of Food Fraud. J. Food Sci. 2011, 76, R157–R163. [Google Scholar] [CrossRef]
- Committee on the Environment. Draft report on the food crisis, fraud in the food chain and the control thereof. In Public Health and Food Safety from European Parliament, 2091; EU Parliament Publisher: Strasbourg, France, 2013; pp. 1–9. [Google Scholar]
- Regulation (EU) No 1379/2013 of 11 December 2013. On the common organisation of the markets in fishery and aquaculture products, amending Council regulations (EC)No 1184/2006 and (EC) No 1224/2009 and repealing Council regulation (EC) No 104/2000. Off. J. Eur. Union. 28 December 2013.
- Teletchea, F. Molecular identification methods of fish species: Reassessment and possible applications. Rev. Fish Biol. Fish. 2009, 19, 265. [Google Scholar] [CrossRef]
- Wallace, L.; Boilard, S.M.A.L.; Eagle, S.H.C.; Spall, J.L.; Shokralla, S.; Hajibabaei, M. DNA barcodes for everyday life: Routine authentication of Natural Health Products. Food Res. Int. 2012, 49, 446–452. [Google Scholar] [CrossRef]
- Roe, A.; Sperling, F. Patterns of evolution of mitochondrial cytochrome c oxidase I and II DNA and implications for DNA barcoding. Mol. Phylogenet. Evol. 2007, 44, 325–345. [Google Scholar] [CrossRef]
- Wandeler, P.; Hoeck, P.E.; Keller, L.F. Back to the future: Museum specimens in population genetics. Trends Ecol. Evol. 2007, 22, 634–642. [Google Scholar] [CrossRef] [Green Version]
- Mutanen, M.; Kekkonen, M.; Prosser, S.W.J.; Hebert, P.D.N.; Kaila, L. One species in eight: DNA barcodes from type specimens resolve a taxonomic quagmire. Mol. Ecol. Resour. 2015, 15, 967–984. [Google Scholar] [CrossRef] [PubMed]
- Cespedes, A.; Garcia, T.; Carrera, E.; Gonzalez, I.; Fernandez, A.; Hernandez, P.E. Application of polymerase chain reaction–single strand conformational polymorphism (PCR–SSCP) to identification of flatfish species. J. AOAC Int. 1999, 82, 903–907. [Google Scholar] [CrossRef] [Green Version]
- Dawnay, N.; Ogden, R.; McEwing, R.; Carvalho, G.R.; Thorpe, R.S. Validation of the barcoding gene COI for use in forensic genetic species identification. Forensic Sci. Int. 2007, 173, 1–6. [Google Scholar] [CrossRef] [PubMed]
- Shokralla, S.; Hellberg, R.S.; Handy, S.M.; King, I.; Hajibabaei, M. A DNA Mini-barcoding system for authentication of processed fish products. Sci. Rep. 2015, 5, 15894. [Google Scholar] [CrossRef] [PubMed]
- Chakraborty, M.; Dhar, B.; Ghosh, S.K. Design of character-based DNA barcode motif for species identification: A computational approach and its validation in fishes. Mol. Ecol. Resour. 2017, 17, 1359–1370. [Google Scholar] [CrossRef]
- Sultana, S.; Ali, M.E.; Hossain, M.M.; Naquiah, N.; Zaidul, I. Universal mini COI barcode for the identification of fish species in processed products. Food Res. Int. 2018, 105, 19–28. [Google Scholar] [CrossRef] [PubMed]
- Maldini, M.; Marzano, F.N.; Fortes, G.G.; Papa, R.; Gandolfi, G. Fish and seafood traceability based on AFLP markers: Elaboration of a species database. Aquaculture 2006, 261, 487–494. [Google Scholar] [CrossRef]
- Filonzi, L.; Chiesa, S.; Vaghi, M.; Marzano, F.N. Molecular barcoding reveals mislabelling of commercial fish products in Italy. Food Res. Int. 2010, 43, 1383–1388. [Google Scholar] [CrossRef]
- Kumar, S.; Stecher, G.; Tamura, K. MEGA7: Molecular evolutionary genetics analysis version 7.0 for bigger datasets. Mol. Biol. Evol. 2016, 33, 1870–1874. [Google Scholar] [CrossRef] [PubMed] [Green Version]
- Pardo, M.Á.; Jiménez, E.; Viðarsson, J.R.; Ólafsson, K.; Ólafsdóttir, G.; Daníelsdóttir, A.K.; Pérez-Villareal, B. DNA barcoding revealing mislabeling of seafood in European mass caterings. Food Control 2018, 92, 7–16. [Google Scholar] [CrossRef]
- IUCN Red List of Threatened Species. Available online: https://www.iucn.org/resources/conservation-tools/iucn-red-list-threatened-species (accessed on 3 May 2021).
- Shehata, H.R.; Naaum, A.M.; Garduño, R.A.; Hanner, R. DNA barcoding as a regulatory tool for seafood authentication in Canada. Food Control 2018, 92, 147–153. [Google Scholar] [CrossRef]
- Ceruso, M.; Mascolo, C.; De Luca, P.; Venuti, I.; Biffali, E.; Ambrosio, R.; Smaldone, G.; Sordino, P.; Pepe, T. Dentex dentex Frauds: Establishment of a New DNA Barcoding Marker. Foods 2021, 10, 580. [Google Scholar] [CrossRef] [PubMed]
- Ceruso, M.; Mascolo, C.; Anastasio, A.; Pepe, T.; Sordino, P. Frauds and fish species authentication: Study of the complete mitochondrial genome of some Sparidae to provide specific barcode markers. Food Control 2019, 103, 36–47. [Google Scholar] [CrossRef]
- Ceruso, M.; Mascolo, C.; De Luca, P.; Venuti, I.; Smaldone, G.; Biffali, E.; Anastasio, A.; Pepe, T.; Sordino, P. A Rapid Method for the Identification of Fresh and Processed Pagellus erythrinus Species against Frauds. Foods 2020, 9, 1397. [Google Scholar] [CrossRef]
- Günther, B.; Raupach, M.J.; Knebelsberger, T. Full-length and mini-length DNA barcoding for the identification of seafood commercially traded in Germany. Food Control 2017, 73, 922–929. [Google Scholar] [CrossRef]
- Carvalho, D.C.; Palhares, R.; Drummond, M.G.; Frigo, T.B. DNA Barcoding identification of commercialized seafood in South Brazil: A governmental regulatory forensic program. Food Control 2015, 50, 784–788. [Google Scholar] [CrossRef]
- Nagalakshmi, K.; Annam, P.K.; Venkateshwarlu, G.; Pathakota, G.B.; Lakra, W.S. Mislabeling in Indian seafood: An investigation using DNA barcoding. Food Control 2016, 59, 196–200. [Google Scholar] [CrossRef]
- Di Pinto, A.; Marchetti, P.; Mottola, A.; Bozzo, G.; Bonerba, E.; Ceci, E.; Bottaro, M.; Tantillo, G.M. Species identification in fish fillet products using DNA barcoding. Fish. Res. 2015, 170, 9–13. [Google Scholar] [CrossRef]
- Luque, G.M.; Donlan, C.J. The characterization of seafood mislabeling: A global meta-analysis. Biol. Conserv. 2019, 236, 556–570. [Google Scholar] [CrossRef]
- Pepe, T.; Trotta, M.; Di Marco, I.; Anastasio, A.; Bautista, J.M.; Cortesi, M.L. Fish Species Identification in Surimi-Based Products. J. Agric. Food Chem. 2007, 55, 3681–3685. [Google Scholar] [CrossRef] [PubMed]
- Barbuto, M.; Galimberti, A.; Ferri, E.; Labra, M.; Malandra, R.; Galli, P.; Casiraghi, M. DNA barcoding reveals fraudulent substitutions in shark seafood products: The Italian case of “palombo” (Mustelus spp.). Food Res. Int. 2010, 43, 376–381. [Google Scholar] [CrossRef]
- Armani, A.; Castigliego, L.; Tinacci, L.; Gianfaldoni, D.; Guidi, A. Molecular characterization of icefish, (Salangidae family), using direct sequencing of mitochondrial cytochrome b gene. Food Control 2011, 22, 888–895. [Google Scholar] [CrossRef]
- Di Pinto, A.; Di Pinto, P.; Terio, V.; Bozzo, G.; Bonerba, E.; Ceci, E.; Tantillo, G. DNA barcoding for detecting market substitution in salted cod fillets and battered cod chunks. Food Chem. 2013, 141, 1757–1762. [Google Scholar] [CrossRef] [PubMed]
- Mariani, S.; Griffiths, A.M.; Velasco, A.; Kappel, K.; Jérôme, M.; Perez-Martin, R.; Schroeder, U.; Verrez-Bagnis, V.; Silva, H.; Vandamme, S.G.; et al. Low mislabeling rates indicate marked improvements in European seafood market operations. Front. Ecol. Environ. 2015, 13, 536–540. [Google Scholar] [CrossRef]
- Đorđević, Đ.; Buchtova, H.; Borkovcova, I. Estimation of amino acids profile and escolar fish consumption risks due to biogenic amines content fluctuations in vacuum skin packaging/VSP during cold storage. LWT Food Sci. Technol. 2016, 66, 657–663. [Google Scholar] [CrossRef]

| Sample ID | Geographical Origin | Common Name | Declared Scientific Name |
|---|---|---|---|
| MB01 | Southeast Atlantic Ocean | Deep-water Cape hake | Merluccius capensis e/o M. paradoxus |
| MB02 | Northeast Atlantic Ocean | Pink salmon | Oncorhynchus gorbuscha |
| MB03 | Northeast Atlantic Ocean—Iceland seabed | Atlantic cod | Gadus morhua |
| MB04 | East Central Atlantic Ocean | Goldblotch grouper | Epinephelus costae |
| MB05 | Northeast Atlantic Ocean | Pink salmon | Oncorhynchus gorbuscha |
| MB06 | Eastern Indian Ocean | Swordfish | Xiphias gladius |
| MB07 | East Central Atlantic Ocean | Angolan dentex | Dentex angolensis |
| MB08 | Northeast Atlantic Ocean—Baltic Sea | Atlantic cod | Gadus morhua |
| MB09 | Northeast Pacific Ocean | Pink salmon | Oncorhynchus gorbuscha |
| MB10 | Northeast Atlantic Ocean—Baltic Sea | Atlantic cod | Gadus morhua |
| MB11 | Southeast Atlantic Ocean | Blue shark | Prionace glauca |
| MB12 | Northeast Atlantic Ocean | Haddock | Melanogrammus aeglefinus |
| MB13 | Northeast Pacific Ocean | Pink salmon | Oncorhynchus gorbuscha |
| MB14 | East Central Atlantic Ocean | Goldblotch grouper | Epinephelus costae |
| MB15 | Northeast Atlantic Ocean | Haddock | Melanogrammus aeglefinus |
| MB16 | Southeast Atlantic Ocean | Deep-water Cape hake | Merluccius capensis e/o M. paradoxus |
| MB17 | Northeast Atlantic Ocean—Iceland seabed | Atlantic cod | Gadus morhua |
| MB18 | Southeast Atlantic Ocean | Deep-water Cape hake | Merluccius capensis e/o M. paradoxus |
| MB19 | Central Western Pacific Ocean | Skipjack tuna | Katsuwonus pelamis |
| MB20 | East Central Atlantic Ocean | Angolan dentex | Dentex angolensis |
| MB21 | Pacific Ocean Northeast or North West | Pink salmon | Oncorhynchus gorbuscha |
| MB22 | Northwest Atlantic Ocean | Atlantic cod | Gadus morhua |
| MB23 | Northeast Pacific Ocean | North Pacific hake | Merluccius productus |
| MB24 | Southeast Atlantic Ocean | Swordfish | Xiphias gladius |
| MB25 | Central Western Pacific Ocean | Skipjack tuna | Katsuwonus pelamis |
| MB26 | Northeast Pacific Ocean | North Pacific hake | Merluccius productus |
| MB27 | Northeast Atlantic Ocean—Iceland seabed | Atlantic cod | Gadus morhua |
| MB28 | East Central Atlantic Ocean | Angolan dentex | N/A |
| MB29 | Northeast Atlantic Ocean | Beaked redfish | N/A |
| MB30 | Pacific Ocean Northeast or North West | Alaska pollock | Theragra chalcogramma |
| MB31 | Northeast Atlantic Ocean | Atlantic cod | Gadus morhua |
| MB32 | Pacific Ocean Northeast or North West | Pink salmon | Oncorhynchus gorbuscha |
| MB33 | Pacific Ocean Northeast or North West | Alaska pollock | Theragra chalcogramma |
| MB34 | Central or Southeast Pacific Ocean | Swordfish | Xiphias gladius |
| MB35 | Southeast Atlantic Ocean | Blue shark | Prionace glauca |
| MB36 | Southeast Atlantic Ocean | Swordfish | Xiphias gladius |
| MB37 | Atlantic Ocean | Beaked redfish | Sebastes norvegicus |
| MB38 | Northeast Atlantic Ocean | Tub gurnard | Chelidonichtys lucerna |
| MB39 | East Central Atlantic Ocean | Spiny turbot | Psettodes spp. |
| MB40 | East Central Atlantic Ocean | Swordfish | Xiphias gladius |
| MB41 | Western Mediterranean | Leerfish | Lichia amia |
| MB42 | Southeast Atlantic Ocean | Deep-water Cape hake | Merluccius capensis e/o M. paradoxus |
| MB43 | N/A | Alaska pollock | Theragra chalcogramma |
| MB44 | Northwest Atlantic Ocean | Porbeagle | Lamna nasus |
| MB45 | Northeast Atlantic Ocean | European plaice | Pleuronectes platessa |
| MB46 | Indian Ocean | Yellowfin tuna | Thunnus albacares |
| MB47 | Lake Victoria | Nile perch | Lates niloticus |
| MB48 | Northwest Atlantic Ocean | Picked dogfish | Squalus acanthias |
| MB49 | Northeast Atlantic Ocean | Golden redfish | Sebastes norvegicus |
| MB50 | East Central Atlantic Ocean | Bearded brotula | Brotula barbata |
| MB51 | Northeast Atlantic Ocean | European plaice | Pleuronectes platessa |
| MB52 | East Central Atlantic Ocean | Shortfin mako | Isurus oxyrinchus |
| MB53 | Lake Victoria, Tanzania | Nile perch | Lates niloticus |
| MB54 | East Central Atlantic Ocean | Porbeagle | Isurus oxyrinchus |
| MB55 | North Sea | Smooth-hound | Mustelus mustelus |
| MB56 | Northwest Atlantic Ocean | Halibut | Reinhardtius hippoglossoides |
| MB57 | Unreported | Alaska pollock | Theragra chalcogramma |
| MB58 | Northeast Atlantic Ocean | European plaice | Pleuronectes platessa |
| MB59 | Iceland seabed | Beaked redfish | Sebastes mentella |
| MB60 | Norwegian Sea | Saithe | Pollachius virens |
| MB61 | Pacific Ocean Southwest | Shortfin mako | Isurus oxyrinchus |
| MB62 | Norwegian Sea | Atlantic cod | Gadus morhua |
| MB63 | Northeast Atlantic Ocean | Saithe | Pollachius virens |
| MB64 | N/A | Swordfish | Xiphias gladius |
| MB65 | Northeast Atlantic Ocean | European plaice | Pleuronectes platessa |
| MB66 | N/A | Porbeagle | N/A |
| MB67 | Northeast Atlantic Ocean | Atlantic cod | Gadus morhua |
| MB68 | North Sea | Smooth-hound | Mustelus mustelus |
| MB69 | Pacific Ocean Northwest | Pacific cod | Gadus macrocephalus |
| MB70 | Northeast Atlantic Ocean | Atlantic cod | Gadus morhua |
| MB71 | N/A | Alaska pollock | N/A |
| Sample ID | Declared Scientific Name | GenBank Result (BLAST) | % Identity GenBank | BOLD Result | % Identity BOLD |
|---|---|---|---|---|---|
| MB01 | Merluccius capensis e/o M. paradoxus | Merluccius paradoxus | 99.1 | Merluccius paradoxus | 98.9 |
| MB02 | Oncorhynchus gorbuscha | Oncorhynchus gorbuscha | 98.3 | Oncorhynchus gorbuscha | 97.7 |
| MB03 | Gadus morhua | Gadus morhua | 98.6 | Gadus morhua | 98.4 |
| MB04 | Epinephelus costae | Epinephelus costae | 98.3 | Epinephelus costae | 99.1 |
| MB05 | Oncorhynchus gorbuscha | Oncorhynchus gorbuscha | 97.7 | Oncorhynchus gorbuscha | 98.0 |
| MB06 | Xiphias gladius | Xiphias gladius | 100 | Xiphias gladius | 100 |
| MB07 | Dentex angolensis | Dentex maroccanus | 99.1 | Dentex macrophtalmus | 100 |
| MB08 | Gadus morhua | Gadus morhua | 98.3 | Gadus morhua | 98.1 |
| MB09 | Oncorhynchus gorbuscha | Oncorhynchus gorbuscha | 98.6 | Oncorhynchus gorbuscha | 100 |
| MB10 | Gadus morhua | Gadus morhua | 98.3 | Gadus morhua | 98.0 |
| MB11 | Prionace glauca | Prionace glauca | 99.1 | Prionace glauca | 100 |
| MB12 | Melanogrammus aeglefinus | Melanogrammus aeglefinus | 99.1 | Melanogrammus aeglefinus | 100 |
| MB13 | Oncorhynchus gorbuscha | Oncorhynchus gorbuscha | 99.5 | Oncorhynchus gorbuscha | 100 |
| MB14 | Epinephelus costae | Epinephelus costae | 98.2 | Epinephelus costae | 99.1 |
| MB15 | Melanogrammus aeglefinus | Melanogrammus aeglefinus | 99.5 | Melanogrammus aeglefinus | 100 |
| MB16 | Merluccius capensis e/o M. paradoxus | Merluccius paradoxus | 98.2 | Merluccius paradoxus | 99.1 |
| MB17 | Gadus morhua | Gadus morhua | 98.2 | Gadus morhua | 100 |
| MB18 | Merluccius capensis e/o M. paradoxus | Merluccius paradoxus | 100 | Merluccius paradoxus | 100 |
| MB19 | Katsuwonus pelamis | Thunnus thynnus | 98.7 | Thunnus maccoyii | 100 |
| MB20 | Dentex angolensis | Dentex maroccanus | 96.9 | Dentex macrophtalmus | 99.4 |
| MB21 | Oncorhynchus gorbuscha | Oncorhynchus gorbuscha | 98.8 | Oncorhynchus gorbuscha | 100 |
| MB22 | Gadus morhua | Gadus morhua | 99.1 | Gadus morhua | 98.7 |
| MB23 | Merluccius productus | Merluccius productus | 98.8 | Merluccius productus | 100 |
| MB24 | Xiphias gladius | Xiphias gladius | 98.7 | Xiphias gladius | 100 |
| MB25 | Katsuwonus pelamis | Thunnus thynnus | 99.2 | Thunnus maccoyii | 100 |
| MB26 | Merluccius productus | Merluccius productus | 99.1 | Merluccius productus | 100 |
| MB27 | Gadus morhua | Gadus morhua | 99.1 | Gadus morhua | 100 |
| MB28 | N/A | Dentex angolenses | 99.1 | Dentex angolenses | 100 |
| MB29 | N/A | Sebastes mentella | 99.1 | Sebastes mentella | 99.5 |
| MB30 | Theragra chalcogramma | Theragra chalcogramma | 99.5 | Gadus chalcogrammus | 100 |
| MB31 | Gadus morhua | Gadus morhua | 99.4 | Gadus morhua | 98.8 |
| MB32 | Oncorhynchus gorbuscha | Oncorhynchus gorbuscha | 99.5 | Oncorhynchus gorbuscha | 100 |
| MB33 | Theragra chalcogramma | Theragra chalcogramma | 99.5 | Gadus chalcogrammus | 100 |
| MB34 | Xiphias gladius | Xiphias gladius | 99.5 | Xiphias gladius | 100 |
| MB35 | Prionace glauca | Prionace glauca | 99.5 | Prionace glauca | 99.4 |
| MB36 | Xiphias gladius | Xiphias gladius | 100 | Xiphias gladius | 100 |
| MB37 | Sebastes norvegicus | Sebastes norvegicus | 99.1 | Sebastes viviparus | 100 |
| MB38 | Chelidonichtys lucerna | Merluccius paradoxus | 98.7 | Merluccius paradoxus | 99.1 |
| MB39 | Psettodes spp. | Psettodes bennettii | 99.1 | Psettodes bennettii | 99.5 |
| MB40 | Xiphias gladius | Xiphias gladius | 100 | Xiphias gladius | 100 |
| MB41 | Lichia amia | Lichia amia | 99.1 | Lichia amia | 99.0 |
| MB42 | Merluccius capensis e/o M. paradoxus | Merluccius paradoxus | 99.1 | Merluccius paradoxus | 98.1 |
| MB43 | Theragra chalcogramma | Theragra chalcogramma | 99.1 | Gadus chalcogrammus | 100 |
| MB44 | Lamna nasus | Isurus oxyrinchus | 99.5 | Isurus oxyrinchus | 99.5 |
| MB45 | Pleuronectes platessa | Pleuronectes platessa | 100 | Pleuronectes platessa | 99.1 |
| MB46 | Thunnus albacares | Thunnus albacares | 99.6 | Thunnus albacares | 99.1 |
| MB47 | Lates niloticus | Lates niloticus | 100 | Lates niloticus | 100 |
| MB48 | Squalus acanthias | Squalus acanthias | 99.1 | Squalus acanthias | 98.2 |
| MB49 | Sebastes norvegicus | Sebastes norvegicus | 99.1 | Sebastes viviparus | 99.5 |
| MB50 | Brotula barbata | Brotula barbata | 98.3 | Brotula multibarbata | 99.5 |
| MB51 | Pleuronectes platessa | Pleuronectes platessa | 99.1 | Pleuronectes platessa | 99.5 |
| MB52 | Isurus oxyrinchus | Isurus oxyrinchus | 99.2 | Isurus oxyrinchus | 99.5 |
| MB53 | Lates niloticus | Lates niloticus | 98.2 | Lates niloticus | 97.1 |
| MB54 | Isurus oxyrinchus | Isurus oxyrinchus | 99.5 | Isurus oxyrinchus | 99.5 |
| MB55 | Mustelus mustelus | Mustelus asterias | 98.3 | Mustelus asterias | 98.3 |
| MB56 | Reinhardtius hippoglossoides | Reinhardtius hippoglossoides | 99.1 | Reinhardtius hippoglossoides | 99.5 |
| MB57 | Theragra chalcogramma | Theragra chalcogramma | 98.7 | Gadus chalcogrammus | 99.4 |
| MB58 | Pleuronectes platessa | Pleuronectes platessa | 98.3 | Pleuronectes platessa | 99.1 |
| MB59 | Sebastes mentella | Sebastes mentella | 99.1 | Sebastes viviparus | 99.5 |
| MB60 | Pollachius virens | Pollachius virens | 99.1 | Pollachius virens | 100 |
| MB61 | Isurus oxyrinchus | Isurus oxyrinchus | 99.1 | Isurus oxyrinchus | 99.4 |
| MB62 | Gadus morhua | Gadus morhua | 99.5 | Gadus morhua | 99.5 |
| MB63 | Pollachius virens | Pollachius virens | 99.5 | Pollachius virens | 100 |
| MB64 | Xiphias gladius | Xiphias gladius | 98.8 | Xiphias gladius | 100 |
| MB65 | Pleuronectes platessa | Pleuronectes platessa | 99.1 | Pleuronectes platessa | 99.5 |
| MB66 | N/A | N/A | N/A | N/A | N/A |
| MB67 | Gadus morhua | Gadus morhua | 96.5 | Gadus morhua | 98.6 |
| MB68 | Mustelus mustelus | Mustelus asterias | 98.1 | Mustelus asterias | 97.5 |
| MB69 | Gadus macrocephalus | N/A | N/A | N/A | N/A |
| MB70 | Gadus morhua | Gadus morhua | 99.1 | Gadus morhua | 97.8 |
| MB71 | N/A | Theragra chalcogramma | 99.1 | Gadus chalcogrammus | 98.3 |
Publisher’s Note: MDPI stays neutral with regard to jurisdictional claims in published maps and institutional affiliations. |
© 2021 by the authors. Licensee MDPI, Basel, Switzerland. This article is an open access article distributed under the terms and conditions of the Creative Commons Attribution (CC BY) license (https://creativecommons.org/licenses/by/4.0/).
Share and Cite
Filonzi, L.; Vaghi, M.; Ardenghi, A.; Rontani, P.M.; Voccia, A.; Nonnis Marzano, F. Efficiency of DNA Mini-Barcoding to Assess Mislabeling in Commercial Fish Products in Italy: An Overview of the Last Decade. Foods 2021, 10, 1449. https://doi.org/10.3390/foods10071449
Filonzi L, Vaghi M, Ardenghi A, Rontani PM, Voccia A, Nonnis Marzano F. Efficiency of DNA Mini-Barcoding to Assess Mislabeling in Commercial Fish Products in Italy: An Overview of the Last Decade. Foods. 2021; 10(7):1449. https://doi.org/10.3390/foods10071449
Chicago/Turabian StyleFilonzi, Laura, Marina Vaghi, Alessia Ardenghi, Pietro Maria Rontani, Andrea Voccia, and Francesco Nonnis Marzano. 2021. "Efficiency of DNA Mini-Barcoding to Assess Mislabeling in Commercial Fish Products in Italy: An Overview of the Last Decade" Foods 10, no. 7: 1449. https://doi.org/10.3390/foods10071449
APA StyleFilonzi, L., Vaghi, M., Ardenghi, A., Rontani, P. M., Voccia, A., & Nonnis Marzano, F. (2021). Efficiency of DNA Mini-Barcoding to Assess Mislabeling in Commercial Fish Products in Italy: An Overview of the Last Decade. Foods, 10(7), 1449. https://doi.org/10.3390/foods10071449