Article

Production and Characterization of a Novel Low-Sugar Beverage from Red Jujube Fruits and Bamboo Shoots Fermented with Selected Lactiplantibacillus plantarum

1
State Key Laboratory of Food Nutrition and Safety, College of Food Science and Engineering, Tianjin University of Science and Technology, Tianjin 300457, China
2
Tianjin Key Laboratory of Food Science and Health, School of Medicine, Nankai University, Tianjin 300071, China
*
Authors to whom correspondence should be addressed.
Foods 2021, 10(7), 1439; https://doi.org/10.3390/foods10071439
Submission received: 31 May 2021 / Revised: 10 June 2021 / Accepted: 17 June 2021 / Published: 22 June 2021
(This article belongs to the Topic Fruit and Vegetable Juice Processing and Nutrition)

Abstract

:
Red jujube fruits and bamboo shoots are rich in many nutrients and have the advantage of high yield in China. However, the storage of fresh fruits is difficult, and there are no fermented products using both as raw materials. In order to develop the two raw materials into novel products and improve their nutritional value, this study reports the production and characterization of a beverage via fermentation of red jujube fruits and bamboo shoots with Lactiplantibacillus plantarum. L. plantarum TUST-232 was selected as the starter from several different strains by comparing pH value and the number of viable cells, which reached 8.91 log CFU/mL in the beverage fermented for 14 h at 37 °C with 0.3% inoculation. After fermentation, the beverage showed improvement in the contents of several nutrients and antioxidant indices, with a decrease of 44.10% in sucrose content, along with increases of 11.09%, 12.30%, and 59.80% in total phenolic content, total antioxidant capacity, and superoxide anion scavenging ability, respectively. These results indicate that L. plantarum fermentation of red jujube fruits and bamboo shoots could be an effective way to develop a new beverage with high nutritional value, high antioxidant capacity, and high dietary fiber content. This research provided experimental support for the development of new fermentation products with the functions of improving health and body functions.

1. Introduction

Red jujube (Ziziphus jujuba Mill), a fruit native to China, is rich in nutrients and functional components, such as vitamin C, polysaccharides, dietary fibers, carbohydrates, triterpenoid acids, flavones, and phenolic acids [1]. Bamboo shoot, the bud of Gramineae Bambusoideae, is not only delicious, but also rich in nutrients, proteins, and dietary fibers, thus being beneficial to intestinal health [2,3]. Although fruits and vegetables are rich in nutrition and beneficial to human health, their daily intake is lower for many people than that recommended by the World Health Organization [4].
Lactic acid bacteria (LAB) are usually beneficial microorganisms, with many beneficial effects on humans and animals when properly ingested [5,6]. LAB-fermented juices can not only facilitate the intake of fruits and vegetables, but also improve the sensory quality, flavor substances, safety, and shelf-life of beverages [7]. The amount of yeast and mold in the fermented juices can be kept at a very low level after storage at 4 °C for 2 or 3 weeks [8]. More importantly, LAB can release specific bioactive compounds, which are beneficial to people’s health [9]. Various studies have confirmed the role of LAB in improving nutritional value and treating intestinal diseases, such as improving the flavor and antioxidant activity, extending shelf-life, regulating the balance of intestinal microbiota, promoting the absorption of nutrients, and improving the body’s immunity [10,11]. Therefore, LAB-fermented beverages have gradually attracted the attention of researchers and gained the recognition of consumers [12]. However, to our knowledge, no fermented beverage has been developed using red jujube fruits and bamboo shoots as raw materials.
The purpose of this study was to develop and characterize a low-sugar, high-antioxidant, and fiber-rich fermented beverage of red jujube fruits and bamboo shoots by evaluating the effects of Lactiplantibacillus plantarum on the metabolism of sugars and organic acids, as well as the changes in antioxidant activity, total phenolic content, total flavonoid content, and dietary fiber content in the beverage. To the best of our knowledge, this is the first report on the development and characterization of a fermented beverage from red jujube fruits and bamboo shoots, and the results will provide useful information for further processing and utilization of red jujube fruits and bamboo shoots.

2. Materials and Methods

2.1. Strains and Raw Materials

Streptococcus thermophilus 20364 and Lactobacillus delbrueckii subsp. bulgaricus 20247 were obtained from the China Center of Industrial Culture Collection, CICC®. Lactiplantibacillus plantarum TUST-232, L. plantarum TUST-354, and L. plantarum TUST-392 were provided by the State Key Laboratory of Food Nutrition and Safety, Tianjin University of Science and Technology. Modified Chalmers media (MC) (Haibo, Qingdao, China) was used for the culture of S. thermophilus, and the other bacteria were cultured using De Man, Rogosa, Sharpe (MRS) media (Haibo, Qingdao, China).
After washing, the red jujube fruits were first boiled to preliminarily remove bitterness and astringency and then ninefold diluted with distilled water. Next, 0.1% (m/v) pectinase (50,000 U/g) and 0.05 (m/v) cellulase (100,000 U/g) were added to hydrolyze the red jujube fruits at 50 °C for 90 min to improve the pulp yield [13]. After removing the shell and cleaning, the bamboo shoot was mixed with fourfold distilled water before crushing. In order to improve the color of the mixture, the pretreated red jujube pulp and the bamboo shoot pulp were mixed at a ratio of 4:6, followed by grinding with a colloidal mill (Taichi, Shanghai, China) and a high-pressure homogenizer (Shenlu, Shanghai, China). The backlash of the colloidal mill was 1–2 mm. After a significant reduction in particle size, the mixture of the red jujube fruits and the bamboo shoots (R–B mixture) was further ground with a homogenizer and treated three times under 25–30 MPa. Finally, the R–B mixture was autoclave-treated at 105 °C for 15 min to obtain the mixed juice of the red jujube fruits and the bamboo shoots (R–B mixed juice) and then stored in a refrigerator (2–4 °C) until further use.

2.2. Strains Screening

The fermentation was performed in conical flasks, and the most suitable fermentation strain was selected by comparing the fermentation ability of different starter cultures to the R–B mixed juice, including mixed L. delbrueckii subsp. bulgaricus and S. thermophilus (TUST-BS for short), L. plantarum TUST-232, L. plantarum TUST-354, and L. plantarum TUST-232.
Firstly, the R–B mixed juice was fermented separately by all the starter cultures under different inoculation volumes (0.03%, 0.06%, 0.10%, 0.20%, 0.30%, and 0.40% with separate trials) (TUST-BS: the 2:1 ratio of L. delbrueckii subsp. bulgaricus and S. thermophilus) and fermentation temperatures (30 °C, 34 °C, 37 °C, and 40 °C with separate trials) for 24 h to screen the fermentation conditions of strains initially via measuring the pH values and viable cell counts. Then, according to the results of inoculation volumes and fermentation temperatures, all the starter cultures (the inoculation volume of 0.30%, about 7 log CFU/mL) were inoculated separately into the R–B mixed juice and cultured at 37 °C for 24 and 48 h, followed by comparing their growth states in the R–B mixed juice by measuring the pH values and viable cell counts. The strain which could ferment the R–B mixed juice in a shorter time to reach a lower pH value and a higher viable cell count was selected as the final starter culture. The pH values were directly determined with a pH meter, and the viable cell count was recorded as colony-forming units (CFU) per mL.

2.3. Screening of Fermentation Conditions for L. plantarum TUST-232

The fermentation conditions of L. plantarum TUST-232 were screened in terms of different inoculation volumes (0.03%, 0.06%, 0.10%, 0.20%, 0.30%, and 0.40% with separate trials at 37 °C and fermented for 14 h), fermentation temperatures (30 °C, 34 °C, 37 °C, and 40 °C with separate trials with 0.30% inoculation volume and fermented for 14 h), and fermentation time periods (10 h, 12 h, 14 h, 16 h, and 18 h with consecutive trials under different time points with 0.30% inoculation volume and fermented at 37 °C). The fermentation ability of L. plantarum TUST-232 was measured in terms of pH value and viable cell count, and the final inoculation volume, fermentation temperature, and fermentation time of the R–B mixed juice were determined by the lower pH value and the higher viable cell count [14,15]. After screening, the growth curve of L. plantarum TUST-232 was determined under the screening conditions [16] and measured in terms of pH value, total titratable acidity (TTA) value, and viable cell count. The TTA value was determined by titrating 1 mL of R–B mixed juice with 0.1 M NaOH at 22 °C.

2.4. Changes in Sugar Content

The contents of sucrose, glucose, and fructose in the R–B mixed juice before and after fermentation were analyzed as described by Baiquan et al. [17] and Pereira et al. [18] with slight modifications. The R–B mixed juice before and after fermentation was fivefold diluted with ultrapure water and centrifuged at 10,200× g for 5 min. The supernatants were separated and filtered through a syringe filter with 0.22 μm pore size and 13 mm diameter membrane Millipore® (Millipore, Billerica, MA, USA). The separation for identification of sugars were carried out by a high-performance liquid chromatograph (HPLC) using an RID-10A detector (Shimadzu, Japan) and an Agilent® Hi-Plex Ca (Duo) (300 mm × 6.5 mm) chromatographic column. The column temperature was maintained at 65 °C, and the injection volume was 10 μL. Ultrapure water was used as the mobile phase at a flow rate of 0.5 mL/min. The contents of sugars were quantified by an external standard method. Standard solutions of sucrose, glucose, and fructose (SolarBio, Beijing, China) were diluted to different concentrations (0.5, 1, 2.5, 5, and 10 mg/mL), and standard curves were obtained according to the concentration and the corresponding peak area. The peaks of sugars were determined by reference to the retention times of standard solutions, and the contents of sucrose, glucose, and fructose in the R–B mixed juice before and after fermentation were calculated by interpolation of the peak areas.

2.5. Changes in Organic Acid Content

The contents of oxalic acid, citric acid, malic acid, succinic acid, lactic acid, and adipic acid before and after fermentation were analyzed as described by Zheng et al. [19] with slight modifications. The R–B mixed juice before and after fermentation was 50-fold diluted with ultrapure water and centrifuged at 10,200× g for 5 min. The supernatants were separated and filtered through a syringe filter with a 0.22 μm pore size and 13 mm diameter membrane Millipore® (Millipore, Billerica, MA, USA). The separation for identification of organic acids was carried out by an HPLC with an LC-20A detector (Shimadzu, Japan) and Agilent® Hi-Plex H chromatographic column (300 mm × 7.7 mm), and the detector was operated at 210 nm [20]. The injection volume of the treated sample was 20 μL, and the column temperature was maintained at 65 °C. Dilute sulfuric acid solution (0.05 mol/L) was used as the mobile phase at a flow rate of 0.5 mL/min. The contents of organic acids were quantified by an external standard method. The standard solutions of oxalic acid, citric acid, malic acid, succinic acid, lactic acid, and adipic acid (SolarBio, Beijing, China) were diluted to different concentrations (12.5, 25, 50, 75, and 100 μg/mL), and the standard curves were obtained according to the concentration and the corresponding peak area. The peaks of organic acids were determined by reference to the retention times of standard solutions, and the contents of oxalic acid, citric acid, malic acid, succinic acid, lactic acid, and adipic acid in the R–B mixed juice before and after fermentation were calculated by interpolation of the peak areas.

2.6. GC–MS Analysis of Volatile Compounds

Headspace solid-phase microextraction (HS-SPME) was used to prepare the volatile compounds before and after fermentation [12]. The volatile compounds were analyzed by a QP2010 Ultra gas chromatograph–mass spectrometer (Shimadzu, Japan) with a BR-SWAX (30 m × 0.32 mm × 0.50 μm) quartz capillary column. Briefly, the R–B mixed juice before and after fermentation was poured into sample bottles and heated at 55 °C for 30 min, followed by treating the SPME fiber assembly (PDMS/DVB 65 μm) at 250 °C for 30 min in the inlet, and then the adsorption of the gas by the fiber for 30 min. Subsequently, the SPME fiber was analyzed at 250 °C for 15 min, and the volatile compounds were further analyzed for 30 min after removing the fiber. In the GC conditions, the sample was split in split mode with a 10:1 split ratio, and the carrier gas was high-purity helium at 1 mL/min, while the inlet temperature was 240 °C. The initial temperature of the column was maintained at 50 °C for 4 min and then increased to 150 °C at 4 °C/min, with each temperature point maintained for 3 min. Finally, the temperature was raised to 250 °C at 8 °C/min, with each temperature point held for 5 min. In the MS conditions, the ionization mode was EI, the electric energy was 70 eV, the heating current of the filament was 0.25 mA, the voltage of electronic multiplier was 1000 V, the temperature of the ion source was 220 °C, the transmission line temperature was 220 °C, and the scanning range was 40–500 (m/z).
The results of determination obtained were cross-referenced with the NIST 05 library, and the relative content of each volatile compound was measured by the peak area normalization method. The volatile components with the highest peak area in the top 70 and a high matching degree were selected.

2.7. Electronic Nose Analysis

The changes in the aroma profile of the R–B mixed juice before and after fermentation were detected by a portable electronic nose (PEN 3.5 Portable Electronic nose, Airsense Analytics GmbH, Schwerin, Germany) and analyzed as described by Wang et al. [21] with slight modifications. The electronic nose, an electronic system that imitates the human olfactory system and uses a gas sensor array to identify odor, inhales the aroma profile of the sample to be tested into the instrument and analyzes the composition of the gas components through 10 metal–oxide semiconductor (MOS) sensors (R1, W1C, aromatic; R2, W5S, broad-range; R3, W3C, aromatic; R4, W6S, hydrogen; R5, W5C, arom-aliph; R6, W1S, broad-methane; R7, W1W, sulfur-organic; R8, W2S, broad-alcohol; R9, W2W, sulf-chlor; R10, W3S, methane-aliph) [22]. Before the test, 10 mL of R–B mixed juice before and after fermentation was transferred separately to a 50 mL beaker and sealed with plastic wrap, followed by equilibration for 30 min at room temperature (20–25 °C). During the test, the cleaning time and detection time of the instrument were set at 120 s and 100 s, respectively. Lastly, the results were analyzed using WinmMuster version 1.6.2.18 software (Airsense Analytics GmbH, Schwerin, Germany).

2.8. Antioxidant Activity and the Contents of Total Phenolic, Total Flavonoid, and Dietary Fibers

The total antioxidant capacity was determined using the ferric reducing ability of plasma (FRAP) assay in accordance with the instructions of the T-AOC Kit (SolarBio, Beijing, China). Before the test, the R–B mixed juice before and after fermentation was centrifuged at 2500× g for 10 min to collect the supernatant for FRAP assay. The absorbance was determined at 593 nm, and the results were expressed as μmol Fe2+ equivalents/100 mL [23].
The iron ion-reducing ability was determined by the Prussian blue method using the Texting Kit (Congyi Biology, Shanghai, China) [24]. The reduction ability of iron ions was expressed by the absorbance value at 700 nm, whereby a larger absorbance value denoted a stronger reduction ability of the R–B mixed juice to iron ions. The supernatant was ninefold diluted with ultrapure water for Prussian blue analysis, and the antioxidant Trolox (0.04 mM) was used as a positive control.
The hydroxyl radical-scavenging activity was determined using the Micro Hydroxyl Free-Radical Scavenging Capacity Assay Kit (SolarBio, Beijing, China). The inhibition degree of the 536 nm absorbance decline rate (%) of the R–B mixed juice was used to reflect its ability to scavenge hydroxyl radicals [25]. Ascorbic acid (0.075 mg/mL) was used as a positive control.
The superoxide anion-scavenging ability was determined using the Inhibition and Produce Superoxide Anion Assay Kit (Jiancheng Bioengineering Institute, Nanjing, China). The scavenging ability was expressed by the absorbance value at 550 nm, whereby a lower absorbance value denoted a stronger scavenging ability of the R–B mixed juice to superoxide anion. The superoxide anion scavenging ability of the R–B mixed juice was calculated with ascorbic acid as the standard (U/100 mL).
To determine total phenolic content, the R–B mixed juice before and after fermentation was ninefold diluted with ultrapure water, followed by placing 2 mL of the diluent and 1 mL of Folin–phenol solution in a volumetric flask. After incubation for 6 min, the mixture was supplemented with 1 mL of 20% sodium carbonate solution and incubated at 30 °C for 1 h. The absorbance was determined at 760 nm using a UV/visible spectrophotometer, with distilled water as the blank control. Finally, the total phenolic content was calculated on the basis of a gallic acid calibration curve (R2 = 0.9996) [26,27,28].
To determine total flavonoid content, the R–B mixed juice before and after fermentation (1 mL) was supplemented with 0.5 mL of sodium nitrite solution (5 g/100 mL) in a volumetric flask, followed by incubation for 6 min and the addition of 0.5 mL of aluminum nitrate solution (10 g/100 mL). After incubation for 6 min, the mixture was supplemented with 4 mL of sodium hydroxide solution (4 g/100 mL) and then thoroughly mixed for 1 min. The absorbance was determined at 510 nm using a UV/visible spectrophotometer, with distilled water as the blank control. The total flavonoid content was calculated on the basis of a rutin calibration curve (R2 = 0.9989) [29].
The contents of total, insoluble, and soluble dietary fibers in the R–B mixed juice before and after fermentation were determined by the AOAC methods [30].

2.9. Color Measurement

The changes in color of the R–B mixed juice before and after fermentation were detected by a chromatometer (CM-5; MINOLTA, Japan) [31,32]. According to the definition, the color of the sample is defined by three-coordinate space values: the L* (lightness) value, a* (red/green component) value, and b* (yellow/blue component) value. The changes in the sample color before and after fermentation were analyzed by the following equation:
ΔE*ab = [(L* − L0*)2 + (a* − a0*)2 + (b* − b0*)2]1⁄2,
where ΔE*ab indicates the change in color, L0* and L* indicate the lightness value before and after fermentation, respectively, a0* and a* indicate the red/green component value before and after fermentation, respectively, and b0* and b* indicate the yellow/blue component value before and after fermentation, respectively.

2.10. Statistical Analyses

All the experiments were repeated three times. The values of pH, TTA, and viable cell counts were treated by one-way analysis of variance (ANOVA). The values of sugar content, organic acid content, volatile compound content, total phenolic content, total flavonoid content, antioxidant activity, and dietary fiber content were treated by a two-tailed paired Student’s t-test. The significant difference for each comparison was determined at p < 0.05. Data were expressed as the mean ± standard deviation (SD).

3. Results

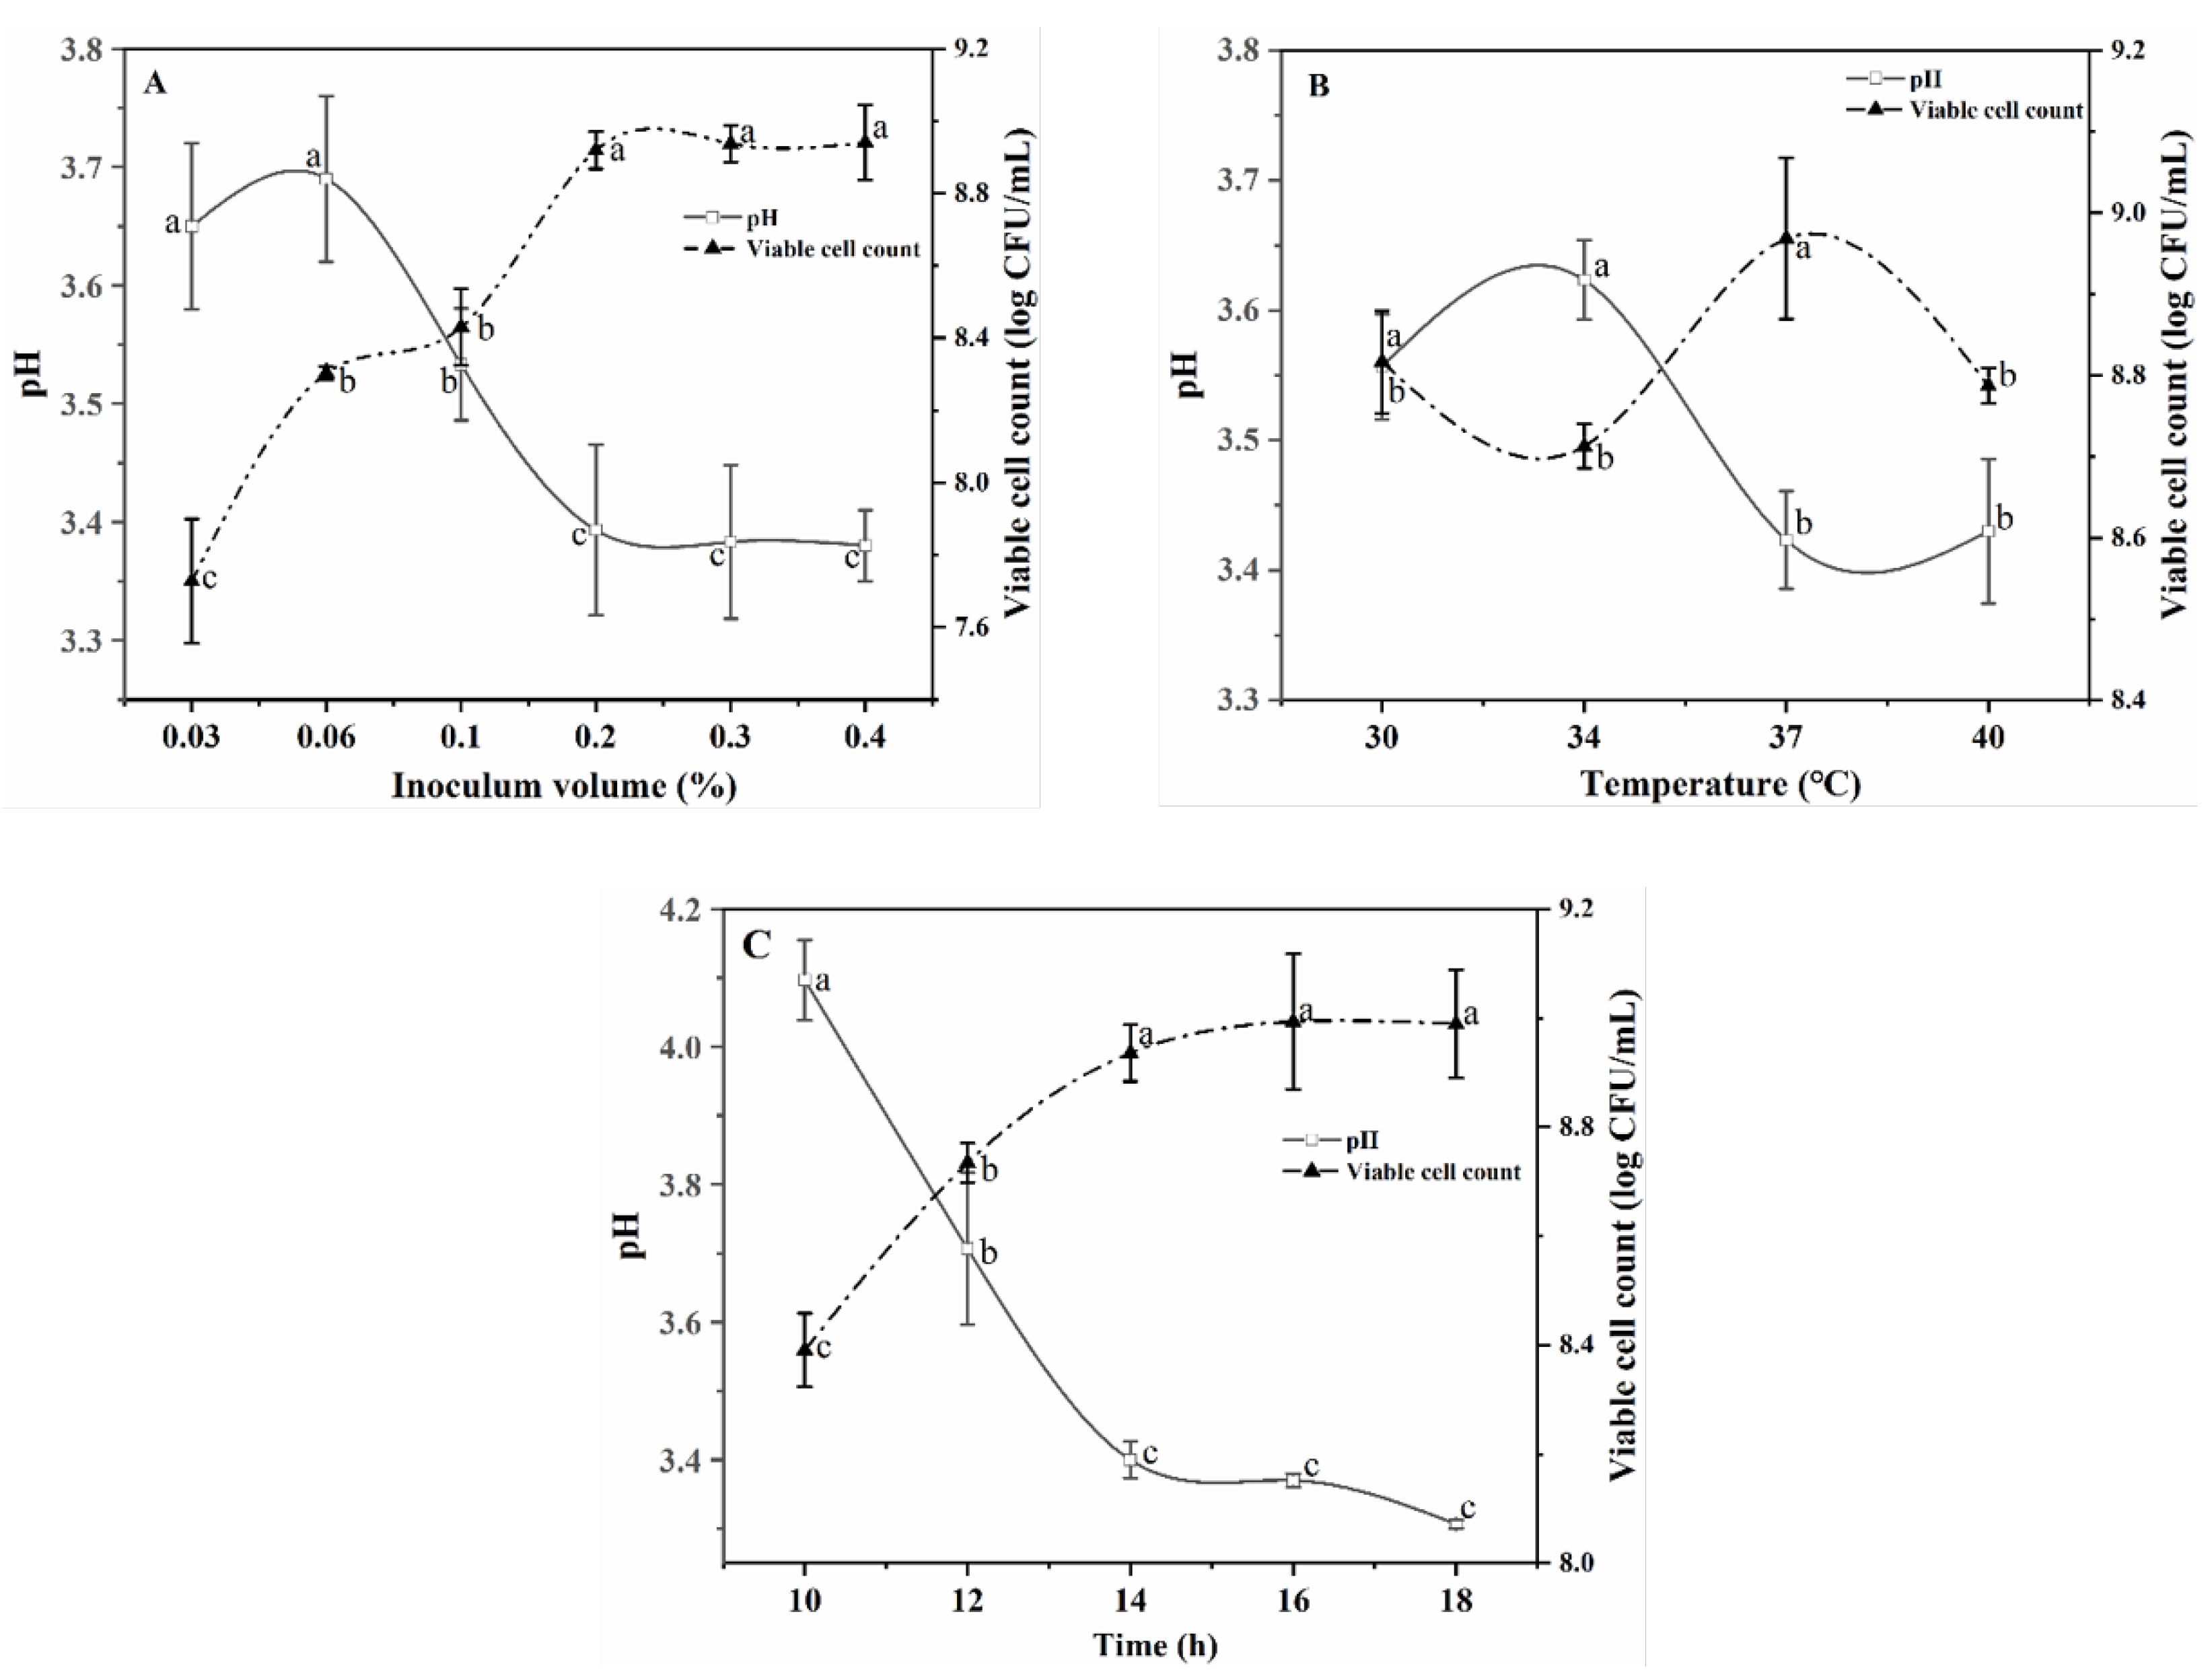
3.1. Selection of Starter Culture and Fermentation Conditions

3.1.1. Selection of Starter Culture

A comparison of the fermentation ability to the R–B mixed juice was made for different LAB strains, including mixed L. delbrueckii subsp. bulgaricus and S. thermophilus (TUST-BS for short), L. plantarum TUST-232, L. plantarum TUST-354, and L. plantarum TUST-232. Due to their symbiotic relationship in the exchange of metabolites, L. delbrueckii subsp. bulgaricus and S. thermophilus were mixed before fermentation [33]. A comparison of the pH values and the viable cell counts in the R–B mixed juice revealed the L. plantarum TUST-232 strain as the most suitable strain for fermentation (Table 1), with the viable cell count reaching 8.91 log CFU/mL after fermentation for 24 h, which was significantly higher (p < 0.05) than that of the other strains, in contrast to the lowest value of 3.10 log CFU/mL in the R–B mixed juice fermented by L. plantarum TUST-392 under the same conditions. The pH value decreased to 3.43 in the R–B mixed juice fermented by L. plantarum TUST-232, which was significantly lower than that fermented by the other strains. After 48 h of fermentation, the viable cell count reached 7.83 log CFU/mL in the TUST-BS fermented R–B mixed juice, and the pH values of all trial groups decreased to less than 3.80. However, L. plantarum TUST-232 was still higher (p < 0.05) than the other strains in the viable cell count in the R–B mixed juices, and, compared with L. plantarum TUST-232, the other strains had a more extended lag phase and required a longer time to enter the log phase. Therefore, L. plantarum TUST-232 was determined as the final starter culture for further experiments.

3.1.2. Selection of Fermentation Conditions

Under different inoculation volumes of L. plantarum TUST-232, the R–B mixed juices varied in their pH values and viable cell counts (Figure 1A). At an inoculation volume less than 0.2%, the organic acids produced by L. plantarum TUST-232 were positively correlated with the inoculation volume, in contrast to no significant difference among indicators related to fermentation performance at an inoculation volume above 0.2%. Under the three inoculation volumes (0.2%, 0.3%, and 0.4%), L. plantarum TUST-232 in the R–B mixed juices all entered the stationary phase within 14 h. A higher inoculation volume can avoid the contamination of the R–B mixed juice caused by pathogenic microorganisms in the environment in the early stage of fermentation, while it can also produce more volatile compounds during the fermentation [34]. Therefore, the inoculation volume was selected as 0.3% for further experiments. The pH values and viable cell counts under different fermentation temperatures were compared to determine the fermentation temperature. When fermented at 37 °C, the R–B mixed juice showed the lowest pH value and highest viable cell count of 3.42 and 8.91 log CFU/mL, respectively (Figure 1B), in contrast to a higher pH value and lower viable cell count at a temperature lower or higher than 37 °C. Therefore, 37 °C was determined as the final fermentation temperature for further experiments.
In Figure 1C, the pH values of the fermented R–B mixed juice were shown to decrease gradually with the prolongation of fermentation time. After 14 h, the pH values began to decline slowly, and the growth of L. plantarum TUST-232 began to slow down, entering the stationary phase. Therefore, 14 h was defined as the final fermentation time.

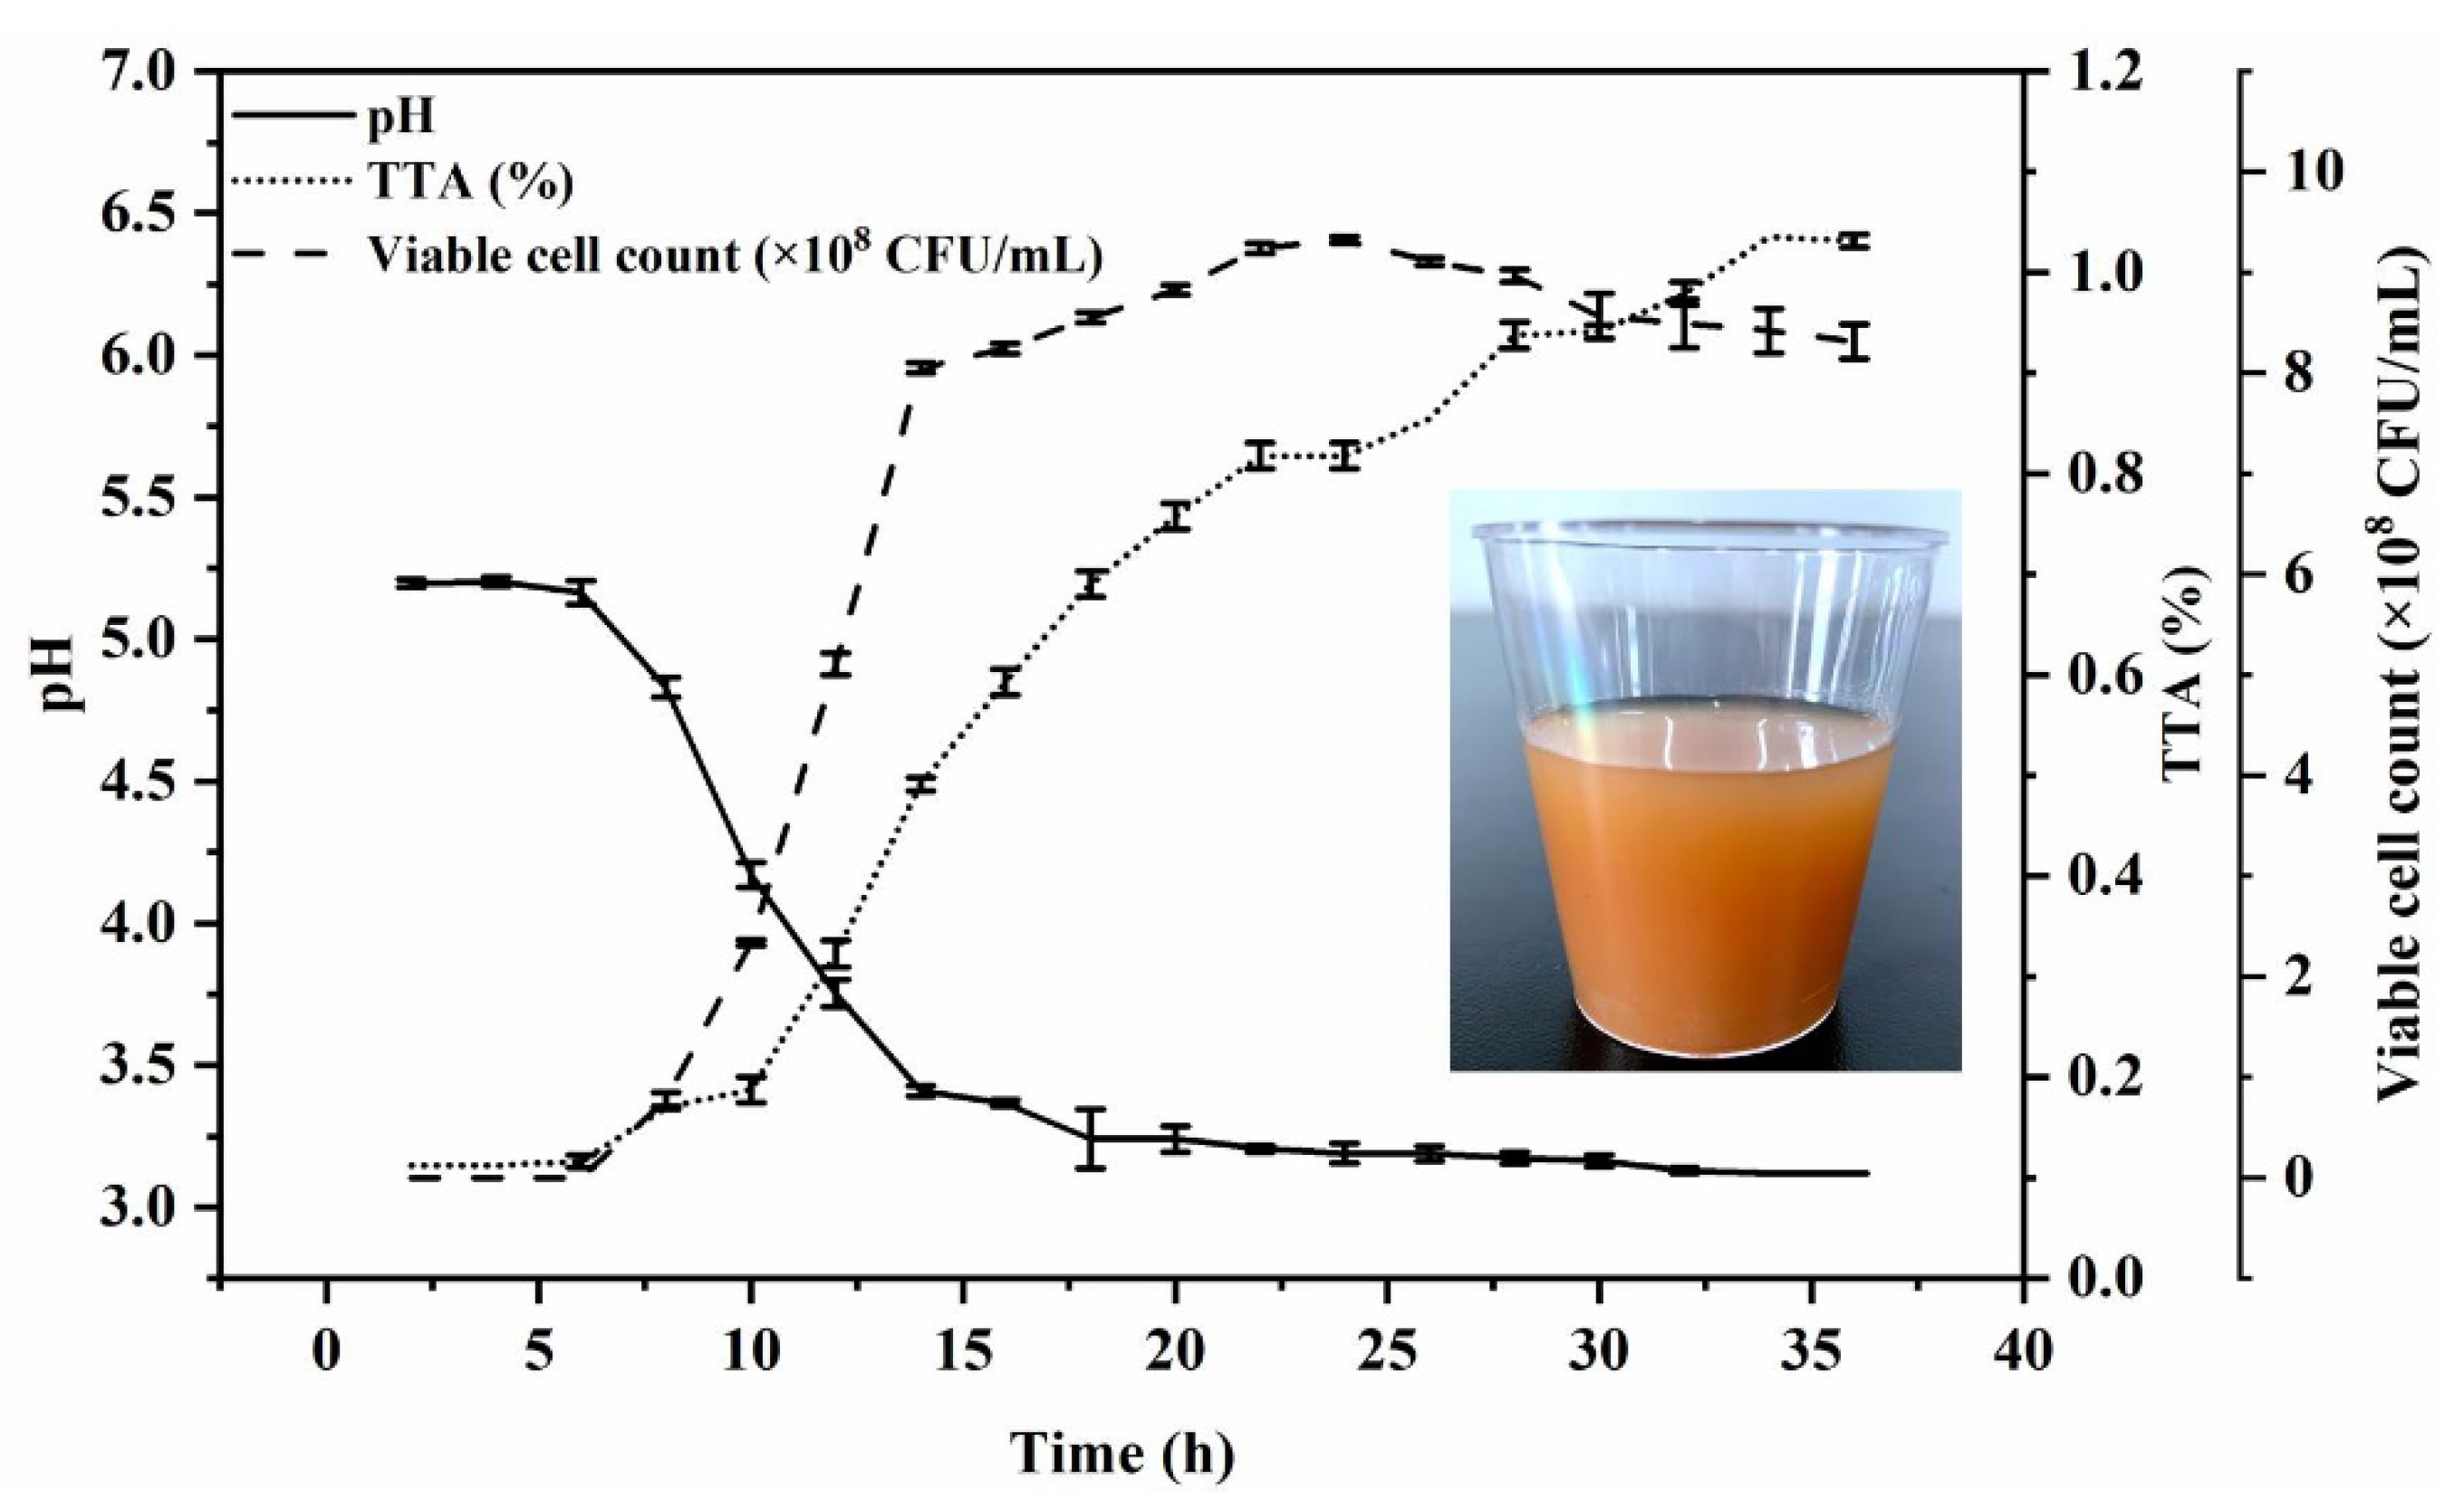
3.1.3. Growth Curve of L. plantarum TUST-232

To determine the growth trend of the strain with a longer fermentation time, Figure 2 shows the growth curve and the change trend of pH values and TTA values from 0–36 h under the selected conditions of 0.3% inoculation volume and fermentation at 37 °C. L. plantarum TUST-232 entered the logarithmic growth phase at 6 h, and viable cell counts increased exponentially between 6 and 14 h, followed by a plateau and then a slow down after 24 h.
Meanwhile, the pH values in the R–B mixed juice decreased from 5.2 to 3.1 from 0 to 36 h, with an obvious drop from 6 to 14 h, followed by a slow decrease.
Furthermore, due to the continuous growth of L. plantarum TUST-232, the TTA value showed a rapid increase from 6 h onward, reaching 0.49% at 14 h of fermentation. At the time beyond 14 h, the TTA value maintained a steady increase. Accordingly, we developed the fermented beverage of red jujube fruits and bamboo shoots under the selected conditions (Figure 2).

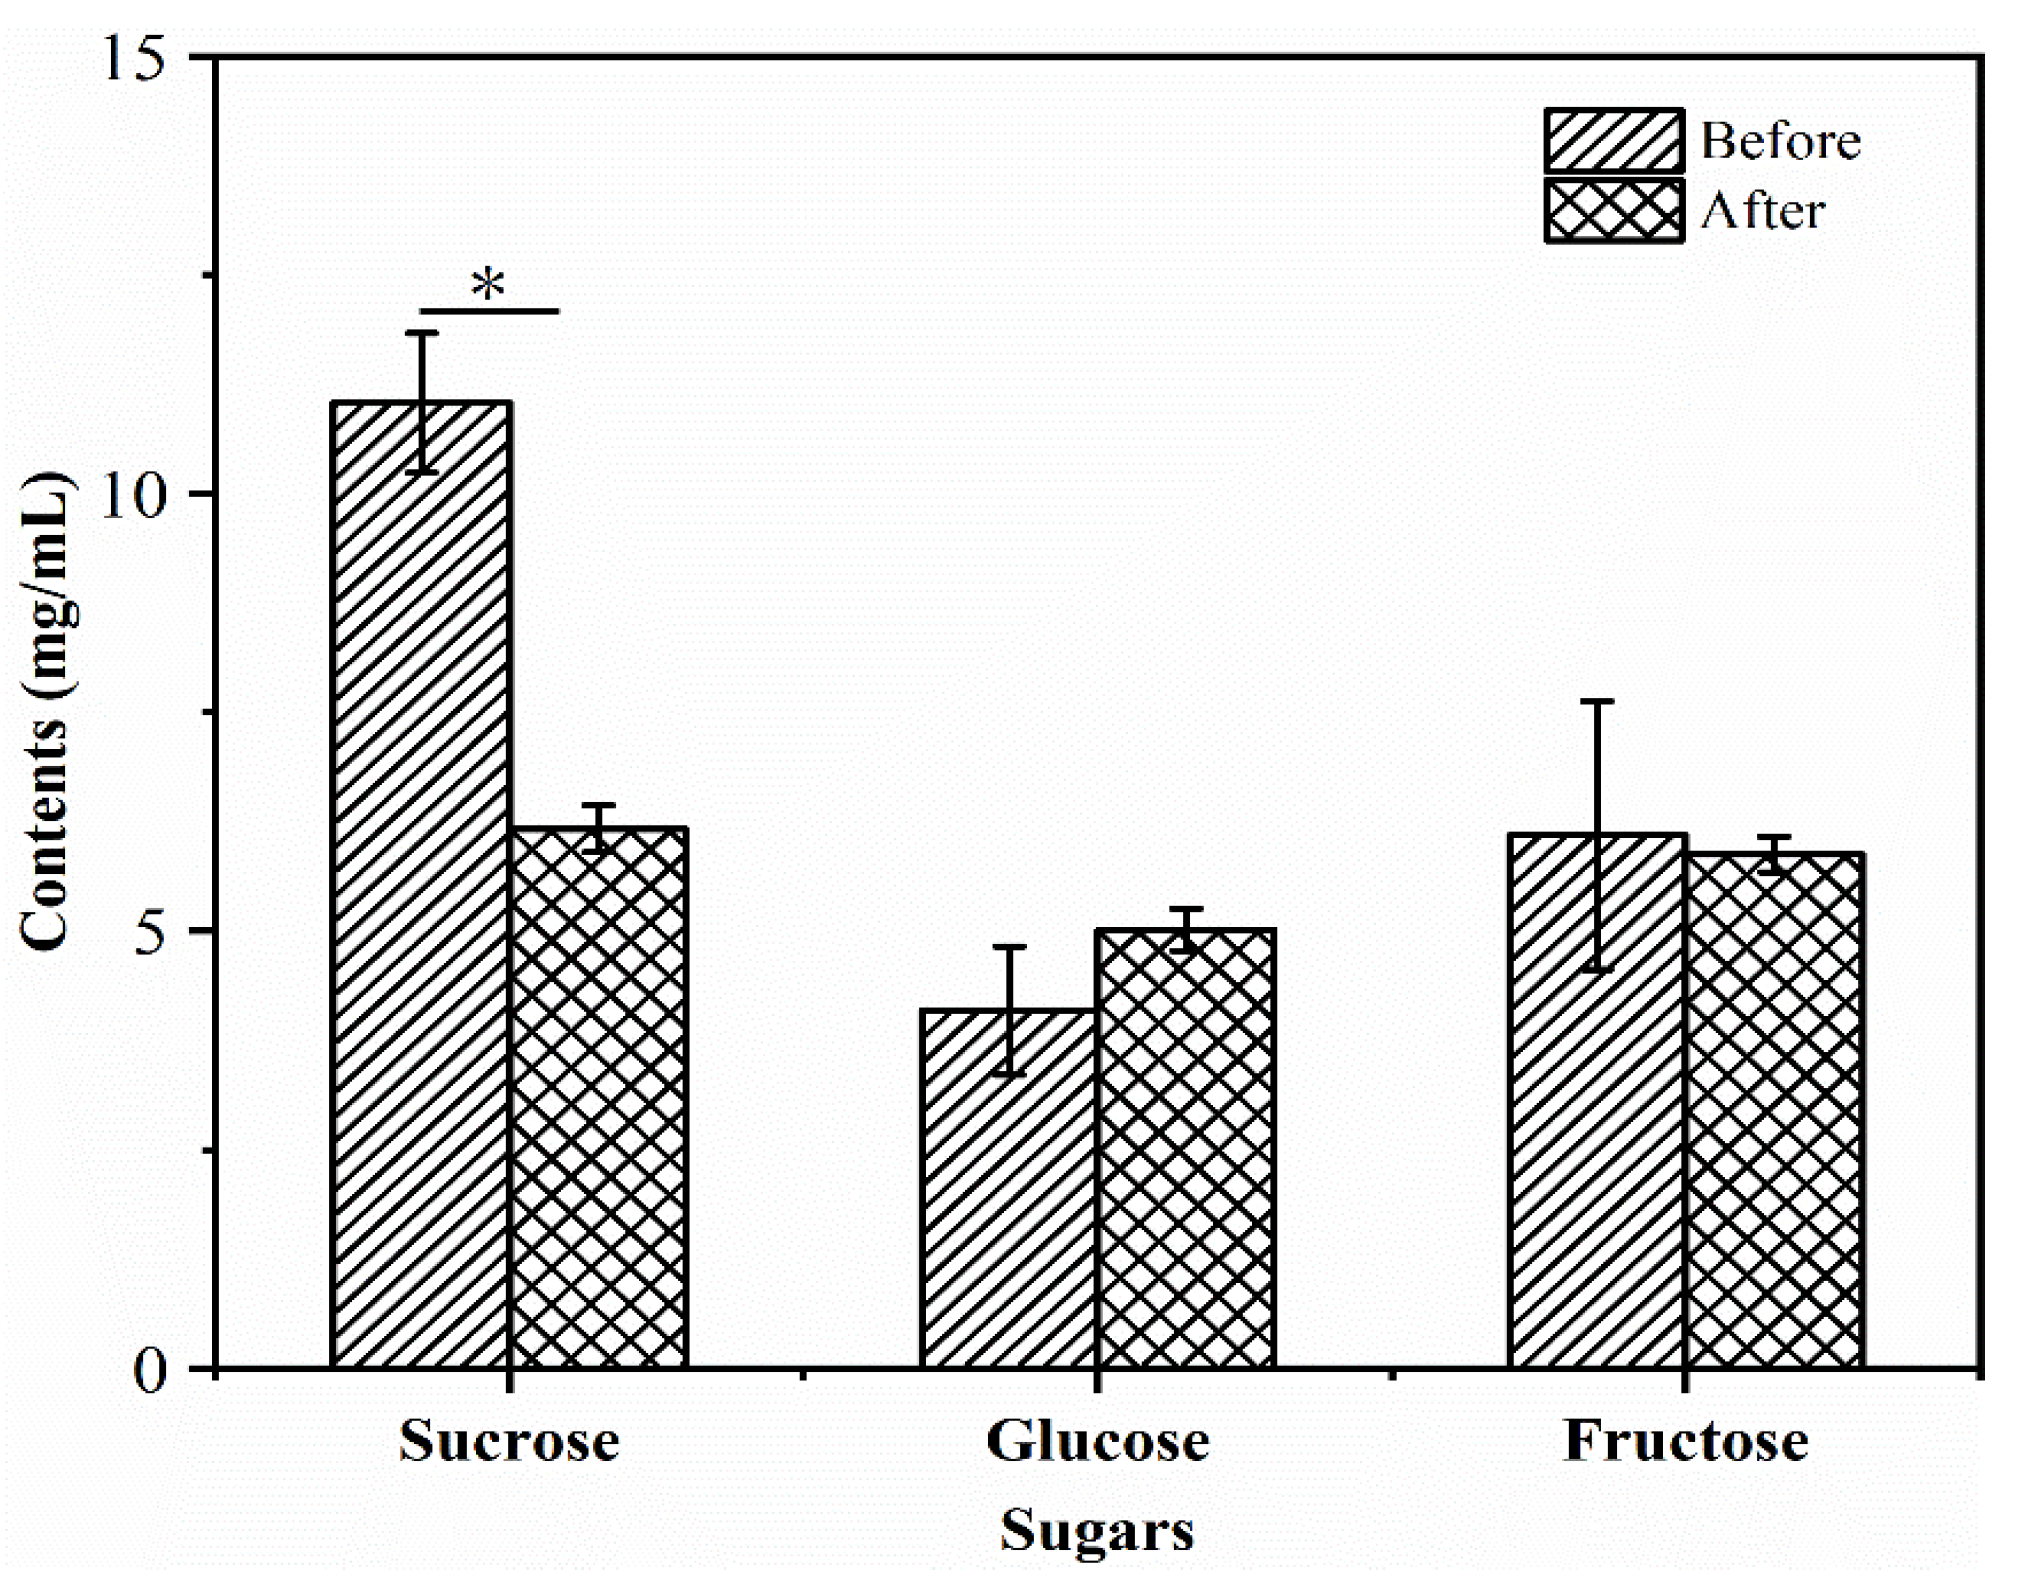
3.2. Changes in Sugar Content

During fermentation, the contents of sugars in the R–B mixed juice could meet the growth requirement of L. plantarum TUST-232. The changes in glucose, fructose, and sucrose content in the R–B mixed juice are shown in Figure 3, and the R2 values of the calibration curves were 0.9987, 0.9995, and 0.9996, respectively. Among the three sugars, sucrose was most abundant in the R–B mixed juice before and after fermentation, with the highest consumption rate of 44.10% during fermentation (p < 0.05). After fermentation, the contents of fructose and glucose exhibited no significant change in the R–B mixed juice.

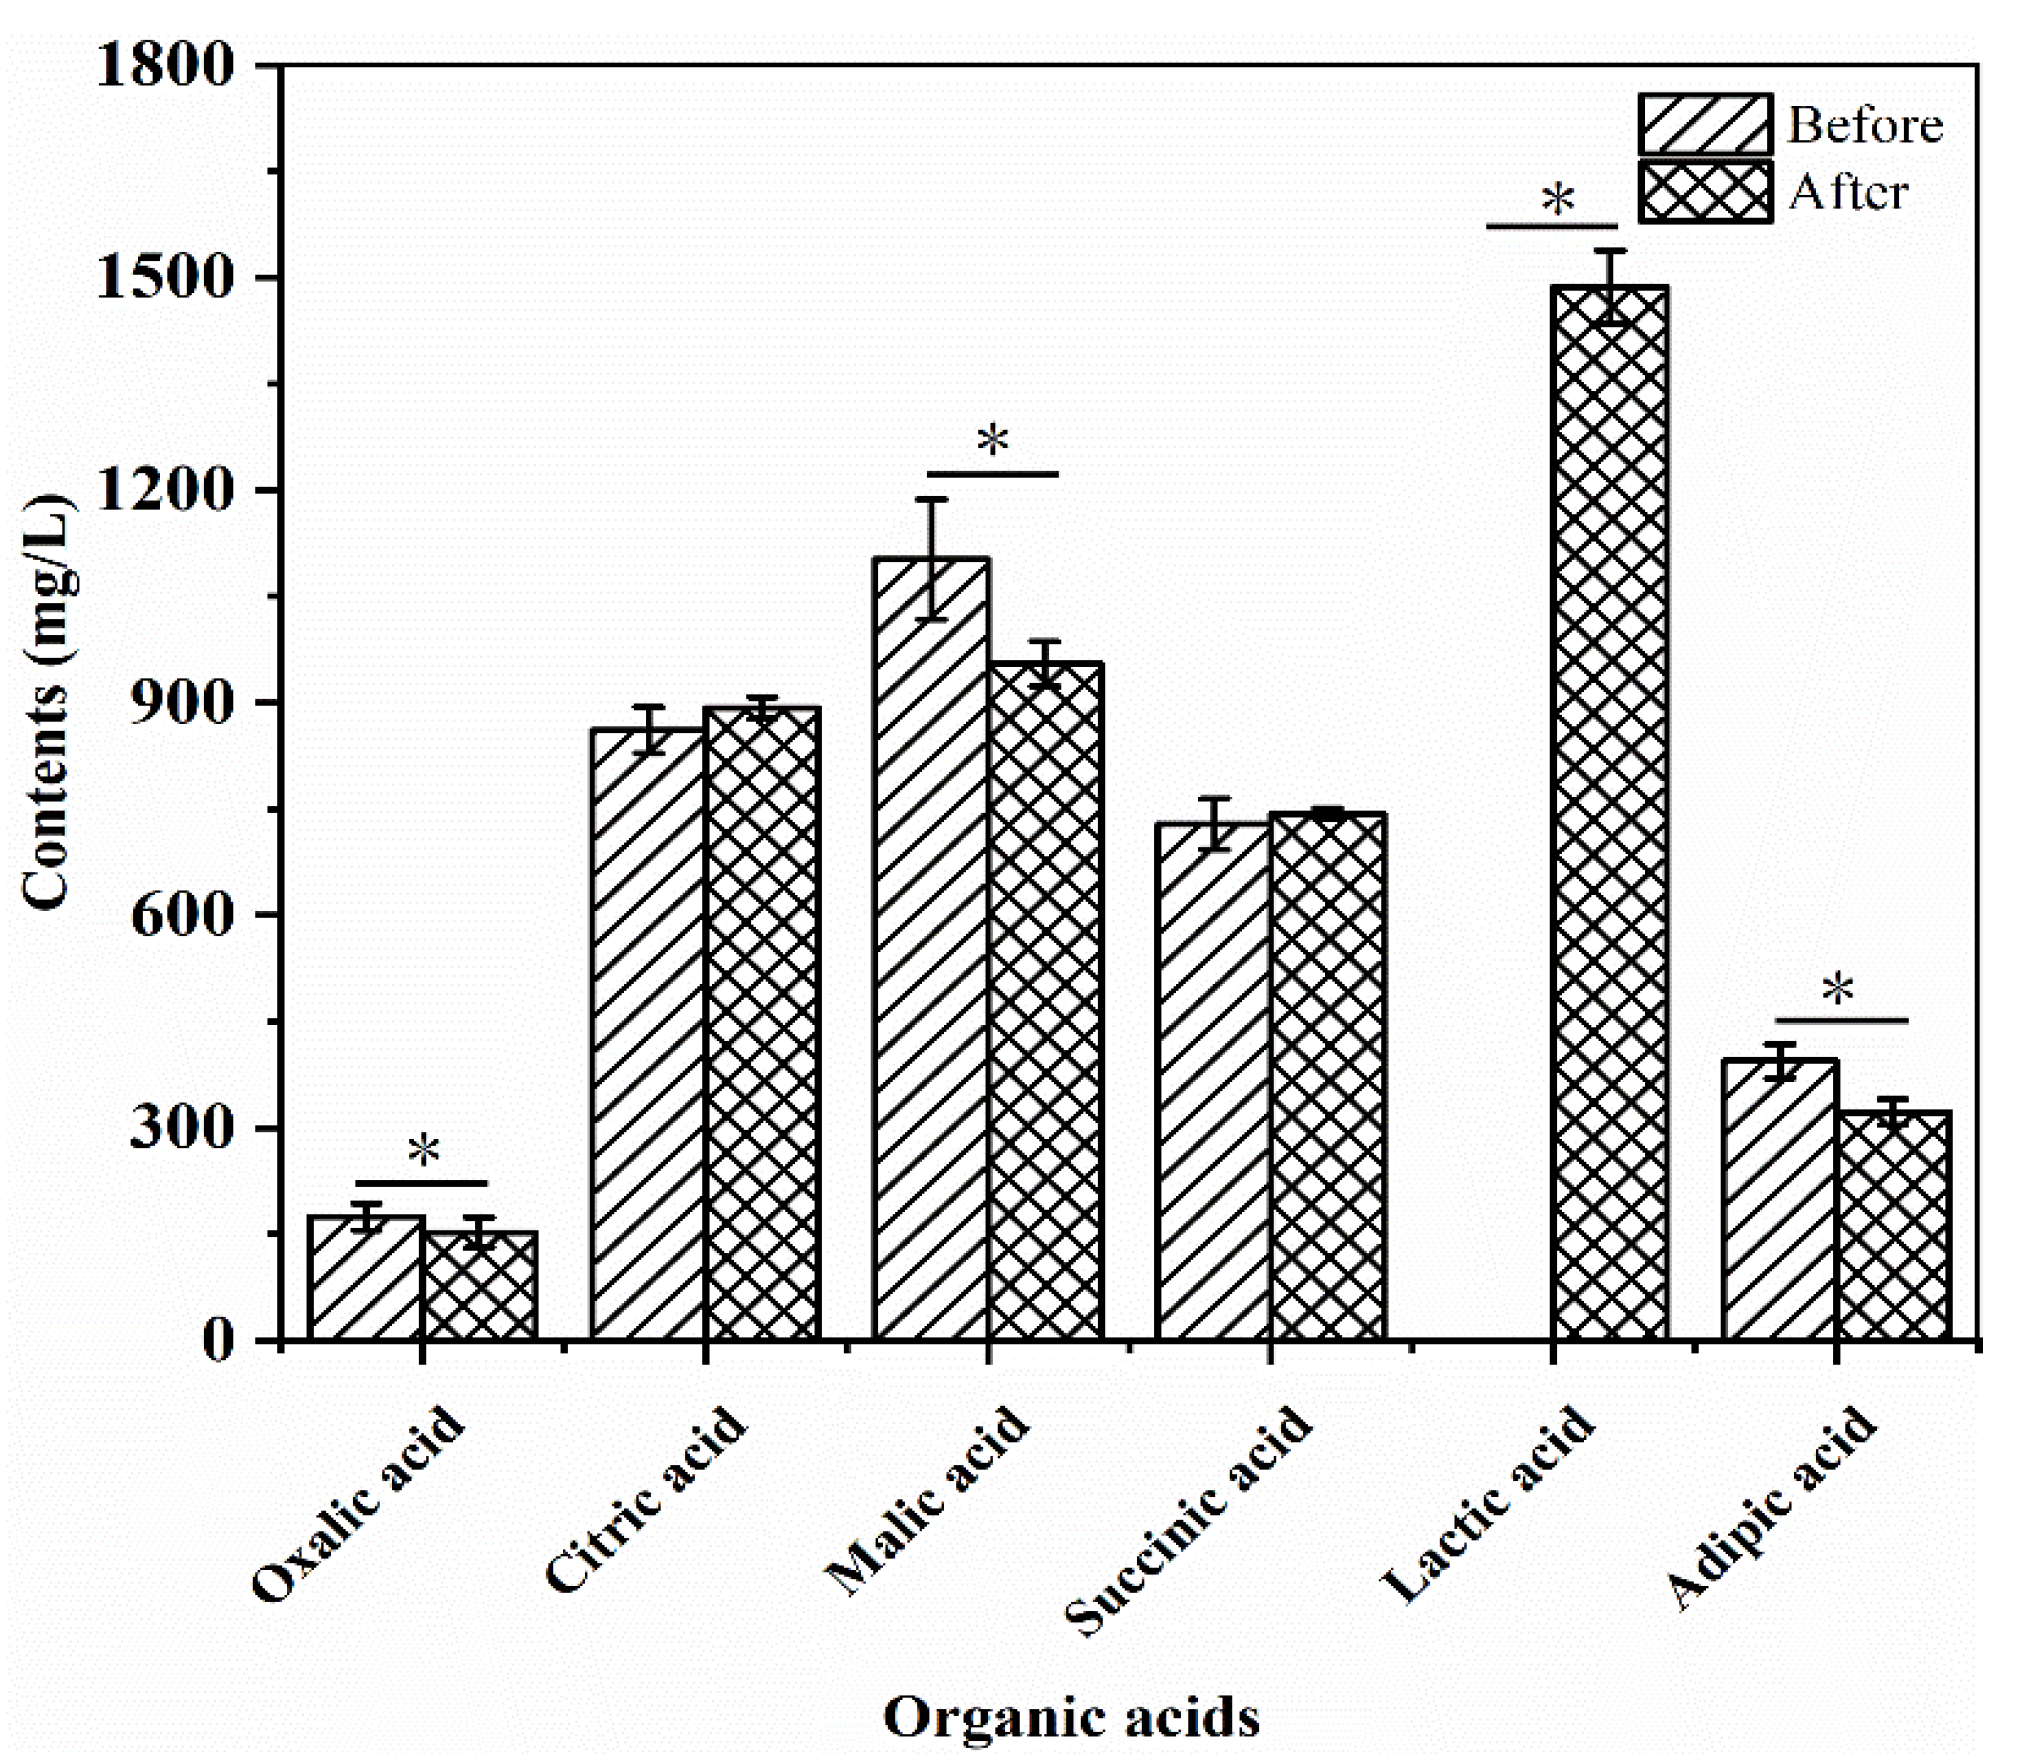
3.3. Changes in Organic Acid Content

The changes in the contents of oxalic acid, citric acid, malic acid, succinic acid, lactic acid, and adipic acid in the R–B mixed juice before and after fermentation with L. plantarum TUST-232 are shown in Figure 4, and the R2 values of the calibration curves were 0.9997, 0.9972, 0.9999, 0.9999, 0.9999, and 0.9997, respectively. Before fermentation, the content of malic acid was significantly higher (p < 0.05) than that of other organic acids in the R–B mixed juice. Despite a decrease of 13.41% after fermentation, the malic acid content was still second only to lactic acid. Meanwhile, the contents of oxalic acid and adipic acid showed decreases of 12.61% and 18.25% after fermentation (p < 0.05), respectively, despite their lowest content in the R–B mixed juice. Furthermore, the contents of citric acid and succinic acid had no significant change after fermentation, and lactic acid was not detectable before fermentation, but its content reached 1.49 g/L after fermentation, which was the highest in all the measured organic acids.

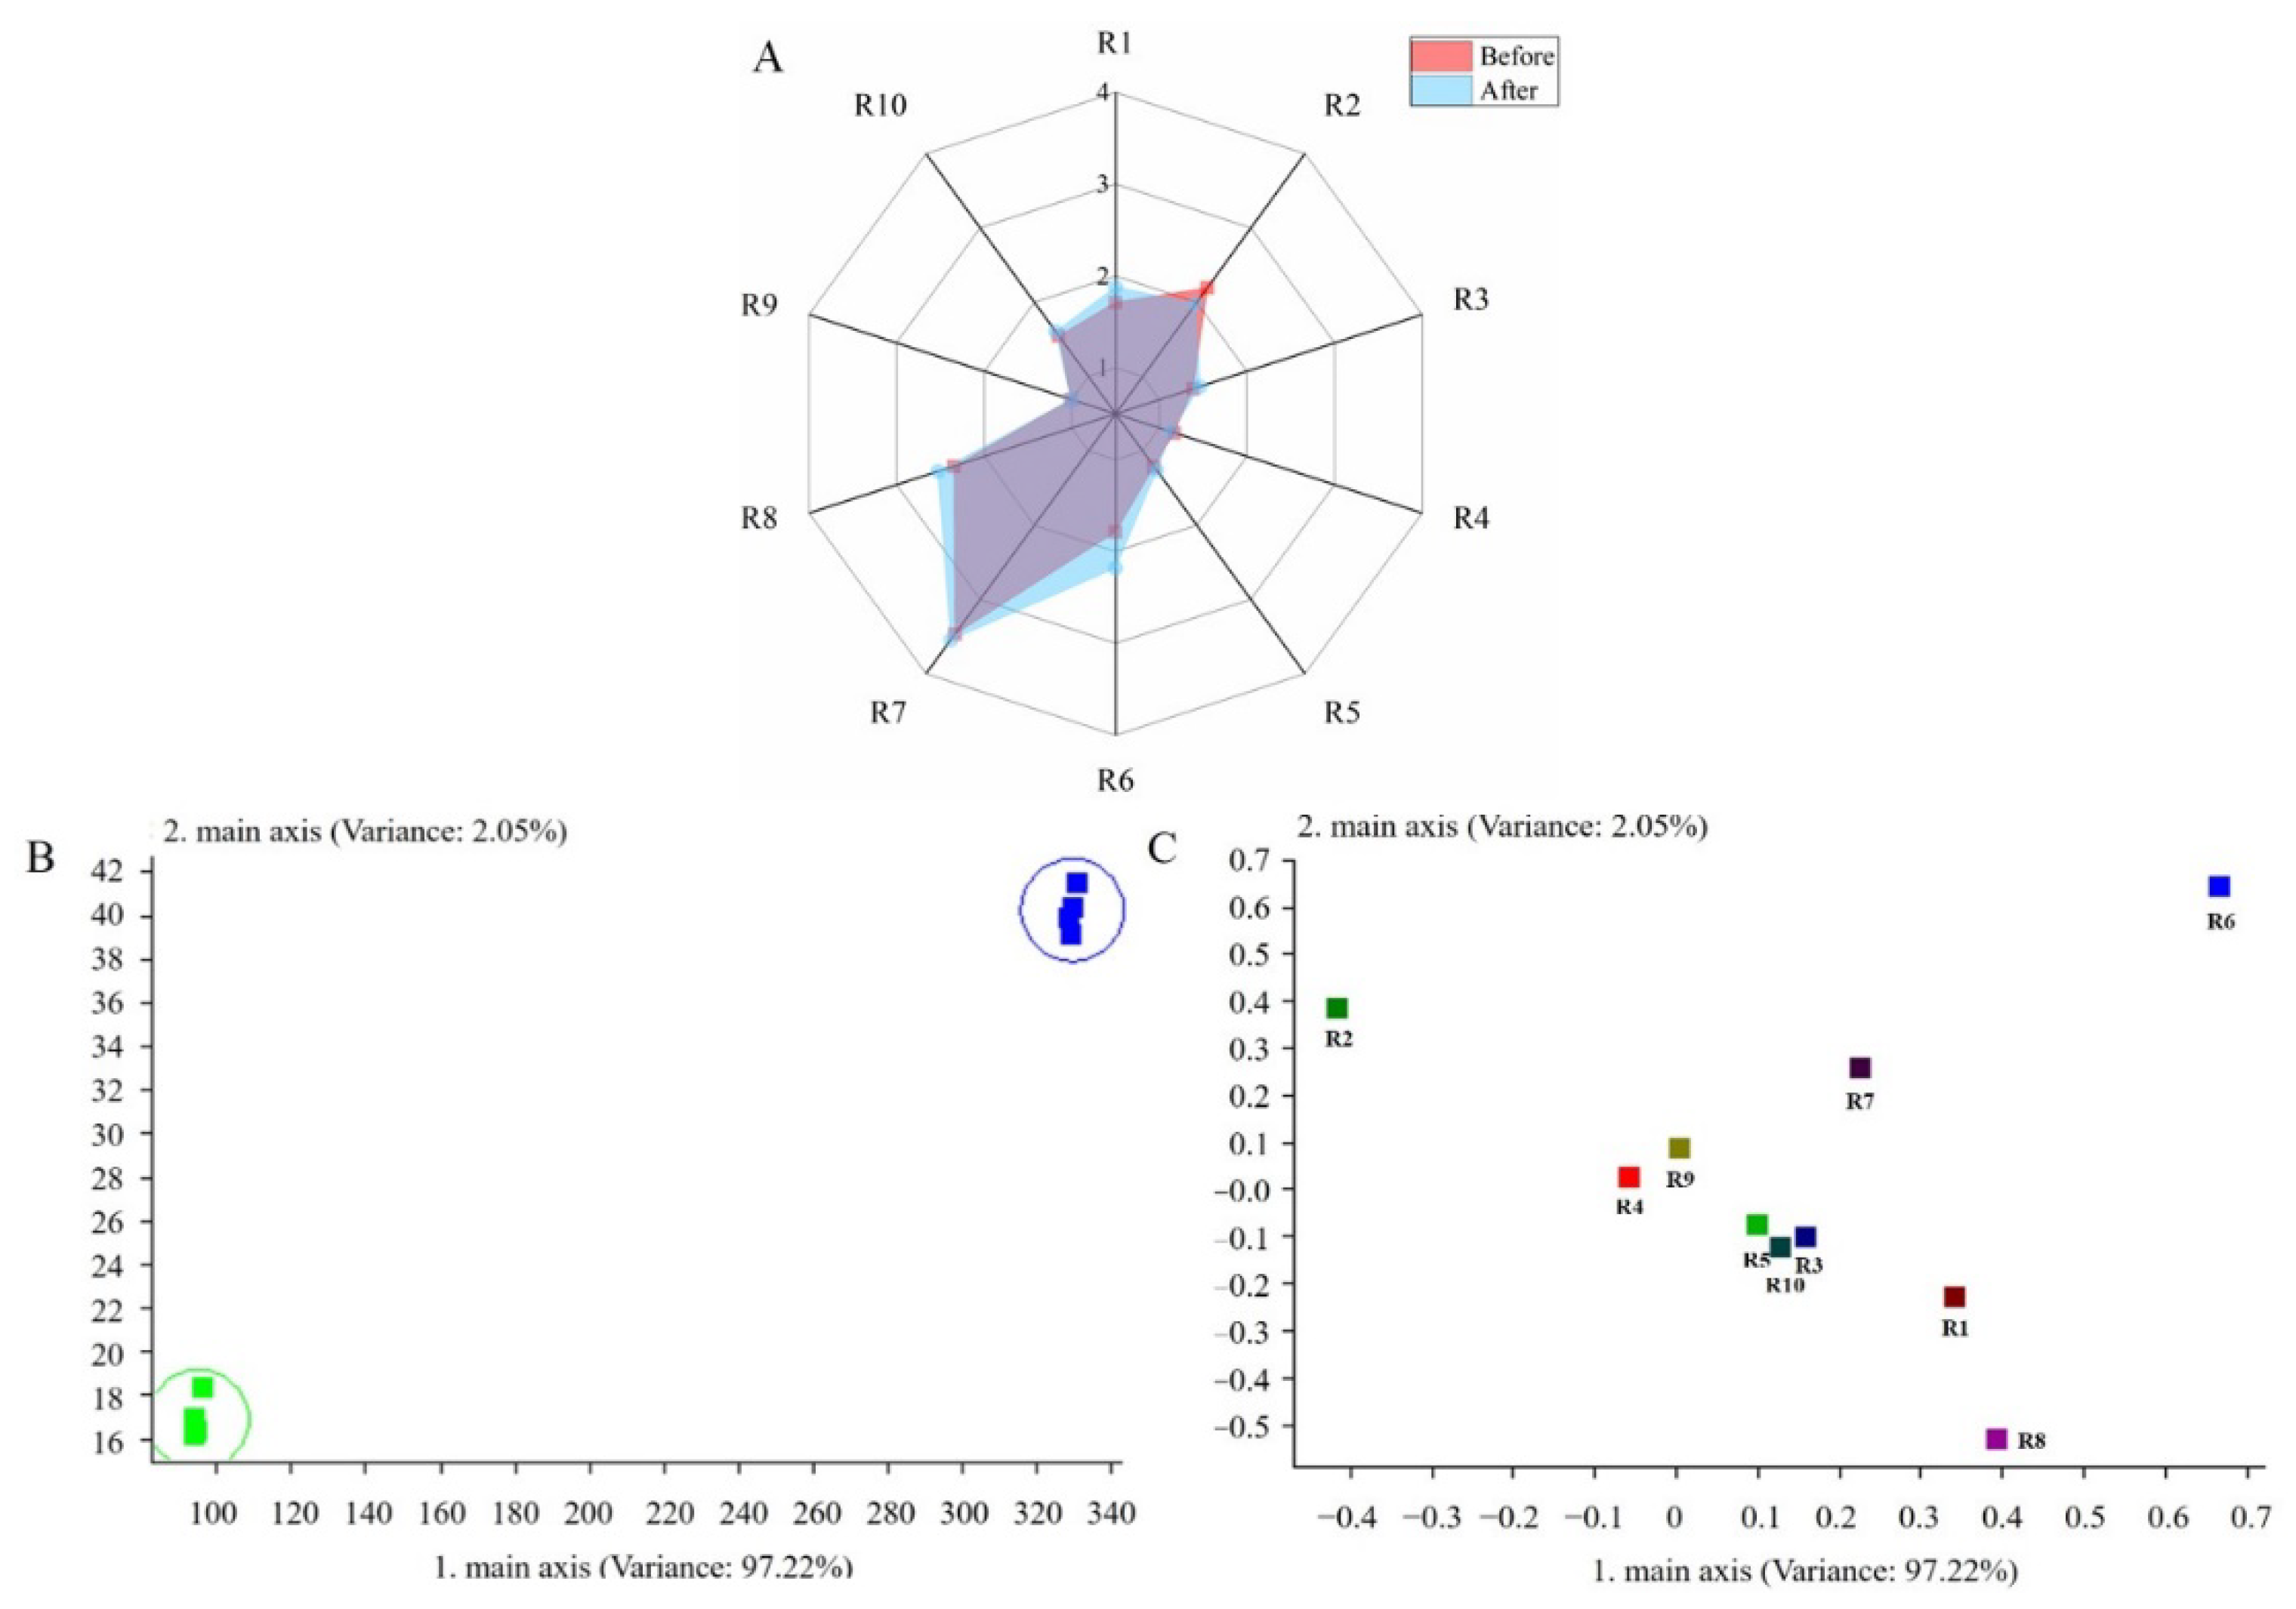
3.4. Changes in Volatile Compounds

Table 2 shows the changes of volatile compounds in the R–B mixed juice before and after fermentation with L. plantarum TUST-232. Totals of 53 and 61 volatile compounds in the R–B mixed juice were detected before and after fermentation, respectively, including 16 aldehydes, two olefins, 10 ketones, eight alcohols, three esters, 11 acids, and three other volatile compounds before fermentation, as well as 16 aldehydes, four olefins, eight ketones, 13 alcohols, six esters, 11 acids, and three other volatile compounds after fermentation. After fermentation, the R–B mixed juice showed a significant increase (p < 0.05) in the relative contents of some ketones, alcohols, and acids, such as 3-hydroxy-4-hexanone, 1-octen-3-one, heptanoic acid, nonyl alcohol, and myristic acid, in contrast to a significant decrease (p < 0.05) in the relative contents of some aldehydes, such as (2Z)-2-heptenal and heptanal. Furthermore, 16 flavor substances disappeared, and 24 flavor substances were newly produced.

3.5. Changes in Aroma Profile

The changes in the aroma profile of the R–B mixed juice before and after fermentation with L. plantarum TUST-232 are shown in Figure 5. The response values of the 10 sensors are reflected on a radar plot to show the changes in the aroma profile of the R–B mixed juice before and after fermentation (Figure 5A). The sensor response values of R1, R6, and R8 increased after fermentation, indicating that more aromatic compounds and alcohols were formed in the R–B mixed juice fermented by L. plantarum TUST-232. The decrease in R2 sensor response value indicated that nitrogen oxide was reduced after fermentation. Principal component analysis (PCA) revealed that the first two principal components (PC1, 97.22%; PC2, 2.05%) accounted for 99.27% of the total variance (Figure 5B,C). In Figure 5B, the aroma profile of the R–B mixed juice before and after fermentation was seen to be clearly distributed along PC1 and PC2, indicating an obvious difference in the aroma profile before and after fermentation. Figure 5C shows the PCA results regarding the contribution of the sensors to aroma profile identification in the R–B mixed juice before and after fermentation. The R–B mixed juice had a higher methane content before fermentation, making the S6 sensor more capable of identifying the odor before fermentation.

3.6. Changes of Antioxidant Activity and the Contents of Total Phenolic, Total Flavonoid, and Dietary Fibers

Compared with the unfermented R–B mixed juice, the fermented R–B mixed juice showed a significant improvement in total antioxidant capacity, iron ion-reducing ability, hydroxyl radical-scavenging activity, and superoxide anion-scavenging ability (Table 3). Specifically, after fermentation, the total antioxidant capacity increased by 12.30% and reached 94.743 μmol Fe2+ equivalents/100 mL; the absorbance of iron ion-reducing ability reached 0.315 versus the absorbance value of 0.297 for Trolox (0.04 mM); the hydroxyl radical-scavenging activity increased from 4.045% to 9.833% versus the scavenging activity of 16.667% for 0.075 mg/mL ascorbic acid; the superoxide anion-scavenging ability showed an increase of 59.80% and reached 7.629 U/100 mL.
Additionally, the R–B mixed juice fermented with L. plantarum TUST-232 showed a significant increase of 11.09% in total phenolic content and reached 32.918 mg/L after fermentation (Table 3), in contrast to no significant change in total flavonoid content.
Meanwhile, despite no significant changes in the contents of dietary fibers (Table 3), the R–B mixed juice fermented with L. plantarum TUST-232 still showed a higher content of soluble dietary fiber than beverages such as beers. The contents of total, insoluble and soluble dietary fiber reached 0.570 g/100 g, 0.492 g/100 g, and 0.078 g/100 g, respectively.

3.7. Changes in Color

The changes in the color of the R–B mixed juice before and after fermentation were analyzed by L* value, a* value, and b* value, and the results are shown in Table 4. After fermentation, the R–B mixed juice showed a decrease in brightness, as well as in red and yellow tones, but an increase in green and blue tones. During fermentation, nutrients were transformed to other related substances by L. plantarum, leading to changes in the color of the R–B mixed juice. The value of color ΔE*ab was less than 1, indicating no significant change in the color between the fermented and unfermented R–B mixed juices, which was almost impossible to distinguish by the naked eye.

4. Discussion

In China, the yields of red jujube fruits and bamboo shoots are very high. Red jujube fruits are usually dried to extend their shelf life, but the extremely low moisture content greatly affects the taste of the dried red jujube fruits. Meanwhile, bamboo shoots are usually canned due to their short shelf life. These limitations greatly affect their off-season consumption and full utilization of nutritional values. In recent years, plant-based beverages, as an alternative to acid dairy products, have become more popular, and they provide an option for making full use of the nutrients of red jujube fruits and bamboo shoots in all seasons, suggesting the great potential of these two materials with a short shelf life for beverage development.
Red jujube is an excellent raw material for improving the flavor and antioxidant activity of the beverage, and bamboo shoot is rich in dietary fibers, thus being beneficial to the human intestines. Feng et al. [35] studied the effects of red jujube pulps on the quality characteristics and antioxidant activity of goat milk yogurt, and they found that adding red jujube pulps could significantly reduce the flavor, improve the sensory acceptance, and increase the antioxidant activity of yogurts. Nongdam and Tikendra [36] introduced the rich nutrients of bamboo shoot and considered it as a portion of health food. Eating foods high in dietary fibers can reduce harmful cholesterol in the blood, maintain digestive health, and improve constipation. The beverage prepared by combining the nutritional values of the two raw materials and the fermentation of L. plantarum will have potential market value.
Fermentation may be an effective method for inhibiting the growth of potentially pathogenic bacteria in foods, which can improve the safety of products. Canaviri, Jannat, and Håkansson [37] developed a quinoa fermented beverage using L. plantarum DSM 9843 and quinoa, with a significant decrease in the pH value of the beverage and an obvious increase in the content of lactic acid after 48 h of fermentation. In the present study, it was shown that L. plantarum TUST-232 can not only use the nutrients in the beverage for rapid growth, but also produce a large amount of lactic acid. Meanwhile, the final pH value of the beverage was also lower than 4, which is one of the crucial characteristics for the safety of a beverage [38]. When the pH value is lower than 4, the growth of pathogenic bacteria can be inhibited in the beverage, thereby extending shelf life and improving safety [39]. Although the lower pH value is beneficial to improve the shelf life of the beverage, it is necessary to adjust the sour taste in the beverage by adding sugars such as xylitol in the future, so that it can be accepted by more consumers.
Due to hydrolysis of glycan and oligosaccharide by enzymes secreted by L. plantarum, only sucrose, glucose, and fructose were selected for determination in the R–B mixed juice before and after fermentation in this study [40]. The viable cell count of the beverage fermented by L. plantarum TUST-232 could reach 8.91 log CFU/mL at 14 h, related to the high contents of natural sugars and in the R–B mixed juice. After fermentation, the apparent decrease in sucrose content can be attributed to the fact that sucrose was consumed by sucrose phosphorylase and acid hydrolysis produced by L. plantarum TUST-232, consistent with the observation of Lu, Putra, and Liu [41] in the fermentation of durian with LAB strains. LAB strains vary in their ability to consume sucrose, leading to changes in the content of sucrose before and after fermentation, thus affecting the fermentation of the strain and the viable cell count in the beverage. Glucose and fructose can be utilized as carbon sources for the growth of LAB, especially glucose [42]. After fermentation, the contents of glucose and fructose had no significant changes. Combined with the significant decrease in sucrose content, this phenomenon may be due to the decomposition rate of sucrose being equivalent to the consumption rate of glucose and fructose during the fermentation [40]. In addition, the contents of glucose and fructose had no significant changes, which may be related to the lower pH value and the significant decrease in the malic acid content of the R–B mixed juice after fermentation. It has been reported that, under low-pH fermentation conditions, L. plantarum would use a nonconventional carbon source such as malic acid and convert it into lactic acid, resulting in a significant decrease in sucrose content and no significant changes in glucose and fructose contents [43,44].
The starter plays an important role in the flavor of a fermented beverage, and L. plantarum TUST-232 was shown as a suitable starter for this fermented beverage, playing a key role in the metabolism of organic acids. Oxalic acid, citric acid, malic acid, succinic acid, lactic acid, and adipic acid are the primary organic acids in a beverage. During fermentation, L. plantarum TUST-232 can reduce the acidity of the beverage by converting malic acid into lactic acid, and the final content of malic acid was reduced by 13.41%. Jin et al. [45] used six different probiotics to ferment mango pulps, and LAB was shown to completely consume the malic acid in the mango pulps and convert it to lactic acid after fermentation. After fermentation by L. plantarum TUST-232, malic acid was converted into lactic acid, leading to a reduction in the acidity of beverage. At the same time, the flavor of the fermented beverage from the R–B mixture was also improved, related to the conversion of malic acid to lactic acid, resulting in a decrease of 13.41% in the final malic acid content. Zhang et al. [46] studied a mulberry beverage cocultured with Saccharomyces cerevisiae and L. plantarum. They found that S. cerevisiae and L. plantarum converted malic acid to lactic acid, which could not only reduce the acidity of beverage, but also improve the flavor through the generation of metabolites, thus enhancing the microbial stability and sensory quality of the final product. Meanwhile, some oxalic acid and adipic acid in the beverage could be metabolized by L. plantarum as carbon and energy sources. During 48 h fermentation, the content of citric acid showed a continuous increase from 0–24 h, followed by a sharp drop. L. plantarum TUST-232 can produce succinic acid instead of lactic acid, and the final content of succinic acid was increased by 2.08%.
Flavor is one of the essential properties of a fermented beverage, and the peak area normalization method was used calculate the relative content of the volatile compounds. The pre-fermented beverage was relatively simple in flavor, mainly involving the smell of red jujube fruits and bamboo shoots. The fermentation of L. plantarum TUST-232 released and produced some volatile compounds, such as acids, aldehydes, ketones, and other substances, thus improving the quality and flavor of the beverage. After fermentation by L. plantarum TUST-232, the R–B mixed juice showed great changes in the composition and relative content of some main volatile compounds, such as hexanal, (2Z)-2-heptenal, 2-octenal, benzaldehyde, 1-octen-3-one, hexanoic acid, and decanoic acid. These compounds have been identified as important volatile compounds in the foods fermented by Lactobacilli [47]. Among the main volatile compounds, due to the fermentation of L. plantarum TUST-232, the relative contents of acids and aldehydes were 31.61% and 42.27%, respectively, and they played a key role in the characteristic flavor of the R–B mixed juice.
Previous studies showed that the relationship between the volatile compounds and fermentation substrates was complex [48]. The fermentation of L. plantarum TUST-232 increased the content of some organic acids, which not only improved the acidity of the beverage, but also changed the relative contents of some volatile compounds. Malolactic fermentation (MLF) is a process via which L. plantarum converts malic acid into lactic acid and carbon dioxide through the secretion of the malolactic enzyme (MLE). After 14 h of fermentation, the content of malic acid in the mixed juice decreased significantly and the content of lactic acid increased significantly, indicating that the MLE secreted by L. plantarum TUST-232 was highly active in performing MLF during the fermentation [49]. At the same time, MLF made it possible for L. plantarum to grow well without adding nutrients before fermentation. In addition, the MLF can improve the flavor and taste of beverages, produce many volatile secondary compounds, and improve the stability [50]. Lactic acid participated in ester metabolism during the fermentation, which led the formation of some esters. After fermentation, the relative content of olefins decreased by 17.13%, which was related to the participation of malic acid in the metabolic pathway of olefins [48]. The relative content of acetic acid increased significantly after fermentation, indicating that L. plantarum TUST-232 activated the acetate kinase route of the phosphogluconate pathway [51]. L. plantarum could consume lactic acid and release the same amount of acetic acid under aerobic conditions [47].
After fermentation, the R–B mixed juice showed great changes in the relative contents of several main aldehydes, such as the disappearance of furfural and heptanal, which could help to reduce the “caramel-like” flavor and the strong fruity odor of the beverage, respectively [52]. Meanwhile, a significant increase was observed in the relative contents of 2-octenal and 2-undecenal; the former has the aromas of fat, meat, cucumber and chicken, while the latter has a strong aroma of unsaturated aldehyde fragrance, both of which may improve the flavor of the beverage.
The relative contents of ketone, ester, and alcohol also varied in their effects on the flavor of the beverage. After fermentation, some ketones could synergistically enhance the fruity aroma of the fermented beverage [45]. The beverage contained some fatty acids, such as methyl ketones (2-nonanone, 2-octanone), which could have been formed by β-oxidation of fatty acids and decarboxylation of the produced β-keto acids [47]. Before fermentation, 6,10-dimethyl-5,9-undecadien-2-one was not detectable, but it was detected to reach a certain amount after fermentation, endowing the beverage with a sweet rose aroma. The formation of esters was mainly related to the consumption of sugars by L. plantarum [53]. Due to a lower odor threshold of esters than alcohols, the esters in the beverage after fermentation may produce a great impact on the aroma of the beverage, and the relatively low contents of esters such as methyl laurate, decyl propionate, and benzyl salicylate may have positive effects on the beverage flavor [46]. Meanwhile, the formation of esters was also related to the abundance of alcohols in the beverage. During fermentation, L. plantarum produced many alcohols as precursors for esters [54], and, after fermentation, farnesol, nonyl alcohol, and benzyldehyde further released the plant aroma of the beverage, contributing to the flavor of the beverage. Furthermore, heterocyclic compounds such as 5-hydroxymethyl-2-furaldehyde were detected before and after fermentation, probably due to the heating of sugars and the production of some new substances [55]. Hexanal with a unique herbal flavor is the most reducing volatile compound and can reduce the strong plant odor of the beverage [56].
The primary antioxidants in red jujube fruits and bamboo shoots are mainly phenolic substances and flavonoid compounds. After fermentation, the R–B mixed juice showed no significant change in total flavonoid content, but an increase in total phenolic content, probably due to a low metabolic capacity of L. plantarum TUST-232 for flavonoid compounds in the R–B mixed juice [57]. The removal of the shells from bamboo shoots before fermentation to reduce their effect on the taste of the beverage resulted in a lower total phenolic content in the R–B mixed beverage. Katina et al. [58] reported that fermentation of rye bran by LAB could increase the total phenolic content by 90%, in contrast to an increase of only 15–30% for the fermentation of peeled bran, indicating that the total phenolic content in bran and some food shells may account for a certain proportion. After fermentation, the total phenolic content showed an increase of 11.09% in the beverage, which was related to the conversion and depolymerization of related compounds by enzymes, suggesting that L. plantarum TUST-232 can produce related enzymes in the beverage during fermentation to increase the total phenolic content by decomposing hydroxyl or hydroxyl groups in the phenol ring and producing phenolic acids [9,27,59]. In addition, the fermentation time of L. plantarum TUST-232 also played an important role in total phenolic content, and the fermentation conditions provided sufficient time for L. plantarum TUST-232 to increase the total phenolic content in the R–B mixed juice. Sidari et al. [60] evaluated the effect of the multi-strain starter culture (two LAB strains and a yeast strain) on the antioxidant and rheological properties of sourdoughs and derived bread. They found that the total phenolic content in the sourdough inoculated with LAB and yeast increased with the extension of fermentation time, resulting in significantly higher total phenolic content than that of the control group. Since the Folin–C method can measure all the phenolic substances, including aromatic amino acids, the increase in free phenolic can also be attributed to the increased protein hydrolysis during fermentation [58].
After fermentation, all four antioxidant indices (Table 3) showed significant improvement, probably due to the high ability of L. plantarum TUST232 to reduce iron ions, scavenge hydroxyl radicals, and inhibit superoxide anions, as well as its strong capability to hydrolyze polyphenols in the R–B mixed juice. Di et al. [61] used eight LAB strains to ferment Portulaca oleracea L. juice separately, and they found that all LAB strains could significantly improve several antioxidant indices of the juice. The improvement in antioxidant indices caused by LAB may also be related to various metabolites with antioxidant activity, such as glutathione, butyrate, and folic acid [62]. Therefore, the enhanced antioxidant capacity may be closely related to the unique biological activity and metabolic characteristics of L. plantarum TUST-232.
Most of the dietary fibers in the R–B mixed juice were insoluble or slowly fermented fibers, resulting in no significant change in the content of dietary fibers after fermentation [63,64]. Contemporary research has shown that most noncommunicable diseases are caused by an unhealthy diet and lifestyle, and new dietary habits are likely to cause intestinal microbial disorders. Ancestral diets are rich in plant-based foods and dietary fibers and are beneficial to ecological diversity, making the enteric microorganism more abundant and complex, thereby facilitating body metabolism and mental health [65]. A daily intake of 25–29 g dietary fibers can significantly reduce the risk of a series of diseases [66], and the content of dietary fibers in the fermented beverage could reach 5.9 g per kilogram. Furthermore, the beverage contained 0.78 g of soluble dietary fiber per kilogram, which is high relative to some other beverages like beer (0.2 g/L) and white wine (0.19 g/L) [67]. Therefore, this fermented beverage is a good choice for people with a low intake of daily dietary fibers.

5. Conclusions

A fermented beverage was prepared using red jujube fruits and bamboo shoots high in yield but difficult to store. L. plantarum TUST-232 fermentation changed the physicochemical properties and nutrients of the beverage, leading to the production of a large amount of lactic acid and an increase in total phenolic content. Furthermore, the fermentation with this LAB also improved the antioxidant capacity of the R–B mixed juice.

Author Contributions

All authors contributed to the writing of this article. X.-J.D. and S.W. contributed to the conceptualization and the design of the study. C.-M.Z. performed the experiments and the writing and editing of the manuscript. T.D., P.L. and X.-J.D. contributed to the design and conceptualization. All authors have read and agreed to the published version of the manuscript.

Funding

This work was supported by the National Key R&D Program of China (2017YFD0400704).

Conflicts of Interest

The authors declare no conflict of interest.

References

  1. Ji, X.; Peng, Q.; Yuan, Y.; Shen, J.; Xie, X.; Wang, M. Isolation, structures and bioactivities of the polysaccharides from jujube fruit (Ziziphus jujuba Mill.): A review. Food Chem. 2017, 227, 349–357. [Google Scholar] [CrossRef]
  2. Chongtham, N.; Bisht, M.S. Bamboo: A prospective ingredient for Functional food and Nutraceuticals. Jpn. Bamboo J. 2017, 30, 82–99. [Google Scholar]
  3. O’Keefe, S.J. The association between dietary fibre deficiency and high-income lifestyle-associated diseases: Burkitt’s hypothesis revisited. Lancet Gastroenterol. Hepatol. 2019, 4, 984–996. [Google Scholar] [CrossRef]
  4. Frank, S.M.; Webster, J.; McKenzie, B.; Geldsetzer, P.; Manne-Goehler, J.; Andall-Brereton, G.; Houehanou, C.; Houinato, D.; Gurung, M.S.; Bicaba, B.W.; et al. Consumption of Fruits and Vegetables Among Individuals 15 Years and Older in 28 Low- and Middle-Income Countries. J. Nutr. 2019, 149, 1252–1259. [Google Scholar] [CrossRef]
  5. Plaza-Díaz, J.; Ruiz-Ojeda, F.J.; Vilchez-Padial, L.M.; Gil, A. Evidence of the Anti-Inflammatory Effects of Probiotics and Synbiotics in Intestinal Chronic Diseases. Nutrients 2017, 9, 555. [Google Scholar] [CrossRef] [PubMed] [Green Version]
  6. Russo, P.; Arena, M.P.; Fiocco, D.; Capozzi, V.; Drider, D.; Spano, G. Lactobacillus plantarum with broad antifungal activity: A promising approach to increase safety and shelf-life of cereal-based products. Int. J. Food Microbiol. 2017, 247, 48–54. [Google Scholar] [CrossRef]
  7. Husain, M.M.; Kumar, A.; Mukhtar, H.; Krishnamurti, C.R. Xenobiotic biotransformation in wild birds: Activity, induction, characterization and comparison with rat and mouse microsomal enzymes. Xenobiotica 1981, 11, 785–793. [Google Scholar] [CrossRef] [PubMed]
  8. Dahal, S.; Ojha, P.; Karki, T.B. Functional quality evaluation and shelf life study of synbiotic yacon juice. Food Sci. Nutr. 2020, 8, 1546–1553. [Google Scholar] [CrossRef] [Green Version]
  9. Hur, S.J.; Lee, S.Y.; Kim, Y.-C.; Choi, I.; Kim, G.-B. Effect of fermentation on the antioxidant activity in plant-based foods. Food Chem. 2014, 160, 346–356. [Google Scholar] [CrossRef]
  10. Shieh, M.-J.; Shang, H.-F.; Liao, F.-H.; Zhu, J.-S.; Chien, Y.-W. Lactobacillus fermentum improved intestinal bacteria flora by reducing Clostridium perfringens. e-SPEN Eur. e-J. Clin. Nutr. Metab. 2011, 6, e59–e63. [Google Scholar] [CrossRef] [Green Version]
  11. Lavefve, L.; Marasini, D.; Carbonero, F. Microbial Ecology of Fermented Vegetables and Non-Alcoholic Drinks and Current Knowledge on Their Impact on Human Health. Adv. Food Nutr. Res. 2019, 87, 147–185. [Google Scholar] [CrossRef] [PubMed]
  12. Menezes, A.; Ramos, C.; Dias, D.R.; Schwan, R.F. Combination of probiotic yeast and lactic acid bacteria as starter culture to produce maize-based beverages. Food Res. Int. 2018, 111, 187–197. [Google Scholar] [CrossRef] [PubMed]
  13. Sharma, H.P.; Patel, H. Sugandha Enzymatic added extraction and clarification of fruit juices–A review. Crit. Rev. Food Sci. Nutr. 2016, 57, 1215–1227. [Google Scholar] [CrossRef] [PubMed]
  14. Dimitrovski, D.; Velickova, E.; Dimitrovska, M.; Langerholc, T.; Winkelhausen, E. Synbiotic functional drink from Jerusalem artichoke juice fermented by probiotic Lactobacillus plantarum PCS26. J. Food Sci. Technol. 2015, 53, 766–774. [Google Scholar] [CrossRef] [PubMed] [Green Version]
  15. Giri, S.S.; Sen, S.S.; Saha, S.; Sukumaran, V.; Park, S.C. Use of a Potential Probiotic, Lactobacillus plantarum L7, for the Preparation of a Rice-Based Fermented Beverage. Front. Microbiol. 2018, 9, 473. [Google Scholar] [CrossRef]
  16. Moghaddam, A.D.; Garavand, F.; Razavi, S.H.; Talatappe, H.D. Production of saffron-based probiotic beverage by lactic acid bacteria. J. Food Meas. Charact. 2018, 12, 2708–2717. [Google Scholar] [CrossRef]
  17. Ma, B.; Chen, J.; Zheng, H.; Fang, T.; Ogutu, C.; Li, S.; Han, Y.; Wu, B. Comparative assessment of sugar and malic acid composition in cultivated and wild apples. Food Chem. 2015, 172, 86–91. [Google Scholar] [CrossRef]
  18. Pereira, A.L.F.; Feitosa, W.S.C.; Abreu, V.K.G.; Lemos, T.D.O.; Gomes, W.F.; Narain, N.; Rodrigues, S. Impact of fermentation conditions on the quality and sensory properties of a probiotic cupuassu (Theobroma grandiflorum) beverage. Food Res. Int. 2017, 100, 603–611. [Google Scholar] [CrossRef]
  19. Zheng, H.; Zhang, Q.; Quan, J.; Zheng, Q.; Xi, W. Determination of sugars, organic acids, aroma components, and carotenoids in grapefruit pulps. Food Chem. 2016, 205, 112–121. [Google Scholar] [CrossRef] [PubMed]
  20. Ye, M.; Yue, T.; Yuan, Y. Evolution of polyphenols and organic acids during the fermentation of apple cider. J. Sci. Food Agric. 2014, 94, 2951–2957. [Google Scholar] [CrossRef]
  21. Wang, Z.; Dou, R.; Yang, R.; Cai, K.; Li, C.; Li, W. Changes in Phenols, Polysaccharides and Volatile Profiles of Noni (Morinda citrifolia L.) Juice during Fermentation. Molecules 2021, 26, 2604. [Google Scholar] [CrossRef]
  22. Giovenzana, V.; Beghi, R.; Buratti, S.; Civelli, R.; Guidetti, R. Monitoring of fresh-cut Valerianella locusta Laterr. shelf life by electronic nose and VIS–NIR spectroscopy. Talanta 2014, 120, 368–375. [Google Scholar] [CrossRef] [PubMed]
  23. Xu, B.; Chang, S. A Comparative Study on Phenolic Profiles and Antioxidant Activities of Legumes as Affected by Extraction Solvents. J. Food Sci. 2007, 72, S159–S166. [Google Scholar] [CrossRef] [PubMed]
  24. Liu, X.-S.; Gao, B.; Li, X.-L.; Li, W.-N.; Qiao, Z.-A.; Han, L. Chemical Composition and Antimicrobial and Antioxidant Activities of Essential Oil of Sunflower (Helianthus annuus L.) Receptacle. Molecules 2020, 25, 5244. [Google Scholar] [CrossRef]
  25. Li, S.; Tang, S.; He, Q.; Hu, J.; Zheng, J. In vitro antioxidant and angiotensin-converting enzyme inhibitory activity of fermented milk with different culture combinations. J. Dairy Sci. 2020, 103, 1120–1130. [Google Scholar] [CrossRef] [PubMed]
  26. Chanioti, S.; Tzia, C. Optimization of ultrasound-assisted extraction of oil from olive pomace using response surface technology: Oil recovery, unsaponifiable matter, total phenol content and antioxidant activity. LWT 2017, 79, 178–189. [Google Scholar] [CrossRef]
  27. Georgetti, S.; Vicentini, F.; Yokoyama, C.; Borin, M.; Spadaro, A.; Fonseca, M. Enhancedin vitroandin vivoantioxidant activity and mobilization of free phenolic compounds of soybean flour fermented with different β-glucosidase-producing fungi. J. Appl. Microbiol. 2009, 106, 459–466. [Google Scholar] [CrossRef]
  28. Klopotek, Y.; Otto, K.; Böhm, V. Processing Strawberries to Different Products Alters Contents of Vitamin C, Total Phenolics, Total Anthocyanins, and Antioxidant Capacity. J. Agric. Food Chem. 2005, 53, 5640–5646. [Google Scholar] [CrossRef]
  29. Letaief, H.; Zemni, H.; Mliki, A.; Chebil, S. Composition of Citrus sinensis (L.) Osbeck cv «Maltaise demi-sanguine» juice. A comparison between organic and conventional farming. Food Chem. 2016, 194, 290–295. [Google Scholar] [CrossRef] [PubMed]
  30. AOAC. AOAC Official Method 991.43 Total, Soluble, and Insoluble Dietary Fiber in Foods Enzymatic–Gravimetric Method, MES–TRIS Buffer First Action 1991 Final Action 1994; Association of Official Analytical Chemists: Washington, DC, USA, 1994. [Google Scholar]
  31. Raja, K.K.; Hari, P.; Chin, M.Q.K.; Singbal, K.; Fareez, I.M. Color Stability of a New Rice Husk Composite in Comparison with Conventional Composites after Exposure to Commonly Consumed Beverages in Malaysia. Int. J. Dent. 2019, 2019, 9753431–9753437. [Google Scholar] [CrossRef]
  32. Rios-Corripio, G.; Guerrero-Beltrán, J.Á. Antioxidant and physicochemical characteristics of unfermented and fermented pomegranate (Punica granatum L.) beverages. J. Food Sci. Technol. 2019, 56, 132–139. [Google Scholar] [CrossRef]
  33. Dan, T.; Wang, D.; Wu, S.; Jin, R.; Ren, W.; Sun, T. Profiles of Volatile Flavor Compounds in Milk Fermented with Different Proportional Combinations of Lactobacillus delbrueckii subsp. bulgaricus and Streptococcus thermophilus. Molecules 2017, 22, 1633. [Google Scholar] [CrossRef] [Green Version]
  34. Liu, G.; Sun, J.; He, X.; Tang, Y.; Li, J.; Ling, D.; Li, C.-B.; Li, L.; Zheng, F.; Sheng, J.; et al. Fermentation process optimization and chemical constituent analysis on longan (Dimocarpus longan Lour.) wine. Food Chem. 2018, 256, 268–279. [Google Scholar] [CrossRef] [PubMed]
  35. Feng, C.; Wang, B.; Zhao, A.; Wei, L.; Shao, Y.; Wang, Y.; Cao, B.; Zhang, F. Quality characteristics and antioxidant activities of goat milk yogurt with added jujube pulp. Food Chem. 2019, 277, 238–245. [Google Scholar] [CrossRef]
  36. Nongdam, P.; Tikendra, L. The Nutritional Facts of Bamboo Shoots and Their Usage as Important Traditional Foods of Northeast India. Int. Sch. Res. Not. 2014, 2014, 1–17. [Google Scholar] [CrossRef] [PubMed]
  37. Paz, P.C.; Janny, R.J.; Håkansson, Å. Safeguarding of quinoa beverage production by fermentation with Lactobacillus plantarum DSM 9843. Int. J. Food Microbiol. 2020, 324, 108630. [Google Scholar] [CrossRef]
  38. Holzapfel, W. Use of starter cultures in fermentation on a household scale. Food Control. 1997, 8, 241–258. [Google Scholar] [CrossRef]
  39. Phiri, S.; Schoustra, S.E.; Heuvel, J.V.D.; Smid, E.J.; Shindano, J.; Linnemann, A. Fermented cereal-based Munkoyo beverage: Processing practices, microbial diversity and aroma compounds. PLoS ONE 2019, 14, e0223501. [Google Scholar] [CrossRef] [PubMed] [Green Version]
  40. Yang, X.; Zhou, J.; Fan, L.; Qin, Z.; Chen, Q.; Zhao, L. Antioxidant properties of a vegetable–fruit beverage fermented with two Lactobacillus plantarum strains. Food Sci. Biotechnol. 2018, 27, 1719–1726. [Google Scholar] [CrossRef]
  41. Lu, Y.; Putra, S.D.; Liu, S.-Q. A novel non-dairy beverage from durian pulp fermented with selected probiotics and yeast. Int. J. Food Microbiol. 2018, 265, 1–8. [Google Scholar] [CrossRef] [PubMed]
  42. Xiong, T.; Li, X.; Guan, Q.; Peng, F.; Xie, M. Starter culture fermentation of Chinese sauerkraut: Growth, acidification and metabolic analyses. Food Control. 2014, 41, 122–127. [Google Scholar] [CrossRef]
  43. Ricci, A.; Cirlini, M.; Maoloni, A.; Del Rio, D.; Calani, L.; Bernini, V.; Galaverna, G.; Neviani, E.; Lazzi, C. Use of Dairy and Plant-Derived Lactobacilli as Starters for Cherry Juice Fermentation. Nutrients 2019, 11, 213. [Google Scholar] [CrossRef] [Green Version]
  44. Tkacz, K.; Chmielewska, J.; Turkiewicz, I.P.; Nowicka, P.; Wojdyło, A. Dynamics of changes in organic acids, sugars and phenolic compounds and antioxidant activity of sea buckthorn and sea buckthorn-apple juices during malolactic fermentation. Food Chem. 2020, 332, 127382. [Google Scholar] [CrossRef]
  45. Jin, X.; Chen, W.; Chen, H.; Chen, W.; Zhong, Q. Comparative Evaluation of the Antioxidant Capacities and Organic Acid and Volatile Contents of Mango Slurries Fermented with Six Different Probiotic Microorganisms. J. Food Sci. 2018, 83, 3059–3068. [Google Scholar] [CrossRef] [PubMed]
  46. Zhang, Q.; Sun, Q.; Tan, X.; Zhang, S.; Zeng, L.; Tang, J.; Xiang, W. Characterization of γ-aminobutyric acid (GABA)-producing Saccharomyces cerevisiae and coculture with Lactobacillus plantarum for mulberry beverage brewing. J. Biosci. Bioeng. 2020, 129, 447–453. [Google Scholar] [CrossRef] [PubMed]
  47. Lee, S.M.; Oh, J.; Hurh, B.-S.; Jeong, G.-H.; Shin, Y.-K.; Kim, Y.-S. Volatile Compounds Produced byLactobacillus paracaseiDuring Oat Fermentation. J. Food Sci. 2016, 81, C2915–C2922. [Google Scholar] [CrossRef] [PubMed]
  48. Xu, X.; Bao, Y.; Wu, B.; Lao, F.; Hu, X.; Wu, J. Chemical analysis and flavor properties of blended orange, carrot, apple and Chinese jujube juice fermented by selenium-enriched probiotics. Food Chem. 2019, 289, 250–258. [Google Scholar] [CrossRef] [PubMed]
  49. Markkinen, N.; Laaksonen, O.; Nahku, R.; Kuldjärv, R.; Yang, B. Impact of lactic acid fermentation on acids, sugars, and phenolic compounds in black chokeberry and sea buckthorn juices. Food Chem. 2019, 286, 204–215. [Google Scholar] [CrossRef]
  50. Virdis, C.; Sumby, K.; Bartowsky, E.; Jiranek, V. Lactic Acid Bacteria in Wine: Technological Advances and Evaluation of Their Functional Role. Front. Microbiol. 2021, 11, 612118. [Google Scholar] [CrossRef]
  51. Li, T.; Jiang, T.; Liu, N.; Wu, C.; Xu, H.; Lei, H. Biotransformation of phenolic profiles and improvement of antioxidant capacities in jujube juice by select lactic acid bacteria. Food Chem. 2021, 339, 127859. [Google Scholar] [CrossRef] [PubMed]
  52. Brizuela, N.S.; Ferrada, B.M.B.; Pozo-Bayón, M.; Ángeles; Semorile, L.; Tymczyszyn, E.E. Changes in the volatile profile of Pinot noir wines caused by Patagonian Lactobacillus plantarum and Oenococcus oeni strains. Food Res. Int. 2018, 106, 22–28. [Google Scholar] [CrossRef]
  53. Wang, H.; Li, P.; Sun, S.-H.; Zhang, Q.-D.; Su, Y.; Zong, Y.-L.; Xie, J.-P. Comparison of Liquid–Liquid Extraction, Simultaneous Distillation Extraction, Ultrasound-Assisted Solvent Extraction, and Headspace Solid-Phase Microextraction for the Determination of Volatile Compounds in Jujube Extract by Gas Chromatography/Mass Spectrometry. Anal. Lett. 2014, 47, 654–674. [Google Scholar] [CrossRef]
  54. Oliveira Érica, R.; Caliari, M.; Júnior, M.S.S.; Oliveira, A.R.; Duarte, R.C.M.; Boas, E.V.D.B.V. Assessment of chemical and sensory quality of sugarcane alcoholic fermented beverage. J. Food Sci. Technol. 2017, 55, 72–81. [Google Scholar] [CrossRef] [PubMed]
  55. Caven-Quantrill, D.J.; Buglass, A.J. Comparison of micro-scale simultaneous distillation–extraction and stir bar sorptive extraction for the determination of volatile organic constituents of grape juice. J. Chromatogr. A 2006, 1117, 121–131. [Google Scholar] [CrossRef] [PubMed]
  56. Wang, L.; Wang, Y.; Wang, W.; Zheng, F.; Chen, F. Comparison of volatile compositions of 15 different varieties of Chinese jujube (Ziziphus jujuba Mill.). J. Food Sci. Technol. 2019, 56, 1631–1640. [Google Scholar] [CrossRef] [PubMed]
  57. Men, Y.; Zhu, P.; Zhu, Y.; Zeng, Y.; Yang, J.; Sun, Y. The development of low-calorie sugar and functional jujube food using biological transformation and fermentation coupling technology. Food Sci. Nutr. 2019, 7, 1302–1310. [Google Scholar] [CrossRef] [PubMed] [Green Version]
  58. Katina, K.; Laitila, A.; Juvonen, R.; Liukkonen, K.-H.; Kariluoto, S.; Piironen, V.; Landberg, R.; Åman, P.; Poutanen, K. Bran fermentation as a means to enhance technological properties and bioactivity of rye. Food Microbiol. 2007, 24, 175–186. [Google Scholar] [CrossRef]
  59. Martins, S.; Mussatto, S.I.; Ávila, G.C.G.M.; Montañez, J.; Aguilar, C.N.; Teixeira, J.A. Bioactive phenolic compounds: Production and extraction by solid-state fermentation. A review. Biotechnol. Adv. 2011, 29, 365–373. [Google Scholar] [CrossRef] [Green Version]
  60. Sidari, R.; Martorana, A.; Zappia, C.; Mincione, A.; Giuffrè, A.M. Persistence and Effect of a Multistrain Starter Culture on Antioxidant and Rheological Properties of Novel Wheat Sourdoughs and Bread. Foods 2020, 9, 1258. [Google Scholar] [CrossRef]
  61. Di Cagno, R.; Filannino, P.; Vincentini, O.; Cantatore, V.; Cavoski, I.; Gobbetti, M. Fermented Portulaca oleracea L. Juice: A Novel Functional Beverage with Potential Ameliorating Effects on the Intestinal Inflammation and Epithelial Injury. Nutrients 2019, 11, 248. [Google Scholar] [CrossRef] [Green Version]
  62. Nguyen, B.T.; Bujna, E.; Fekete, N.; Tran, A.T.M.; Rezessy-Szabo, J.M.; Prasad, R.; Nguyen, Q.D. Probiotic Beverage From Pineapple Juice Fermented With Lactobacillus and Bifidobacterium Strains. Front. Nutr. 2019, 6, 54. [Google Scholar] [CrossRef] [Green Version]
  63. Eswaran, S.; Muir, J.; Chey, W.D. Fiber and Functional Gastrointestinal Disorders. Am. J. Gastroenterol. 2013, 108, 718–727. [Google Scholar] [CrossRef] [PubMed]
  64. Padayachee, A.; Day, L.; Howell, K.; Gidley, M.J. Complexity and health functionality of plant cell wall fibers from fruits and vegetables. Crit. Rev. Food Sci. Nutr. 2017, 57, 59–81. [Google Scholar] [CrossRef]
  65. Van Der Kamp, J.W.; Harris, P.J. Editorial for the Special Issue “Dietary Fibre: New Insights on Biochemistry and Health Benefits. ” Int. J. Mol. Sci. 2018, 19, 3556. [Google Scholar] [CrossRef] [Green Version]
  66. Reynolds, A.; Mann, J.; Cummings, J.; Winter, N.; Mete, E.; Morenga, L.T. Carbohydrate quality and human health: A series of systematic reviews and meta-analyses. Lancet 2019, 393, 434–445. [Google Scholar] [CrossRef] [Green Version]
  67. Sáyago-Ayerdi, S.G.; Arranz, S.; Serrano, J.; Goñi, I. Dietary Fiber Content and Associated Antioxidant Compounds in Roselle Flower (Hibiscus sabdariffa L.) Beverage. J. Agric. Food Chem. 2007, 55, 7886–7890. [Google Scholar] [CrossRef]
Figure 1. Changes in pH values and viable cell counts under different inoculation volumes (A) (0.03%, 0.06%, 0.10%, 0.20%, 0.30%, and 0.40% with separate trials at 37 °C and fermented for 14 h), fermentation temperatures (B) (30 °C, 34 °C, 37 °C, and 40 °C with separate trials with 0.30% inoculation volume and fermented for 14 h), and fermentation time periods (C) (10 h, 12 h, 14 h, 16 h, and 18 h with consecutive trials under different time points with 0.30% inoculation volume and fermented at 37 °C) with L. plantarum TUST-232. a,b,c Statistical analysis ANOVA at 95% confidence level, with different letters indicating a significant difference at p < 0.05.
Foods 10 01439 g001
Figure 2. Changes in viable cell counts, pH values, and TTA values during fermentation of the R–B mixed juice with L. plantarum TUST-232, and the picture of the beverage produced under the selected fermentation conditions. The growth curve was determined under the selected conditions of 0.3% inoculation volume and fermentation at 37 °C for 36 h.
Foods 10 01439 g002
Figure 3. Changes in the content of sugars before and after fermentation of the R–B mixed juice with L. plantarum TUST-232. The contents of sugars, including sucrose, glucose, and fructose, were measured. The error bars indicate means ± SD (n = 3); the differences between groups were analyzed by a two-tailed paired Student’s t-test; * p < 0.05.
Foods 10 01439 g003
Figure 4. Changes in the content of organic acids before and after fermentation of the R–B mixed juice fermented with L. plantarum TUST-232. Organic acids, including oxalic acid, citric acid, malic acid, succinic acid, lactic acid, and adipic acid, were measured. The error bars indicate means ± SD (n = 3); the differences between groups were analyzed by a two-tailed paired Student’s t-test. * indicates significant differences at p < 0.05.
Foods 10 01439 g004
Figure 5. Radar plot (A), PCA score plot (B), and loading plot (C) of the aromatic compounds in the R–B mixed juice before and after fermentation detected by electronic nose.
Foods 10 01439 g005
Table 1. Fermentation performance of different strains used in the R–B mixed juice.
Strain24 h48 h
pHViable Cell Count
(Log CFU/mL)
pHViable Cell Count
(Log CFU/mL)
TUST-BS4.17 ± 0.08 b3.41 ± 0.11 c3.51 ± 0.05 b7.83 ± 0.11 c
TUST-2323.43 ± 0.19 a8.90 ± 0.10 a3.29 ± 0.06 a8.69 ± 0.19 a
TUST-3924.7 ± 0.16 c3.10 ± 0.29 c3.79 ± 0.12 c4.74 ± 0.08 d
TUST-3543.99 ± 0.12 b4.64 ± 0.14 b3.31 ± 0.11 a8.42 ± 0.08 b
a,b,c Statistical analysis ANOVA at 95% confidence level: the value of TUST-232 in each column was defined as “a”; the closest value significantly different from “a” was defined as “b”; the next value significantly different from “a”, “b” and “c” was defined as “d”; different letters in each column indicate significant differences at p < 0.05.
Table 2. Main volatile compounds in the R–B mixed juice before and after fermentation with L. plantarum TUST-232.
NumberNameRetention Time (min)Relative Content (%)p-Value
BeforeAfter
Aldehyde
A13-methylbutyraldehyde2.7560.41-
A2valeraldehyde3.8220.51-
A3hexanal6.1256.162.38*
A4heptanal8.8273.35-
A55-methylhexanal8.417-0.19
A6hexen-2-al9.9892.250.16*
A7octanal11.9263.142.81
A8(2Z)-2-heptenal 13.10511.239.23*
A9nonanal14.9713.203.06
A102-octenal16.0899.9714.80*
A11furfural17.1060.91-
A12decanal18.367-0.67
A13lauric aldehyde18.467-0.34
A14benzaldehyde18.6583.951.26*
A152-nonenal19.6560.981.25
A162-decenal22.3993.263.15
A172,4-nonadienal23.7750.120.27
A182-undecenal24.9291.252.41*
A192-trans, 4-trans-decadienal24.916-0.27
A205-hydroxymethyl-2-furaldehyde38.9620.560.22
Olefin
B12-methyl-6-methyl-2-methylene15.227-0.91
B23-ethyl-2-methyl-1,3-hexadien15.6590.080.25
B32,4-dimethyl-1,3-pentadiene17.160-0.58
B43,5,5-trimethyl-2-Hexene17.5580.10-
B52-methyl-1,5-hexadiene20.783-0.11
Ketone
C13-hydroxy-4-hexanone9.4160.291.75*
C23-octanone10.9170.13-
C31-octen-3-one12.3795.087.07*
C46-methyl-5-hepten-2-one13.4570.470.89*
C52-nonanone14.8830.110.37*
C62-octanone20.917-0.35
C76-methyl-2-heptanone23.6180.33-
C8l-fenchone26.2380.56-
C9 nerylacetone 26.913-0.59
C106,10-dimethyl-5,9-undecadien-2-one27.1720.27-
C114,5-dimethyl-2-cyclohexen-1-one30.1640.48-
C123,6-dimethyl-5-octen-2-one31.557-0.05
C136,10-dimethyl-2-undecanone33.0920.400.46
Alcohol
D13-octyn-2-ol7.5580.12-
D23,5,5-trimethyl-1-hexanol7.857-0.16
D3amyl alcohol11.2010.08-
D4hexyl alcohol14.0070.570.67
D53,5-octadien-2-ol15.5000.160.15
D61-octen-3-ol16.6232.971.55*
D7heptyl alcohol16.775-0.33
D81-octanol19.8210.720.71
D9(E)-2-octen-1-ol21.2151.590.92*
D10menthol21.755-0.38
D11nonyl alcohol22.198-1.21
D12nerolidol26.048-1.30
D13benzyldehyde27.112-0.58
D14farnesol28.528-0.17
D15(2E,6E)-2,6-dimethyl-2,6-octadiene-1,8-diol29.730-0.09
D16pentaethylene glycol43.6501.48-
Ester
E1methyl benzoate21.4580.720.35*
E2geranyl phenylacetate21.9071.51-
E3methyl Laurate26.1250.520.39
E4(Z)-3-decen-1-yl acetate26.308-0.27
E510-undecen-1-yl acetate30.056-0.46
E6decyl propionate35.042-0.30
E7benzyl salicylate42.976-0.24
Acid
F1acetic acid16.9740.670.91*
F2valeric acid24.010-0.03
F3hexanoic acid26.5000.771.80*
F4heptanoic acid28.8360.861.47*
F5octanoic acid31.0571.262.83*
F6nonanoic acid33.3820.690.88
F7decanoic acid35.3575.837.06*
F8undecanoic acid37.1830.180.14
F9lauric acid38.7396.378.72*
F10myristic acid41.6072.995.37*
F11palmitic acid44.5272.982.40
F12oleic acid45.2511.94-
Others
G12-pentylfuran9.9370.100.13
G2azulene24.3120.390.07*
G3adenosine cyclophosphate29.0600.08-
G42-methoxy-4-vinylphenol37.310-0.35
Relative content (%) represents the share of a given substance in the entire pool of volatile compounds; ‘before’ indicates the relative percentage in the R–B mixed juice before fermentation; ‘after’ indicates the relative percentage in the R–B mixed juice after fermentation; the differences between groups were analyzed by a two-tailed paired Student’s t-test; * p < 0.05.
Table 3. Changes in antioxidant activity and the contents of total phenolic, total flavonoid, and dietary fibers in the R–B mixed juice before and after fermentation with L. plantarum TUST-232.
ParameterBeforeAfter
Total antioxidant capacity
(μmol Fe2+ equivalents/100 mL)
84.369 ± 1.89194.743 ± 1.698 *
Iron ion-reducing ability (absorbance)0.261 ± 0.0090.315 ± 0.156 *
Hydroxyl radical-scavenging activity (%)4.045 ± 0.6399.833 ± 1.165 *
Superoxide anion-scavenging ability (U/100 mL)4.774 ± 0.1777.629 ± 0.292 *
Total phenolic (mg/L)29.633 ± 1.07532.918 ± 1.193 *
Total flavonoid (mg/L)85.016 ± 4.32195.810 ± 9.295
Total dietary fiber (g/100 g)0.536 ± 0.0240.570 ± 0.020
Insoluble dietary fiber (g/100 g)0.472 ± 0.0190.492 ± 0.021
Soluble dietary fiber (g/100 g)0.059 ± 0.0430.078 ± 0.017
The error bars indicate means ± SD (n = 3); the differences between groups were analyzed by a two-tailed paired Student’s t-test; * p < 0.05.
Table 4. Changes in color before and after fermentation of the R–B mixed juice with L. plantarum TUST-232.
SampleL*a*b*ΔL*Δa*Δb*ΔE*ab
Before38.47 ± 0.4014.42 ± 0.1945.00 ± 0.20----
After38.50 ± 0.1914.32 ± 0.0944.81 ± 0.120.03 ± 0.59−0.10 ± 0.28−0.19 ± 0.320.89
ΔE*ab, the change in color; L* (lightness); +L*, brighter; −L*, darker; a* (red/green component); +a*, redder; −a*, greener; b* (yellow/blue component); +b*, yellower; −b*, bluer. The error bars indicate means ± SD (n = 3); the differences between groups were analyzed by a two-tailed paired Student’s t-test.
Publisher’s Note: MDPI stays neutral with regard to jurisdictional claims in published maps and institutional affiliations.

