Article

Foodborne TiO2 Nanoparticles Induced More Severe Hepatotoxicity in Fructose-Induced Metabolic Syndrome Mice via Exacerbating Oxidative Stress-Mediated Intestinal Barrier Damage

1
State Key Laboratory of Food Science and Technology, Nanchang University, Nanchang 330047, China
2
Ningbo International Travel HealthCare Center, Ningbo 315012, China
*
Authors to whom correspondence should be addressed.
Foods 2021, 10(5), 986; https://doi.org/10.3390/foods10050986
Submission received: 6 April 2021 / Revised: 26 April 2021 / Accepted: 27 April 2021 / Published: 30 April 2021
(This article belongs to the Special Issue Toxicity of Additives and Contaminants on Food)

Abstract

:
The hazard of titanium dioxide nanoparticles (TiO2 NPs) in diseased population should be given focus due to the huge number of these NPs in foods and medicine. This study aimed to evaluate the stronger biological adverse effect of oral exposure to TiO2 NPs in a fructose-induced metabolic syndrome mouse model. Compared to the normal mice, low-dose (2 mg/kg) TiO2 NPs did not cause severe hepatotoxicity. However, high-dose (20 mg/kg) TiO2 NPs induced aggravated hepatic inflammation, fibrosis, and apoptosis, with substantial alteration of related biochemical parameters in the mouse model. Moreover, significantly increased Ti and lipopolysaccharide burden were observed in metabolic syndrome murine liver and serum, which possibly worsened the portend intestinal leakage. The expression of tight junction-related protein showed that TiO2 NPs induced further increase in serious intestinal permeability. The intestinal inflammatory and oxidative stress response in the model were also assessed. Results showed that TiO2 NPs caused more severe intestinal inflammatory injury by intensifying the oxidative stress in metabolic syndrome mice and then induced further liver injury. This work provides information on the insights into the toxic effect of TiO2 NPs in sub-healthy population.

1. Introduction

Titanium dioxide nanoparticles (TiO2 NPs) play an integral role in today’s industry due to their remarkable physicochemical characteristics [1,2]. TiO2 NPs have been applied in many fields, including food, cosmetics and paints, that people were forced to live in an environment with everyday contact with TiO2 NPs [3]. As a food addictive (E171), 36–40% of TiO2 particles exist under a nanoscale form [4,5]. Based on nanoparticle intake data, children ingest approximately 5 mg/kg BW TiO2 NPs per day, while adults ingest 1–2 mg/kg BW per day [6]. Although TiO2 NPs are considered safe, recent studies have found that TiO2 NPs could increase intestinal permeability, which leads to NPs crossing the intestinal barrier more easily and reaching in other organs, such as liver [7,8]. Then, TiO2 NPs could induce oxidative stress, inflammatory cell infiltration, cell apoptosis, and DNA damage in the liver of a healthy body [9,10], however, the pathological characteristics are not serious or obvious enough to develop into a hepatic disease. Some results even showed that a mild dosage of TiO2 NPs is not toxic to a healthy body [11,12].
However, due to the TiO2 NPs being added in foods and medicines, the disease population possibly received a higher amount of TiO2 NPs than normal. A study found that TiO2 NPs could aggravate colon injury in DSS-induced colitis mice [13], and TiO2 NPs were proven to be an adjuvant in allergic airway diseases. [14]. These findings demonstrated that TiO2 NPs may cause worsened outcomes in patients.
Metabolic syndrome is a pathological condition that is due to imbalanced carbohydrate, protein, fat, and other substances metabolized in the human body. The global prevalence of many diseases related to metabolic syndrome is rising. These diseases include nonalcoholic fatty liver disease (NAFLD), type 2 diabetes, hypertension, and even cancer. According to reports, 20–30% of the adult population could be characterized as suffering from metabolic syndrome, and the global prevalence of NAFLD is approximately 24% [15]. Increased fructose consumption may be a major reason for the increasing trend in the prevalence of NAFLD. Fructose with 22% of five-membered furanose ring in a solution not only could elevate de novo lipogenesis, triglyceride formation, and steatosis but also promote production of reactive oxygen species (ROS) due to its unstable structure [16]. These two functions of fructose correspond with the mechanism theory of NAFLD [17]. TiO2 NPs were notably widely used in sugary products and drug carriers [3], a number of TiO2 NPs accompanied by fructose or medicine could be taken up by patients with metabolic syndrome-related diseases. Thus, increased attention should be paid to the risk of TiO2 NPs exposure in this population. Moreover, the liver is a target organ of TiO2 NPs, which induce excessive ROS. Therefore, evaluating the effect of TiO2 NP exposure in populations with metabolic syndrome is significative. Meanwhile, an increase in intestinal permeability was observed in patients with NAFLD [18], and the negative effect of TiO2 NPs to the intestinal barrier was commonly observed in cells and animals [19,20]. Worsening of intestinal barrier damage may cause increased nanoparticles in the liver, thereby exacerbating hepatic injury. Thus, we speculated TiO2 NPs could worsen the hepatic injury in a metabolic syndrome model by attacking the intestinal barrier.
In this study, we aimed to evaluate whether TiO2 NPs could cause stronger adverse effects in the fructose-induced metabolic syndrome mouse model. More importantly, the mechanism by which TiO2 NPs aggravate liver injury by intensifying intestinal barrier damage was explored. This study could provide insights into TiO2 NPs application in sub-healthy population, such as those with metabolic syndrome.

2. Materials and Methods

2.1. TiO2 Nanoparticles

TiO2 NPs (CAS 13463-67-7 10–25 nm) was purchased from Aladdin industrial Corporation, Shanghai, China. TiO2 NPs used in this work were characterized in our previous study [21], with a spherical distribution and their diameter was 25.20 nm, it was anatase crystals, which were closer to food products. The hydrodynamic size of nanoparticles is 88.28 ± 20.31 nm in pH 1, 112.05 ± 33.64 nm in pH 5, and 138.41 ± 45.51 nm in pH 7. The nanoparticle dispersibility was great in the environment of acidic fluid.

2.2. Animal Experimental Procedure

Fifty healthy male Kunming mice (5 weeks old) were obtained from the experimental animal center of Nanchang University, China. The mice were placed in rooms with a 12 h light and 12 h dark cycle, the temperature and relative humidity were 23 ± 2 °C and 50 ± 5%. Every animal procedure in this study was guided under the institutional animal care committee guidelines and approved by the Animal Care Review Committee (approval number 0064257), Nanchang University, Jiangxi, China. After 1 week of acclimatization, mice were randomly divided into five group (n = 8~10), Respectively, Group I mice were ingested ordinary water by drinking as the control group. Group II mice were ingested 20 mg/kg BW (body weight) TiO2 NPs with ordinary drinking water (20 mg/kg). Group III, mice were feeding 30% (wt/vol) fructose (Fru). Group IV, mice were treated with 2 mg/kg BW TiO2 NPs and 30% fructose (2 mg/kg + Fru). Group V, mice were treated with 20 mg/kg BW TiO2 NPs and 30% fructose (20 mg/kg + Fru). The TiO2 NPs were dispersed in 1×PBS solution, ultrasonicated for 30 min and vortex scattered before gavage. Fructose was fed by adding to the ordinary drinking water, and TiO2 NPs were ingested by orally administrated once a day. The low dosage of the TiO2 NPs (2 mg/kg) in this work is refer to the actual level of human exposure, and the high dosage (20 mg/kg) is a tenfold increasing. The body weight and waistline of mice were recorded during the experiment.
After exposure to TiO2 NPs or fructose for 8 weeks, mice were euthanized and the blood, liver, intestine and epididymis fat were isolated. Blood was collected by eyeball removal and put into an enzyme-free and sterile centrifuge tube, which was then placed in a 4 °C environment. Six hours later, serum was centrifuged at 4000 rpm for 10 min at 4 °C and stored at −80 °C immediately for subsequent studies. The liver and epididymis fat tissue were weighed to calculate the organ coefficient (the organ weight divide by the mice body weight). Then, liver and intestine were collected and preserved in the −80°C freezer immediately for subsequent analysis.

2.3. Oral Glucose Tolerance Test (OGTT)

The OGTT was performed after 54 days exposure. Mice were fasted for 12 h before the experiment. Then, collected the tail venous blood and measured fasting blood-glucose immediately. After that, four mice were randomly selected from each group and oral administration of 2 g/kg glucose solution. Blood glucose levels were measured at 15, 30, 60, 90, 120 min by tail vein (Cofoe glucose meter. Qingdao, China).

2.4. Serum Biochemical and Liver Lipid Assays

Serum alanine aminotransferase (ALT), aspartate aminotransferase (AST), alkaline phosphatase (ALP), cholesterol and triglycerides were measured by using a commercial kit (Jiancheng Bioengineering Institute. Nanjing, China). All the processes were according to the manufacturer’s instructions. Liver tissue were homogenized in normal saline (10% w/v) and centrifuged at 3000× g for 15 min at 4 °C, the supernatant was used for measuring the level of cholesterol and triglycerides as above method.

2.5. Histopathological Analysis

The fresh liver and intestine were fixed in 4% paraformaldehyde, dehydrated with different concentrations of ethanol and embedded in a paraffin cube, then sliced to 4–5 µm thick sections (n = 3 for each group). Liver slides were performed H&E staining and Masson staining, while intestine made H&E staining. Using a Nikon Tι optical microscope (Tokyo, Japan) to gain each section’s image for histologic evaluations. As for liver, the pathology was evaluated by H&E staining and the fibrosis was by Masson staining. Inflammations were evaluated (0, no inflammatory cell. 1, slight portal inflammation. 2, mild portal and local tissue inflammatory infiltration. 3, extensive portal and tissue inflammatory infiltration). The ratio of Masson blue+ area was quantitated by Image J. As for intestine, the epithelial injury scores were evaluated (0, no structure damage. 1, mild villi hypertrophy and crypt disorder. 2, villi hypertrophy and crypt disorder, and slight lamina propria attenuation. 3, distinct villi hypertrophy and crypt disorder, lamina propria and intestinal wall damage). The inflammation was evaluated by scoring with indices (0, no inflammatory infiltration. 1, slight infiltration in lamina propria. 2, mild infiltration and spread to the crypt. 3, extensive infiltration and permeated to muscular layer).

2.6. Ti Content Detection

After 8-week TiO2 NPs gavage, five mice’s liver per group from 20 mg/kg and 20 mg/kg + Fru group were collected to determinate Ti contents. In brief, 0.4–0.5 g of liver was put into an acid solute on of HNO3 and HClO4 (10 mL and 2 mL), and then heated to 280 °C until the solution become clear. When the nitrate solution was dried, resuspended with the ultrapure water and transferred to a new glass cube (unified to 25 mL), an inductively coupled plasma atomic emission spectrometer (ICP-AES Optima 8000. PerkinElmer Inc., Waltham, MA, USA) was used to detect Ti contents.

2.7. ELISA

Liver and intestine homogenate (10% w/v) were prepared as the part of 2.4. Both supernatant of liver and intestine were used for measuring tumor necrosis factor α (TNF-α), Interleukin (IL) 1β, IL 6, and IL 10. The level of lipopolysaccharide (LPS) in serum and liver were evaluated. The above biochemical factors were tested by ELISA in accordance with the manufacturer’s description (EYKITS Co., LTD., Shanghai, China).

2.8. Oxidative Stress Assay

The hepatic and intestinal oxidative stress of mice were ascertained by testing of superoxide dismutase (SOD), catalase (CAT) as well as glutathione (GSH) activity, malondialdehyde (MDA) level. Liver and intestine homogenate (10% w/v) were used for the various estimations. The above biochemical parameters were testing by the commercial kit (Jiancheng Bioengineering Institute. Nanjing, China). All the processes were according to the manufacturer’s instructor.

2.9. RT-qPCR

The RNA of the liver and intestine from each group was extracted using AxyPrep Multisource Total RNA Miniprep Kit (Axygen Scientific, CA, USA). The same amount of RNA was reverse transcribed to cDNA by using Takara PrimeScript TM RT reagent kit (cat. no. RR047A) after evaluated the concentration of total RNA by NanoDrop 1000 spectrophotometer (Thermo scientific Inc, US). Quantitative PCR (qPCR) was performed with TB Green™ Premix Ex Taq™ II (TIi RNaseH Plus, TAKARA Cat#RR820A) on the AriaMx Real-Time PCR System (Agilent, Inc. CA, US). Following cycle program involved 1 cycle at 95 °C for 60 s, then 40 cycles of 95 °C for 5 s, then 59 °C for 60 s, 72 °C for 30 s. The primers were showed in Table 1, and they were synthesized by TSINGKE Biological Technology (Beijing, China).

2.10. Immunohistochemistry

The intestine was dewaxed and washed with PBS, transferred to 3% H2O2 for 25 min to prevent endogenous peroxidase, rinsed, and incubated in a blocking solution (3% TBS) for 30 min at room temperature. Sections were incubated with primary antibodies against ZO-1 and Occludins (OCLN) (1:500) overnight at 4 °C, rinsed, incubated in secondary antibodies-HRP (Servicebio, GB23303 Wuhan, China) for 50 min at room temperature, developed with diaminobenzidine (DAB). immunohistochemistry (IHC) score was evaluated by Image J (National Institutes of Health, Bethesda, MD, USA). A, the immunostaining intensity (negative = 0, low positive = 1, positive = 2, high positive = 3). B, percentage of immunostaining area (0–25% = 1, 26–50% = 2, 51–75% = 3, 76–100% = 4). The final score was the sum of A and B.

2.11. Statistical Analysis

All the data in this work were expressed as means ± SD. Using the SPSS v22.0 (SPSS, Inc., Chicago, IL, USA) to perform one-way analysis of variance (ANOVA) for comparing the results between the different groups. 2−ΔΔCt method was used to analyze the qPCR results. P < 0.05 was considered as significance.

3. Results

3.1. TiO2 NPs Does Not Affect Fructose-Induced Metabolic Syndrome Formation

The experimental design was showed in Figure 1A. After treatment with fructose for 8 weeks, their body weights (BW) did not obviously increase compared with the control (Figure 1B), whereas their murine waistline, epididymal fat/BW, and fasting blood glucose significantly increased (Figure 1C–E). In addition, the mice showed remarkable weakness in glucose tolerance (Figure 1F,G). A significant increase in the cholesterol and triglyceride levels in the serum and liver was also observed (Figure 1H–K). Therefore, the metabolic syndrome model was successfully established. The above physical parameters did not differ between the fructose-only group and TiO2 NPs groups with fructose-exposure (Figure 1).

3.2. TiO2 NPs Aggravated Liver Inflammation Injury in Metabolic Syndrome Mice

Hepatocyte swelling and fat accumulation were found in the fructose-exposure groups, while a slight inflammatory infiltration was illustrated by the TiO2 NPs group (Figure 2A). The TiO2 NPs (20 mg/kg) with fructose-exposure group, exhibited more serious inflammation damage than the fructose-only group (Figure 2B). Compared with the control, after treatment with fructose showed a significant increase in the organ coefficient of liver (Figure 2C). No change was found in the ALT and AST levels of each group (data not shown), but a significant increase in ALP was observed in the fructose-exposure TiO2 NPs group (20 mg/kg) (Figure 2D). Next, the concentration of inflammatory factors in the liver was evaluated. TiO2 NPs induced an increase in the TNF-α, IL-1β, and IL-6 levels in normal mice. In the fructose-exposure groups, the 20 mg/kg TiO2 NPs induced a substantial increase in the TNF-α and IL-1β levels compared with the normal mice and fructose-only group (Figure 2E–G). No change was found in the IL-10 level of each group (Figure 2H). The mRNA expression of the TNF-α, IL6, and TLR-4 in the liver was assessed (Figure 2I–K), and the results revealed that the fructose-exposure TiO2 NPs groups (20 mg/kg) had the most and dramatical upregulated expression of TNF-α and TLR-4 among the 20 mg/kg group and the fructose-only group.

3.3. TiO2 NPs Caused Distinct Liver Fibrosis and Apoptosis in Metabolic Syndrome Mice

The Masson staining image illustrated fibrosis in murine liver from the different groups (Figure 3A). The TiO2 NP group showed a significant increase in Masson blue+ ratio compared with the control. Specially, in the combination of fructose and TiO2 NP treatment groups, 20 mg/kg TiO2 NPs induced the largest ratio among others (Figure 3B). Subsequently, the expression of fibrosis-related genes in the liver was detected (Figure 3C). TiO2 NPs increased fibrosis-related gene expression in the normal mice, with a significant upregulation in vascular endothelial growth factor A (VEGFA), transforming growth factor-β (TGF-β), and interferon gamma (IFN-γ) expression. In the fructose-exposure groups, the 2 mg/kg TiO2 NPs group showed an upregulation of VEGFA and TGF-β, while the 20 mg/kg TiO2 NPs group showed a more intensive expression of VEGFA than the normal mice. The apoptosis-related genes were also investigated. A remarkable increase in the expression of Caspase 3 and Caspase 9 was observed after exposure to TiO2 NPs in normal mice. Among the fructose-exposure groups, the 20 mg/kg TiO2 NPs group exhibited the most significantly upregulated Caspase 3 and Caspase 9, whereas the fructose-only group only showed increased Caspase 9 (Figure 3D).

3.4. TiO2 NPs Exacerbated Liver Oxidative Stress in the Metabolic Syndrome Mice

The results showed a significantly larger amount of Ti and LPS in the fructose-exposure group than in the normal mice after exposure to TiO2 NPs, whereas the fructose-only group showed no differences in hepatic LPS level compared with the control (Figure 4A,B). Next, the oxidative stress in liver was assessed. Compared with the control, TiO2 NPs lead a considerable decrease in the SOD, CAT, and GSH activities in normal mice. However, among the fructose-exposure groups, the 20 mg/kg TiO2 NPs group showed the lowest SOD, CAT, and GSH levels, whereas the fructose-only group demonstrated a decrease in the SOD and CAT levels only (Figure 4C–E). On the contrary, the combination of fructose and TiO2 NPs (especially 20 mg/kg) treatments remarkably increased the concentration of MDA (Figure 4F).

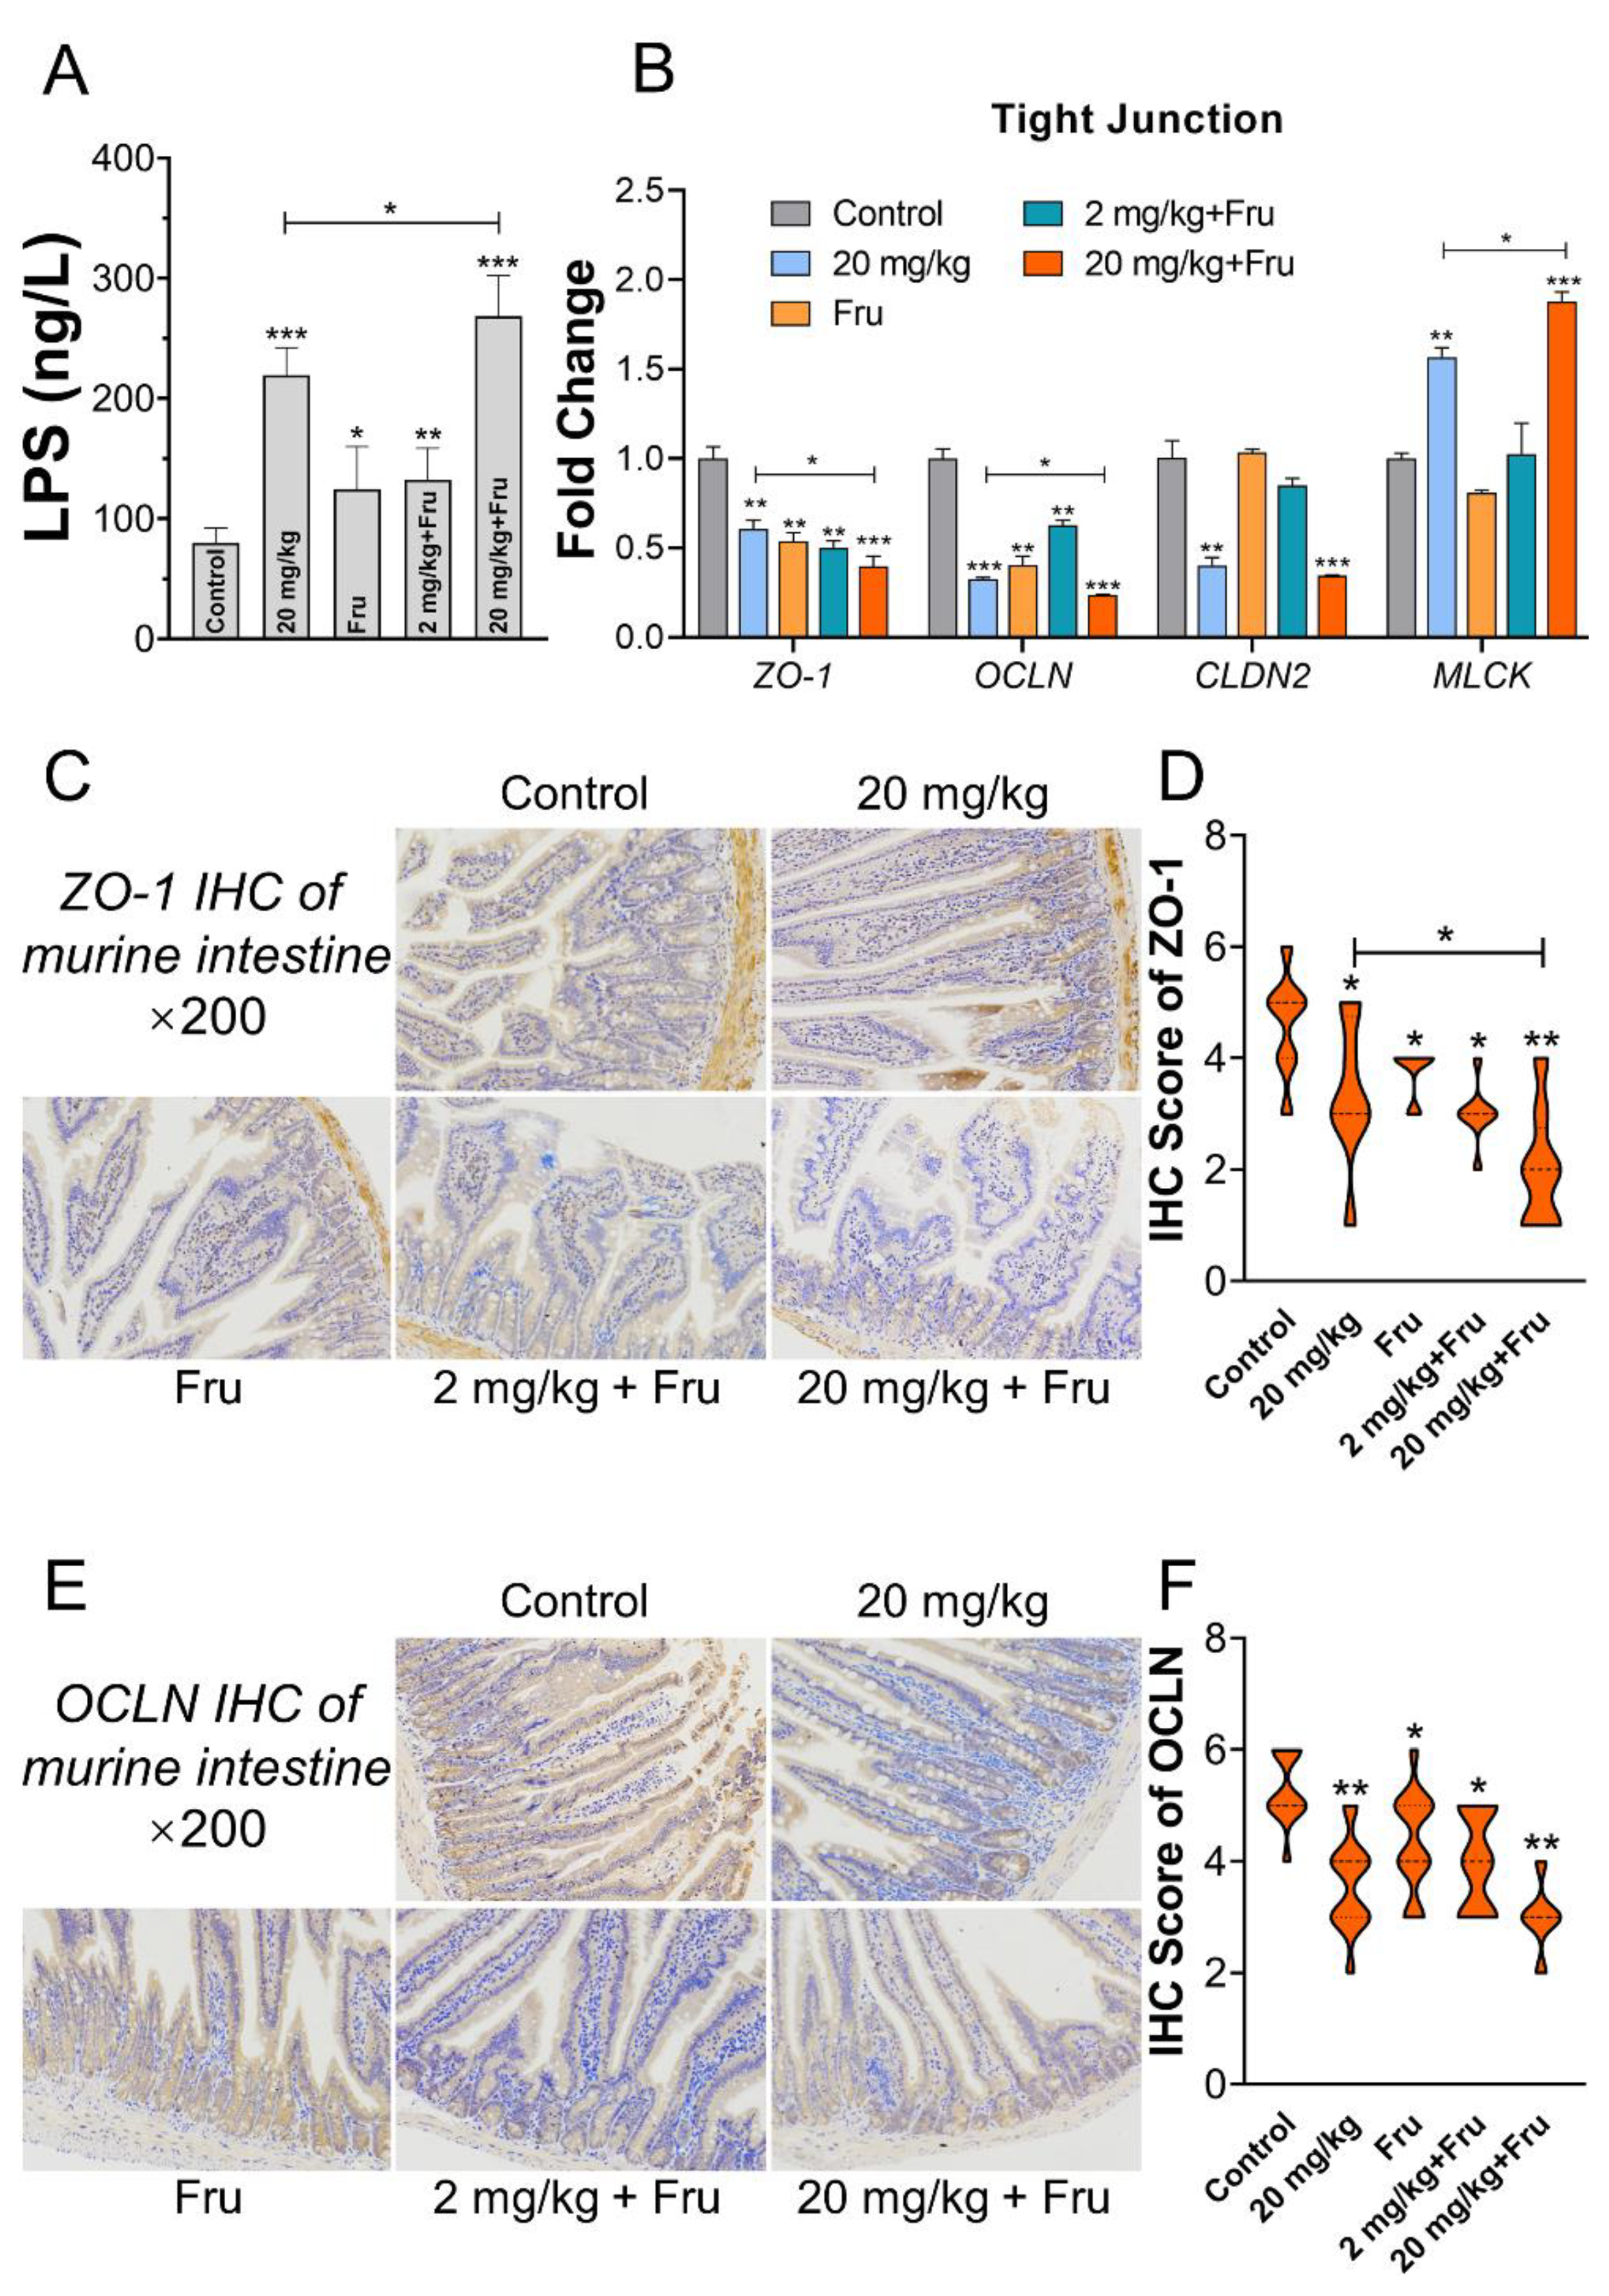
3.5. TiO2 NPs Aggravated Intestinal Permeability Increase in Metabolic Syndrome Mice

Histological analysis of the intestine revealed that TiO2 NPs exposure could lead to villi hypertrophy and crypt disorder in normal and fructose-exposure mice. Reduced inflammatory infiltration and lamina propria mucosae were discovered in all of treatment groups (Figure 5A). The scores of epithelial injury and inflammation are shown in Figure 5B,C. Compared with the control, the experimental groups showed a significant increase in score after exposure to TiO2 NPs or fructose. In particular, the fructose-exposure TiO2 NPs group (20 mg/kg) had the highest score. Next, intestinal permeability was evaluated, and the LPS level in serum was considerably increased after exposure to TiO2 NPs or fructose (Figure 6A). The combination of 20 mg/kg TiO2 NPs and fructose resulted in further increase compared with the normal mice. The expression of tight junction (TJ) target genes in the intestine was further analyzed (Figure 6B), and the results showed that TiO2 NPs or single fructose treatment could downregulate the expression of ZO-1 and OCLN. Among the fructose- exposure groups, the 20 mg/kg TiO2 NP group demonstrated the lowest expression of ZO-1, OCLN, and CLDN2. In addition, TiO2 NPs induced a significant upregulation of MLCK in normal mice and a more obvious one in mice after treatment with fructose. Protein expression was further evaluated via immunohistochemistry. Compared with single exposure, 20 mg/kg TiO2 NPs with fructose resulted in the lowest ZO-1 and OCLN levels. (Figure 6C–F).

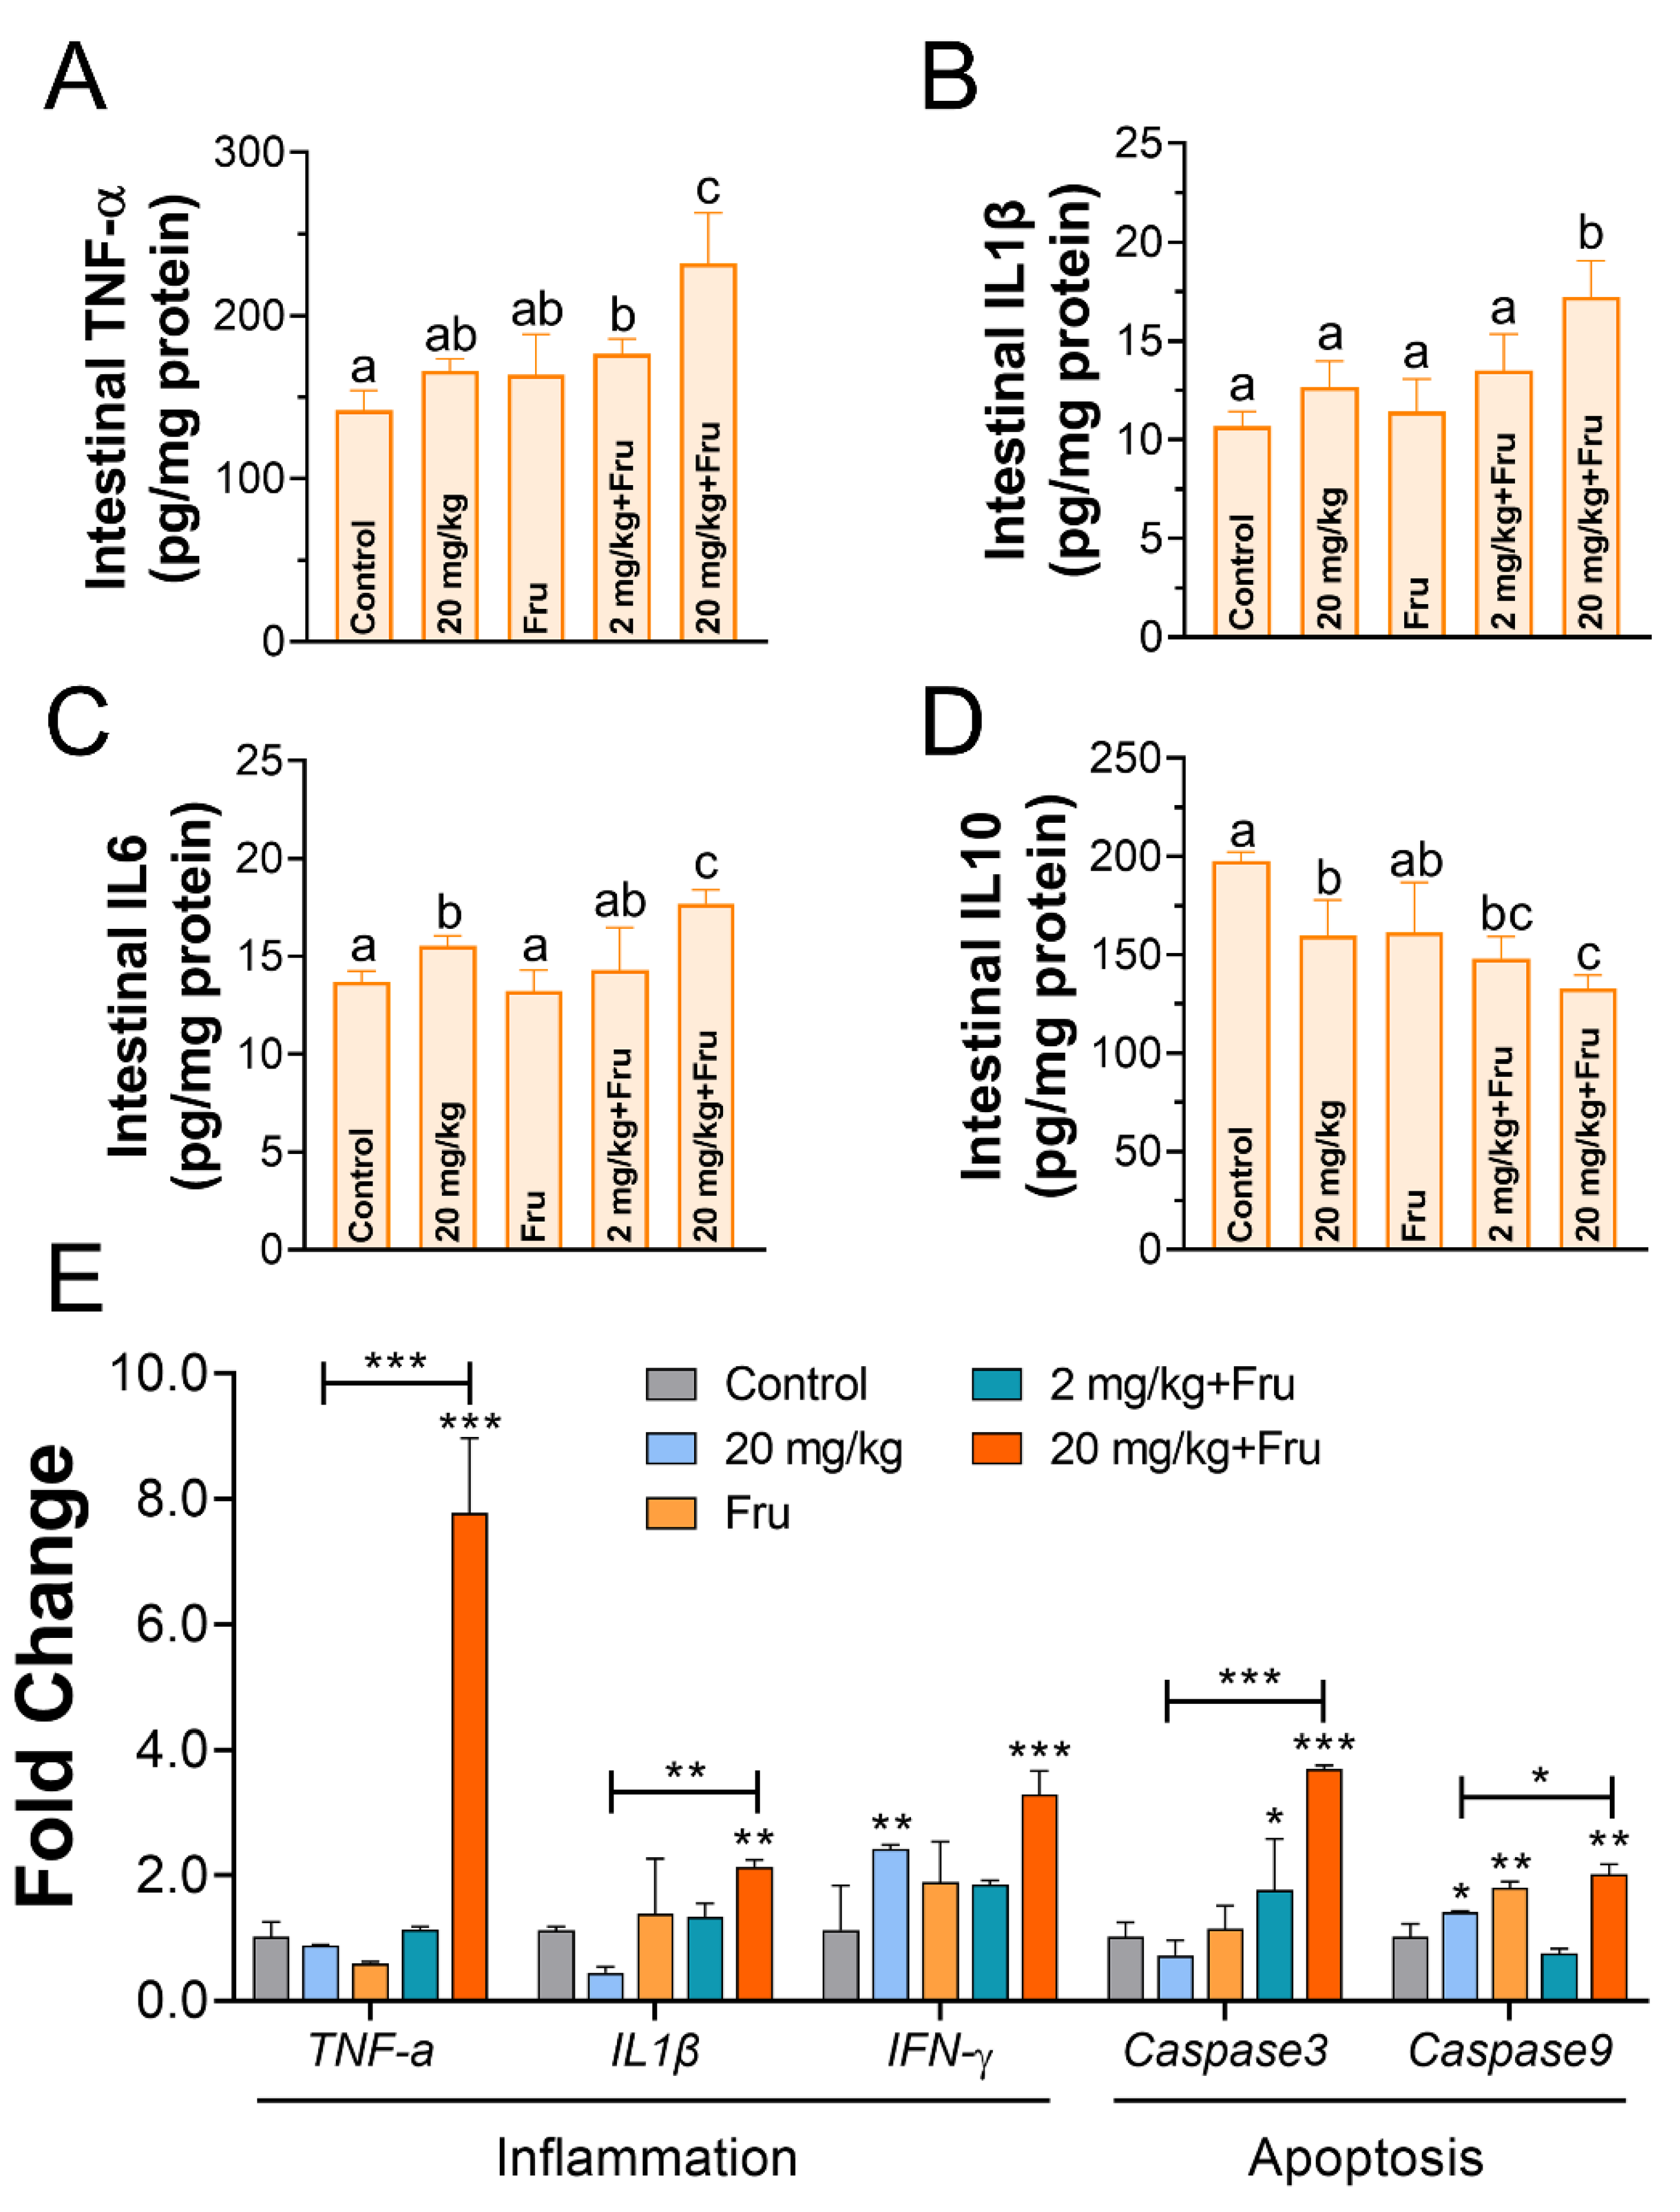
3.6. TiO2 NPs Induced Drastic Intestinal Inflammation in Metabolic Syndrome Mice

The inflammatory change in the intestine was evaluated. The amounts of TNF-α, IL-1β, IL-6, and IL10 were detected using ELISA (Figure 7A–D). Compared to the control, TiO2 NPs just induced evidently increased IL6 level, while decreased IL10 in normal mice. Among the fructose-exposure groups, the fructose single group showed no difference, whereas the TiO2 NPs group demonstrated a considerable increase in the TNF-α, IL-1β, and IL-6 levels and a decrease in the IL-10 level. The expression of inflammation-related and apoptosis-related genes was also detected (Figure 7E), compared to the normal mice, A substantial upregulation in the expression levels of TNF-α, IL-1β, and IFN-γ and Caspase 3 and Caspase 9 in the fructose-exposure TiO2 NPs group (20 mg/kg) was observed compared with that in the normal mice.

3.7. TiO2 NPs Excavated Intestinal Oxidative Stress in Metabolic Syndrome Mice

The oxidative stress in the intestine was evaluated in the different groups (Figure 8A–D). TiO2 NPs decreased the SOD and GSH activities in the normal mice compared with those in the control. Among the fructose-exposure groups, the fructose single group exhibited alteration in SOD and CAT, while 2 mg/kg TiO2 NPs induced a significant decrease in the GSH activity and a significant increase in the MDA activity compared with the control. More importantly, 20 mg/kg TiO2 NPs group showed the most substantial and obvious alteration in the SOD, CAT, GSH, and MDA levels.

4. Discussion

According to the definition of the metabolic syndrome and previous study [22], the metabolic syndrome model was built success in our work. No change of the body weight was observed, and this result was consistent with Cho et al. [23] who found that fructose did not result in significant weight gain for mice. Moreover, the body indicators with no difference between fructose-alone group and combine fructose and TiO2 NPs group, which manifested that TiO2 NPs aggravate liver injury but not due to change in body weight, glucose tolerance, or liver lipid accumulation.
In this work, slight portal vein and tissue inflammatory infiltration was observed in the normal mice after exposure to TiO2 NPs, or the metabolic syndrome mice. These results were consistent with those of previous studies [24]. However, no changes in liver coefficient and enzyme activity were found in normal mice after exposure to TiO2 NPs, indicating the limited influence of TiO2 NPs to the healthy body. These results were similar with Yang et al. and Yao et al. [25,26], The higher level of the inflammatory cytokines of TNF-α, IL1β, IL6, and TLR-4 revealed that high-dose TiO2 NPs induced more serious inflammatory liver injury in metabolic syndrome mice.
Persistent or chronic inflammation could lead to fibrosis and apoptosis. Hong et al. [27] fed 10 mg/kg TiO2 NPs to mice for 9 months, the hepatic inflammation and fibrosis were observed. In this work, liver fibrosis and apoptosis were investigated. The collagenous fiber was distinguished as blue by Masson staining. No change was observed in the fructose-only group, which indicating that TiO2 NPs triggered liver fibrosis but not fructose. VEGFA, TGF-β, and IFN-γ are three classic factors that reflect the pathological development of fibrosis [28]. No difference in gene expression was observed in metabolic syndrome mice. This result was consistent with that of Cho et al. [23], who demonstrated that feeding fructose for 8 weeks did not induce fibrosis in mice. In the present study, TiO2 NPs boosted the development of fibrosis in metabolic syndrome mice, and this finding could be explained by the aggravated inflammatory reaction by TiO2 NPs. A TiO2 NP-exposure safety assessment in the healthy mice was performed by Cui et al. [29], the apoptotic liver cell was turned to observed in the dose of 10 mg/kg and 50 mg/kg. Moreover, TiO2 NPs could stimulate liver cell stress response and induce cell oxidative stress [30]. Then, it caused the release of mitochondrial cytochromes c which has regarded as an apoptosis-inducing factor. Cytochromes c could form the apoptosome by binding to the Apaf-1 (apoptotic protease activating factor-1), Caspase 9 precursors and ATP/dATP (adenosine triphosphate/deoxyadenosine triphosphate) then call and activate Caspase 3, thus triggering the caspase cascade reaction, which could degrade the proteins in cell and lead cell apoptosis [31]. In our works, the expression change in Caspase 3 and Caspase 9 was evaluated. High-dose TiO2 NPs could heighten their expression of in metabolic syndrome mice than normal one, these results are a further proof of the TiO2 NP aggravated hepatotoxicity in the metabolic syndrome mice.
Adverse effects in liver after exposure TiO2 NPs have been reported in healthy mice. Hong et al. [32] showed 10 mg/kg BW TiO2 NPs caused histopathological changes including inflammatory infiltration and local hepatocyte necrosis. Talamini et al. [33] demonstrated repeated administration of 5 mg/kg BW foodborne TiO2 NPs could deposit in liver and stimulate molecular and cellular change in the inflammatory respond. As for fructose, which is a major risk factor for the development of metabolic syndrome diseases [16], Bergheim et al. [24] let mice free access to drink containing 30% fructose for 8 weeks, fat accumulation, and lipid peroxidation factors expression were significantly higher. In a word, both the TiO2 NPs and fructose would cause mild inflammation and liver dysfunction in normal mice, TiO2 NPs are active exogenous chemicals that could stimulate immunological stress in the body, and fructose could accelerate the accumulation of lipids and ROS and cause liver oxidative stress and inflammatory damage [16]. Meanwhile, oxidative stress is a major factor that stimulates inflammation and apoptotic signaling pathways [34]. Studies have also shown that TiO2 NPs could cause organ injury by activating oxidative stress [35]. Therefore, the synergetic effect of TiO2 NPs and fructose on oxidative stress was evaluated in the present study. This effect was possibly the immediate reason why TiO2 NPs intensify the liver damage in metabolic syndrome mice. SOD, CAT, and GSH are three typical antioxidant enzymes, and MDA is the product of lipid oxidation. The fluctuation of their level could reflect body oxidative stress response. As expected, high-dose TiO2 NPs led to the most considerable effect of oxidative stress in metabolic syndrome mice than other mice, indicating that metabolic syndrome mice are more susceptible to TiO2 NPs. Because the TiO2 NPs and LPS levels in metabolic syndrome mice were higher than normal mice under the same dosage of TiO2 NPs.
The serum LPS level is known to reflect the change in intestinal permeability. The results of this study suggested that TiO2 NPs caused more severe intestinal permeability in metabolic syndrome mice. After oral administration of TiO2 NPs, they could damage and pass through the intestinal barrier. Then, they arrive and stay in the organs or tissues and trigger adverse effects. Chen et al. [36] reported that TiO2 NPs could induce hepatotoxicity by the indirect pathway of gut-liver axis, such as lead LPS level increased in gut, which as a crucial factor participate in subsequent liver damage. In addition, fructose feeding could promote gut leakage in mice [23]. Therefore, the intestinal barriers were under worsened condition in metabolic syndrome mice after exposure to TiO2 NPs in this work.
Then, we further investigated the influence of the intestinal barrier in metabolic syndrome mice after TiO2 NPs exposure. The intestinal physical barrier is mainly composed of epithelial cell and its tight junction. The H&E results demonstrated that TiO2 NPs induced more obvious luminal epithelium disorder and inflammation in metabolic syndrome mice than in other mice. ZO-1, OCLN, and CLDN2 were indispensable to the organization and stability of TJ, and MLCK upregulation could cause MLC phosphorylation and actin contraction, which may result in splayed paracellular channel [37]. In the present study, the TiO2 NPs or fructose-only groups showed an alteration in the expression of these genes or proteins. This finding was consistent with that of previous studies [23]. Importantly, high-dose TiO2 NPs led to more obvious fluctuation of the expression of TJ-related genes or proteins. These results suggested that the intestinal physical barrier of the metabolic syndrome mice suffered from worsened damage after exposure to TiO2 NPs.
Researchers showed that overproduce inflammatory cytokines such as TNF-α, IL-1β, and IFN-γ could decrease the amounts of TJ-related proteins [38]. The intestinal inflammatory response was assessed, in the normal mice, and a slight inflammation was observed after exposure TiO2 NPs, and this discovery was similar with Mu et al. [20]. Moreover, the apoptosis-related genes under a high expression level, which also have closely connected to the TJ barrier homeostasis [39]. These results suggested that TiO2 NPs triggered severer immune inflammatory response in metabolic syndrome mice’s intestine, which induced subsequent worse intestine and liver injury. Toxic effects came from TiO2 NPs-induced ROS in intestinal epithelial cell was confirmed by previous study [40]. Furthermore, we explored the gut oxidative stress effect of which probably was the initial reason stimulate inflammation. In our works, whatever TiO2 NPs and fructose exposure alone could cause mild oxidative stress. However, TiO2 NPs aggravated oxidative stress in metabolic syndrome mice, which possible because fructose exposure leads the intestines being subject to long-term low inflammation and oxidative stress response, and this semi-pathological state made mice more sensitive and more easily impacted by TiO2 NPs. Therefore, the fructose-induced metabolic syndrome mice’s intestine would suffer more damage after exposure TiO2 NPs than normal healthy mice.

5. Conclusions

In summary, the connections among the severe toxicities of exposure to TiO2 NPs in the liver and intestinal barrier were assessed in fructose-induced metabolic syndrome mice. No change was found after low-dose TiO2 NPs were administered. However, serious hepatic inflammation, fibrosis, and apoptosis were observed in high-dose intake of TiO2 NPs due to more drastic oxidative stress in the liver. Moreover, TiO2 NPs exacerbated the increase in intestinal permeability and inflammatory response through exacerbating oxidative stress, thereby leading to increased TiO2 NPs and LPS being transferred to the liver and aggravating hepatic injury in metabolic syndrome mice. These results suggested that the metabolic syndrome population should be given further attention in terms of the hazard of TiO2 NPs to their health.

Author Contributions

Conceptualization, H.X. and Y.Z.; Methodology, Y.Z.; Software, Y.Z. and Y.T.; Validation, Y.Z., Y.T. and S.L.; Formal analysis, Y.Z., Y.T. and S.L.; Investigation, S.L. and T.J.; Resources, H.X.; Data curation, H.X.; Writing—original draft preparation, Y.Z.; Writing—review and editing, H.X. and D.Z.; Visualization, H.X.; Supervision, H.X.; Project administration, H.X.; Funding acquisition, H.X. and D.Z. All authors have read and agreed to the published version of the manuscript.

Funding

This work was supported by National Natural Science Foundation of China (82060606), and Natural Science Foundation of Ningbo, China (2017C50034).

Data Availability Statement

The data presented in this study are available in this article.

Conflicts of Interest

The authors declare no conflict of interest.

References

  1. Lan, Y.; Lu, Y.; Ren, Z. Mini review on photocatalysis of titanium dioxide nanoparticles and their solar applications. Nano Energy 2013, 2, 1031–1045. [Google Scholar] [CrossRef]
  2. Chen, S.; Guo, Y.; Zhong, H.; Chen, S.; Li, J.; Ge, Z.; Tang, J. Synergistic antibacterial mechanism and coating application of copper/titanium dioxide nanoparticles. Chem. Eng. J. 2014, 256, 238–246. [Google Scholar] [CrossRef]
  3. Baranowska-Wójcik, E.; Szwajgier, D.; Oleszczuk, P.; Winiarska-Mieczan, A. Effects of Titanium Dioxide Nanoparticles Exposure on Human Health—A Review. Biol. Trace Elem. Res. 2020, 193, 118–129. [Google Scholar] [CrossRef] [PubMed] [Green Version]
  4. Yusoff, R.; Kathawala, M.H.; Nguyen, L.T.; Setyawati, M.I.; Chiew, P.; Wu, Y.; Ch’Ng, A.L.; Wang, Z.M.; Ng, K.W. Biomolecular interaction and kinematics differences between P25 and E171 TiO2 nanoparticles. NanoImpact 2018, 12, 51–57. [Google Scholar] [CrossRef]
  5. Luo, K.; Park, H.; Adra, H.J.; Ryu, J.; Lee, J.H.; Yu, J.; Choi, S.J.; Kim, Y.R. Charge-switchable magnetic separation and characterization of food additive titanium dioxide nanoparticles from commercial food. J. Hazard. Mater. 2020, 393, 122483. [Google Scholar] [CrossRef] [PubMed]
  6. Fiordaliso, F.; Foray, C.; Salio, M.; Salmona, M.; Diomede, L. Realistic Evaluation of Titanium Dioxide Nanoparticle Exposure in Chewing Gum. J. Agric. Food Chem. 2018, 66, 6860–6868. [Google Scholar] [CrossRef] [PubMed]
  7. Li, X.; Zhang, Y.; Li, B.; Cui, J.; Gao, N.; Sun, H.; Meng, Q.; Wu, S.; Bo, J.; Yan, L.; et al. Prebiotic protects against anatase titanium dioxide nanoparticles-induced microbiota-mediated colonic barrier defects. NanoImpact 2019, 14, 100164. [Google Scholar] [CrossRef]
  8. Brun, E.; Barreau, F.; Veronesi, G.; Fayard, B.; Sorieul, S.; Chanéac, C.; Carapito, C.; Rabilloud, T.; Mabondzo, A.; Herlin-Boime, N.; et al. Titanium dioxide nanoparticle impact and translocation through ex vivo, in vivo and in vitro gut epithelia. Part. Fibre Toxicol. 2014, 11, 13. [Google Scholar] [CrossRef] [Green Version]
  9. Proquin, H.; Rodríguez-Ibarra, C.; Moonen, C.G.J.; Ortega, I.M.U.; Briedé, J.J.; De Kok, T.M.; Van Loveren, H.; Chirino, Y.I. Titanium dioxide food additive (E171) induces ROS formation and genotoxicity: Contribution of micro and nano-sized fractions. Mutagen 2017, 32, 139–149. [Google Scholar] [CrossRef] [Green Version]
  10. Abbasi-Oshaghi, E.; Mirzaei, F.; Pourjafar, M. NLRP3 inflammasome, oxidative stress, and apoptosis induced in the intestine and liver of rats treated with titanium dioxide nanoparticles: In vivo and in vitro study. Int. J. Nanomed. 2019, 14, 1919–1936. [Google Scholar] [CrossRef] [Green Version]
  11. Ammendolia, M.G.; Iosi, F.; Maranghi, F.; Tassinari, R.; Cubadda, F.; Aureli, F.; Raggi, A.; Superti, F.; Mantovani, A.; De Berardis, B. Short-term oral exposure to low doses of nano-sized TiO2 and potential modulatory effects on intestinal cells. Food Chem. Toxicol. 2017, 102, 63–75. [Google Scholar] [CrossRef] [PubMed]
  12. Setyawati, M.I.; Tay, C.Y.; Leong, D.T. Mechanistic Investigation of the Biological Effects of SiO(2), TiO(2), and ZnO Nanoparticles on Intestinal Cells. Small 2015, 11, 3458–3468. [Google Scholar] [CrossRef] [PubMed]
  13. Ruiz, P.A.; Morón, B.; Becker, H.M.; Lang, S.; Atrott, K.; Spalinger, M.R.; Scharl, M.; Wojtal, K.A.; Fischbeck-Terhalle, A.; Frey-Wagner, I.; et al. Titanium dioxide nanoparticles exacerbate DSS-induced colitis: Role of the NLRP3 inflammasome. Gut 2017, 66, 1216–1224. [Google Scholar] [CrossRef] [PubMed] [Green Version]
  14. Mishra, V.; Baranwal, V.; Mishra, R.K.; Sharma, S.; Paul, B.; Pandey, A.C. Titanium dioxide nanoparticles augment allergic airway inflammation and Socs3 expression via NF-kappaB pathway in murine model of asthma. Biomaterials 2016, 92, 90–102. [Google Scholar] [CrossRef]
  15. Younossi, Z.; Anstee, Q.M.; Marietti, M.; Hardy, T.; Henry, L.; Eslam, M.; George, J.; Bugianesi, E. Global burden of NAFLD and NASH: Trends, predictions, risk factors and prevention. Nat. Rev. Gastroenterol. Hepatol. 2018, 15, 11–20. [Google Scholar] [CrossRef] [PubMed]
  16. Lim, J.S.; Mietus-Snyder, M.; Valente, A.; Schwarz, J.-M.; Lustig, R.H. The role of fructose in the pathogenesis of NAFLD and the metabolic syndrome. Nat. Rev. Gastroenterol. Hepatol. 2010, 7, 251–264. [Google Scholar] [CrossRef]
  17. Buzzetti, E.; Pinzani, M.; Tsochatzis, E.A. The multiple-hit pathogenesis of non-alcoholic fatty liver disease (NAFLD). Metabolism 2016, 65, 1038–1048. [Google Scholar] [CrossRef]
  18. Marchesini, G.; Bugianesi, E.; Forlani, G.; Cerrelli, F.; Lenzi, M.; Manini, R.; Natale, S.; Vanni, E.; Villanova, N.; Melchionda, N.; et al. Nonalcoholic fatty liver, steatohepatitis, and the metabolic syndrome. Hepatology 2003, 37, 917–923. [Google Scholar] [CrossRef]
  19. Dudefoi, W.; Moniz, K.; Allen-Vercoe, E.; Ropers, M.H.; Walker, V.K. Impact of food grade and nano-TiO2 particles on a human intestinal community. Food Chem. Toxicol. 2017, 106, 242–249. [Google Scholar] [CrossRef] [PubMed]
  20. Mu, W.; Wang, Y.; Huang, C.; Fu, Y.; Li, J.; Wang, H.; Jia, X.; Ba, Q. Effect of Long-Term Intake of Dietary Titanium Dioxide Nanoparticles on Intestine Inflammation in Mice. J. Agric. Food Chem. 2019, 67, 9382–9389. [Google Scholar] [CrossRef]
  21. Zhao, Y.; Tang, Y.; Chen, L.; Lv, S.; Liu, S.; Nie, P.; Aguilar, Z.P.; Xu, H. Restraining the TiO2 nanoparticles-induced intestinal inflammation mediated by gut microbiota in juvenile rats via ingestion of Lactobacillus rhamnosus GG. Ecotoxicol. Environ. Saf. 2020, 206, 111393. [Google Scholar] [CrossRef] [PubMed]
  22. Volynets, V.; Spruss, A.; Kanuri, G.; Wagnerberger, S.; Bischoff, S.C.; Bergheim, I. Protective effect of bile acids on the onset of fructose-induced hepatic steatosis in mice. J. Lipid Res. 2010, 51, 3414–3424. [Google Scholar] [CrossRef] [Green Version]
  23. Cho, Y.; Kim, D.; Seo, W.; Gao, B.; Yoo, S.; Song, B. Fructose Promotes Leaky Gut, Endotoxemia, and Liver Fibrosis Through Ethanol-Inducible Cytochrome P450-2E1–Mediated Oxidative and Nitrative Stress. Hepatology 2019. [Google Scholar] [CrossRef] [PubMed]
  24. Bergheim, I.; Weber, S.; Vos, M.; Krämer, S.; Volynets, V.; Kaserouni, S.; McClain, C.J.; Bischoff, S.C. Antibiotics protect against fructose-induced hepatic lipid accumulation in mice: Role of endotoxin. J. Hepatol. 2008, 48, 983–992. [Google Scholar] [CrossRef]
  25. Yang, J.; Luo, M.; Tan, Z.; Dai, M.; Xie, M.; Lin, J.; Hua, H.; Ma, Q.; Zhao, J.; Liu, A. Oral administration of nano-titanium dioxide particle disrupts hepatic metabolic functions in a mouse model. Environ. Toxicol. Pharmacol. 2017, 49, 112–118. [Google Scholar] [CrossRef] [PubMed]
  26. Yao, L.; Tang, Y.; Chen, B.; Hong, W.; Xu, X.; Liu, Y.; Aguilar, Z.P.; Xu, H. Oral exposure of titanium oxide nanoparticles induce ileum physical barrier dysfunction via Th1/Th2 imbalance. Environ. Toxicol. 2020, 35, 982–990. [Google Scholar] [CrossRef]
  27. Hong, F.; Ji, J.; Ze, X.; Zhou, Y.; Ze, Y. Liver Inflammation and Fibrosis Induced by Long-Term Exposure to Nano Titanium Dioxide (TiO2) Nanoparticles in Mice and Its Molecular Mechanism. J. Biomed. Nanotechnol. 2020, 16, 616–625. [Google Scholar] [CrossRef] [PubMed]
  28. Kennedy, L.; Francis, H.; Invernizzi, P.; Venter, J.; Wu, N.; Carbone, M.; Gershwin, M.E.; Bernuzzi, F.; Franchitto, A.; Alvaro, D.; et al. Secretin/secretin receptor signaling mediates biliary damage and liver fibrosis in early-stage primary biliary cholangitis. FASEB J. 2019, 33, 10269–10279. [Google Scholar] [CrossRef] [PubMed] [Green Version]
  29. Cui, Y.; Gong, X.; Duan, Y.; Li, N.; Hu, R.; Liu, H.; Hong, M.; Zhou, M.; Wang, L.; Wang, H.; et al. Hepatocyte apoptosis and its molecular mechanisms in mice caused by titanium dioxide nanoparticles. J. Hazard. Mater. 2010, 183, 874–880. [Google Scholar] [CrossRef]
  30. Shukla, R.K.; Kumar, A.; Pandey, A.K.; Singh, S.S.; Dhawan, A. Titanium dioxide nanoparticles induce oxidative stress-mediated apoptosis in human keratinocyte cells. J. Biomed. Nanotechnol. 2011, 7, 100–101. [Google Scholar] [CrossRef]
  31. Slee, E.A.; Harte, M.T.; Kluck, R.M.; Wolf, B.B.; Casiano, C.A.; Newmeyer, D.D.; Wang, H.-G.; Reed, J.C.; Nicholson, D.W.; Alnemri, E.S.; et al. Ordering the Cytochrome c–initiated Caspase Cascade: Hierarchical Activation of Caspases-2, -3, -6, -7, -8, and -10 in a Caspase-9–dependent Manner. J. Cell Biol. 1999, 144, 281–292. [Google Scholar] [CrossRef] [PubMed]
  32. Hong, J.; Wang, L.; Zhao, X.; Yu, X.; Sheng, L.; Xu, B.; Liu, D.; Zhu, Y.; Long, Y.; Hong, F. Th2 Factors May Be Involved in TiO2 NP-Induced Hepatic Inflammation. J. Agric. Food Chem. 2014, 62, 6871–6878. [Google Scholar] [CrossRef]
  33. Talamini, L.; Gimondi, S.; Violatto, M.B.; Fiordaliso, F.; Pedica, F.; Tran, N.L.; Sitia, G.; Aureli, F.; Raggi, A.; Nelissen, I.; et al. Repeated administration of the food additive E171 to mice results in accumulation in intestine and liver and promotes an inflammatory status. Nanotoxicology 2019, 13, 1087–1101. [Google Scholar] [CrossRef]
  34. Liguori, I.; Russo, G.; Curcio, F.; Bulli, G.; Aran, L.; Della-Morte, D.; Gargiulo, G.; Testa, G.; Cacciatore, F.; Bonaduce, D.; et al. Oxidative stress, aging, and diseases. Clin. Interv. Aging 2018, 13, 757–772. [Google Scholar] [CrossRef] [PubMed] [Green Version]
  35. He, Q.; Zhou, X.; Liu, Y.; Gou, W.; Cui, J.; Li, Z.; Wu, Y.; Zuo, D. Titanium dioxide nanoparticles induce mouse hippocampal neuron apoptosis via oxidative stress- and calcium imbalance-mediated endoplasmic reticulum stress. Environ. Toxicol. Pharmacol. 2018, 63, 6–15. [Google Scholar] [CrossRef] [PubMed]
  36. Chen, Z.; Zhou, D.; Han, S.; Zhou, S.; Jia, G. Hepatotoxicity and the role of the gut-liver axis in rats after oral administration of titanium dioxide nanoparticles. Part. Fibre Toxicol. 2019, 16, 1–17. [Google Scholar] [CrossRef] [PubMed]
  37. Su, L.; Nalle, S.C.; Shen, L.; Turner, E.S.; Singh, G.; Breskin, L.A.; Khramtsova, E.A.; Khramtsova, G.; Tsai, P.; Fu, Y.; et al. TNFR2 Activates MLCK-Dependent Tight Junction Dysregulation to Cause Apoptosis-Mediated Barrier Loss and Experimental Colitis. Gastroenterology 2013, 145, 407–415. [Google Scholar] [CrossRef] [Green Version]
  38. Li, Q.; Zhang, Q.; Wang, M.; Zhao, S.; Ma, J.; Luo, N.; Li, N.; Li, Y.; Xu, G.; Li, J. Interferon-γ and tumor necrosis factor-α disrupt epithelial barrier function by altering lipid composition in membrane microdomains of tight junction. Clin. Immunol. 2008, 126, 67–80. [Google Scholar] [CrossRef]
  39. Cho, Y.-E.; Yu, L.-R.; Abdelmegeed, M.A.; Yoo, S.-H.; Song, B.-J. Apoptosis of enterocytes and nitration of junctional complex proteins promote alcohol-induced gut leakiness and liver injury. J. Hepatol. 2018, 69, 142–153. [Google Scholar] [CrossRef]
  40. Song, Z.M.; Chen, N.; Liu, J.H.; Tang, H.; Deng, X.; Xi, W.S.; Han, K.; Cao, A.; Liu, Y.; Wang, H. Biological effect of food additive titanium dioxide nanoparticles on intestine: An in vitro study. J. Appl. Toxicol. 2015, 35, 1169–1178. [Google Scholar] [CrossRef] [PubMed]
Figure 1. Fructose could induce metabolic syndrome after experiment. (A) Experimental design. (BD) Murine body weight, waistline, epididymal fat ratio, fasting blood-glucose after 8-weeks exposure. (F) Blood glucose level in OGTT (n = 4 mice/group). (G) Glucose area under the curve (AUC). (H,I) The concentration of cholesterol and triglycerides in serum. (J,K) The concentration of cholesterol and triglycerides in liver. n = 8~10. One-way ANOVA, different superscript alphabets represent significance between each group and ** p < 0.01, *** p < 0.001, versus the control group.
Foods 10 00986 g001
Figure 2. TiO2 NPs aggravated hepatic inflammatory injury in metabolic syndrome mice. (A) H&E staining of murine livers, the black luminous arrow indicated inflammatory cell infiltration. (B) the score of inflammation for H&E staining of livers (every staining slide randomly selected three different views to evaluated scores). (C) Hepatic viscera coefficient, liver (mg) divide body weight (g) (n = 8~10 mice/group). (D) the level of alkaline phosphatase (ALP) in serum. (EH) The concentration of tumor necrosis factor α (TNF-α), Interleukin (IL) 1β, IL 6, and IL 10 in liver. (IK) the mRNA expression levels of TNF-α, IL 6, and TLR-4 in liver. n = 5/ group. One-way ANOVA, different superscript alphabets represent significance between each group and * p < 0.05, ** p < 0.01, *** p < 0.001 versus control or between two specific groups.
Foods 10 00986 g002
Figure 3. TiO2 NPs induced more obvious hepatic fibrosis and apoptosis in metabolic syndrome mice. (A) Masson staining of murine livers. (B) The quantities of Masson blue area ratio (every staining slide randomly selected three different views to evaluated scores). (C) The mRNA expression level of fibrosis factors in liver. (D) The mRNA expression level of apoptosis factors in liver. n = 5/group. One-way ANOVA, * p < 0.05, ** p < 0.01, *** p < 0.001 versus control or between two specific groups.
Foods 10 00986 g003
Figure 4. TiO2 NPs induced intensified oxidative stress in metabolic syndrome mice. (A) The amounts of Ti element in liver. (B) The concentration of lipopolysaccharide (LPS) in liver. (CE) The activity of the SOD, CAT, GSH in liver. (F) The level of the MDA in the liver. n = 5/group. One-way ANOVA, different superscript alphabets represent significance between each group and * p < 0.05, ** p < 0.01, *** p < 0.001 versus control or between two specific groups.
Foods 10 00986 g004
Figure 5. TiO2 NPs caused more serious intestinal structure damage in metabolic syndrome mice. (A) The H&E staining of intestine, the black circle indicated local mucous lamina propria is disordered, the red circle distinguished inflammatory infiltration. (B,C) The score of epithelial injury and inflammation (every staining slide randomly selected three different views to evaluated scores). n = 5/group. One-way ANOVA, * p < 0.05, ** p < 0.01, *** p < 0.001 versus control or between two specific groups.
Foods 10 00986 g005
Figure 6. TiO2 NPs induced more obvious intestinal permeability increase in metabolic syndrome mice. (A) The level of LPS in serum. (B) the mRNA expression level of tight junction (TJ)-related protein in the intestine. (C) ZO-1 immunohistochemical staining of murine intestine. (D) The score of ZO-1 immunohistochemical staining (every staining slide randomly selected three different views to evaluated scores). (E) OCLN immunohistochemical staining of murine intestine. (F) The score of OCLN immunohistochemical staining (every staining slide randomly selected three different views to evaluated scores). n = 5/group. One-way ANOVA, * p < 0.05, ** p < 0.01, *** p < 0.001 versus control or between two specific groups.
Foods 10 00986 g006
Figure 7. TiO2 NPs lead more severe intestinal inflammatory response in metabolic syndrome mice. (AD) The concentration of the TNF-α, IL 1β, IL 6, and IL 10 in the intestine. (E) The mRNA expression level of inflammatory and apoptosis factors in the intestine. n = 5/group. One-way ANOVA, different superscript alphabets represent significance between each group and * p < 0.05, ** p < 0.01, *** p < 0.001 versus control or between two specific groups.
Foods 10 00986 g007
Figure 8. TiO2 NPs stimulated stronger oxidative stress in metabolic syndrome mice. (AC) the activity of SOD, CAT, and GSH in the intestine. (D) the concentration of the MDA in the intestine. n = 5/group. One-way ANOVA, different superscript alphabets represent significance between each group.
Foods 10 00986 g008
Table 1. Primers of genes for RT-qPCR.
GenePrimerSequence (5′~3′)
TNF-αForwardCTGAACTTCGGGGTGATCGG
ReverseGGCTTGTCACTCGAATTTTGAGA
IL-1βForwardGCAACTGTTCCTGAACTCAACT
ReverseATCTTTTGGGGTCCGTCAACT
IL-6ForwardACAAGAAAGACAAAGCCAGAGT
ReverseGGAAATTGGGGTAGGAAGGAC
TLR-4ForwardCTGTATTCCCTCAGCACTCTTGATT
ReverseTGCTTCTGTTCCTTGACCCACT
VEGFAForwardAGCCAAATTGGGGTTGAGGGT
ReverseGGAGCAAAGGTCACGAAAGCAG
TGF-βForwardGTCACTGGAGTTGTACGGCA
ReverseTCATGTCATGGATGGTGCCC
IFN-γForwardAGACAATCAGGCCATCAGCA
ReverseTGGACCTGTGGGTTGTTGAC
Caspase3ForwardGGAGGCTGACTTCCTGTATGCTT
ReverseCCTGTTAACGCGAGTGAGAATG
Caspase9ForwardAAGAAGACCGGAGTGCAATG
ReverseCATGACAGGATTATACAACCGC
ZO-1ForwardGCCGCTAAGAGCACAGCAA
ReverseTCCCCACTCGAAAATGAGGA
OCLNForwardTTGAAAGTCCACCTCCTTACAGA
ReverseCCGGATAAAAAGAGTACGCTGG
CLDN2ForwardCTGCCAGGATTCTCGAGCTA
ReverseCCCAAGTACAGAGCCTCTCC
MLCKForwardTGCTTCTGACATACGGAGTT
ReverseGACATTGAAAGAGGTGCTG
GAPDHForwardATGTGTCCGTCGTGGATCTG
ReverseGCCGTATTCATTGTCATACCAGG
Publisher’s Note: MDPI stays neutral with regard to jurisdictional claims in published maps and institutional affiliations.

