
Cold Brew Coffee—Pilot Studies on Definition, Extraction, Consumer Preference, Chemical Characterization and Microbiological Hazards


 ,
, 
Abstract
1. Introduction
2. Materials and Methods
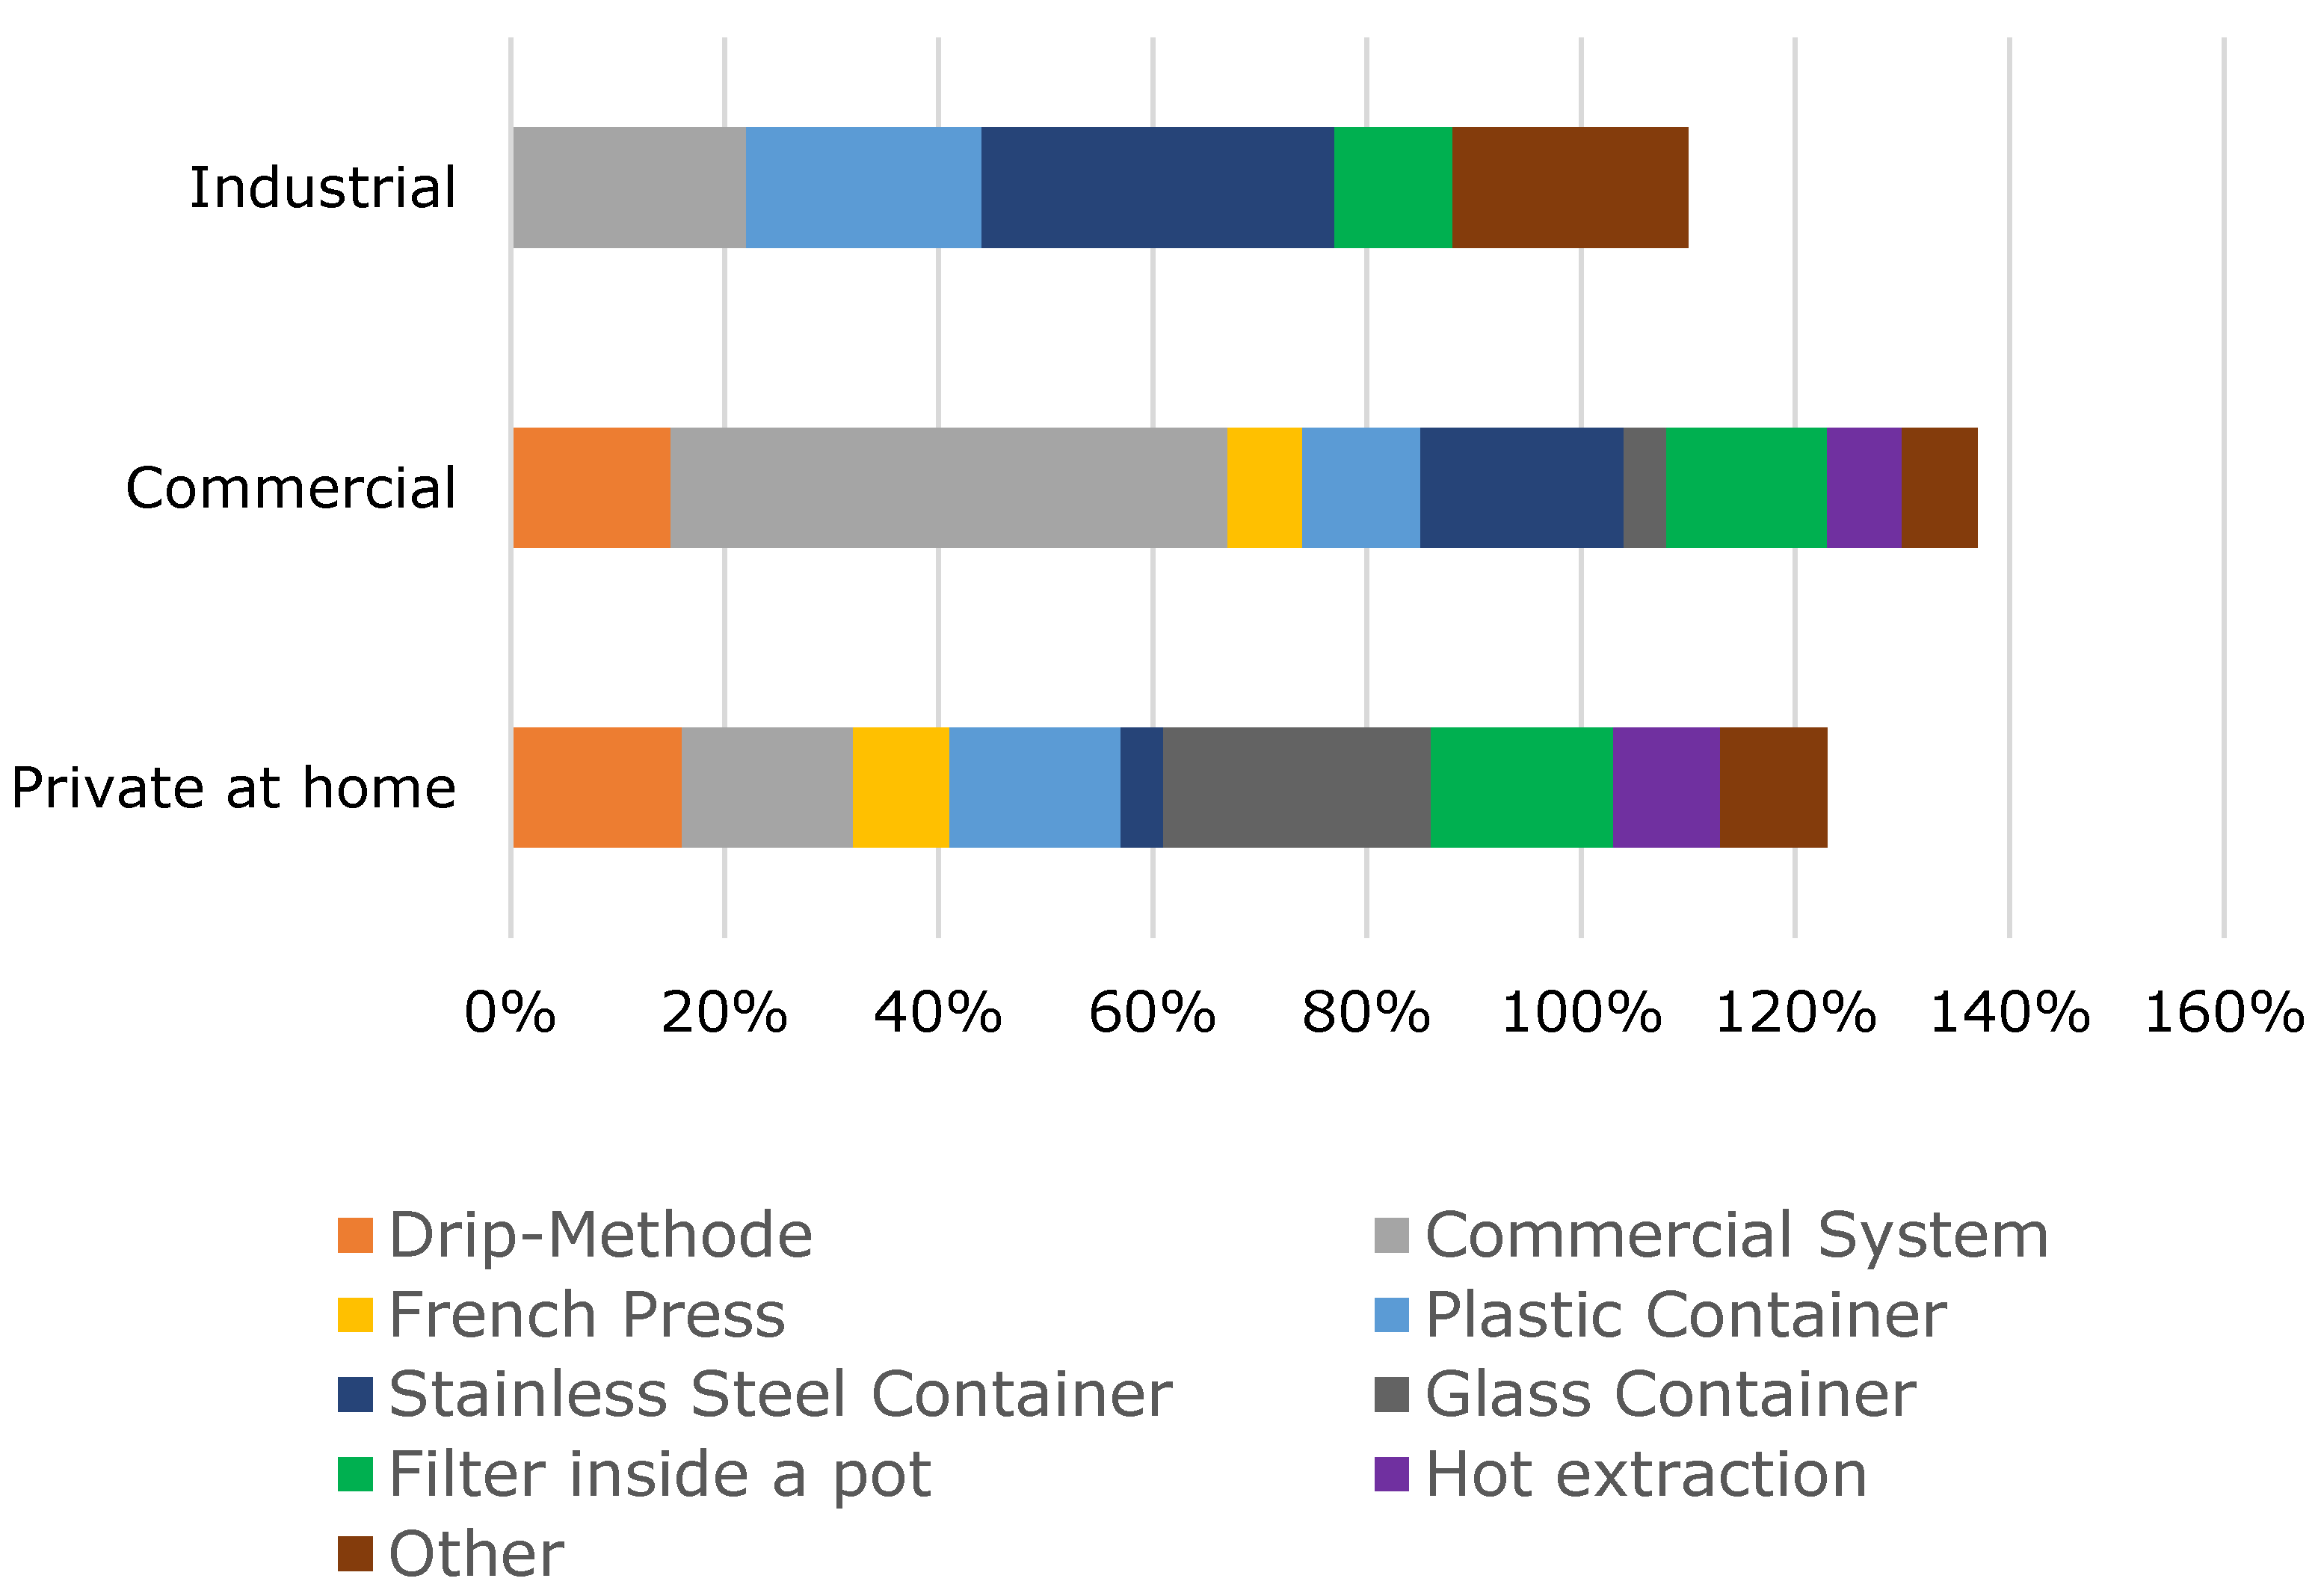
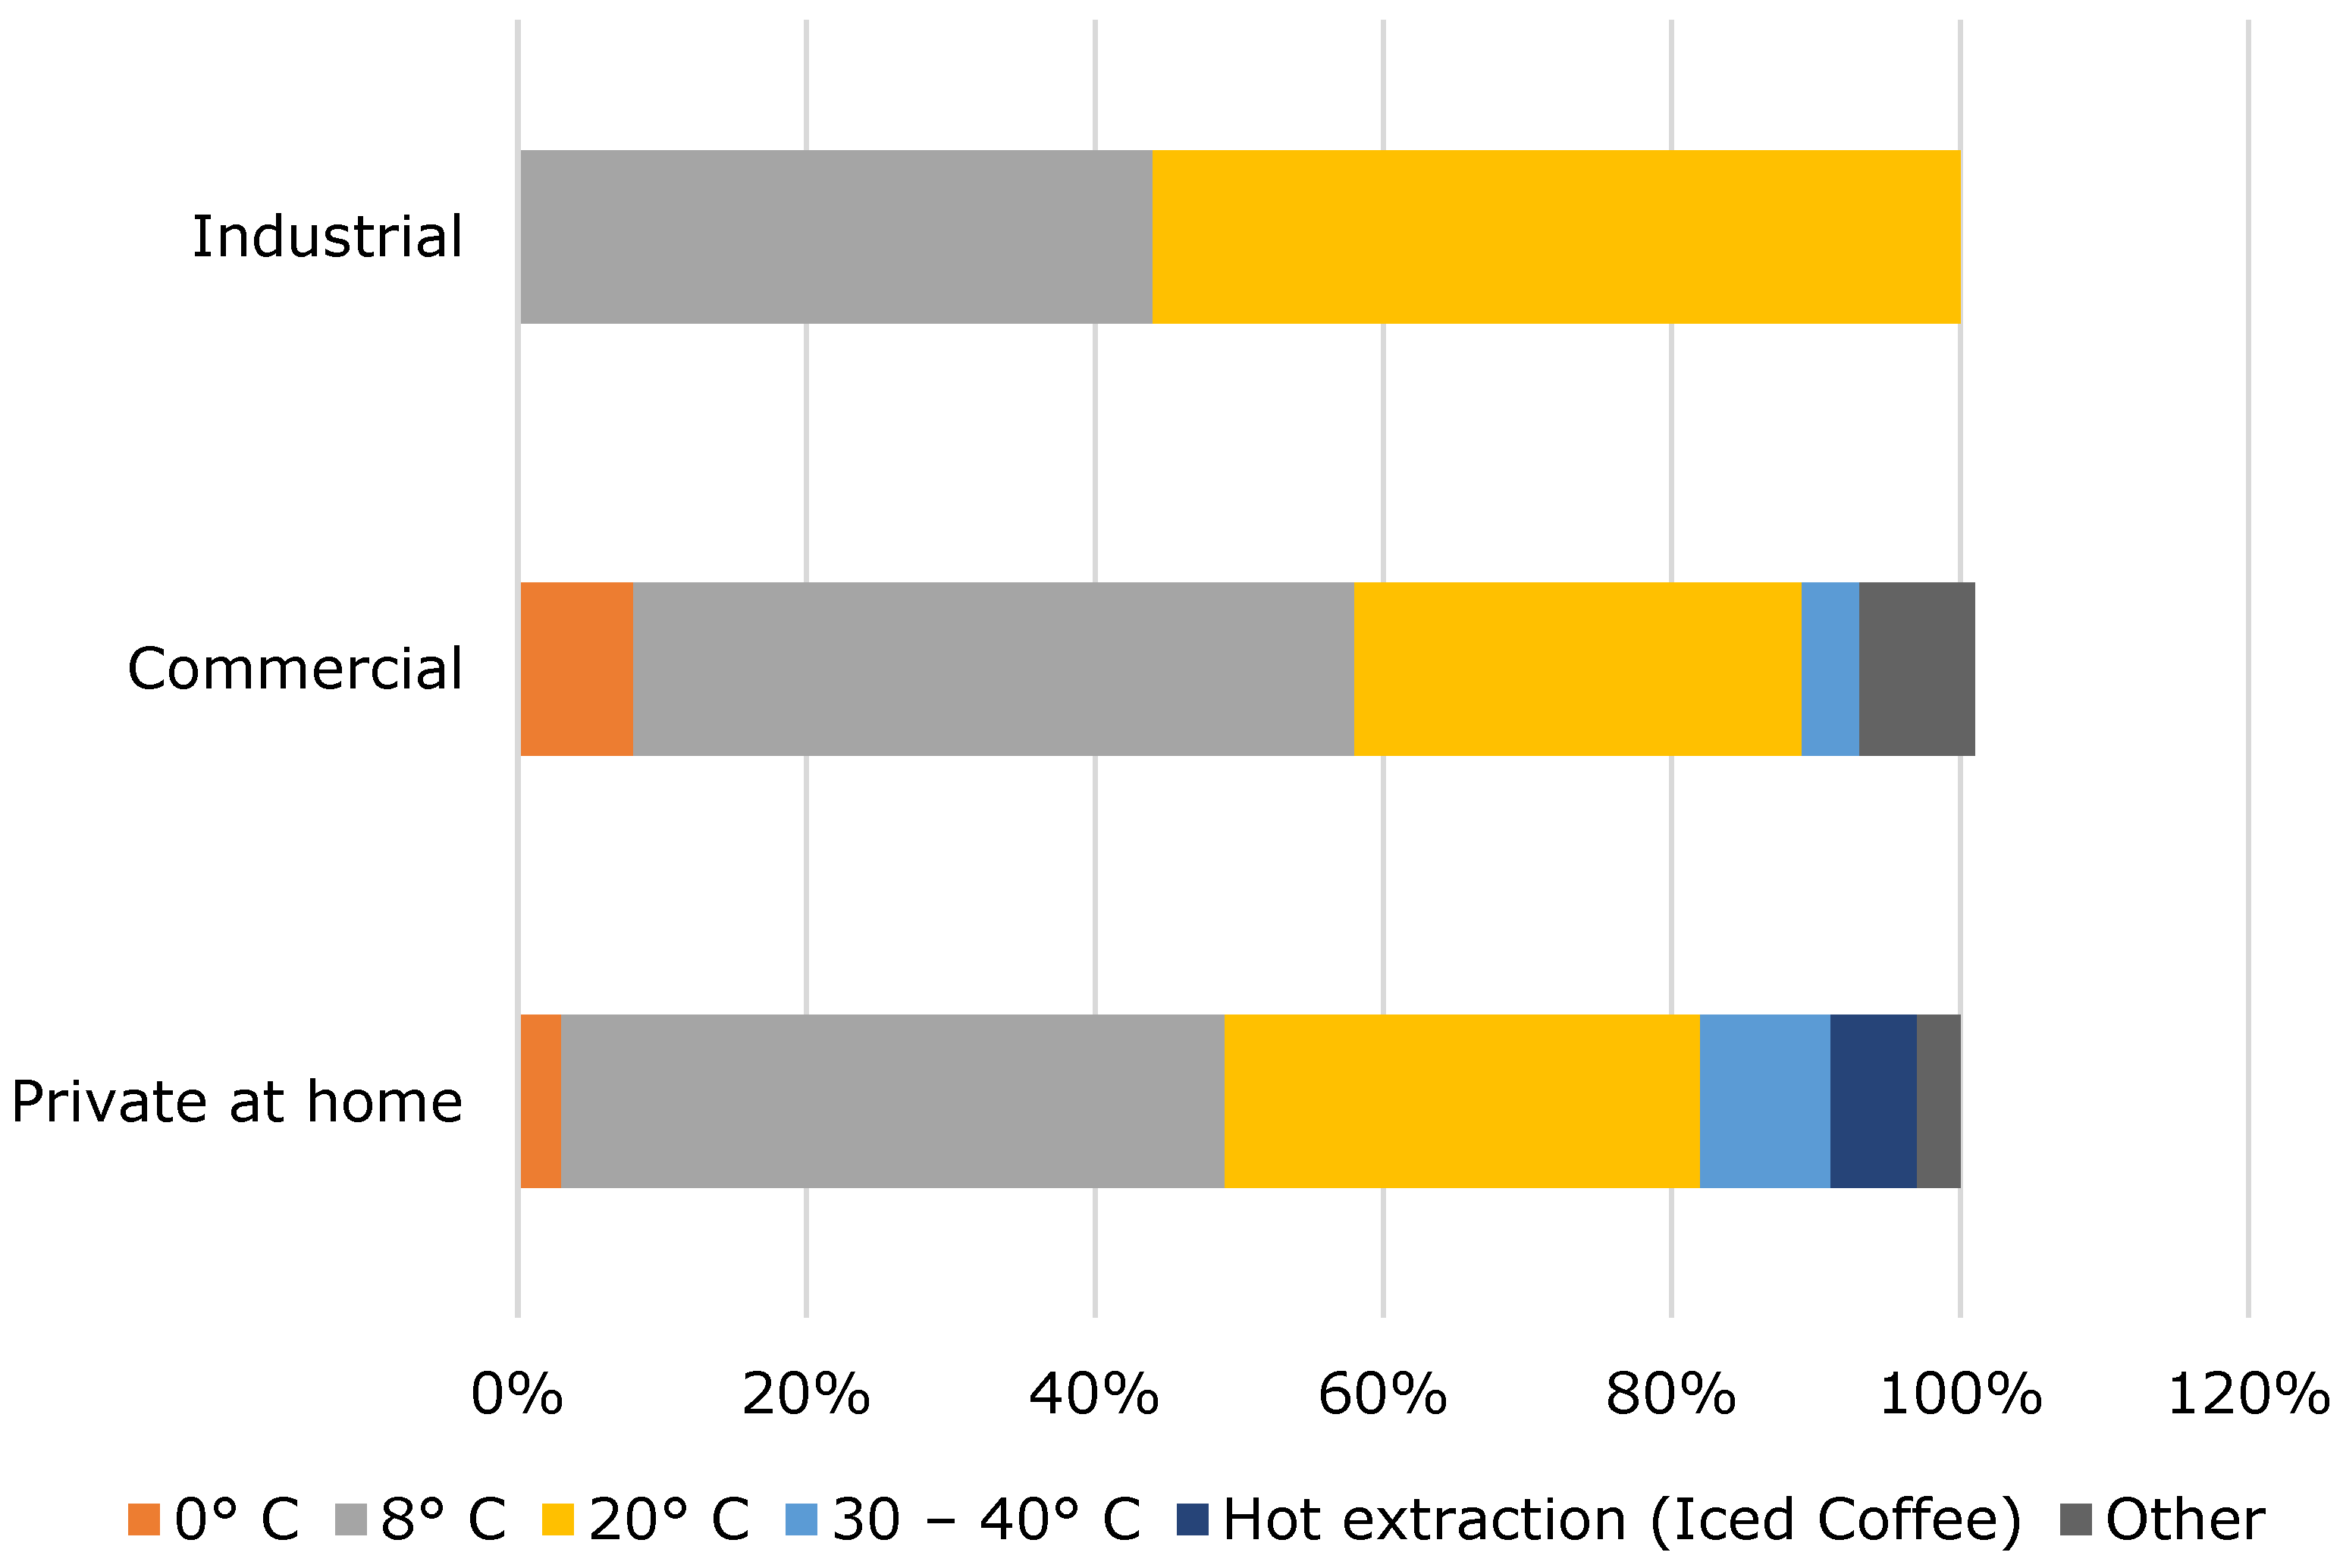
2.1. Online Survey on the Cold Brew Production Process
2.2. Cold Brew Extraction Experiments
2.2.1. Materials
2.2.2. Production of Cold Brew Coffee
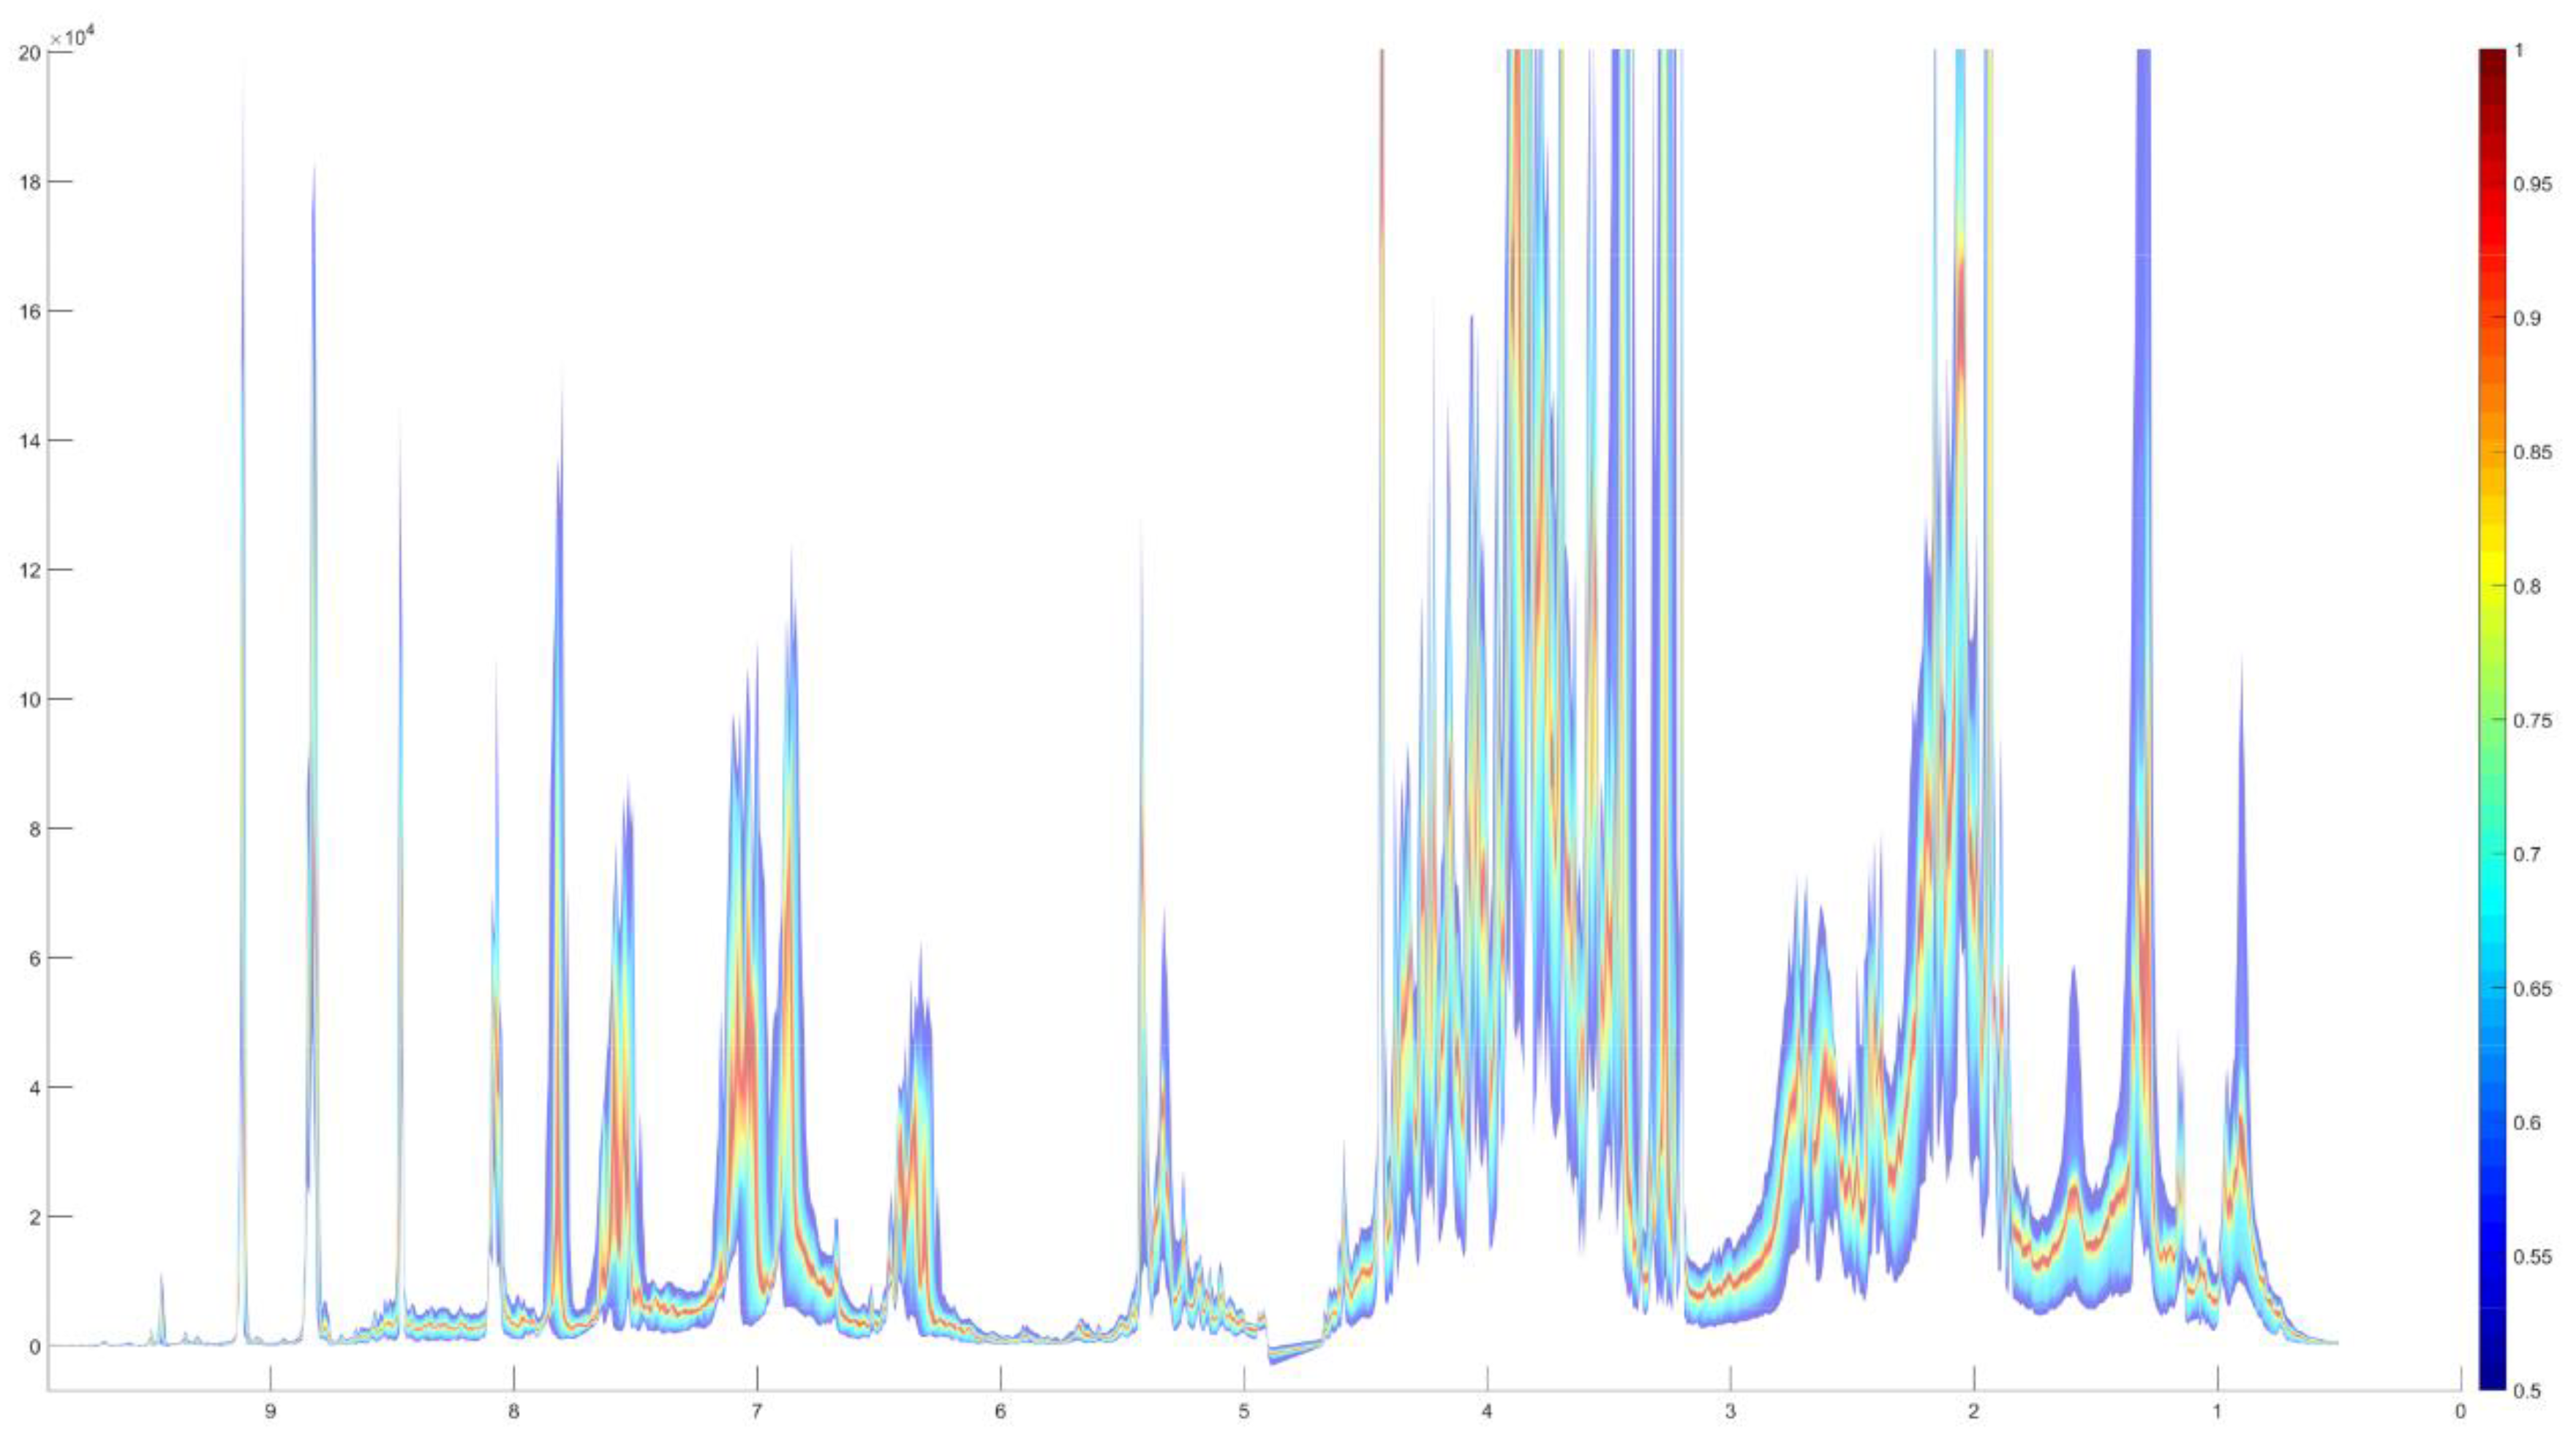
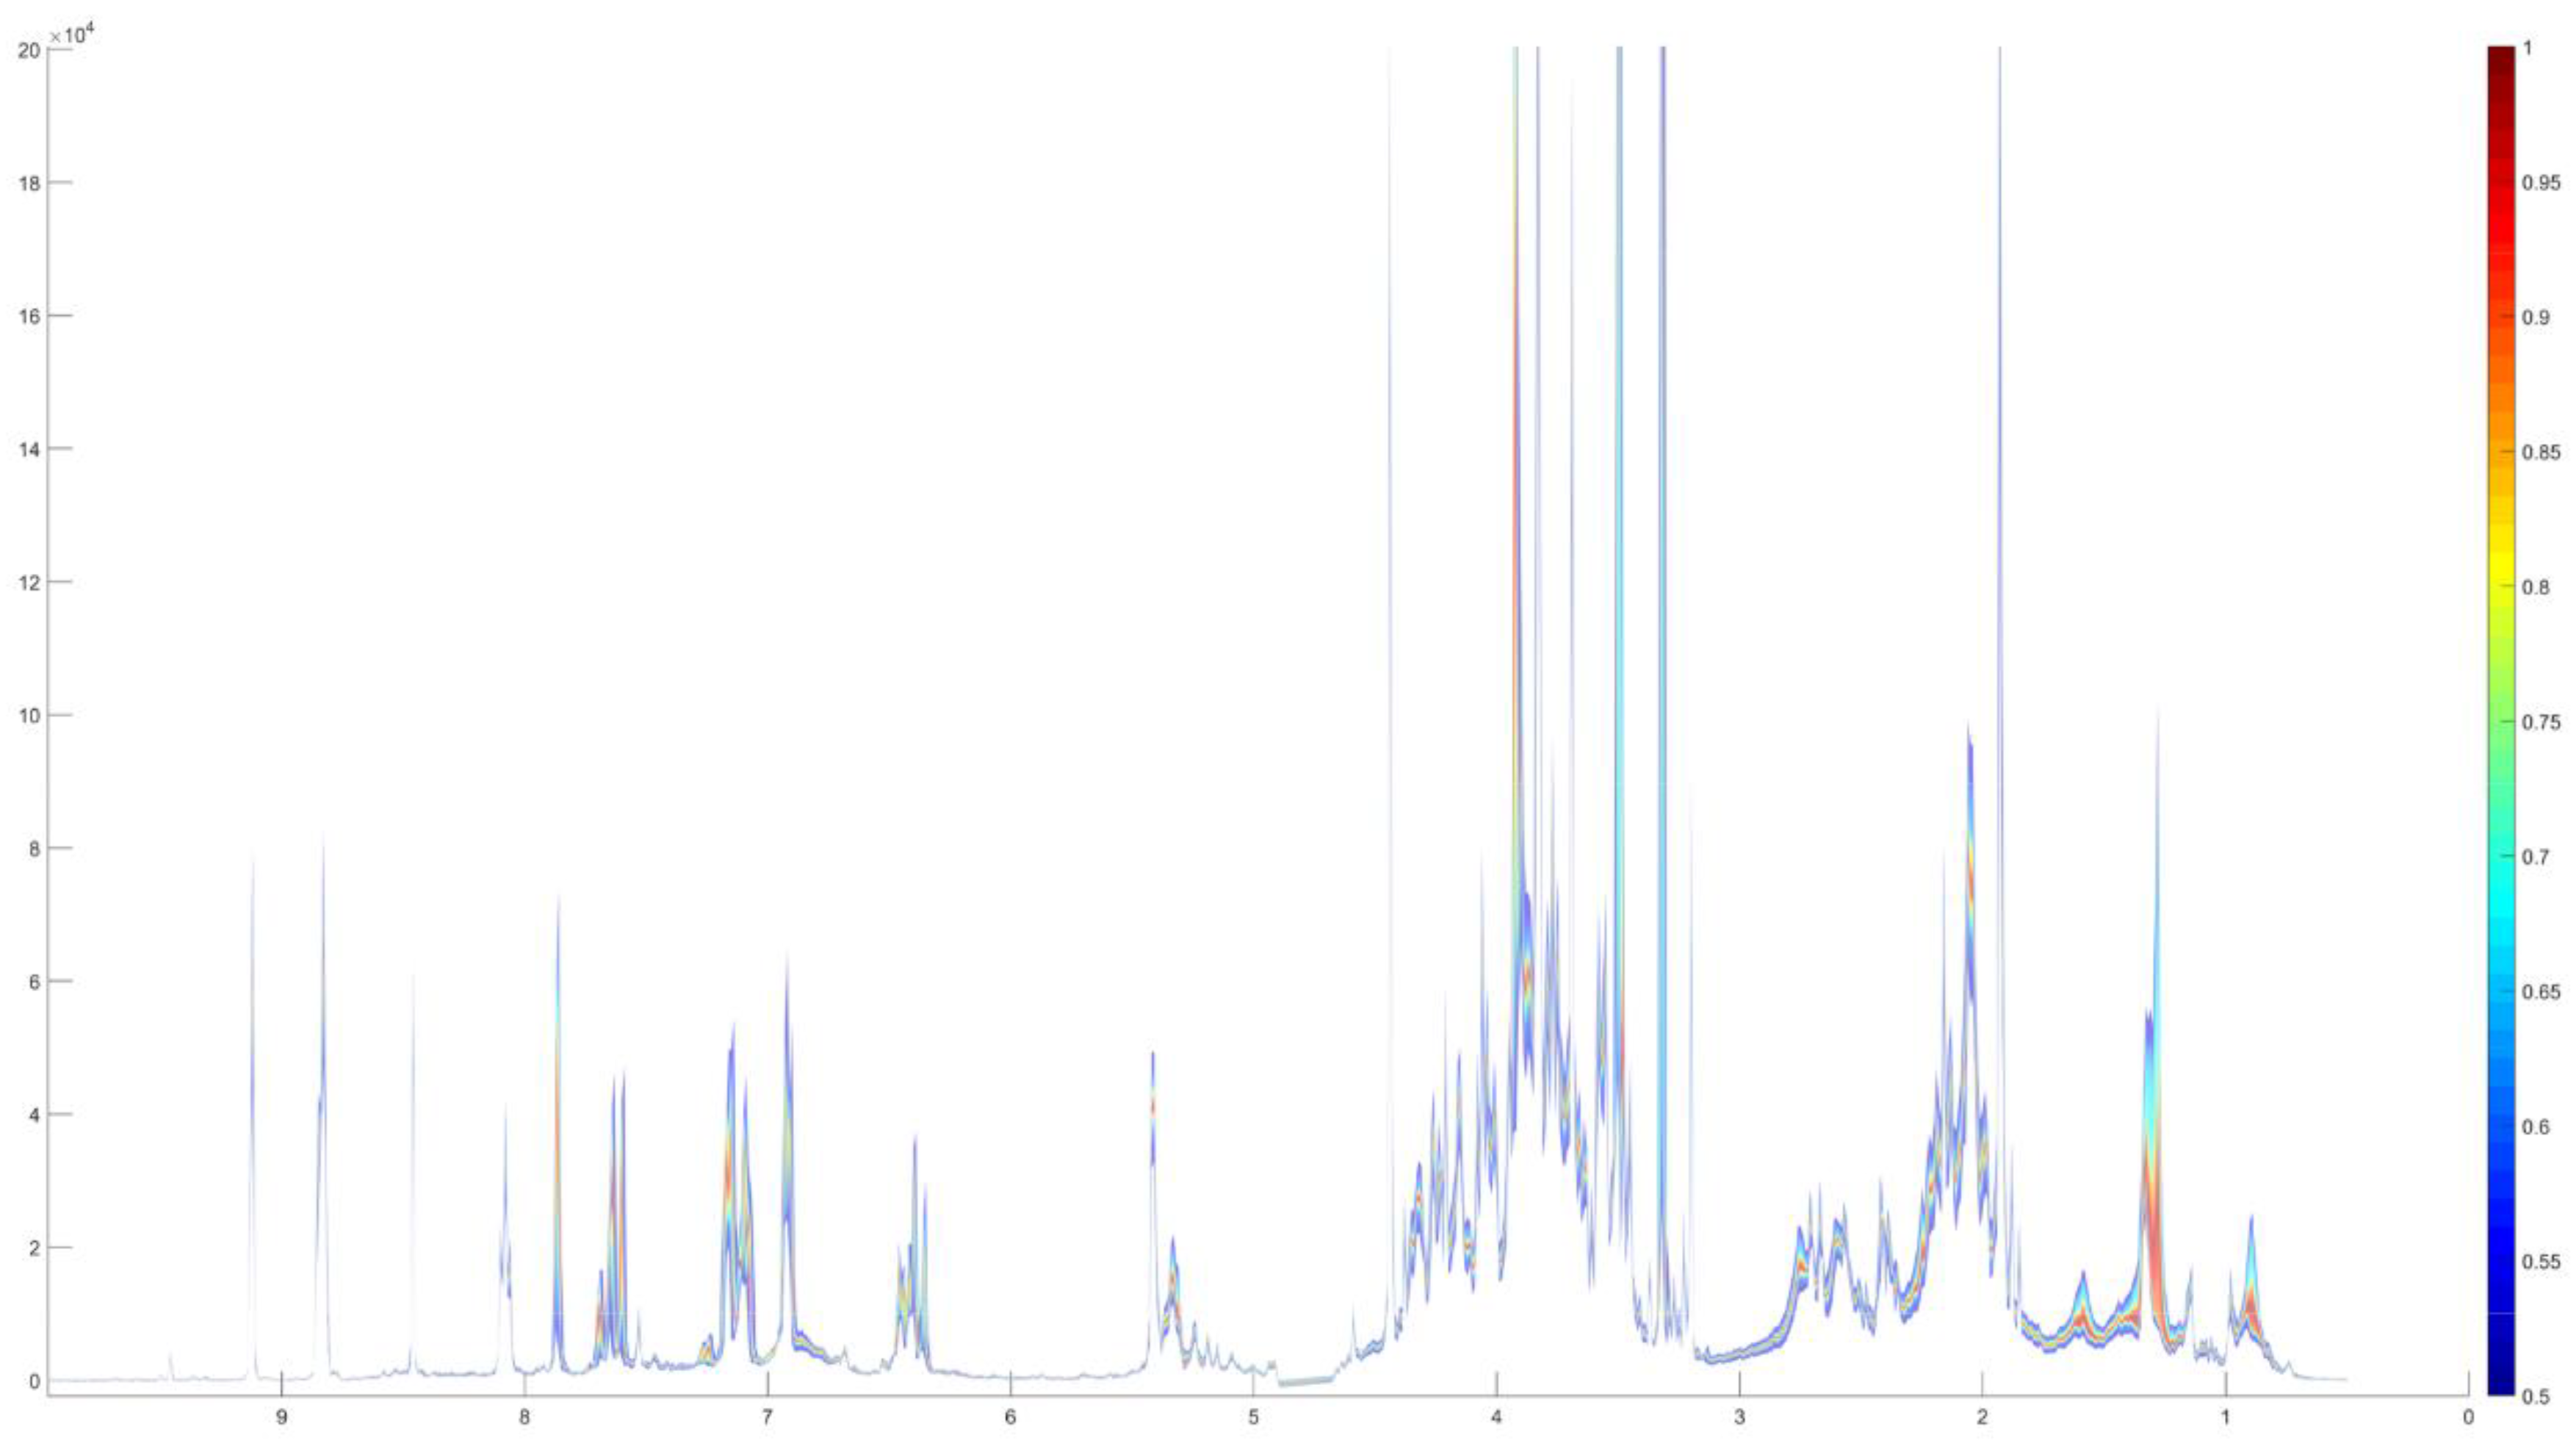
2.2.3. Chemical Analysis by Means of NMR
2.3. NMR Differentiation between Cold Brew and Hot Brew Coffee
2.4. Sensory Tests
- Arabica pulped natural Catuaí (Fazendas Dutra, Brazil);
- Arabica fully washed Catuaí (Finca Hamburgo, Mexico);
- Arabica S795 (Palthope Estate, India);
- Canephora SLN274 (Badra Estates, India).
- Cold brew;
- Nitro cold brew;
- Flash cooled coffee (cooled with ice);
- Hot brewed coffee (cooled at room temperature).
2.5. Microbiological Survey of Cold Brew Coffees from the Market
3. Results
3.1. Results of the Online Survey on the Cold Brew Production Process
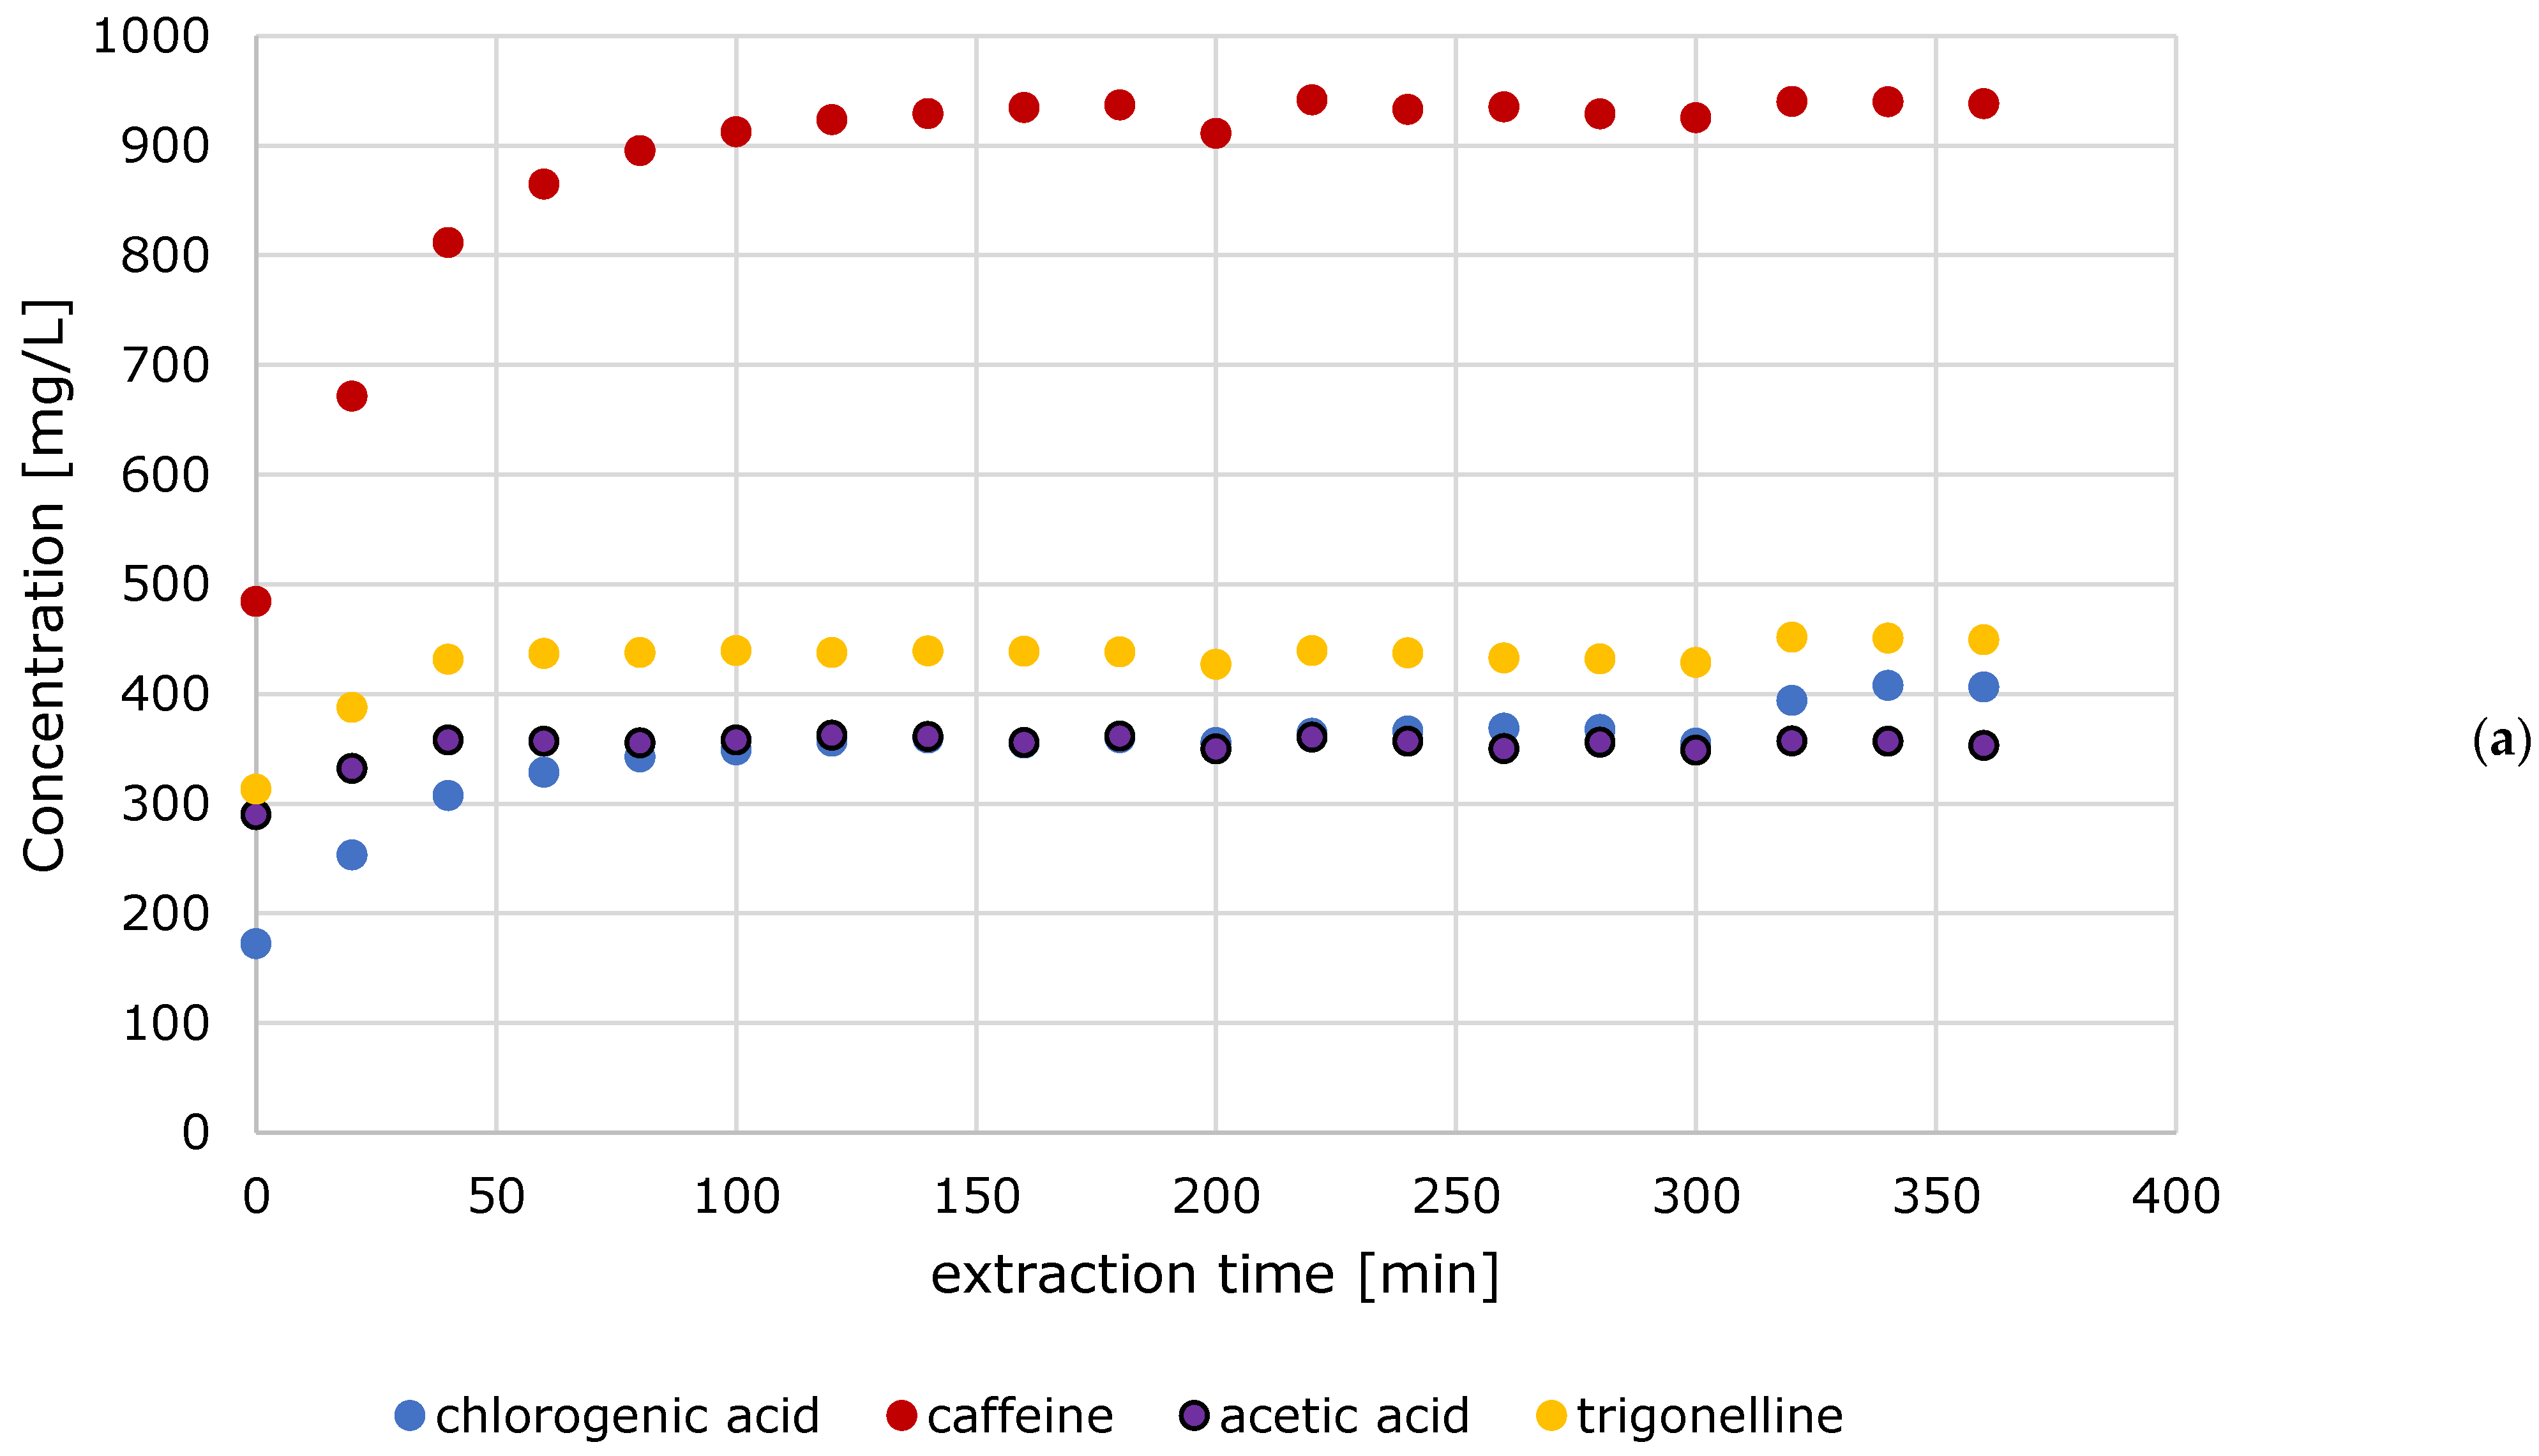
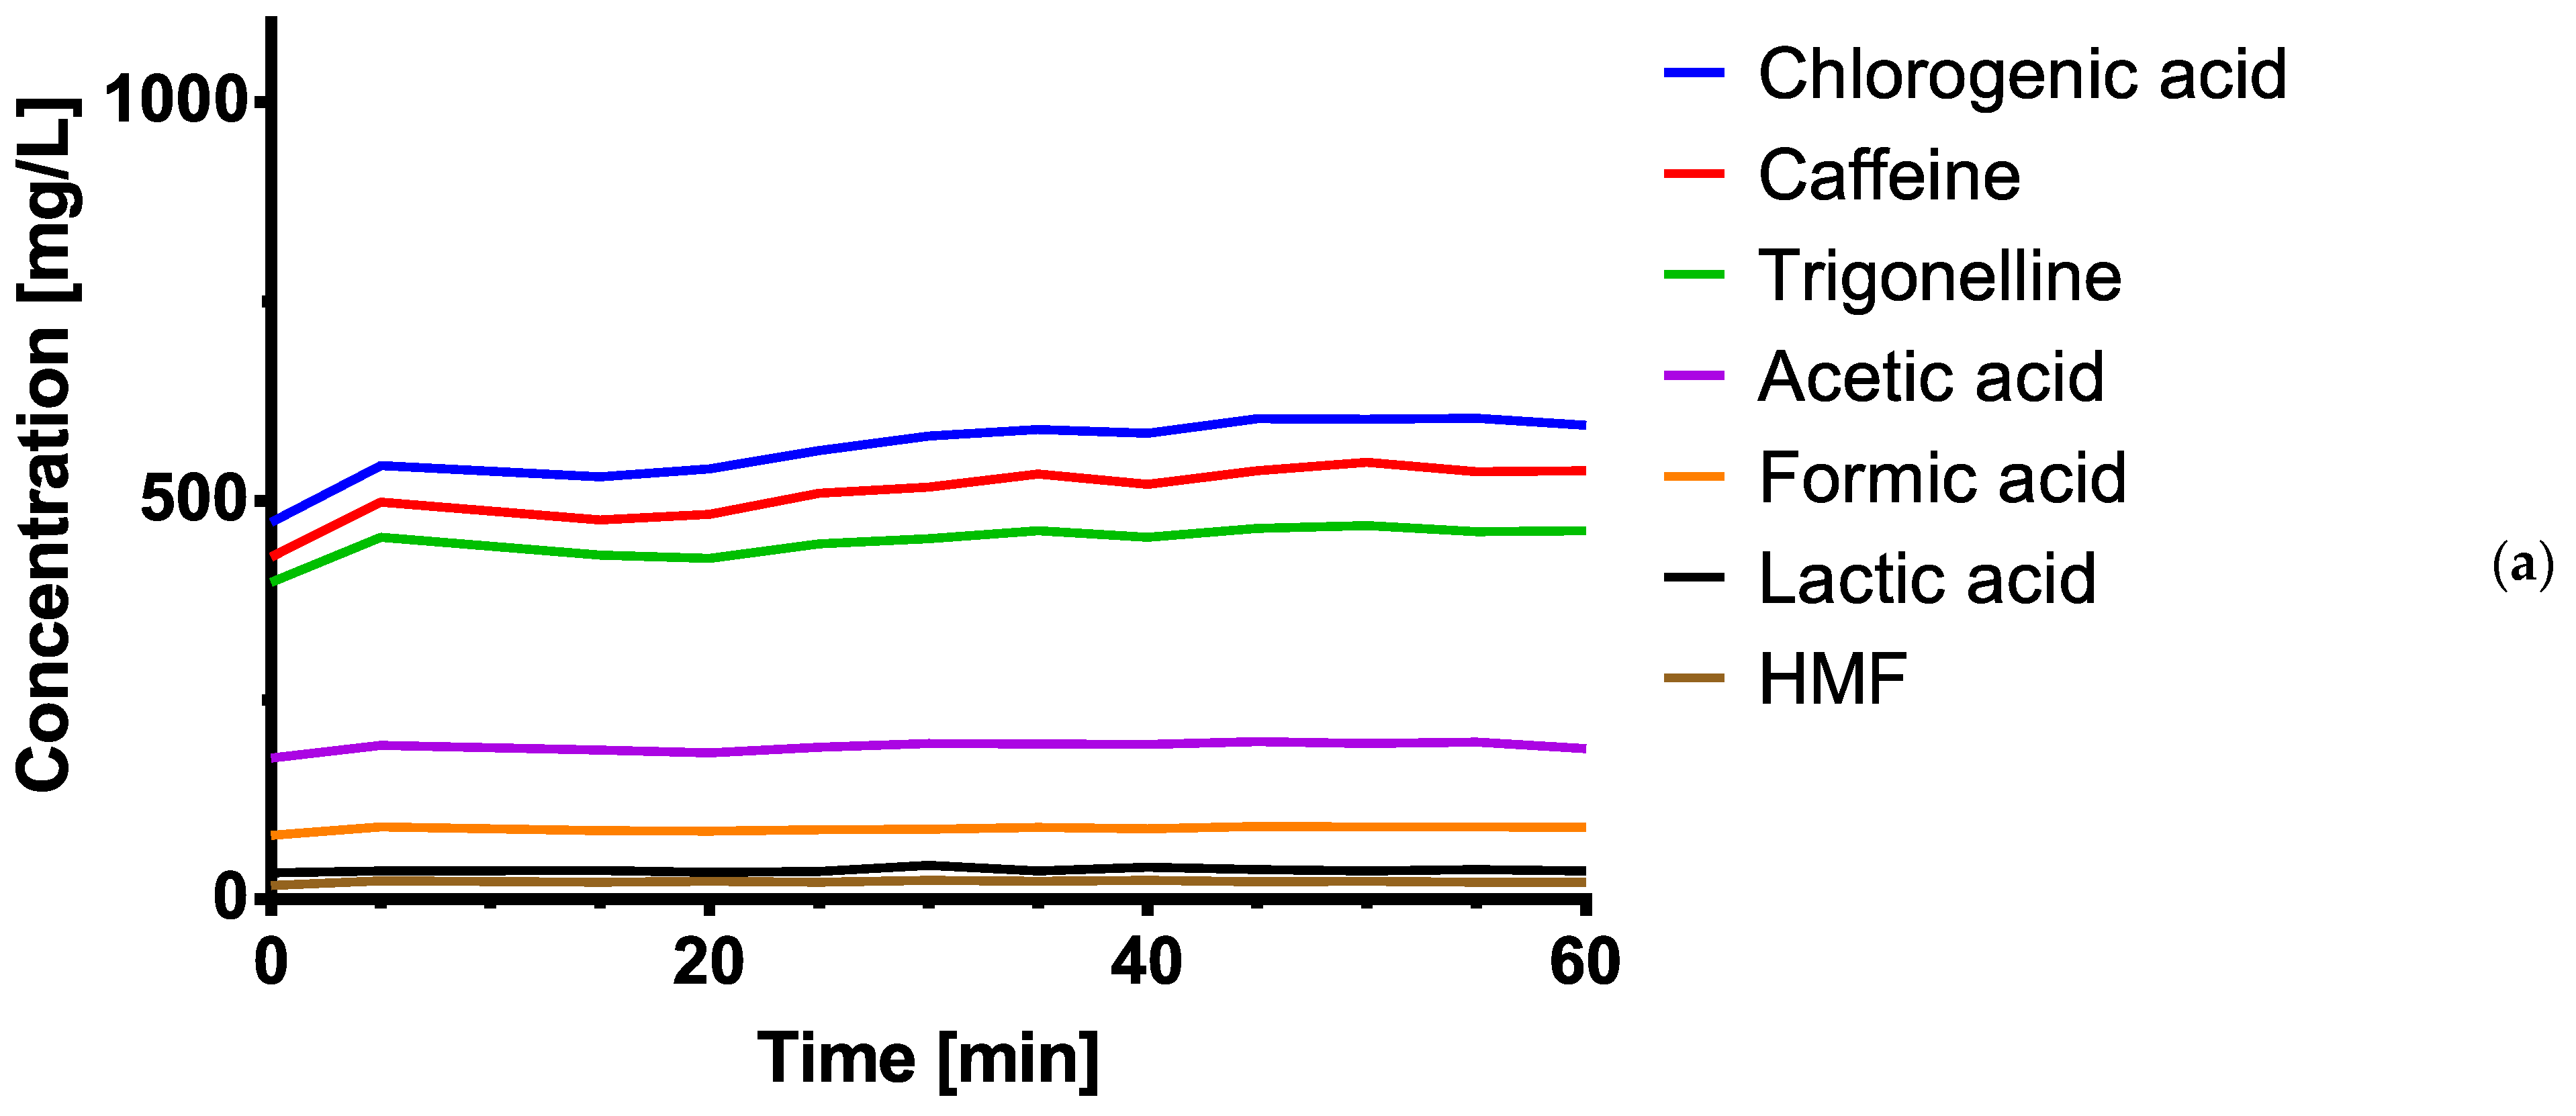
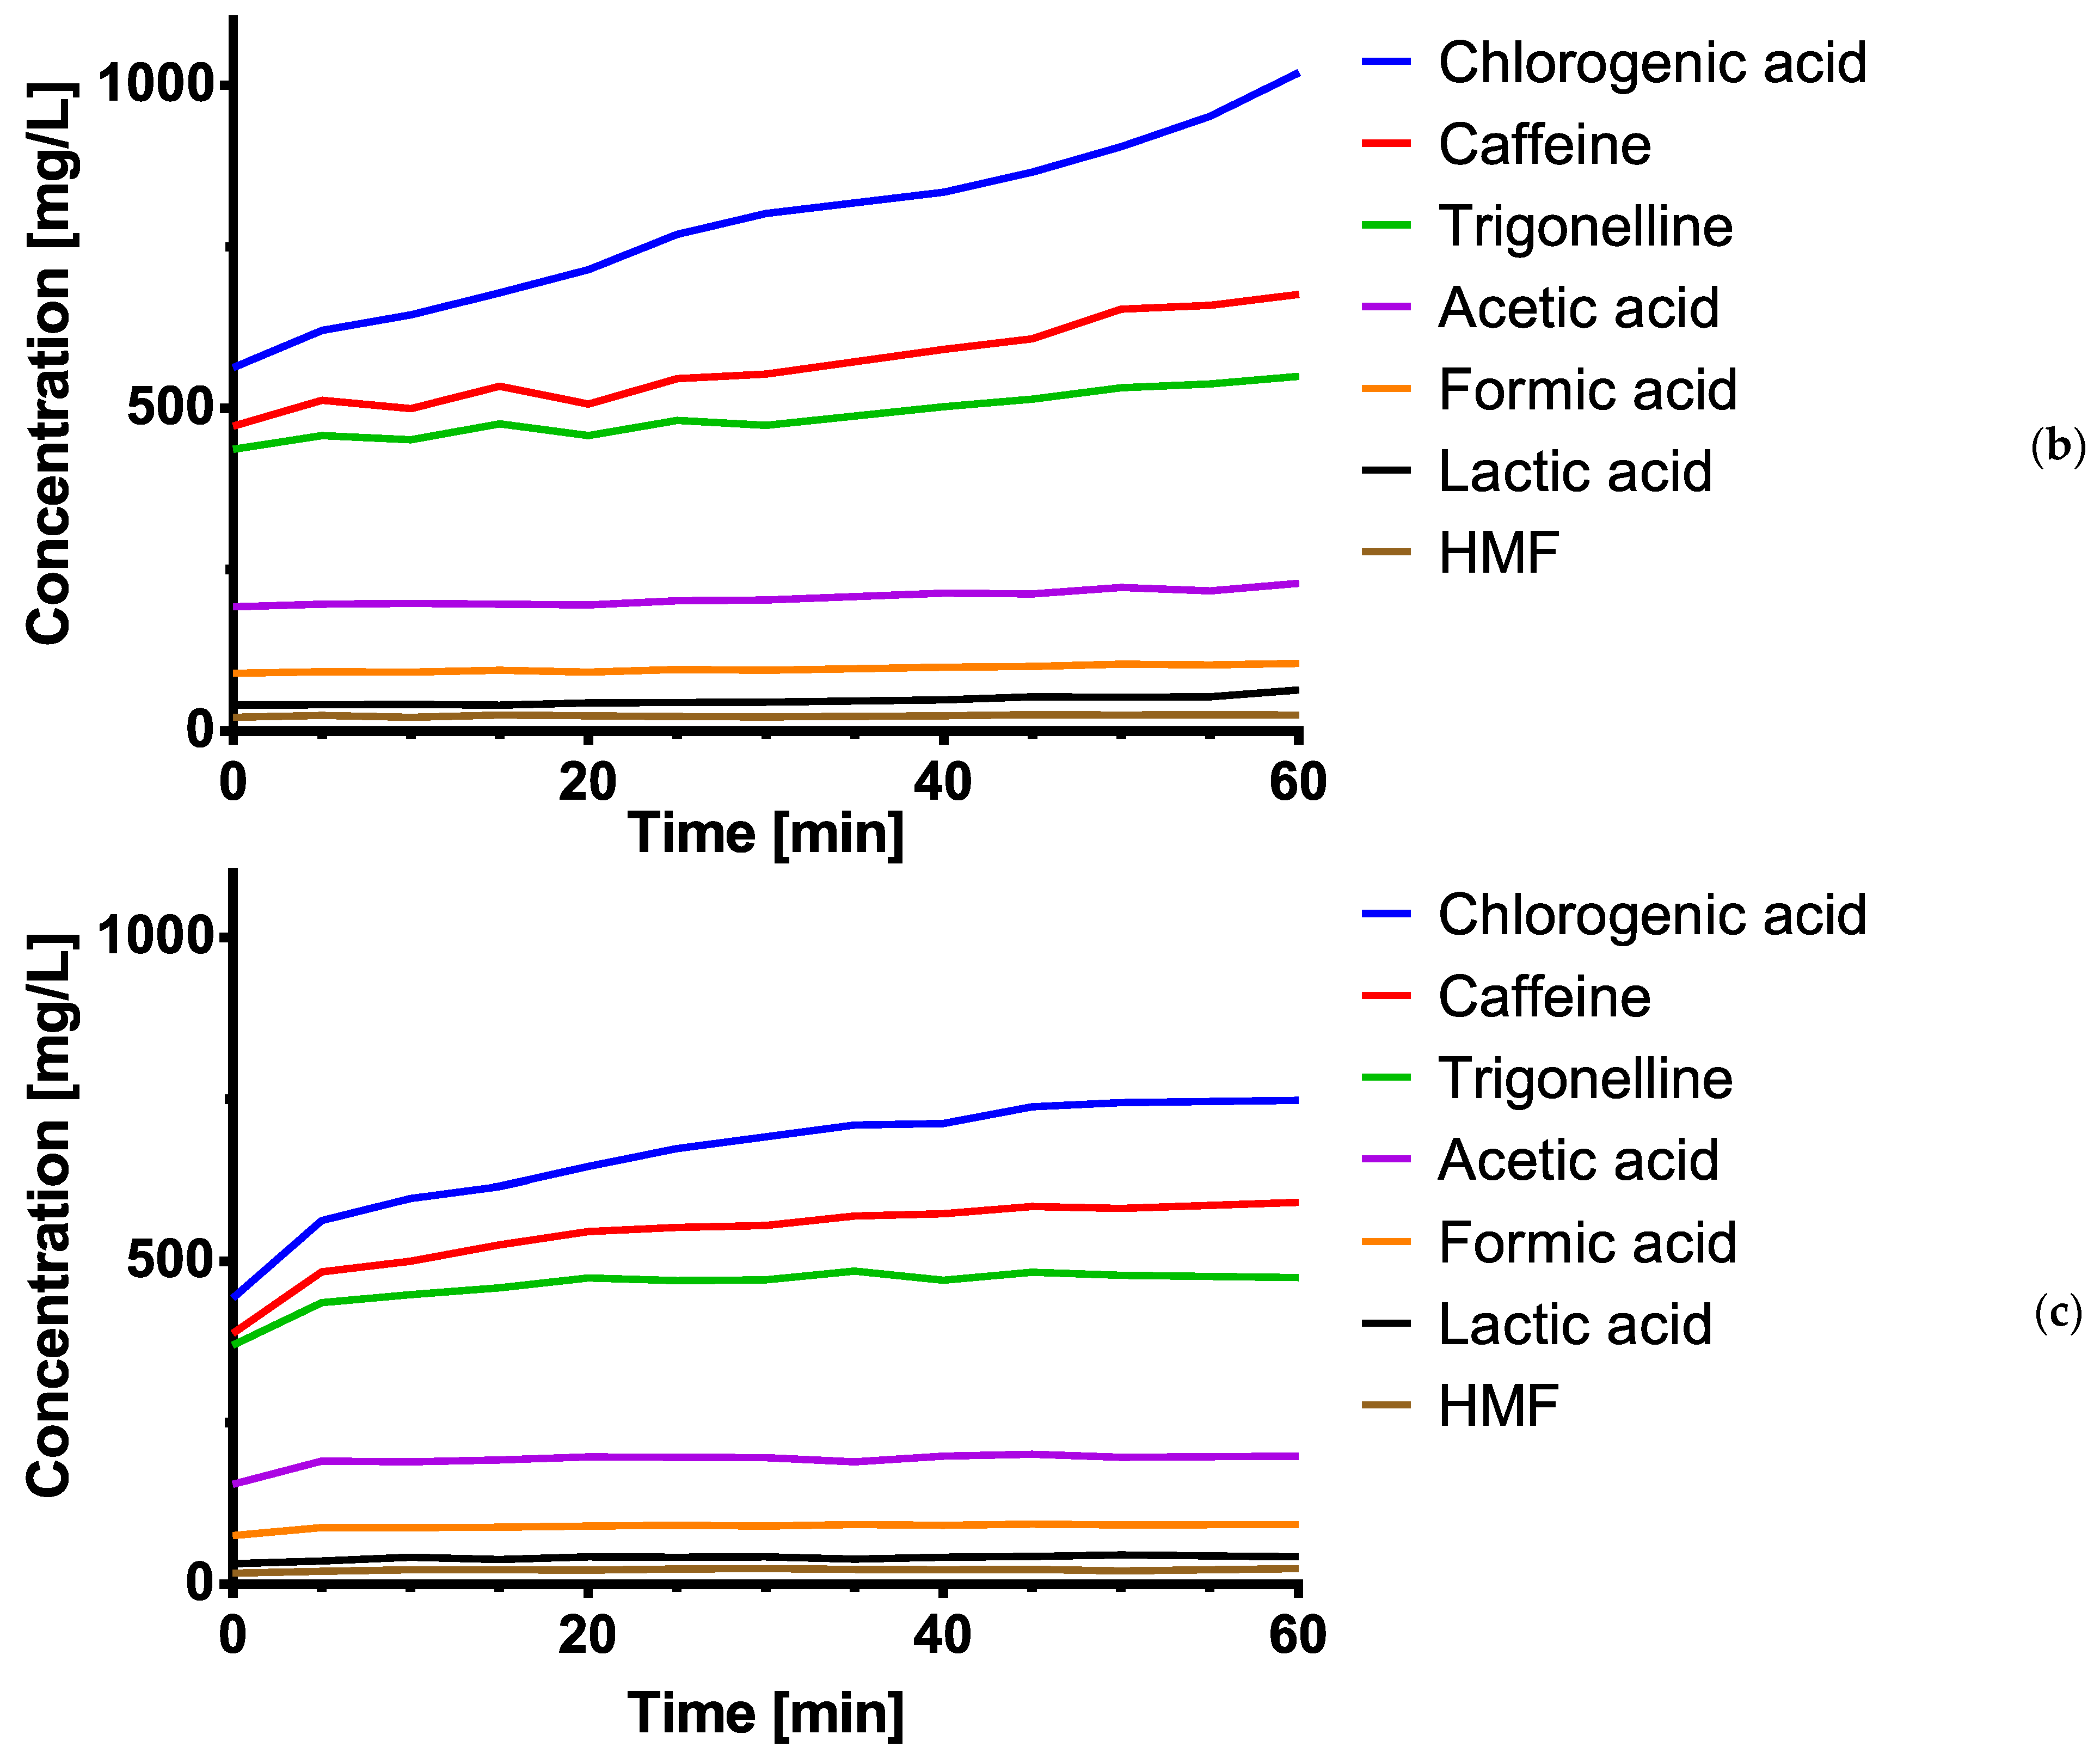
3.2. Results of Extraction Experiments
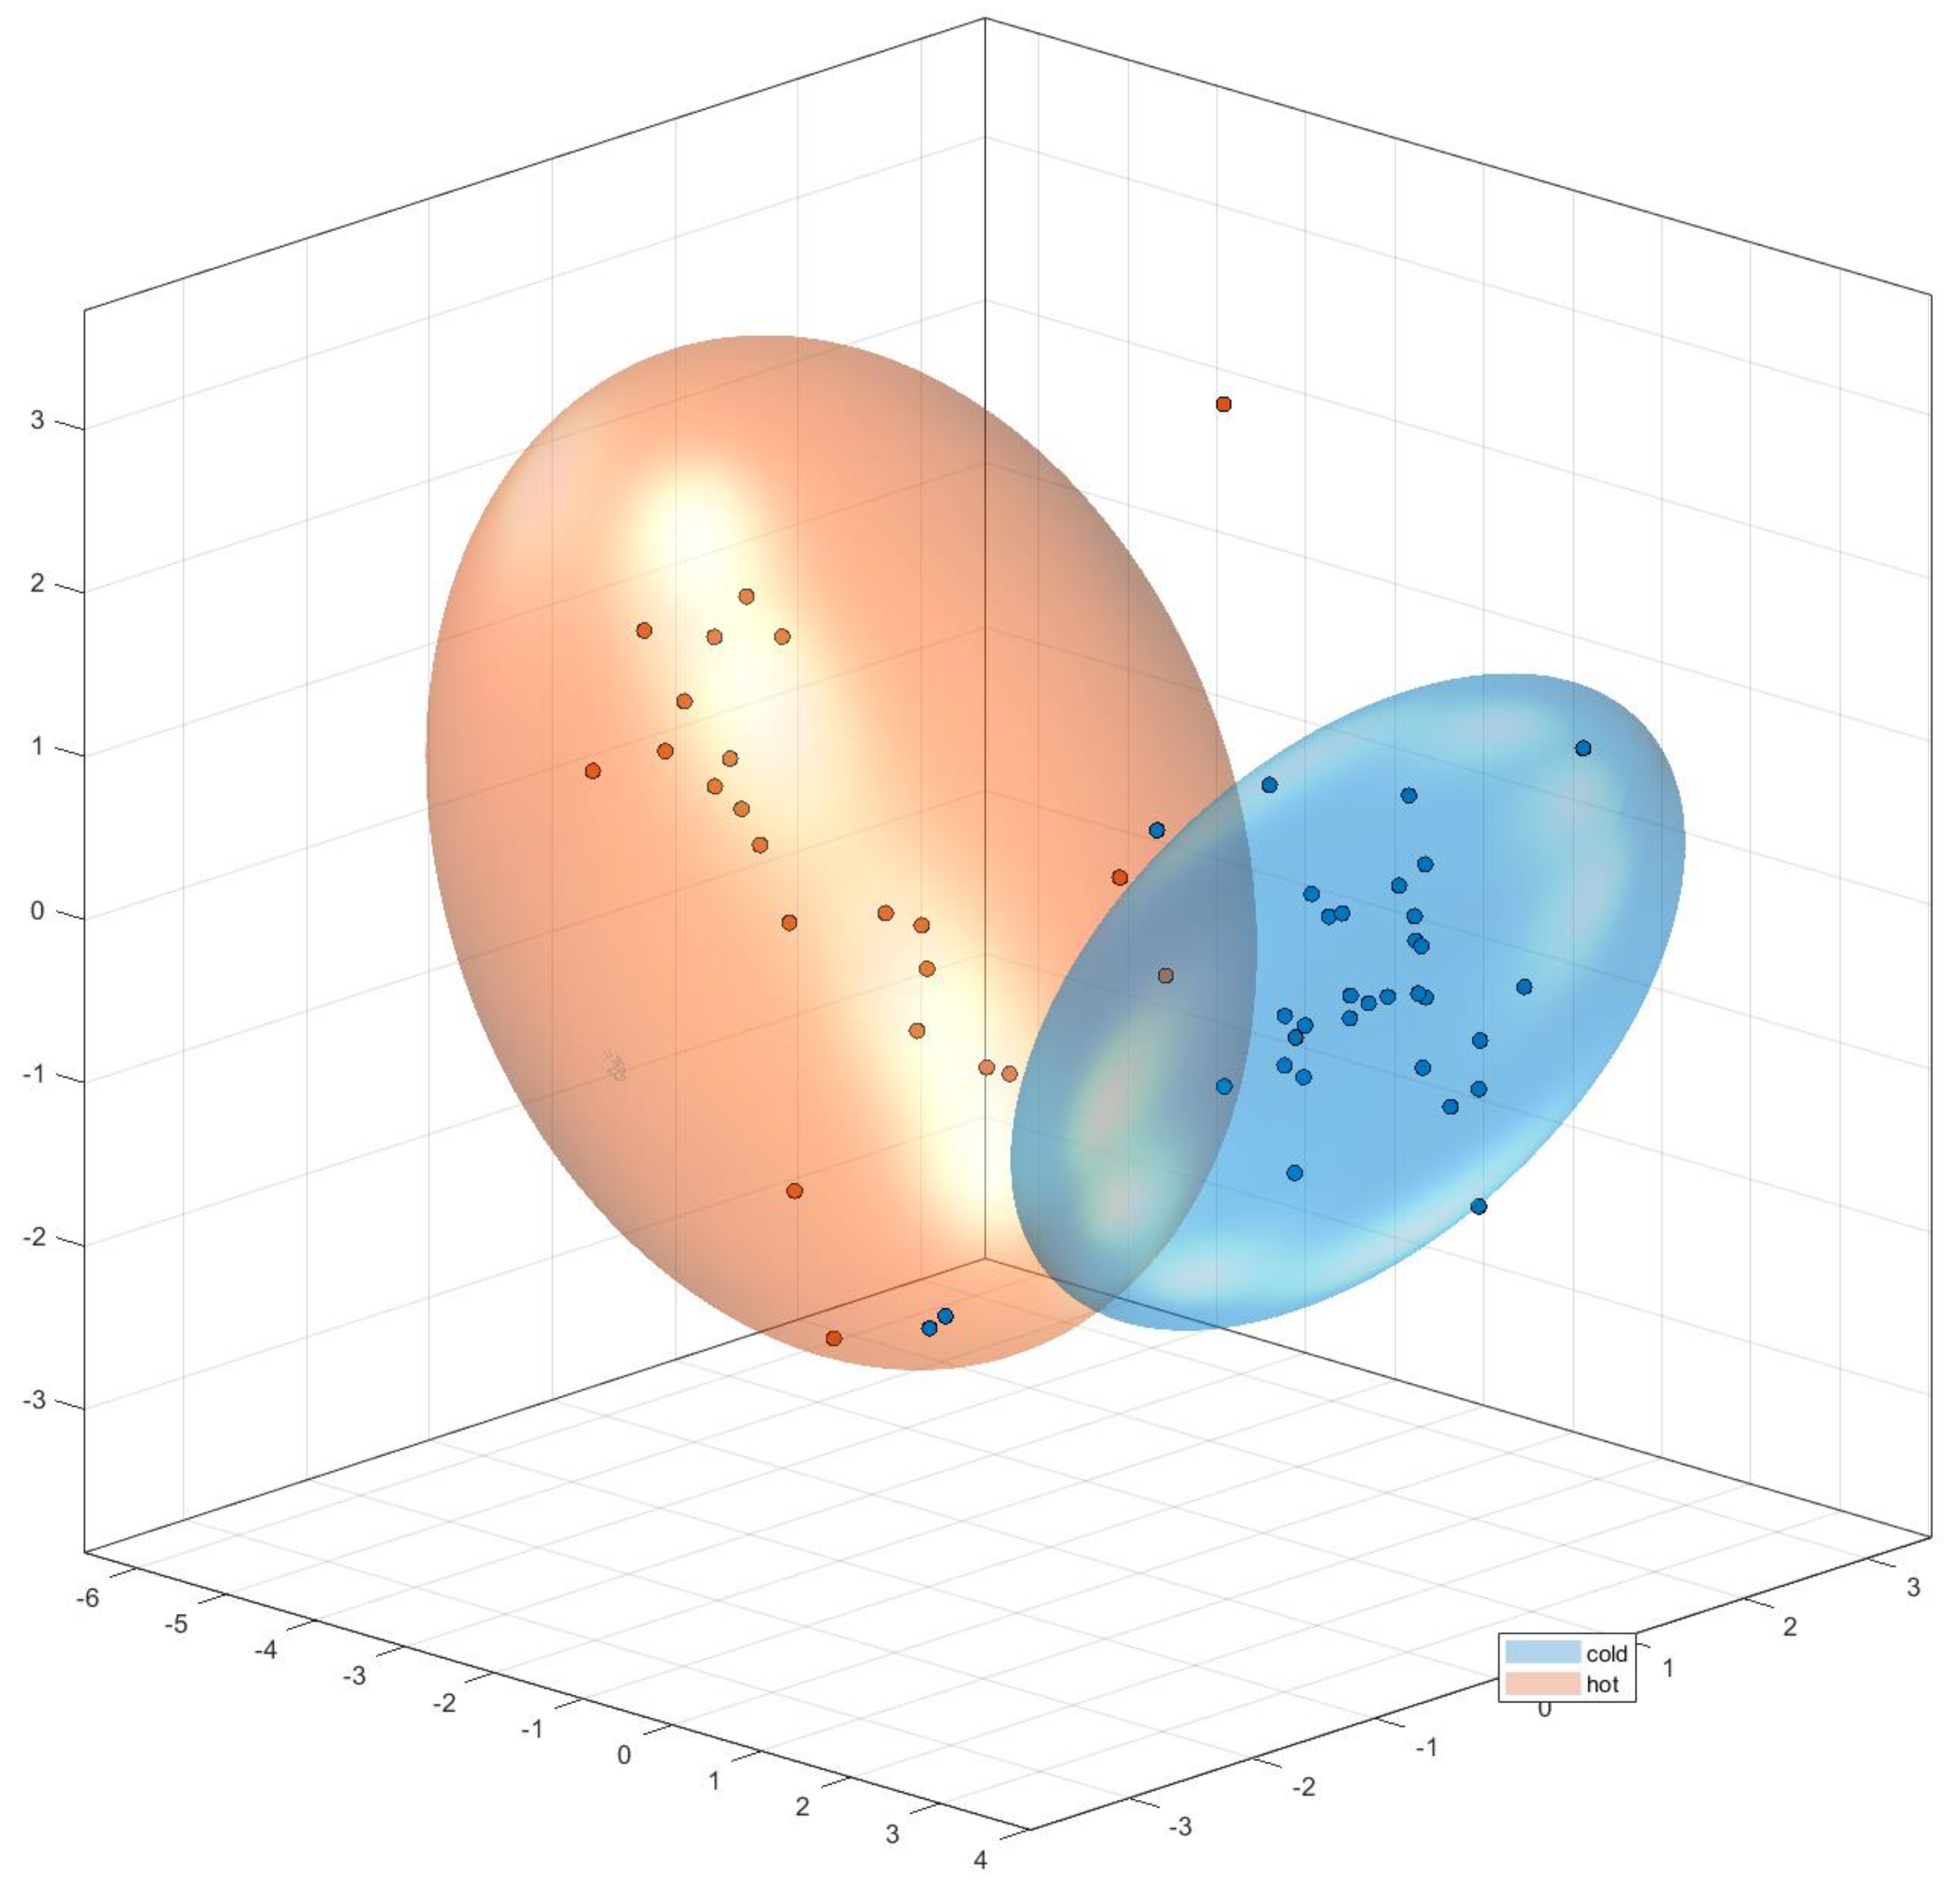
3.3. Discrimination between Cold and Hot Brews
3.4. Sensory Test Methods
3.4.1. Ranking Test
3.4.2. Triangle Test
3.5. Microbiology Results
4. Discussion
4.1. What Is a Cold Brew Coffee?
4.2. Insights on Cold Brew Coffee Extraction
4.3. Analytical Discrimination of Cold from Hot Brewed Coffee
4.4. Sensory Properties of Cold Brew Coffee
4.5. Hygiene Requirements for Cold Brew Manufacture
5. Conclusions
Author Contributions
Funding
Institutional Review Board Statement
Informed Consent Statement
Data Availability Statement
Conflicts of Interest
References
- Angeloni, G.; Guerrini, L.; Masella, P.; Bellumori, M.; Daluiso, S.; Parenti, A.; Innocenti, M. What kind of coffee do you drink? An investigation on effects of eight different extraction methods. Food Res. Int. 2019, 116, 1327–1335. [Google Scholar] [CrossRef]
- Angeloni, G.; Guerrini, L.; Masella, P.; Innocenti, M.; Bellumori, M.; Parenti, A. Characterization and comparison of cold brew and cold drip coffee extraction methods. J. Sci. Food Agric. 2019, 99, 391–399. [Google Scholar] [CrossRef] [PubMed]
- Fibrianto, K.; Umam, K.; Shinta Wulandari, E. Effect of roasting profiles and brewing methods on the characteristics of Bali Kintamani coffee. Adv. Eng. Res. 2018, 172, 194–197. [Google Scholar] [CrossRef]
- Covino, R.M. The cold, hard truth. What you need to know about cold brew and nitro coffee. Conv. Store News 2017, 92–94. [Google Scholar]
- Hardie, A.-M. Cold Brewing. The New Wave of Iced Coffee. Tea Coffee Trade J. 2014, 186, 52–54. [Google Scholar]
- Klaus, T. Cold brew coffee. Küche 2018, 4, 22–25. [Google Scholar]
- Heo, J.; Choi, K.S.; Wang, S.; Adhikari, K.; Lee, J. Cold brew coffee: Consumer acceptability and characterization using the check-all-that-apply (CATA) method. Foods 2019, 8, 344. [Google Scholar] [CrossRef] [PubMed]
- Kwok, R.; Lee Wee Ting, K.; Schwarz, S.; Claassen, L.; Lachenmeier, D.W. Current challenges of cold brew coffee—roasting, extraction, flavor profile, contamination, and food safety. Challenges 2020, 11, 26. [Google Scholar] [CrossRef]
- Okaru, A.O.; Scharinger, A.; Rajcic de, R.T.; Teipel, J.; Kuballa, T.; Walch, S.G.; Lachenmeier, D.W. Validation of a quantitative proton nuclear magnetic resonance spectroscopic screening method for coffee quality and authenticity (NMR Coffee Screener). Foods 2020, 9, 47. [Google Scholar] [CrossRef]
- Lachenmeier, D.W.; Teipel, J.; Scharinger, A.; Kuballa, T.; Walch, S.G.; Grosch, F.; Bunzel, M.; Okaru, A.O.; Schwarz, S. Fully automated identification of coffee species and simultaneous quantification of furfuryl alcohol using NMR spectroscopy. J. AOAC Int. 2020, 103, 306–314. [Google Scholar] [CrossRef] [PubMed]
- Monakhova, Y.B.; Ruge, W.; Kuballa, T.; Ilse, M.; Winkelmann, O.; Diehl, B.; Thomas, F.; Lachenmeier, D.W. Rapid approach to identify the presence of Arabica and Robusta species in coffee using 1H NMR spectroscopy. Food Chem. 2015, 182, 178–184. [Google Scholar] [CrossRef]
- ISO. ISO 8587:2006 Sensory Analysis-Methodology-Ranking; International Organization for Standardization: Geneva, Switzerland, 2006. [Google Scholar]
- ISO. ISO 4120:2004 Sensory Analysis-Methodology-Triangle Test; International Organization for Standardization: Geneva, Switzerland, 2004. [Google Scholar]
- Lachenmeier, D.W.; Noack, D.; Röhnisch, J.; Seren, H.Y. Cold brew coffee–a microbial hazard? Tea Coffee Trade J. 2021, 193, 32–33. [Google Scholar] [CrossRef]
- Meilgaard, M.C.; Civille, G.V.; Carr, B.T. Sensory Evaluation Techniques; CRC Press: Boca Raton, FL, USA, 1999. [Google Scholar]
- Deutscher Kaffee-Verband. Kaffeewissen: Vom Anbau bis Zum Endprodukt; Deutscher Kaffee-Verband e.V.: Hamburg, Germany, 2004. [Google Scholar]
- British Columbia Centre for Disease Control. Nitro Cold Brew Coffee Food Safety Risks; BC Centre for Disease Control: Vancouver, BC, Canada, 2017.
- Cordoba, N.; Pataquiva, L.; Osorio, C.; Moreno, F.L.M.; Ruiz, R.Y. Effect of grinding, extraction time and type of coffee on the physicochemical and flavour characteristics of cold brew coffee. Sci. Rep. 2019, 9, 8440. [Google Scholar] [CrossRef] [PubMed]
- Han, J.W.; Boo, H.; Chung, M.S. Effects of extraction conditions on acrylamide/furan content, antioxidant activity, and sensory properties of cold brew coffee. Food Sci. Biotechnol. 2020, 29, 1071–1080. [Google Scholar] [CrossRef] [PubMed]
- Kim, A.R.; Kim, J.S. Flavor contributing nonvolatile chemical and sensory characterization of cold water extraction-based coffee by different extraction methods (dripping vs steeping) and time. J. Korean Soc. Coffee Ind. 2014, 3, 1–9. [Google Scholar]
- Schwarz, S.; Lachenmeier, D.W.; Claassen, L. Defining cold brew coffee through extraction. Tea Coffee Trade J. 2020, 192, 31–32. [Google Scholar] [CrossRef]
- Kyroglou, S.; Thanasouli, K.; Vareltzis, P. Process characterization and optimization of cold brew coffee: Effect of pressure, temperature, time and solvent volume on yield, caffeine and phenol content. J. Sci. Food Agric. 2021, 101. in press. [Google Scholar] [CrossRef]
- Castaneda-Rodríguez, R.; Mulík, S.; Ozuna, C. Brewing temperature and particle size affect extraction kinetics of cold brew coffee in terms of its physicochemical, bioactive, and antioxidant properties. J. Culin. Sci. Technol. 2021, 19. in press. [Google Scholar] [CrossRef]
- Morresi, A.M.; Truglio, K.; Specchio, J.; Kerrihard, A.L. Effects of grind size and brew time upon sensory traits, consumer likability and antioxidant activity of Arabica cold brew. Int. J. Food Sci. Technol. 2021, 56, 1929–1936. [Google Scholar] [CrossRef]
- Seninde, D.R.; Chambers, E.; Chambers, D. Determining the impact of roasting degree, coffee to water ratio and brewing method on the sensory characteristics of cold brew Ugandan coffee. Food Res. Int. 2020, 137, 109667. [Google Scholar] [CrossRef]
- Woods, A.T.; Poliakoff, E.; Lloyd, D.M.; Dijksterhuis, G.B.; Thomas, A. Flavor expectation: The effect of assuming homogeneity on drink perception. Chemosens. Percept. 2010, 3, 174–181. [Google Scholar] [CrossRef]
- McCain-Keefer, H.R.; Meals, S.; Drake, M. The sensory properties and consumer acceptance of cold brew coffee. J. Sens. Stud. 2020, 35, e12604. [Google Scholar] [CrossRef]
- Cordoba, N.; Moreno, F.L.; Osorio, C.; Velasquez, S.; Ruiz, Y. Chemical and sensory evaluation of cold brew coffees using different roasting profiles and brewing methods. Food Res. Int. 2021, 141, 110141. [Google Scholar] [CrossRef]
- Rao, N.Z.; Fuller, M.; Grim, M.D. Physiochemical characteristics of hot and cold brew coffee chemistry: The effects of roast level and brewing temperature on compound extraction. Foods 2020, 9, 902. [Google Scholar] [CrossRef] [PubMed]
- Heo, J.; Adhikari, K.; Choi, K.S.; Lee, J. Analysis of caffeine, chlorogenic acid, trigonelline, and volatile compounds in cold brew coffee using high-performance liquid chromatography and solid-phase microextraction-gas chromatography-mass spectrometry. Foods 2020, 9, 1746. [Google Scholar] [CrossRef] [PubMed]


| Rather New (<1 Year) | Intermediate (1–5 Years) | Experienced (>5 Years) | ||||
|---|---|---|---|---|---|---|
| Private at home | 35% | 31 | 53% | 47 | 12% | 11 |
| Commercial | 15% | 4 | 63% | 17 | 22% | 6 |
| Industrial | 22% | 2 | 67% | 6 | 11% | 1 |
| Total Responses | 29% | 37 | 56% | 71 | 14% | 18 |
| Private at Home | Commercial | Industrial | |
|---|---|---|---|
| Minimum | 0 | 0 | 0 |
| Maximum | 7 | 6.3 | 7 |
| Median | 0.4 | 0.5 | 1.3 |
| Mean | 0.8 | 1.0 | 2.6 |
| Standard Deviation | 1.4 | 1.4 | 2.6 |
| Temperature | Vessel Size | Milk | Sugar | Nitro | |||||
|---|---|---|---|---|---|---|---|---|---|
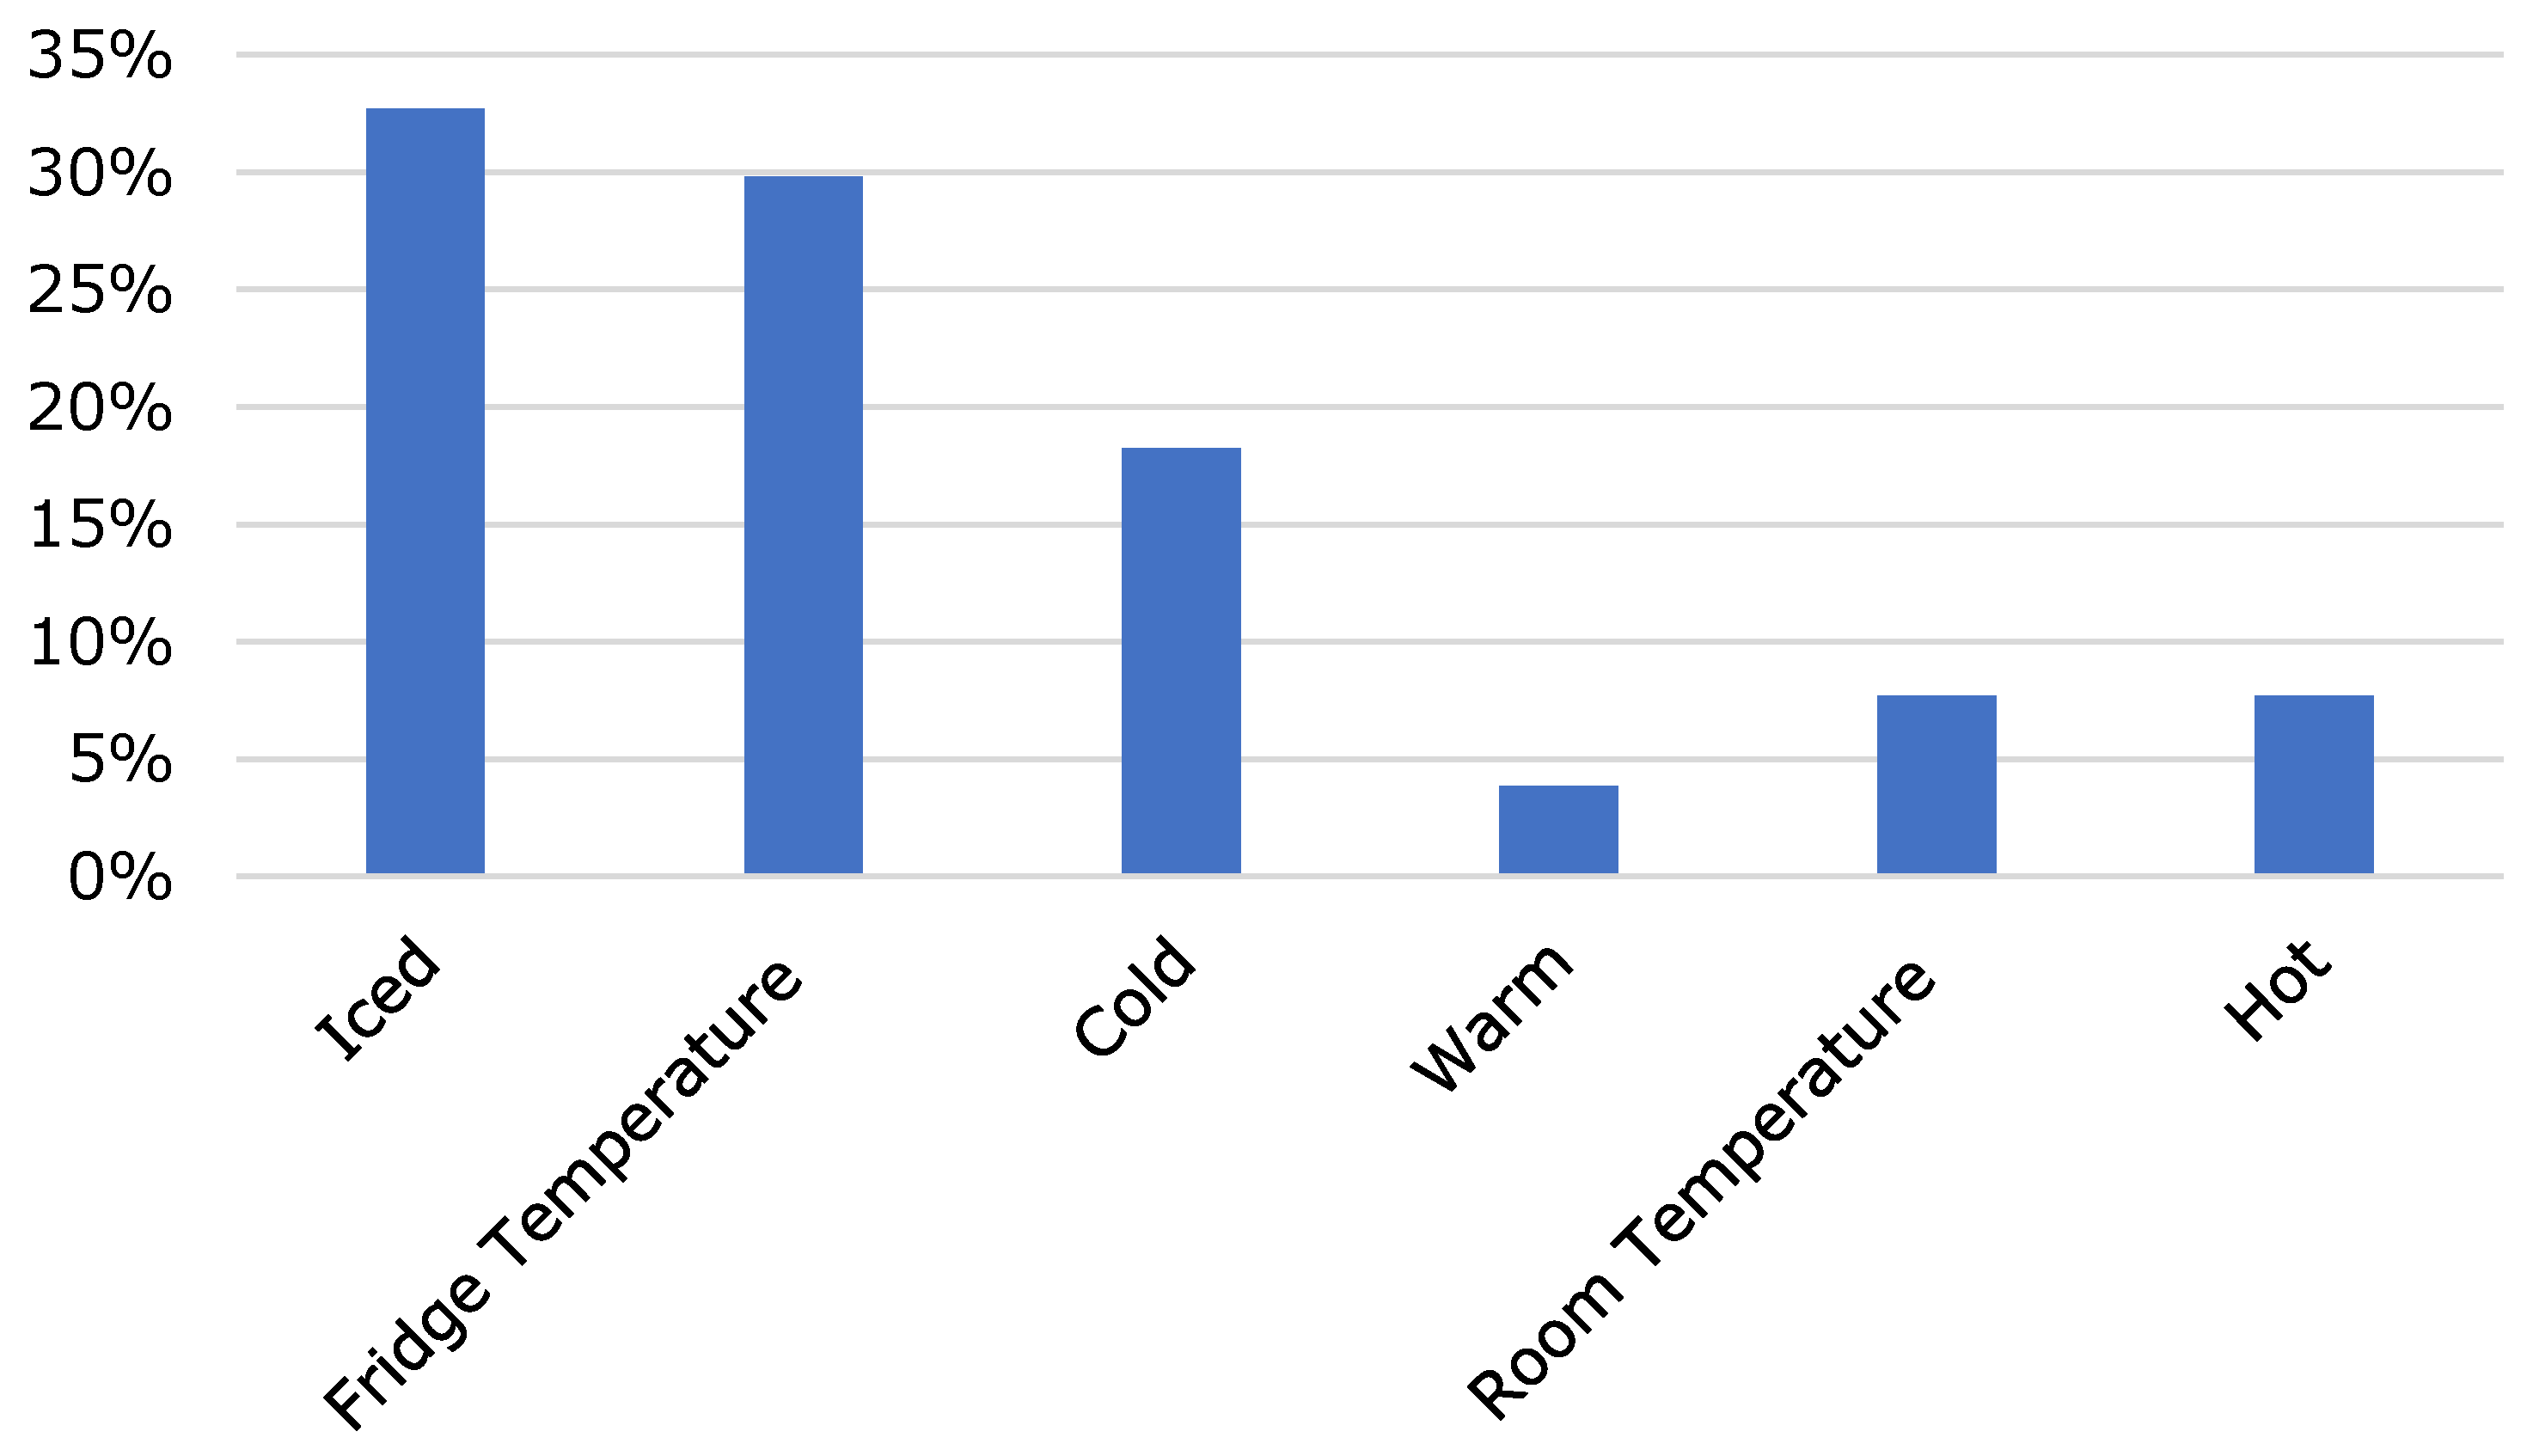
| Iced | 33% | Standard glass/mug | 36% | No | 53% | No | 67% | No | 74% |
| Fridge Temperature | 30% | Large glass | 49% | Yes | 18% | Yes | 12% | Yes | 14% |
| Cold | 18% | Small shot glass | 15% | Sometimes | 20% | Sometimes | 14% | Sometimes | 13% |
| Warm | 4% | Non-dairy | 9% | Syrup or honey | 6% | ||||
| Room Temperature | 8% | ||||||||
| Hot | 8% | ||||||||
| Formic Acid | Chlorogenic Acid | Caffeine | Acetic Acid | HMF | Lactic Acid | Trigonelline | |
|---|---|---|---|---|---|---|---|
| Ultrasonication | +16% | +71% | +26% | +21% | +16% | +81% | +19% |
| Constant agitation | +3% | +26% | +10% | +5% | +13% | +21% | +3% |
| Test Material | No. of Assessors | No. of Correct Responses | Significance 1 | LCI/UCI 2 |
|---|---|---|---|---|
| Hot brew vs. cold brew | 25 | 20 | yes (α = 0.001) | 0.50/0.90 |
| Nitro cold brew: Arabica Catuaí (Brazil) vs. Arabica S795 (India) | 25 | 12 | no | - 3 |
| Parameter | Most Frequent Response | Percentage of Response |
|---|---|---|
| Preparation site | at home | 71% |
| Experience | 1–5 years | 56% |
| Extraction method | commercial system | 19% |
| Dosage | 50–100 g/L | 44% |
| Water hardness | soft | 44% |
| Extraction temperature | 8 °C | 47% |
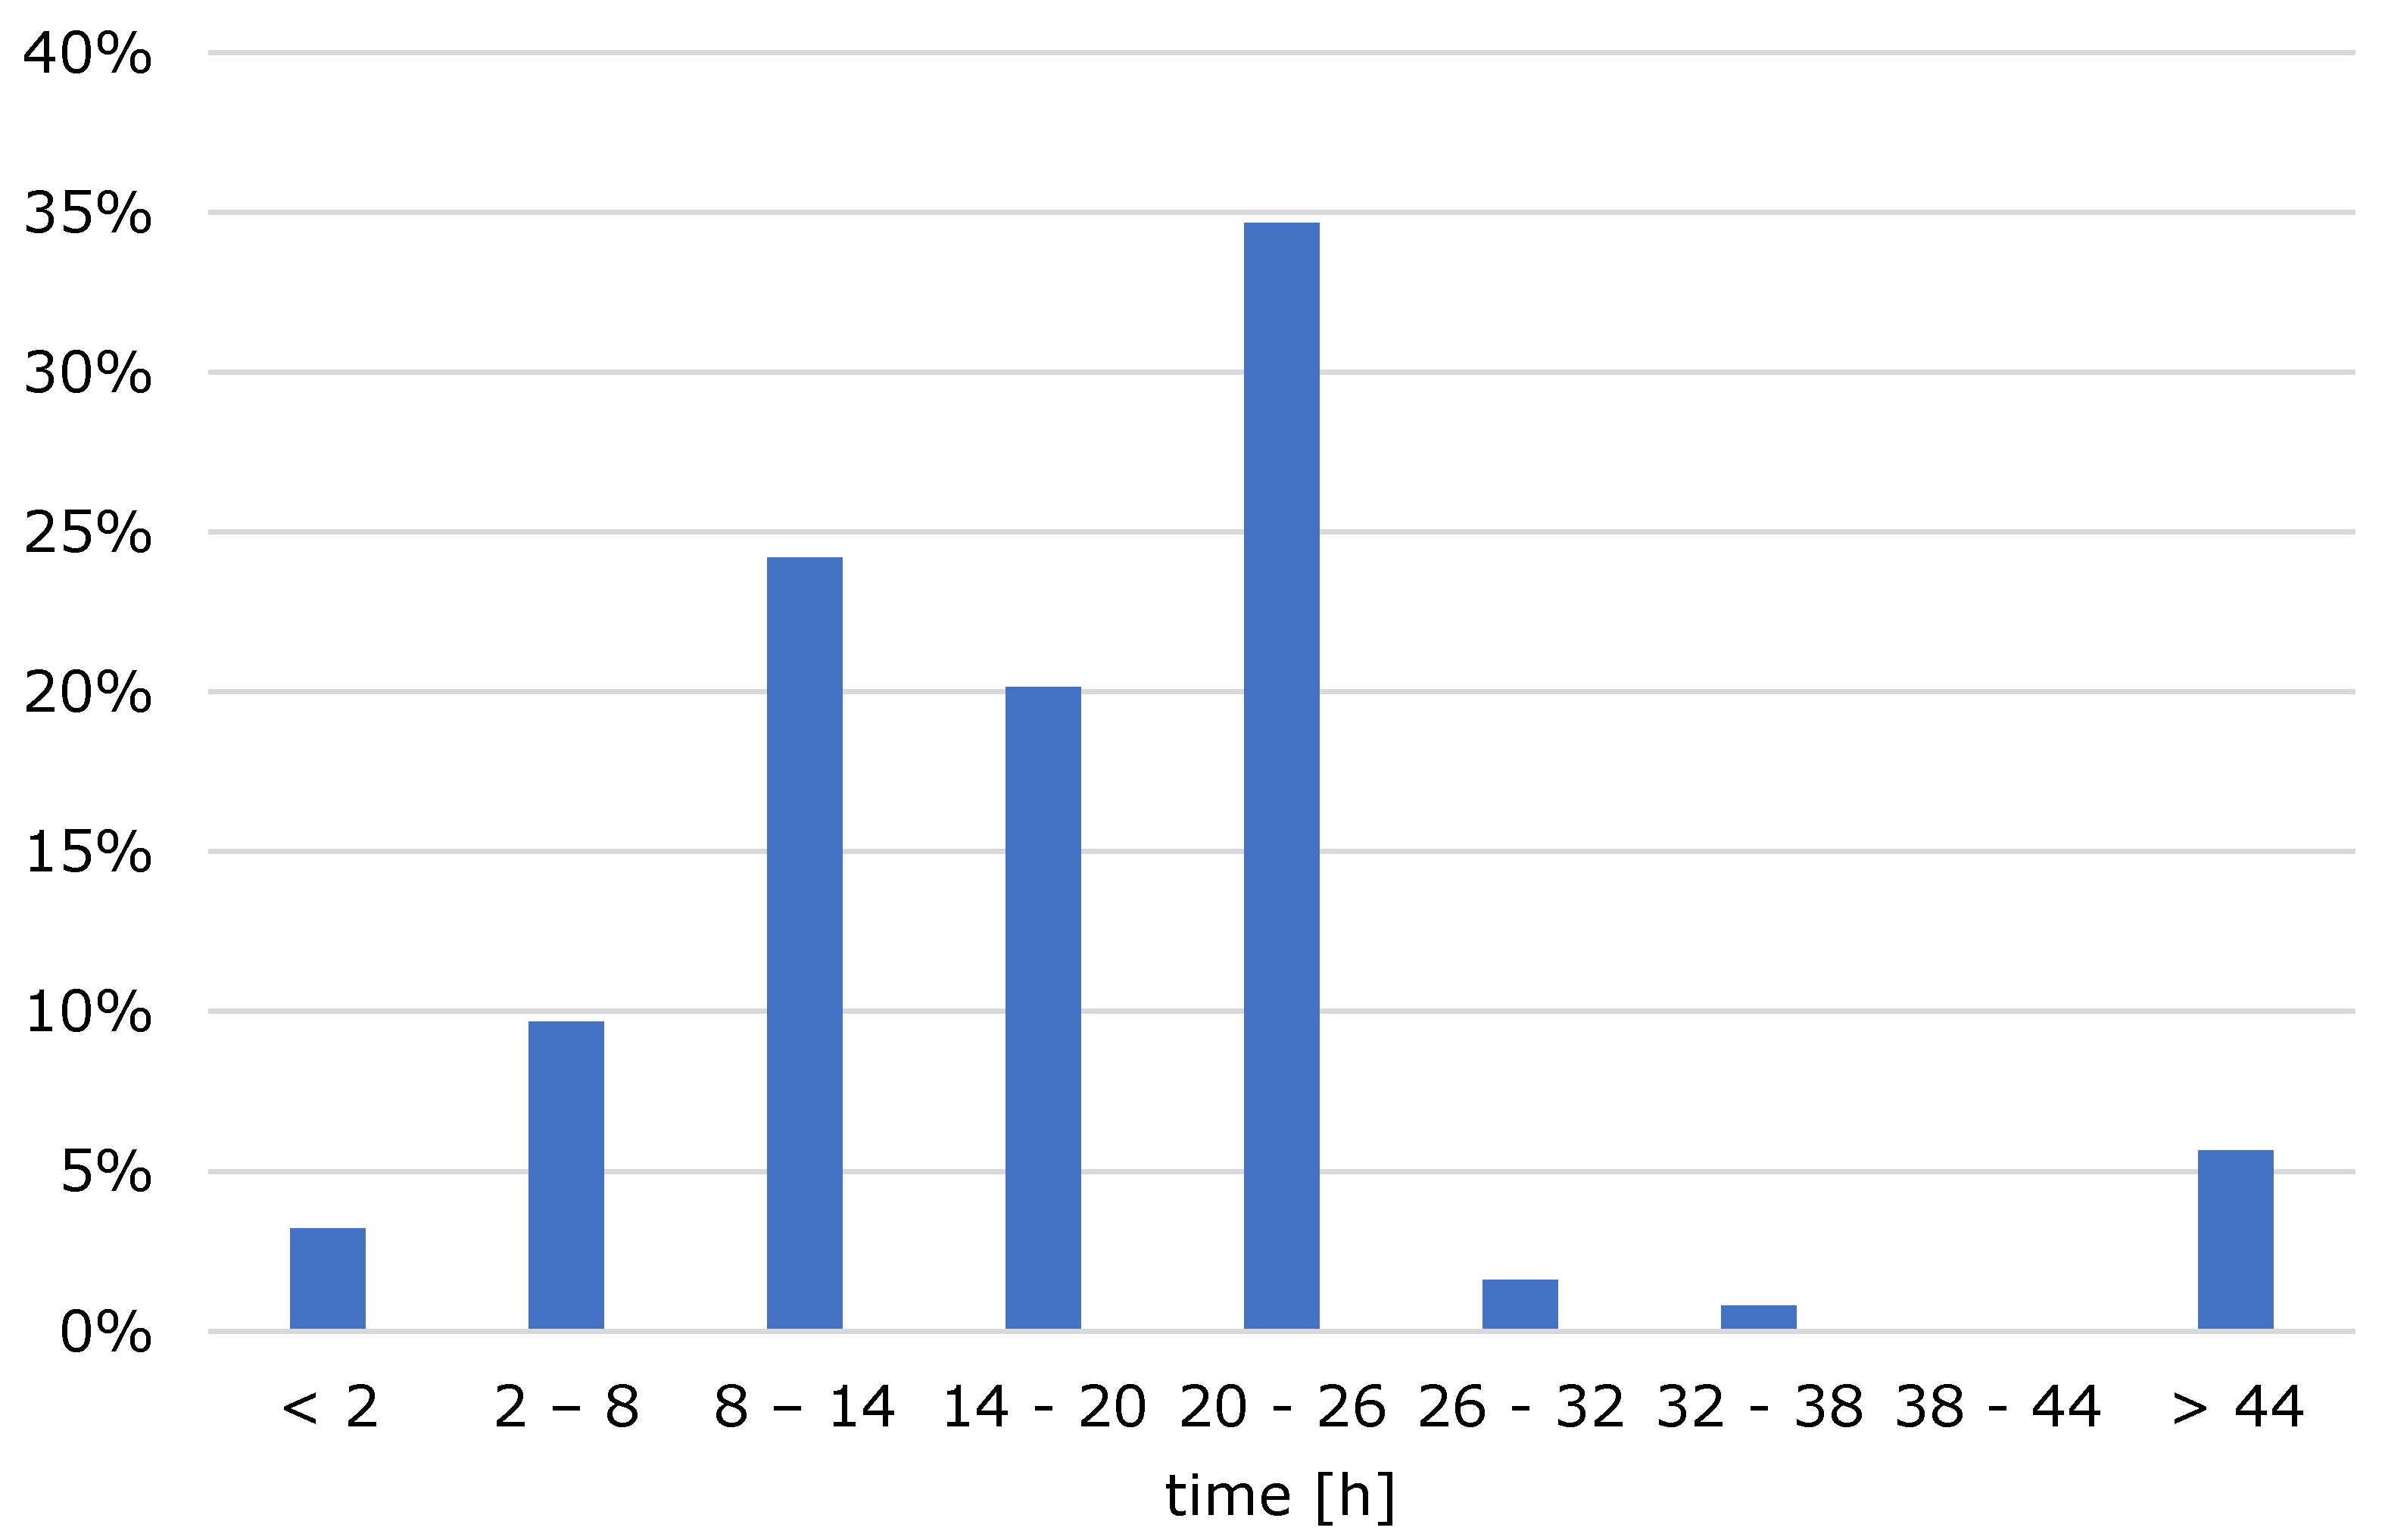
| Extraction time | 20–26 h | 35% |
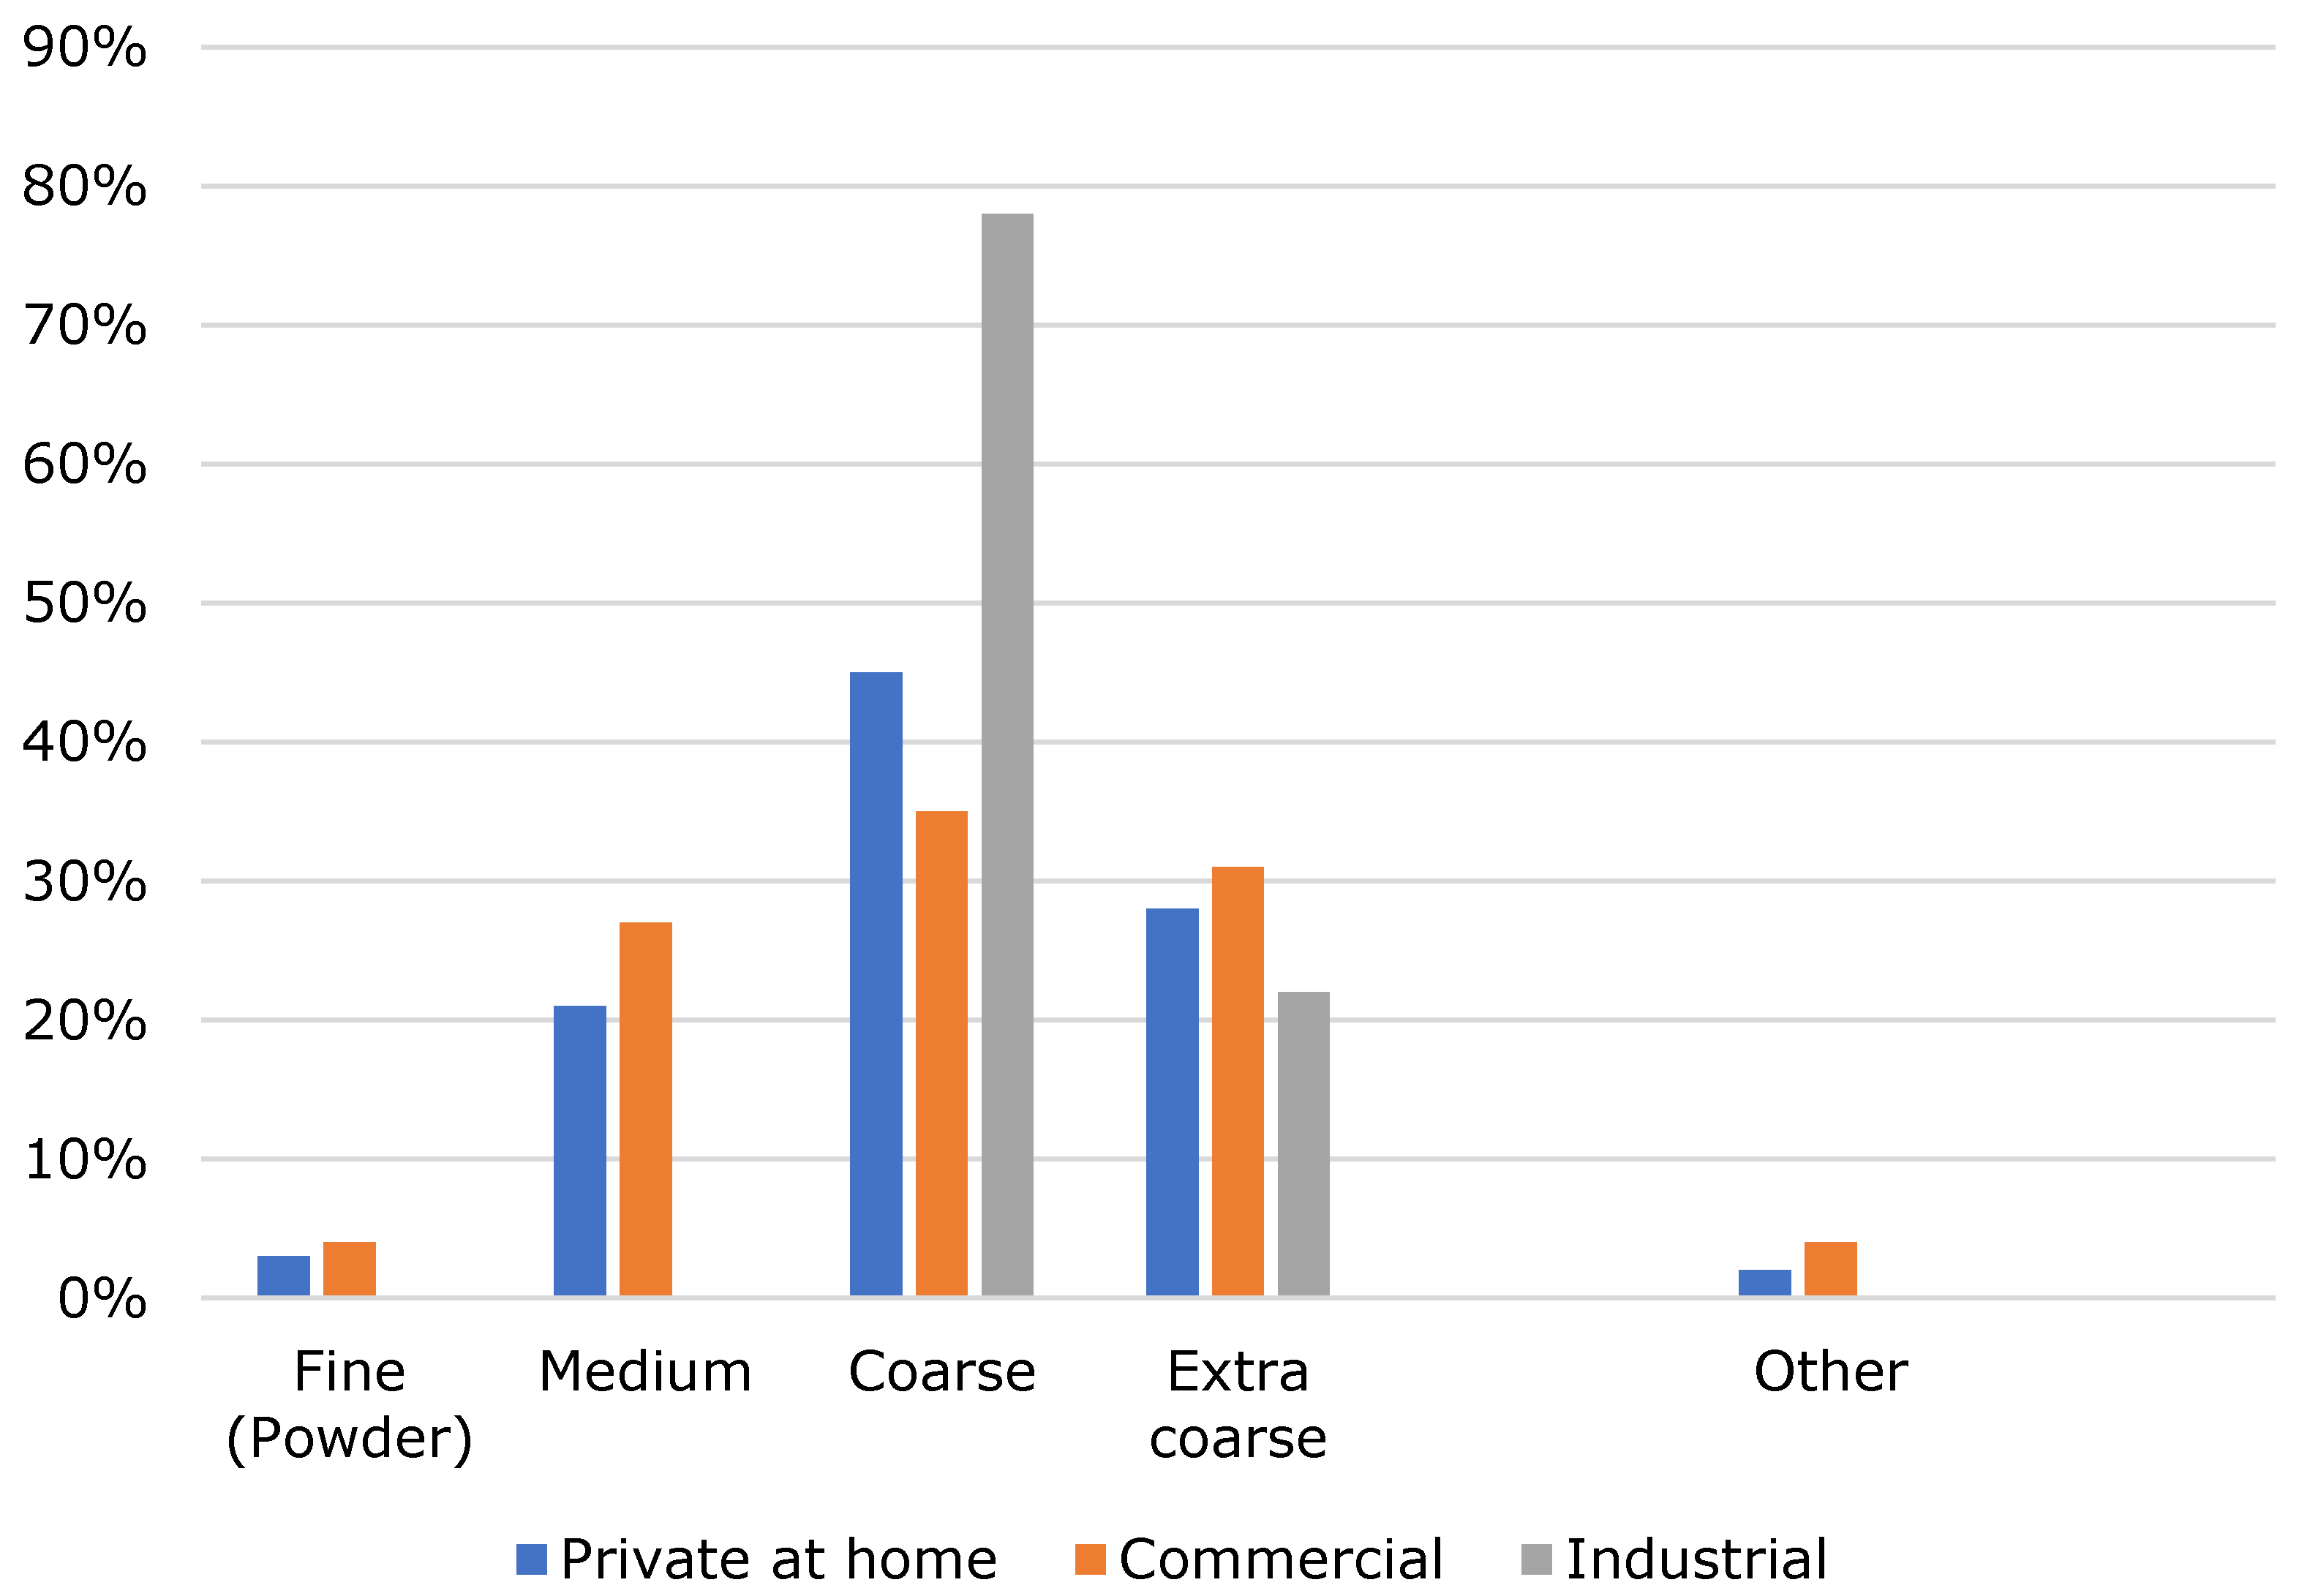
| Grinding degree | coarse | 45% |
| Coffee type | Arabica | 53% |
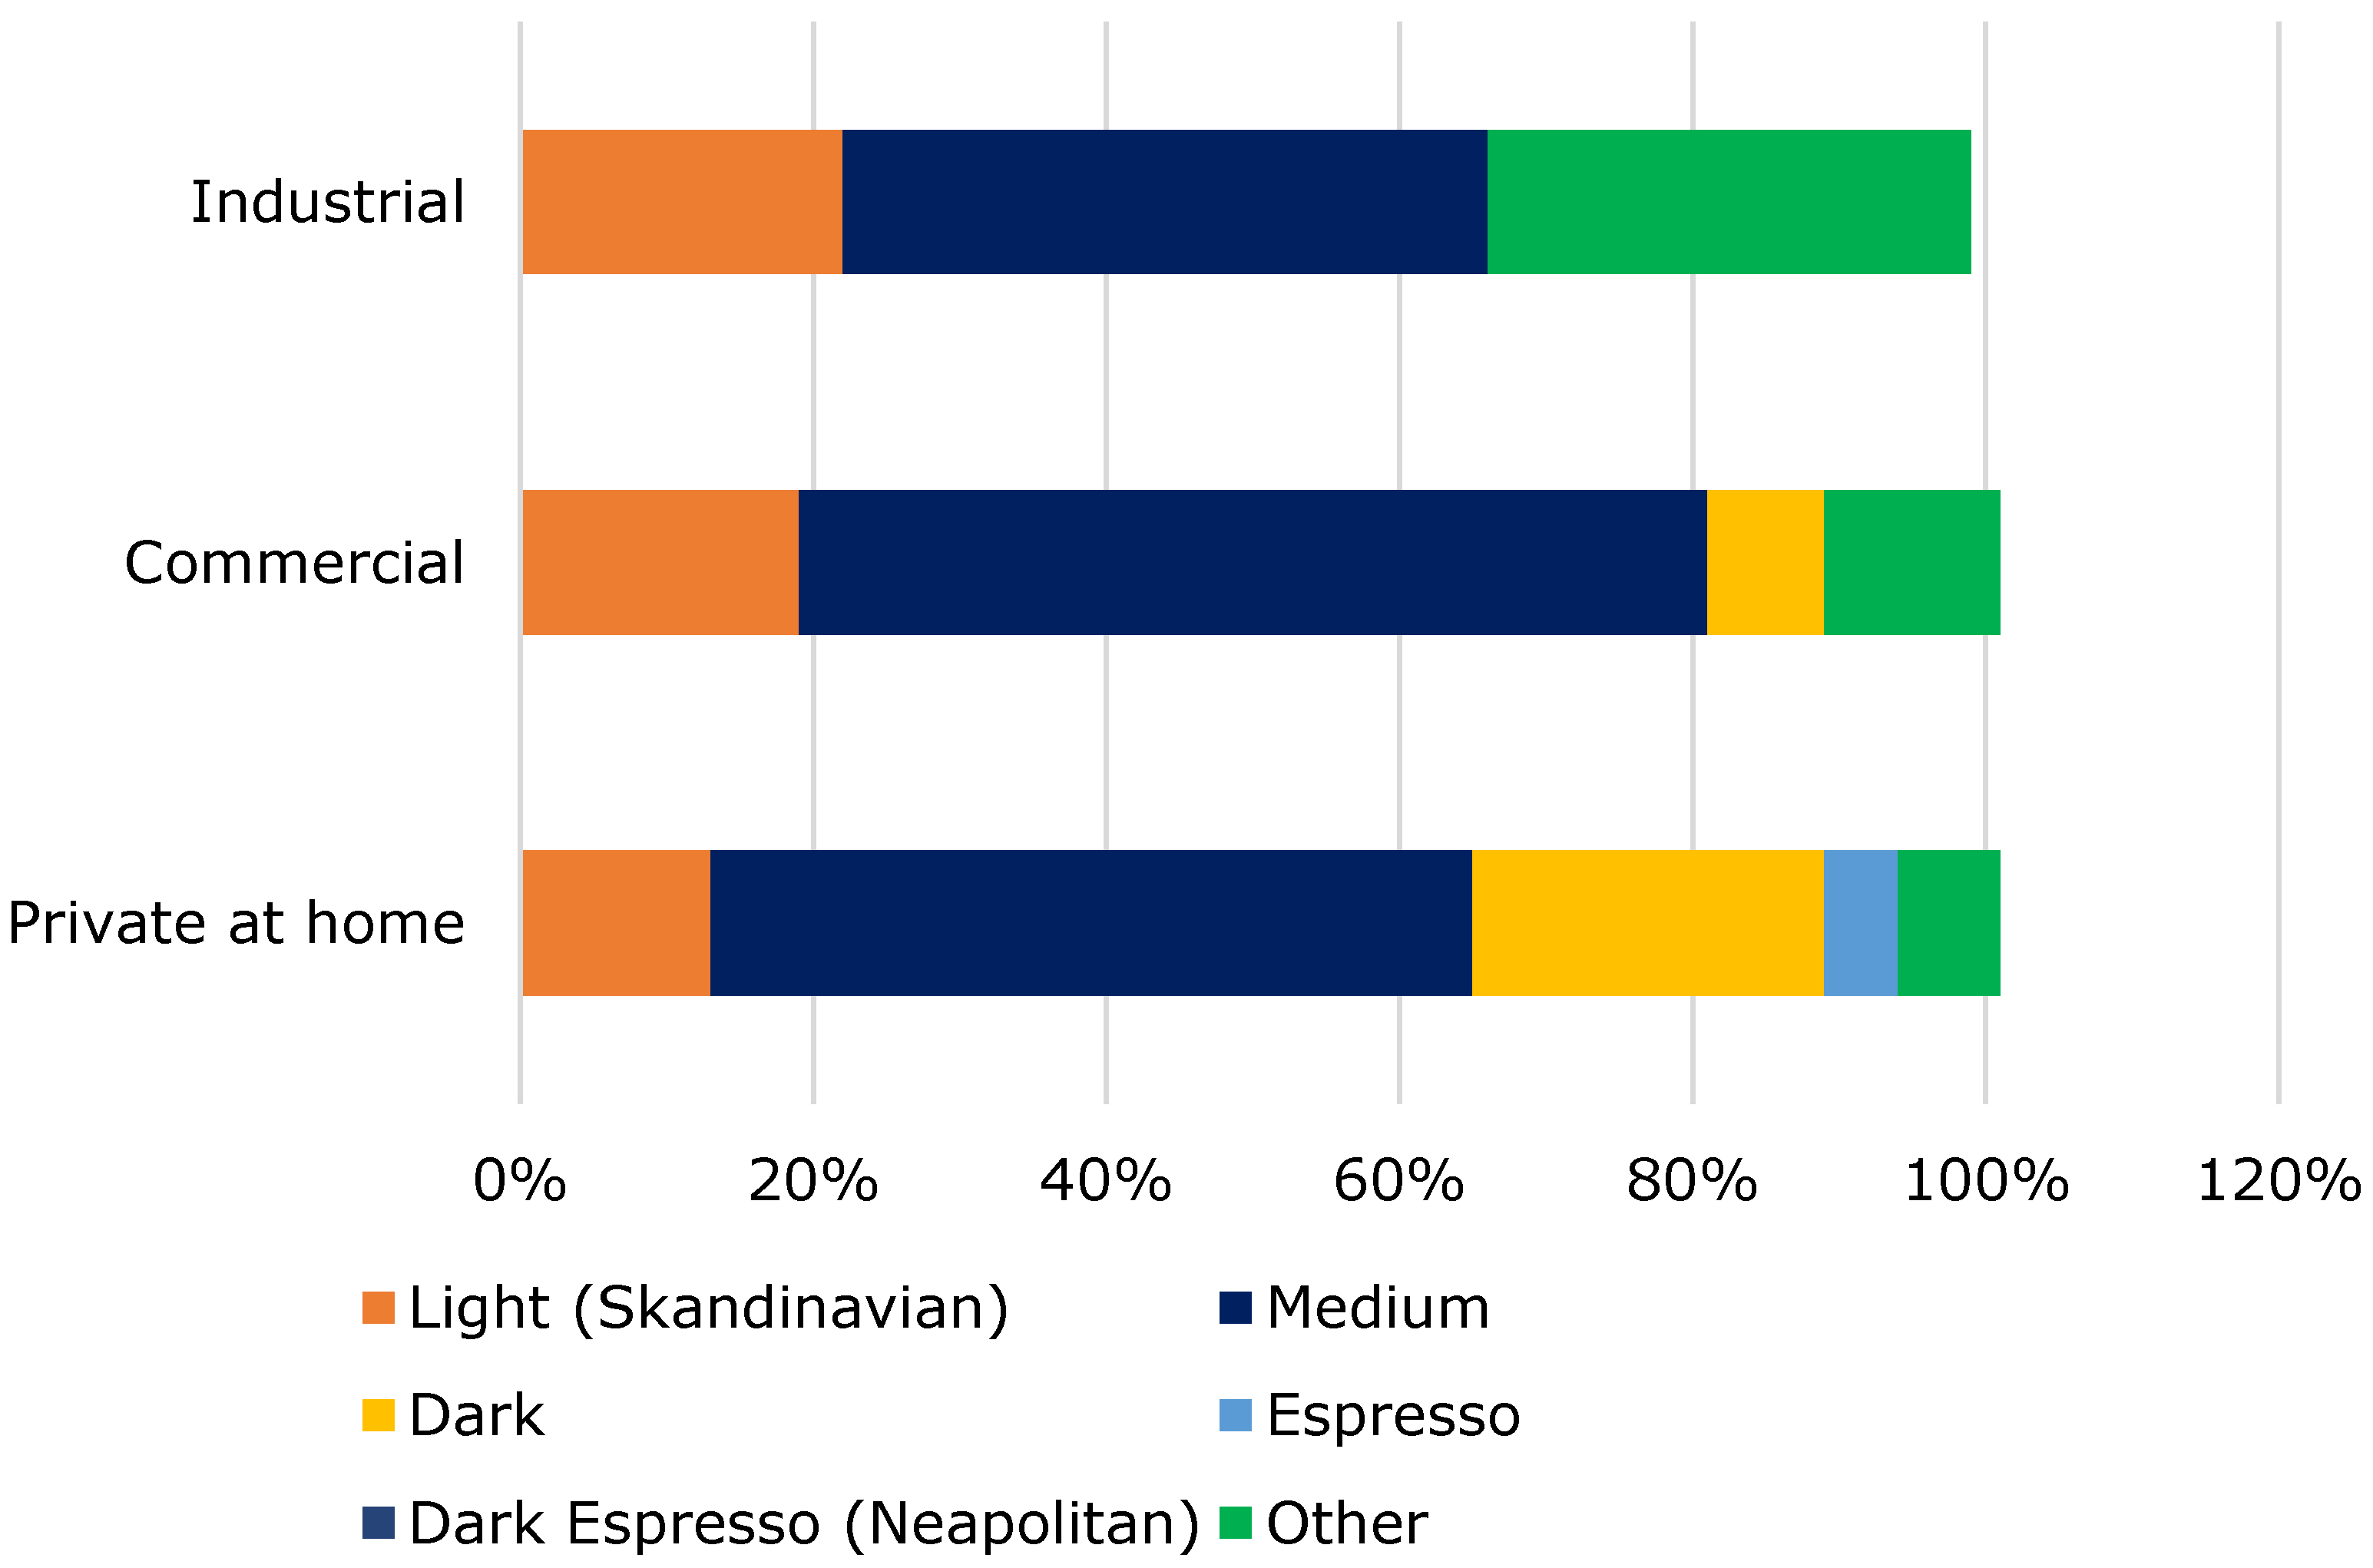
| Degree of roasting | medium | 54% |
| Storage time | 1.5 days | Average |
| Preparation |
| |
| Advantages | less acidity and bitterness |
Publisher’s Note: MDPI stays neutral with regard to jurisdictional claims in published maps and institutional affiliations. |
© 2021 by the authors. Licensee MDPI, Basel, Switzerland. This article is an open access article distributed under the terms and conditions of the Creative Commons Attribution (CC BY) license (https://creativecommons.org/licenses/by/4.0/).
Share and Cite
Claassen, L.; Rinderknecht, M.; Porth, T.; Röhnisch, J.; Seren, H.Y.; Scharinger, A.; Gottstein, V.; Noack, D.; Schwarz, S.; Winkler, G.; et al. Cold Brew Coffee—Pilot Studies on Definition, Extraction, Consumer Preference, Chemical Characterization and Microbiological Hazards. Foods 2021, 10, 865. https://doi.org/10.3390/foods10040865
Claassen L, Rinderknecht M, Porth T, Röhnisch J, Seren HY, Scharinger A, Gottstein V, Noack D, Schwarz S, Winkler G, et al. Cold Brew Coffee—Pilot Studies on Definition, Extraction, Consumer Preference, Chemical Characterization and Microbiological Hazards. Foods. 2021; 10(4):865. https://doi.org/10.3390/foods10040865
Chicago/Turabian StyleClaassen, Linda, Maximilian Rinderknecht, Theresa Porth, Julia Röhnisch, Hatice Yasemin Seren, Andreas Scharinger, Vera Gottstein, Daniela Noack, Steffen Schwarz, Gertrud Winkler, and et al. 2021. "Cold Brew Coffee—Pilot Studies on Definition, Extraction, Consumer Preference, Chemical Characterization and Microbiological Hazards" Foods 10, no. 4: 865. https://doi.org/10.3390/foods10040865
APA StyleClaassen, L., Rinderknecht, M., Porth, T., Röhnisch, J., Seren, H. Y., Scharinger, A., Gottstein, V., Noack, D., Schwarz, S., Winkler, G., & Lachenmeier, D. W. (2021). Cold Brew Coffee—Pilot Studies on Definition, Extraction, Consumer Preference, Chemical Characterization and Microbiological Hazards. Foods, 10(4), 865. https://doi.org/10.3390/foods10040865