Abstract
Micellar casein and casein monomers in milk serum are in a dynamic equilibrium. At temperature below 15–20 °C a considerable amount of casein monomers, β-casein in particular, is released from the casein micelle into the aqueous serum phase. This study investigates the effects of added calcium and related variations of pH on this peculiar equilibrium in order to minimize the amount of caseins in the serum and to better understand the casein permeation during microfiltration. The pH was varied in the range of 6.3 to 7.3 and the content of calcium was increased up to 7.5 mM by adding CaCl2. Upon equilibration, the milk was separated by ultracentrifugation and the amounts of protein in the supernatant were analyzed. It was shown that the addition of low amounts of calcium shifts the equilibrium towards the micellar casein phase and can, thus, lower the serum casein content induced at low temperatures. Relative to that, the adjustment of pH separately from the CaCl2 addition had a minor effect on casein concentration and composition in the serum.
1. Introduction
Caseins in milk exist in the form of micelles and to a smaller extent as soluble monomers in the milk serum. These two fractions stay in a dynamic equilibrium, depending on various factors, e.g., temperature and ionic environment [1]. The structural interaction of the four main casein monomers, namely αS1, αS2-, β-, and κ-casein, forming micelles is described either by the calcium-phosphate nanocluster model [2,3] or by the dual binding model [4]. Hereby, the calcium content in particular is of relevance as a stabilizing factor of the micellar structure [5]. Temperatures below 15 °C lead to an increased release of casein monomers from the casein micelles into the aqueous serum [6,7,8]. The equilibrium between soluble and micellar bound casein can be modified on purpose or unintentionally as a consequence of processing and compositional variations.
One of these unintended side effects is an increased serum casein concentration affecting milk protein fractionation by means of microfiltration (MF), if conducted at low temperatures, as reported, e.g., Schiffer et al. [9] or France et al. [10], instead of 50–55 °C [11,12]. This can negatively affect the fractionation result by an increased transfer of casein monomers together with the equally sized whey proteins into the MF permeate, thus reducing the purity of the whey protein fraction. The whey protein fraction is the target fraction meant to be obtained in the permeate, except for some specific applications, to obtain β-casein enriched MF permeate [13]. Lower temperatures also increase the solubility of calcium and phosphate [14] and the pH of milk [15]. The solubility of αS- and β-casein also depends on pH and, thus, indirectly on temperature [16].
To reduce the effect of the release of casein monomers into the serum at low temperatures, Schiffer et al. [17] studied the effect of calcium chloride addition in low amounts to skim milk prior to microfiltration. The authors reported that this in fact reduces the permeation of casein monomers into the MF permeate, which could be seen as the equivalent to the milk serum. However, this effect could not be clearly attributed to changes in the dynamic casein micelle/serum casein equilibrium as such, because the calcium addition also induces a tighter deposited casein layer structure of the retained casein micelles on the membrane surface. Therefore, a reduction of casein monomer concentration in the MF permeate could also be attributed to the increased retention capacity of the deposited casein layer instead of a reduction of casein monomers in the milk serum (Figure 1).
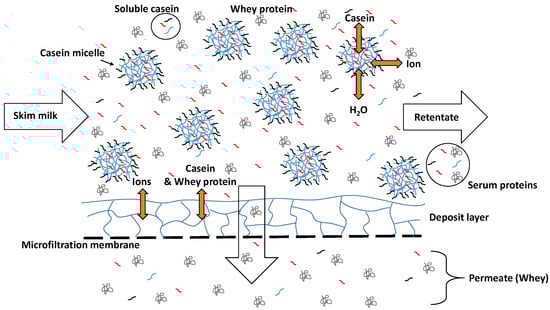
Figure 1.
Schematic representation of the separation of casein and whey protein regarding a skim milk microfiltration.
Even though the serum casein reducing effect of a calcium addition to milk was shown [18] for selected temperature conditions, a systematic and wider investigation across the entire relevant 6–20 °C range, which is of particular interest regarding MF process optimization, is lacking. Another aspect is that the addition of CaCl2 to milk also results in a pH reduction [19]. Besides the enhancement of ionic interactions between the caseins upon calcium addition, pH related electrostatic effects could occur, thus changing protein–protein interactions.
Therefore, to better understand the effects of a calcium enrichment on the equilibrium between micellar bound and soluble casein at low temperature, the milk serum can be separated by ultracentrifugation [8,20] without the retention effects of the conditions prevailing in microfiltration.
It was the aim of this study to better understand the complexity of combined effects between temperature, pH, and calcium addition on the equilibrium between micellar bound and soluble caseins as well as between ions. The purpose was to gain new insights into protein–protein interactions between casein species as a function of aqueous phase composition and temperature-induced changes in the casein micelle. The temperature was varied in a range of 6 and 20 °C to induce the release of mainly β-casein into the serum at various levels. To assess the impact of the pH resulting from the temperature shift, different pH values were moderately adjusted at the respective temperatures in a range between pH 6.3 and 7.3. Furthermore, 0–7.5 mM calcium were added (in the form of CaCl2) to investigate its effect on the serum casein concentration. To separate the structuring effect of calcium from the altered electrostatic repulsion resulting from the CaCl2 induced change in pH, an additional pH re-adjustment after the addition of different amounts of CaCl2 was performed.
2. Materials and Methods
2.1. Skim Milk and Preparation for Experiments
Pasteurized skim milk (74 °C/28 s) was obtained from the local dairy (Molkerei Weihenstephan GmbH & Co. KG, Freising, Germany). For experiments with an enhanced calcium concentration, a 1 M CaCl2 solution was added in different amounts and the milk was stirred overnight at 4 °C before use. Before, an experiment was conducted the milk was stored for at least 12 h at 4 °C. The samples were held at the target temperature (6–20 °C) for 60 min to achieve the new equilibrium between soluble and micellar bound casein, following a report by Liu et al. [20]. Then, the pH was adjusted with 1 M potassium hydroxide solution and 1 M hydrochloric acid and the samples were tempered for an additional 15 min. This resulted in a temperature profile where the samples were warmed up from 4 °C to 6–20 °C and tempered for 60 min. Then, the pH was adjusted at the particular temperature and after additional 15 min the samples were immediately placed into the tempered ultracentrifuge.
2.2. Separation of Micellar and Soluble Casein
Ultracentrifugation was conducted with an Ultracentrifuge Sorvall WX80 (Thermo Fisher Scientific, Waltham, MA, USA). The ultracentrifuge and the rotor head (Fiberlite F50L-24x1.5 Rotor, Thermo Fisher Scientific, Waltham, MA, USA) were tempered to the samples’ respective temperatures. 1 mL of sample was filled into a 1.5 mL Ultra Microtube (Thermo Fisher Scientific, Waltham, MA, USA). The required centrifugation time at 72,000× g was adjusted to the temperature related viscosity (measured by a MCR 302 rheometer from Anton Paar GmbH, Graz, Austria), this centrifugation force is sufficient to separate the soluble milk proteins from micellar or aggregated casein structures as shown by Dumpler et al. [21]. A shift in the temperature changes the milk viscosity and therefore, the conditions required to obtain a constant separation effect. To exclude a shift in the separation efficiency, due to a variation in the centrifugal force [22] the process time was adjusted as a function of the temperature. The centrifugation time was calculated with the dynamic viscosity of the serum phase (η), the density of the protein (σ) and serum phase (), the critical diameter of proteins which should precipitated (d), the height of the filling level of the samples (x), the radius of the samples in the rotor head (R), as well as the rotation speed (n). The calculated centrifugal time as a function of the temperature is shown in the Appendix A (Figure A1).
2.3. Analyses
The quantification of the proteins was conducted via reversed phase high performance liquid chromatography (RP-HPLC) using an Agilent 1100 Series chromatograph (Agilent Technologies, Waldbronn, Germany) with a C18 analytical silica-based column (Agilent Zorbax 300SB-C18, 4.6 × 150 mm, 5 μm). The simultaneous quantitative analysis of the whey protein and casein fractions (αS1-, αS2-, β-, and κ-casein) was performed applying a method developed by Dumpler et al. [21], via a dilution of the samples in a guanidine puffer. During the analysis, solvent A (0.1% trifluoroacetic acid (TFA) in 90% HPLC grade water and 10% acetonitrile) as well as solvent B (0.07% TFA in 10% HPLC grade water and 90% acetonitrile) were used with a flow rate of 1.2 mL min−1 at 40 °C. A chromatogram of the protein profile of skim milk as well as the serum phase after ultracentrifugation is shown in the Appendix A (Figure A2). The total casein concentration was calculated by adding up the respective casein fractions of αS1-, αS2-, β-, and κ-casein.
For the determination of the ion concentration in the serum phase after ultracentrifugation, the protein fraction was removed. The serum phase was diluted 1:4 with Milli-Q-water and filtered by a modified PES 10 K filter (VRW, Radnor, PA, USA) under centrifugal conditions at 10,000× g for 10 min (Z 233 M-2, Hermle Labortechnik GmbH, Wehingen, Germany). To minimize the loss of ions remaining in the filter unit, the filters were flushed twice with 500 µL MilliQ-water under the same centrifugation conditions at 10,000× g for 10 min. Quantification of the ion concentration in the serum phase was carried out according to the method described by Dumpler et al. [23].
2.4. Data Evaluation and Statistics
Data plotting and statistical data evaluation was performed using OriginPro 2017G (OriginLab Corporation, Northampton, MA, USA). The statistical analysis was performed using data series as a function of temperature (8 settings), pH (5 settings), calcium addition (5 settings) as well as calcium addition with pH adjustment (6 settings). All setting combinations were done in duplicates. The standard deviation from the mean value was calculated within a data series. Statistical significance between or within a data series was evaluated using analysis of variance (ANOVA) as well as a t-test. The calculated p-values are given in the text and indicate the significance level (p ≤ 0.05).
3. Results and Discussion
3.1. Serum Concentration of β-Casein Lowers with Increasing Temperature
At first, the effect of temperature as such was assessed. As shown in Figure 2, the total serum casein concentration decreases linearly with increasing temperature. β-casein was identified as the casein monomer with the most pronounced changes in the serum concentration. This could be due to its primarily hydrophobic protein–protein interactions [7]. In contrast to β-casein, the concentrations of αS1-, αS2- and κ-casein stayed nearly constant. The ionic stabilizing effects determining the integration of αS1- and αS2-caseins in the micelle are likely to be only slightly affected by a temperature shift [24]. The constant κ-casein concentration is assumed to occur, due to the fact that κ-casein shows low calcium phosphate binding capacity, glycosylation patterns enable hydrophilic protein–protein interactions [25]. As a result, the pronounced effect of temperature on the serum β-casein concentration changes the casein monomer ratio of the serum phase as a function of the temperature.
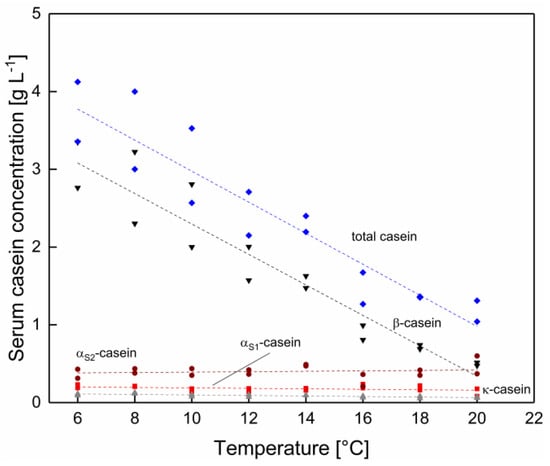
Figure 2.
Protein concentration in the serum phase as a function of temperature in Δϑ steps of 2 °C for total casein concentration (◆) and the casein species αS1- (■), αS2- (●), β- (▼), and κ-casein (▲) (n = 2). Data points are individual experiments. The lines are a guide to the eye. Total casein and β-casein concentration change significantly (p < 0.05) and αS1-, αS2 and κ-casein concentration not significant (p > 0.05) as a function of the temperature.
Temperature not only affects the equilibrium of micellar and serum caseins, but also the concentration of soluble ions in the serum phase. With increasing temperature, the pH of milk decreased slightly from 6.78 at 6 °C to 6.72 at 20 °C (Table A1 in Appendix A). However, the mean anion and cation concentration in the serum phase did not change significantly in the temperature range between 6–20 °C, as shown in Table A2 and Table A3 in the Appendix A (p > 0.05). As reported by Dumpler et al. [23] a shift in the ion equilibria can occur if the temperature is further increased up to 50 °C.
3.2. Effect of pH on the Serum Casein Concentration
As shown in Section 3.1 with decreasing temperature the casein concentration in the serum phase as well as the pH increased. To observe whether the temperature induced changes in the pH have an additional effect on the casein equilibrium, the pH was adjusted for each temperature between 6–20 °C in 2 °C intervals to pH 6.3, 6.5, 7.0, and 7.3. This moderate changes were applied to determine if not only changes in the hydrophobic interactions but also the shift in the pH, has an effect on the solubility of the single casein species.
It could be shown that serum κ-casein and αS1-casein concentration significantly changed as a function of pH (at temperatures between 6–20) (Figure 3 and Figure 4) (p < 0.05). In contrast to that, the serum concentration of β‑casein as well as αS2‑casein were not significantly affected by the pH (data not shown) (p > 0.05). Therefore, in this section only data for κ-casein and αS1-casein are presented.
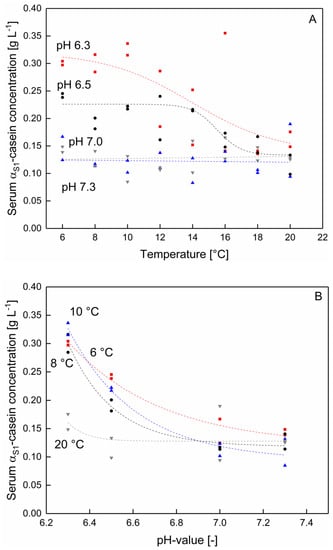
Figure 3.
αS1-casein concentration in the serum phase (A) as a function of the temperature at pH 6.3 (■), 6.5 (●), 7.0 (▲), and 7.3 (▼) and (B) as a function of the pH at 6 (■), 8 (●), 10 (▲), and 20 °C (▼) (n = 2). Data points are individual experiments. The lines are a guide to the eye. αS1-concentration changes significantly between 6–10 °C as function of the pH (7.0–6.3) (p < 0.05). Changes between pH 7.0 and 7.3 at 6–20 °C and between pH 6.0–7.3 at 12–20 °C were not significant (p > 0.05).
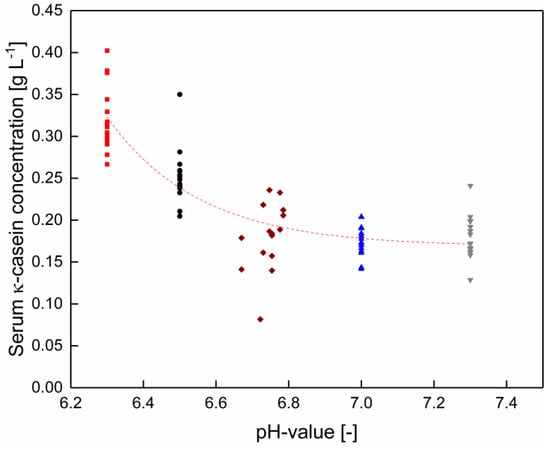
Figure 4.
κ-casein concentration in the serum phase without pH adjustment (◆), as well as at pH 6.3 (■), 6.5 (●), 7.0 (▲), and 7.3 (▼) between 6–20 °C for each pH (n = 2). Data points are individual experiments. The red line is a guide to the eye. κ-casein concentration changes significantly between the skim milk without and with a pH adjustment to 6.0 (p < 0.05).
As shown in Figure 3A, the serum concentration of αS1-casein increases with decreasing pH in the range of 6.5–6.3, whereas after an increase towards pH 7.0 and 7.3, the αS1-casein concentration remained unaffected. As can be seen the pH affects the αS1 serum casein concentration mainly in the low temperature range between 6–10 °C (Figure 3B). The temperature dependent solubility of αS1-caseins is in accordance with the findings of Post et al. [16]. The authors reported a solubility maximum of αS-casein in micellar casein solutions at 2 °C at approx. pH 5.5–5.2, which could not be observed at 20 °C. Therefore, with the data shown in Figure 3B it can be specified that a shift in the solubility of αS1 occurs as a function of the pH at temperatures as low as 10 °C. It is assumed that at lower temperatures both binding mechanisms of αS1‑caseins within the casein micelle, hydrophobic interactions as well as the binding to calcium phosphate clusters [25] are weakened and thus the solubility is increased.
The κ-casein serum concentration decreased with increasing pH. In contrast to αS1-casein, this effect was independent of the temperature (Figure 4). At pH values between native conditions and pH 7.3, the κ-casein concentration is constant (p > 0.05). κ-casein is the weakness calcium phosphate binding protein of all casein species [26]. The increasing κ-casein concentration in the serum phase with decreasing pH is linked to an increasing calcium solubility and therefore, reduced interactions between caseins and ions as well as proteins in the micellar structure [24,27].
3.3. Increasing Calcium and Phosphate Concentration in the Serum Phase with Decreasing pH
A decrease of the pH leads to a mutual effect of an H+ enrichment as well as a shift in the ion equilibrium. Therefore, it was assumed in Section 3.2 that changes in the ion equilibrium as a function of the pH contribute to the observed pH-dependent changes in the serum concentration of αS1- and κ-casein. As shown for phosphate and for calcium in Table 1, the serum concentrations of these ions were significantly affected by the pH (p < 0.05). However, at pH 7.0 and 7.3 the calcium concentration does not change significantly (p > 0.05), comparable to the behavior of αS1- and κ-casein. By lowering the pH micellar ions dissociate into the serum [28]. An increase of the citrate concentration could be observed as well when the pH was decreased to 6.3, independently of the temperature (p > 0.05) (Table 1) The magnesium concentration neither changed significantly with the temperature, nor with the pH within the pH range studied (p > 0.05) (Table 1).

Table 1.
Mean values of calcium, phosphate citrate and magnesium concentrations between 6–20 °C in the serum phase of skim milk at pH 6.3–7.3.a.
In conclusion, it could be shown that changes in the total serum casein concentration are affected by a temperature variation, whereas the pH did not have a significant effect on the casein micelle/serum casein equilibrium (data shown in Figure A3 in the Appendix A) (p > 0.05). Even though the total serum casein concentration in this temperature range cannot be influenced by changing the pH in a moderate range, it is possible to affect the single casein species αS1- and κ-casein as well as the ion equilibrium.
3.4. Decrease of the Serum Casein Concentration with Increasing Calcium Enrichemt
To decrease the serum casein concentration, calcium was enriched in order to bind within calcium phosphate clusters to the caseins, strengthening the casein–casein interaction and forming casein aggregates.
To determine the effect of a calcium addition the mean serum casein concentration over the total temperature range from 6–20 °C was compared as a function of the calcium enrichment (Figure 5). In Section 3.1 it could be shown that the serum casein concentration is linearly decreasing with increasing temperature. This linear trend as a function of temperature can also be observed with increasing calcium concentration (shown in Appendix A Figure A4). It can be determined that the temperature dependency of the serum casein content in the range of 6–20 °C decreases with increasing amount of added calcium until it vanishes completely at a concentration of 0.50 mM added calcium.
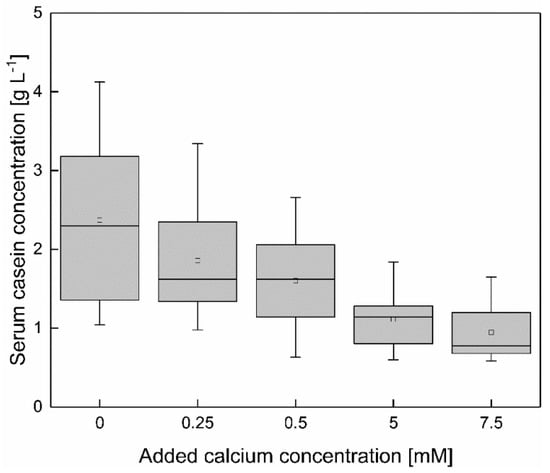
Figure 5.
Mean value of the total serum casein concentration of skim milk between 6–20 °C at different levels of calcium addition, shown in a box plot for all casein concentrations with the same levels of added calcium. Serum casein concentration (between 6–20 °C) decreased significantly with increasing calcium addition (p < 0.05).
The casein concentration as a function of the temperature shows a linear dependency at 0–7.5 mM calcium. Therefore, the effect of a calcium enrichment is shown via the comparison of the mean casein concentration, between 6–20 °C (n = 2), at 0–7.5 mM added calcium. As shown in Figure 5, increasing the calcium concentration (ϑ = 6–20 °C) reduces the serum casein concentration almost steadily. To determine significant changes in the serum casein concentration as a function of a calcium enrichment the results as shown in Figure 5 (mean casein concentration between 6–20 °C at 0–7.5 mM added calcium) were compared via t-test. Between the casein concentrations as a function of temperature of skim milk with 0.00 and 0.25 mM added calcium, no significant difference could be observed (p > 0.05). Therefore, the enrichment with 0.25 mM calcium was not sufficient to affect the casein equilibrium. A further increase of the added calcium concentration to 0.5–7.5 mM showed a significant reduction of the serum casein concentration, compared to native conditions (p < 0.05). However, an enhancement of the calcium concentration from 5–7.5 mM calcium did not result in a further decrease in serum casein concentration.
Even though increasing the calcium addition beyond 0.50 mM had no effect on the temperature dependency of the serum casein concentration, as described above, the total serum casein concentration can be decreased up to 5.00 mM. The conclusion is that 0.50 mM calcium are required to overcome the temperature dependency of the serum casein content but a reducing effect on the serum casein concentration can be observed up to an addition of 5.00 mM calcium.
As reported by Holt et al. [24] and Horne [29], the calcium sensitivity of the different casein species is dependent on the concentration of phosphorylated amino acids in the primary structure, which increases from αS2 > αS1 > β > κ. However, all casein species are affected significantly by the addition of calcium chloride (p < 0.05). In the following, it should be kept in mind that besides the enhancement of ionic interactions between calcium and serum caseins, the addition of CaCl2 also lowers the pH [19]. This could have an unintended side effect influencing the micelle/serum casein equilibrium comparable to the results in Section 3.2.
As can be seen in Figure 6, it is possible to decrease the β-casein concentration as a result of a calcium addition. At lower temperatures, the β-casein serum concentration can be reduced by adding calcium, but this effect vanishes as the temperature approaches 20 °C. Between 16–20 °C there seems to be no reduction in the serum β-casein concentration by increasing the calcium enrichment. Furthermore, after the addition of 5 mM calcium, there seems to be that the lowest possible serum β-casein level of 0.6 g L−1 across whole temperature range is reached, which is similar to the β-casein concentration in native skim milk at 20 °C. It is therefore assumed that it is possible to decrease the serum β-casein concentration at low temperatures and to counterbalance the decreased hydrophobic interactions, which result in an increased dissociation of β-casein from micellar structures. Effects of calcium addition at low temperature on the casein equilibrium are likely due to changes in the zeta potential, hydrophobicity and ionic interactions, decreasing the serum concentration as shown in Figure 6 [30,31]. Philippe et al. [30] could observe at room temperature a reduction of the β-casein concentration upon addition of 4.5 mM calcium. However, as depicted in Figure 6, the already low amount of β-casein determined at 16–20 °C could not be further reduced by the addition of calcium.
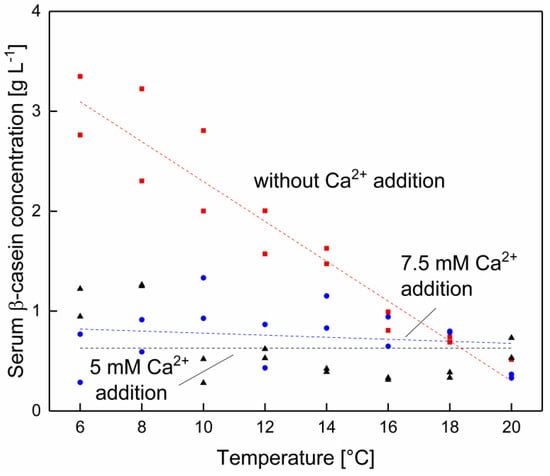
Figure 6.
β-casein concentration in the serum phase of skim milk at different levels of calcium addition at 6–20 °C with 0 (■), 5 (●), and 7.5 mM (▲) of added calcium (n = 2). Data points are individual experiments. The lines are a guide to the eye. Without calcium addition a significant (p < 0.05) and with 5–7.5 mM added calcium no significant (p > 0.05) change of the β-casein concentration as a function of the temperature was determined.
As shown in Figure 7A,B (mean αS1- and αS2-caseins concentration between 6–20 °C at 0–7.5 mM added calcium), the concentration of αS-caseins decreases with increasing calcium concentration. Small amounts of added calcium (0.25 mM) are sufficient to affect the αS-caseins due to their high calcium affinity [24,29]. The serum concentration of αS2–casein decreases from 0.4 g L−1 at native conditions to 0.28 g L−1 upon addition of 0.25–0.5 mM calcium and of αS1–casein to 0.21 g L−1 with 5–7.5 mM added calcium. The serum concentration of αS1–casein as a function of added calcium is comparable to the one of αS2 but at a lower level. The observed effect is independent of the temperature. Therefore, it can be summarized that besides β-casein also αS‑caseins are decreased by addition of calcium. However, αS2–casein is only decreased to a certain concentration of approx. 0.24 g L−1 which cannot be decreased further by adding more calcium than 0.25 mM.
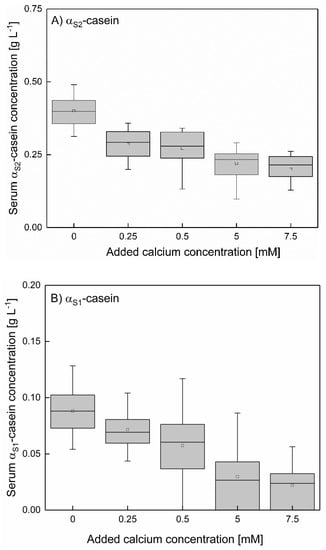
Figure 7.
Mean value of the serum αS2- (A) and αS1-casein (B) of skim milk between 6–20 °C at different levels of calcium addition, shown in a box plot for all casein concentrations with the same levels of added calcium. αS–casein concentration (mean value between 6–20 °C) decreased significantly with increasing calcium addition (p < 0.05).
In contrast to the data shown in Section 3.1 κ-casein shows after the enrichment of skim milk with calcium a significant dependency as a function of calcium addition as well as of temperature (p < 0.05), even though at native conditions no temperature dependency could be observed. The κ-casein concentrations in Figure 8A is shown as a function of the temperature, regardless of the calcium concentration and in in Figure 8B as a function of the calcium concentration, regardless of the temperature. Therefore, an impact of temperature and calcium concentration can be separated from one and another.
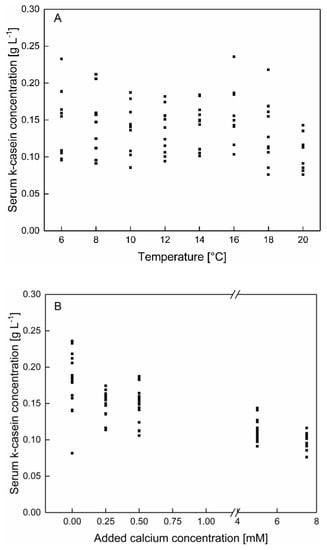
Figure 8.
κ-casein concentration in the serum phase of skim milk (A) as a function of the temperature with an addition of 0–7.5 mM calcium and (B) as a function of added calcium at 6–20 °C (n = 2). Data points are individual experiments. κ-casein concentration (between 6–20 °C) decreased significantly with increasing calcium addition (p < 0.05).
As shown in Figure 8A no specific shift of the κ-casein concentrations as a function of the temperature can be observed.
Regarding the calcium enrichment, a decrease of the serum κ-casein concentration with increasing calcium concentration can be observed (Figure 8B). The addition of calcium can increase the affinity for κ-casein to bind to micellar structures as well as to casein aggregates, likely due to the decrease of the pH following the calcium enrichment. This can may be attributed to a change in the zeta potential of the micellar surface following changes in the composition and protonation of ions and proteins at the micellar surface [30].
In summary, the addition of calcium can decrease the absolute serum casein concertation at low temperatures and counterbalance the temperature dependency of the serum casein concentration. At low temperatures, predominantly β-casein is affected, because of the high percentage in serum casein composition. Furthermore, regardless of the affinity to calcium ions the concentration of the other casein species in the serum decreases after addition of calcium.
3.5. Decreasing Phosphate and Citrate Concentration after the Addition of Calcium
To understand the effect of calcium on the casein equilibrium, the determination of anions as a function of added calcium can be studied. Added calcium can bind either to casein aggregates or with anions to form inorganic complexes.
The serum concentration of soluble phosphate and citrate as a function of added calcium is shown in Table 2. The concentration of both cations was constant between 0.00–0.50 mM of added calcium, whereas the total serum casein concentration decreases significantly after the addition of 0.50 mM calcium (Figure 5) (p < 0.05). The αS-caseins decrease after the addition of 0.25 mM calcium (Figure 7). Therefore, the added calcium forms ion complexes with the soluble caseins with a higher affinity than it is bound to soluble cations. After the addition of 5 mM calcium, the concentration of phosphate and citrate decreases in the soluble phase, due to the formation of inorganic ion complexes [30,31,32]. A further increase of the added calcium concentration decreases the soluble anion concentration. Therefore, a precise determination of the calcium interaction with calcium sensitive casein species can be seen after the addition of low amounts of calcium, whereas the reduction of the cations occurs after a certain amount of calcium is exceeded.
Table 2.
Mean values of phosphate and citrate concentration of skim milk between 6–20 °C at different levels of calcium addition a.
3.6. Influence of Calcium Concentration on the Serum Casein Concentration with pH Adjustment
To assess whether there was an effect of the pH on the serum casein concertation at lower temperatures as a result of a calcium enrichment, the pH was adjusted to 6.8 and 7.3 after the addition of 0.25, 0.50, and 5.0 mM of calcium. The serum casein concentration is shown in Figure 9 as a function of the added calcium concentration without as well as with a pH adjustment to 6.8 and 7.3, independently of the temperature. It can be seen that independently of the pH the casein concentration decreases in the serum phase after the addition of up to 0.50 mM calcium. Therefore, regardless of whether a pH adjustment after calcium addition was performed, the serum casein concentration was reduced with increasing calcium concentration. Concluding, the pH reduction following the addition of calcium has no significant effect on the total serum casein concentration (p > 0.05). This observation is in accordance with the data shown by Philippe et al. [30]. The authors showed that the re-adjustment of the pH to 6.75 after the addition of 0–13.5 mM calcium did not affect the protein concentration in the supernatant, but only at room temperature and not for temperatures as low as 6 °C.
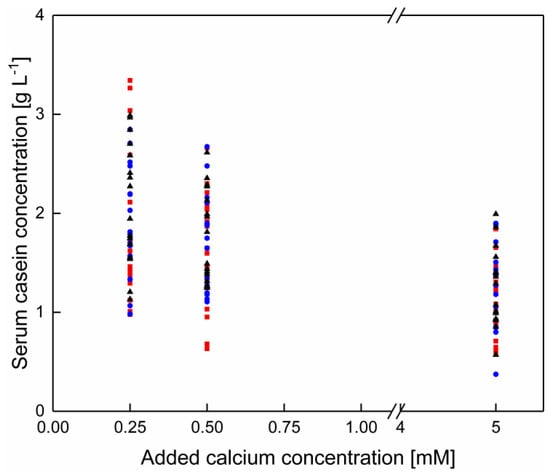
Figure 9.
Total casein concentration in the serum phase of skim milk at 6–20 °C after the addition of 0–5.0 mM without pH adjustment (■) and with pH adjustment to pH 6.8 (●) and 7.3 (▲) after calcium addition (n = 2). Data points are individual experiments. No significant difference of the serum casein concentration after calcium addition as a function of the pH adjustment (p > 0.05).
Nevertheless, the formation or dissolution of different ion complexes depends on the amount of calcium addition and on the pH adjustment [32]. Therefore, after the addition of calcium and adjustment of the pH, only the concentration of hydrogen ions and thus, the electrostatic repulsion is similar in the serum phase. However, the composition of the ion complexes and their accessibility by the caseins is likely to be different depending on the mode of adjustment, i.e., the composition of the added ions and their interaction with the native milieu.
In contrast to the total serum casein, the αS2-casein concentration is affected by the pH adjustment after the addition of calcium. An increasing concentration can be observed, when the pH is adjusted after an addition of 0.50 or 5.00 mM calcium to 6.8 or 7.3, independently of the temperature (Table 3). This effect occurs even though no significant effect of the pH was noticeable when it was adjusted without a calcium addition (p > 0.05). Furthermore, in Section 3.4 a reduction of the αS2 serum casein concentration was shown with an enhanced calcium concentration of 0.50 and 5.00 mM calcium. Therefore, the increased ionic strength in combination with an increased pH reduces the electrostatic repulsion of the αS2-casein increasing the amount in the soluble fraction. Regarding αS1-, β-, and κ-casein no significant effect of a pH adjustment after calcium addition could be observed (data not shown) (p > 0.05). Therefore, for those species, the change in pH resulting from the calcium enrichment does not influence the concentration in the serum phase.
Table 3.
Mean αS2-casein concentration in the serum phase of skim milk between 6–20 °C after addition of 0.5 mM and 5 mM calcium without and with pH adjustment to 6.8 and 7.3, respectively. a.
3.7. Comparison of the Serum Casein Concentration after Ultracentrifugal Separation with the Concentration in Microfiltration Permeate
As shown by Schiffer et al. [17] the casein permeation can be reduced in MF permeate by the addition of 5 mM calcium to skim milk at 10 and 14 °C. However, after the addition of 5 mM calcium also a decrease in the whey protein permeation occurred. To determine whether the reduced casein permeation was following a decreasing serum casein concentration prior to the filtration or an alteration of the deposit layer during the MF, which also decreased the whey protein permeation, the results were compared with the ones in this study.
It can be seen in Table 4 that the serum casein concentration in MF permeate is significantly lower compared to the concentration in the ultracentrifugal supernatant (p < 0.05). Therefore, the deposited layer in the microfiltration experiment leads to a high casein retention, with and without addition of calcium. However, for both sets of experiments, a decreased serum casein concentration can be determined after the addition of 5 mM calcium. A comparison of the casein concentration in the MF permeate with the serum casein concentration in the supernatant after ultracentrifugation, enables the determination of the retention of soluble casein by the deposited layer of retained casein micelles during microfiltration. Thus, it can be determined if an alteration of the deposit layer leads to the reduced serum casein permeation (Table 4).
Table 4.
Comparison of serum casein and whey protein concentration in microfiltration (MF) permeate as shown by Schiffer et al. [17] with serum casein concentration in ultracentrifugal supernatant at 10 and 14 °C without and with 5 mM added calcium.
At native conditions without calcium addition, a casein permeation relative to the milk serum of 27% at 10 °C and 29% at 14 °C, respectively, was observed. After the addition of 5 mM calcium the permeation of serum casein was decreased to 24% at 10 and 25% at 14 °C, respectively. Therefore, the predominant factor on the reduced casein permeation during microfiltration with an enhanced calcium concentration was the reduced serum casein concentration. An alteration of the deposit layer has only a minor effect on the reduced casein permeation, since the main effect of calcium addition in this regard already occurs in the serum prior to microfiltration by shifting the casein equilibrium towards the casein micelles. However, even though the casein permeation is reduced due to a binding of soluble caseins prior to the filtration process, the whey protein permeation is distinctly affected as a result of the changes in the deposit layer resulting from the calcium addition.
These results mean that an optimization of the microfiltration process would be possible by an addition of calcium, provided that the unintended effect on a tighter structure of the deposit casein micelle layer and its retention capacity for whey proteins would be minimized. For instance, a minimal deposit formation would be achieved if the length dependence of deposit formation would be avoided [33], e.g., by applying the so-called UTP-concept (uniform transmembrane pressure) or gradient membranes [12,34].
4. Conclusions
The concentration and composition of caseins in milk serum varied as a function of the temperature between 6–20 °C. It was shown that a considerable improvement of the fractionation of caseins and whey proteins by microfiltration process modifications with regard to the temperature, pH, and/or ion addition can be achieved.
A calcium addition to skim milk prior to microfiltration can decrease the total serum casein concentration. Thus, an increased β-casein content in the milk serum at lower temperature can be prevented. A reduction of the temperature as low as 6 °C can be considered for the MF of skim milk after the addition of 5.00 mM calcium without increasing the casein concentration in the serum phase compared to 20 °C. However, this level of calcium addition would also tighten the deposited casein micelle layer structure and affect the desired high permeation of whey proteins into the MF permeate.
Furthermore, the addition of calcium chloride to decrease the total serum casein concentration affects all casein species at different extents, changing the composition of the casein equilibrium in the aqueous phase. Thus, even though the total serum casein concentration in skim milk at high temperatures without calcium enrichment, is similar to the one at low temperatures with calcium enrichment, the composition is different. Therefore, the composition of the casein fraction reducing the purity of the whey protein fraction can be controlled by the addition of calcium. A more effective deposit layer control as in conventional crossflow filtration would, however, be a condition if the application of higher levels of calcium addition would be considered.
Author Contributions
Conceptualization, S.S. and U.K.; methodology, S.S., T.K., and E.S.; software, S.S.; validation, S.S., E.S., and T.K.; investigation, S.S., E.S., and T.K.; resources, U.K.; data curation, S.S.; writing—original draft preparation, S.S.; writing—review and editing, S.S. and U.K.; visualization, S.S. and E.S.; supervision, U.K.; project administration, S.S.; funding acquisition, U.K. All authors have read and agreed to the published version of the manuscript.
Funding
This project was supported by the FEI via the AiF (AiF 19254 N) within the program for promoting the Industrial Collective Research (IGF) of the German Ministry of Economic Affairs and Energy (BMWi), based on a resolution of the German Parliament. This work was supported by the German Research Foundation (DFG) and the Technical University of Munich (TUM) in the framework of the Open Access Publishing Program.
Acknowledgments
We gratefully thank Heidi Wohlschläger and Claudia Hengst for their assistance in the RP-HPLC analysis as well as Mohammad Rahanur Alam and Marion Keter for their contribution to the experimental work.
Conflicts of Interest
The authors declare no conflict of interest. The funders had no role in the design of the study; in the collection, analyses, or interpretation of data; in the writing of the manuscript, or in the decision to publish the results.
Appendix A

Figure A1.
Centrifugation time as a function of the temperature.

Figure A2.
Chromatogram of the protein composition in skim milk (red line) as well as in the serum phase after ultracentrifugation (blue line).
Table A1.
pH of skim milk as a function of the temperature between 6–20 °C.
Table A1.
pH of skim milk as a function of the temperature between 6–20 °C.
| 6 °C | 8 °C | 10 °C | 12 °C | 14 °C | 16 °C | 18 °C | 20 °C | |
|---|---|---|---|---|---|---|---|---|
| pH [-] | 6.78 | 6.77 | 6.77 | 6.75 | 6.75 | 6.75 | 6.73 | 6.72 |
Table A2.
Mean value of the anion concentration in the serum phase of skim milk between 6–20 °C.
Table A2.
Mean value of the anion concentration in the serum phase of skim milk between 6–20 °C.
| Citrate [mg L−1] | Phosphate [mg L−1] | Chloride [mg L−1] |
|---|---|---|
| 1557 ± 81 | 1030 ± 39 | 838 ± 37 |
Table A3.
Mean value of the cation concentration in the serum phase of skim milk between 6–20 °C.
Table A3.
Mean value of the cation concentration in the serum phase of skim milk between 6–20 °C.
| Potassium [mg L−1] | Sodium [mg L−1] | Calcium [mg L−1] | Magnesium [mg L−1] |
|---|---|---|---|
| 1562 ± 70 | 391 ± 15 | 320 ± 31 | 79 ± 7 |

Figure A3.
Total serum casein concentration at 6–20 °C as a function of the pH (6.3–7.3).

Figure A4.
Total serum casein concentration at 6–20 °C as a function of added calcium (0–7.5 mM).
References
- Broyard, C.; Gaucheron, F. Modifications of structures and functions of caseins: A scientific and technological challenge. Dairy Sci. Technol. 2015, 95, 831–862. [Google Scholar] [CrossRef]
- Holt, C. Structure and Stability of Bovine Casein Micelles. In Advances in Protein Chemistry; Elsevier: Amsterdam, The Netherlands, 1992; Volume 43, pp. 63–151. ISBN 9780120342433. [Google Scholar]
- De Kruif, C.G.; Huppertz, T.; Urban, V.S.; Petukhov, A.V. Casein micelles and their internal structure. Adv. Colloid Interface Sci. 2012, 171–172, 36–52. [Google Scholar] [CrossRef]
- Dickinson, E.; Hunt, J.A.; Horne, D.S. Calcium induced flocculation of emulsions containing adsorbed β-casein or phosvitin. Food Hydrocoll. 1992, 6, 359–370. [Google Scholar] [CrossRef]
- Mizuno, R.; Lucey, J.A. Effects of Emulsifying Salts on the Turbidity and Calcium-Phosphate–Protein Interactions in Casein Micelles. J. Dairy Sci. 2005, 88, 3070–3078. [Google Scholar] [CrossRef]
- Davies, D.T.; Law, A.J.R. Variation in the protein composition of bovine casein micelles and serum casein in relation to micellar size and milk temperature. J. Dairy Res. 1983, 50, 67–75. [Google Scholar] [CrossRef]
- O’Connell, J.E.; Grinberg, V.Y.; de Kruif, C.G. Association behavior of β-casein. J. Colloid Interface Sci. 2003, 258, 33–39. [Google Scholar] [CrossRef]
- Ono, T.; Murayama, T.; Kaketa, S.; Odagiri, S. Changes in the Protein Composition and Size Distribution of Bovine Casein Micelles Induced by Cooling. Agric. Biol. Chem. 1990, 54, 1385–1392. [Google Scholar]
- Schiffer, S.; Matyssek, A.; Hartinger, M.; Bolduan, P.; Mund, P.; Kulozik, U. Effects of selective layer properties of ceramic multi-channel microfiltration membranes on the milk protein fractionation. Sep. Purif. Technol. 2020, 259, 118050. [Google Scholar] [CrossRef]
- France, T.C.; Kelly, A.L.; Crowley, S.V.; O’Mahony, J.A. The effects of temperature and transmembrane pressure on protein, calcium and plasmin partitioning during microfiltration of skim milk. Int. Dairy J. 2021, 114, 104930. [Google Scholar] [CrossRef]
- Zulewska, J.; Barbano, D.M. The effect of linear velocity and flux on performance of ceramic graded permeability membranes when processing skim milk at 50 °C. J. Dairy Sci. 2014, 97, 2619–2632. [Google Scholar] [CrossRef]
- Zulewska, J.; Newbold, M.; Barbano, D.M. Efficiency of serum protein removal from skim milk with ceramic and polymeric membranes at 50 °C. J. Dairy Sci. 2009, 92, 1361–1377. [Google Scholar] [CrossRef] [PubMed]
- Schäfer, J.; Schubert, T.; Atamer, Z. Pilot-scale β-casein depletion from micellar casein via cold microfiltration in the diafiltration mode. Int. Dairy J. 2019, 97, 222–229. [Google Scholar] [CrossRef]
- Koutina, G.; Knudsen, J.C.; Andersen, U.; Skibsted, L.H. Temperature effect on calcium and phosphorus equilibria in relation to gel formation during acidification of skim milk. Int. Dairy J. 2014, 36, 65–73. [Google Scholar] [CrossRef]
- Chaplin, L.G.; Lyster, R.L.J. Effect of temperature on the pH of skim milk. J. Dairy Res. 1988, 55, 277–280. [Google Scholar] [CrossRef]
- Post, A.E.; Arnold, B.; Weiss, J.; Hinrichs, J. Effect of temperature and pH on the solubility of caseins: Environmental influences on the dissociation of α(S)- and β-casein. J. Dairy Sci. 2012, 95, 1603–1616. [Google Scholar] [CrossRef] [PubMed]
- Schiffer, S.; Vannieuwenhuyse, L.; Susianto, C.; Hartinger, M.; Kulozik, U. Influence of pH and calcium concentration on milk protein fractionation by 0.1 µm microfiltration at low temperatures. Int. Dairy J. 2021, 118, 105048. [Google Scholar] [CrossRef]
- Udabage, P.; McKinnon, I.R.; Augustin, M.A. Mineral and casein equilibria in milk: Effects of added salts and calcium-chelating agents. J. Dairy Res. 2000, 67, 361–370. [Google Scholar] [CrossRef]
- Deeth, H.C.; Lewis, M.J. Practical consequences of calcium addition to and removal from milk and milk products. Int. J. Dairy Technol. 2015, 68, 1–10. [Google Scholar] [CrossRef]
- Liu, D.Z.; Weeks, M.G.; Dunstan, D.E.; Martin, G.J.O. Temperature-dependent dynamics of bovine casein micelles in the range 10-40 °C. Food Chem. 2013, 141, 4081–4086. [Google Scholar] [CrossRef]
- Dumpler, J.; Wohlschläger, H.; Kulozik, U. Dissociation and coagulation of caseins and whey proteins in concentrated skim milk heated by direct steam injection. Dairy Sci. Technol. 2017, 96, 807–826. [Google Scholar] [CrossRef]
- Sedmerová, V.; Heleslcová, H.; Podrazký, V. On the composition of casein micelles isolated under different conditions of ultracentrifugation. Nahrung 1974, 18, 363–369. [Google Scholar] [CrossRef]
- Dumpler, J.; Kieferle, I.; Wohlschläger, H.; Kulozik, U. Milk ultrafiltrate analysis by ion chromatography and calcium activity for SMUF preparation for different scientific purposes and prediction of its supersaturation. Int. Dairy J. 2017, 68, 60–69. [Google Scholar] [CrossRef]
- Holt, C.; Davies, D.T.; Law, A.J.R. Effects of colloidal calcium phosphate content and free calcium ion concentration in the milk serum on the dissociation of bovine casein micelles. J. Dairy Res. 1986, 53, 557–572. [Google Scholar] [CrossRef]
- Farrell, H.M.; Jimenez-Flores, R.; Bleck, G.T.; Brown, E.M.; Butler, J.E.; Creamer, L.K.; Hicks, C.L.; Hollar, C.M.; Ng-Kwai-Hang, K.F.; Swaisgood, H.E. Nomenclature of the Proteins of Cows’ Milk—Sixth Revision. J. Dairy Sci. 2004, 87, 1641–1674. [Google Scholar] [CrossRef]
- Swaisgood, H.E. Chemistry of the Caseins. In Advanced Dairy Chemistry—1 Proteins; Fox, P.F., McSweeney, P.L.H., Eds.; Springer US: Boston, MA, USA, 2003; pp. 139–201. ISBN 978-0-306-47271-8. [Google Scholar]
- Law, A.J.R.; Leaver, J. Effects of Acidification and Storage of Milk on Dissociation of Bovine Casein Micelles. J. Agric. Food Chem. 1998, 46, 5008–5016. [Google Scholar] [CrossRef]
- Gaucheron, F. The minerals of milk. Reprod. Nutr. Dev. 2005, 45, 473–483. [Google Scholar] [CrossRef] [PubMed]
- Horne, D.S. Casein Interactions: Casting Light on the Black Boxes, the Structure in Dairy Products. Int. Dairy J. 1998, 8, 171–177. [Google Scholar] [CrossRef]
- Philippe, M.; Gaucheron, F.; Le Graët, Y.; Michel, F.; Garem, A. Physicochemical characterization of calcium-supplemented skim milk. Lait 2003, 83, 45–59. [Google Scholar] [CrossRef]
- Philippe, M.; Le Graët, Y.; Gaucheron, F. The effects of different cations on the physicochemical characteristics of casein micelles. Food Chem. 2005, 90, 673–683. [Google Scholar] [CrossRef]
- Gaucheron, F. Milk Salts|Distribution and Analysis. In Encyclopedia of Dairy Sciences; Elsevier: Amsterdam, The Netherlands, 2011; pp. 908–916. ISBN 9780123744074. [Google Scholar]
- Hartinger, M.; Schiffer, S.; Heidebrecht, H.-J.; Dumpler, J.; Kulozik, U. Investigation on the spatial filtration performance in spiral-wound membranes–Influence and length-dependent adjustment of the transmembrane pressure. J. Membr. Sci. 2019, 591, 117311. [Google Scholar] [CrossRef]
- Heidebrecht, H.-J.; Toro-Sierra, J.; Kulozik, U. Concentration of Immunoglobulins in Microfiltration Permeates of Skim Milk: Impact of Transmembrane Pressure and Temperature on the IgG Transmission Using Different Ceramic Membrane Types and Pore Sizes. Foods 2018, 7, 101. [Google Scholar] [CrossRef] [PubMed]
Publisher’s Note: MDPI stays neutral with regard to jurisdictional claims in published maps and institutional affiliations. |
© 2021 by the authors. Licensee MDPI, Basel, Switzerland. This article is an open access article distributed under the terms and conditions of the Creative Commons Attribution (CC BY) license (https://creativecommons.org/licenses/by/4.0/).