
Modelling the Extraction of Pectin towards the Valorisation of Watermelon Rind Waste

 ,
,  ,
,  ,
,  and
and
Abstract
1. Introduction
2. Materials and Methods
2.1. Sample Preparation
2.2. Proximate Analysis
2.3. Experimental Design
2.4. Pectin Extraction
2.5. Determination of Pectin Composition with Titrimetric Methods
2.6. Monosaccharide Composition
2.7. Fourier Transform Infrared (FTIR)
2.8. High-Performance Size Exclusion Chromatography (HPSEC)
3. Results and Discussion
3.1. Proximate Analysis
3.2. Model Design and Statistical Analysis
3.3. Effect of Extraction Parameters on WRP Composition and Its Structural Features
3.3.1. Yield
3.3.2. Pectin Esterification
3.4. Constituent Sugar Composition
3.4.1. Galacturonic Acid and Homogalacturonan Contribution
3.4.2. Rhamnogalacturonan Content
3.4.3. Arabinogalactan, Galactan and Arabinan Content
3.4.4. Other Pectin Components
3.5. Fourier Transform Infrared (FTIR)
3.6. Molar Mass Distribution
3.7. Optimization and Validation
4. Conclusions
Supplementary Materials
Author Contributions
Funding
Institutional Review Board Statement
Informed Consent Statement
Data Availability Statement
Conflicts of Interest
References
- FAO. The State of Food Security and Nutrition in the World; Food and Agriculture Organization of the United Nations: Rome, Italy, 2019. [Google Scholar]
- FAOSTAT CROPS. Available online: http://www.fao.org/faostat/en/#data/QC/visualize (accessed on 23 May 2019).
- Hartati, I.; Subekti, E. Microwave assisted extraction of watermelon rind pectin. Int. J. Chem. Tech. Res. 2015, 8, 163–170. [Google Scholar]
- Dranca, F.; Oroian, M. Extraction, purification and characterization of pectin from alternative sources with potential technological applications. Food Res. Int. 2018, 113, 327–350. [Google Scholar] [CrossRef]
- Gómez, B.; Gullón, B.; Remoroza, C.; Schols, H.A.; Parajó, J.C.; Alonso, J.L. Purification, characterization, and prebiotic properties of pectic oligosaccharides from orange peel wastes. J. Agric. Food Chem. 2014, 62, 9769–9782. [Google Scholar] [CrossRef]
- Wai, W.W.; Alkarkhi, A.F.M.; Easa, A.M. Optimization of pectin extraction from durian rind (durio zibethinus) using response surface methodology. J. Food Sci. 2009, 74. [Google Scholar] [CrossRef]
- Schols, H.A.; Visser, R.G.F.; Voragen, A.G.J. Pectins and Pectinases; Schols, H.A., Visser, R.G.F., Voragen, A.G.J., Eds.; Wageningen Academic Publishers: Wageningen, The Netherlands, 2009; ISBN 978-90-8686-108-8. [Google Scholar]
- Wusigale; Liang, L.; Luo, Y. Casein and pectin: Structures, interactions, and applications. Trends Food Sci. Technol. 2020, 97, 391–403. [Google Scholar] [CrossRef]
- Müller-Maatsch, J.; Bencivenni, M.; Caligiani, A.; Tedeschi, T.; Bruggeman, G.; Bosch, M.; Petrusan, J.; Van Droogenbroeck, B.; Elst, K.; Sforza, S. Pectin content and composition from different food waste streams. Food Chem. 2016, 201, 37–45. [Google Scholar] [CrossRef]
- Methacanon, P.; Krongsin, J.; Gamonpilas, C. Pomelo (Citrus maxima) pectin: Effects of extraction parameters and its properties. Food Hydrocoll. 2014, 35, 383–391. [Google Scholar] [CrossRef]
- Ngouémazong, D.E.; Kabuye, G.; Fraeye, I.; Cardinaels, R.; Van Loey, A.; Moldenaers, P.; Hendrickx, M. Effect of debranching on the rheological properties of Ca2+-pectin gels. Food Hydrocoll. 2012, 26, 44–53. [Google Scholar] [CrossRef]
- Yapo, B.M. Rhamnogalacturonan-I: A structurally puzzling and functionally versatile polysaccharide from plant cell walls and mucilages. Polym. Rev. 2011, 51, 391–413. [Google Scholar] [CrossRef]
- Pasandide, B.; Khodaiyan, F.; Mousavi, Z.E.; Hosseini, S.S. Optimization of aqueous pectin extraction from Citrus medica peel. Carbohydr. Polym. 2017, 178, 27–33. [Google Scholar] [CrossRef]
- Houben, K.; Jolie, R.P.; Fraeye, I.; Van Loey, A.M.; Hendrickx, M.E. Comparative study of the cell wall composition of broccoli, carrot, and tomato: Structural characterization of the extractable pectins and hemicelluloses. Carbohydr. Res. 2011, 346, 1105–1111. [Google Scholar] [CrossRef] [PubMed]
- Rasheed, A.M. Effect of different acids, heating time and particle size on pectin extraction from watermelon rinds. J. Kerbala Univ. 2008, 6, 234–243. [Google Scholar]
- Lee, K.Y.; Choo, W.S. Extraction optimization and physicochemical properties of pectin from watermelon (Citrullus lanatus) Rind: Comparison of hydrochloric and citric acid extraction. J. Nutraceuticals Food Sci. 2020, 5, 1. [Google Scholar] [CrossRef]
- Prakash Maran, J.; Sivakumar, V.; Thirugnanasambandham, K.; Sridhar, R. Microwave assisted extraction of pectin from waste Citrullus lanatus fruit rinds. Carbohydr. Polym. 2014, 101, 786–791. [Google Scholar] [CrossRef]
- Petkowicz, C.L.O.; Vriesmann, L.C.; Williams, P.A. Pectins from food waste: Extraction, characterization and properties of watermelon rind pectin. Food Hydrocoll. 2017, 65, 57–67. [Google Scholar] [CrossRef]
- AOAC. Official Methods of Analysis, 16th ed.; AOAC International: Rockville, MD, USA, 1996. [Google Scholar]
- Fujihara, S.; Kasuga, A.; Aoyagi, Y. Nitrogen-to-protein conversion factors for common vegetables in Japan. J. Food Sci. 2001, 66, 412–415. [Google Scholar] [CrossRef]
- Somashekar, D.; Venkateshwaran, G.; Srividya, C.; Krishnanand; Sambaiah, K.; Lokesh, B.R. Efficacy of extraction methods for lipid and fatty acid composition from fungal cultures. World J. Microbiol. Biotechnol. 2001, 17, 317–320. [Google Scholar] [CrossRef]
- Marić, M.; Grassino, A.N.; Zhu, Z.; Barba, F.J.; Brnčić, M.; Rimac Brnčić, S. An overview of the traditional and innovative approaches for pectin extraction from plant food wastes and by-products: Ultrasound-, microwaves-, and enzyme-assisted extraction. Trends Food Sci. Technol. 2018, 76, 28–37. [Google Scholar] [CrossRef]
- Grassino, A.N.; Brnčić, M.; Vikić-Topić, D.; Roca, S.; Dent, M.; Brnčić, S.R. Ultrasound assisted extraction and characterization of pectin from tomato waste. Food Chem. 2016, 198, 93–100. [Google Scholar] [CrossRef]
- Martínez-Abad, A.; Giummarella, N.; Lawoko, M.; Vilaplana, F. Differences in extractability under subcritical water reveal interconnected hemicellulose and lignin recalcitrance in birch hardwoods. Green Chem. 2018, 20, 2534–2546. [Google Scholar] [CrossRef]
- Gómez-Mascaraque, L.; Martínez-Sanz, M.; Hogan, S.A.; López-Rubio, A.; Brodkorb, A. Nano- and microstructural evolution of alginate beads in simulated gastrointestinal fluids. Impact of M/G ratio, molecular weight and pH. Carbohydr. Polym. 2019, 223. [Google Scholar] [CrossRef]
- Muñoz-Almagro, N.; Rico-Rodriguez, F.; Villamiel, M.; Montilla, A. Pectin characterisation using size exclusion chromatography: A comparison of ELS and RI detection. Food Chem. 2018, 252, 271–276. [Google Scholar] [CrossRef]
- Sanwiriya, P.; Suleiman, N. The Effects of Drying Method and Temperature on the Nutritional Quality of Watermelon Rinds. Int. Food Res. J. 2019, 26, 953–958. [Google Scholar]
- Al-Sayed, H.M.A.; Ahmed, A.R. Utilization of watermelon rinds and sharlyn melon peels as a natural source of dietary fiber and antioxidants in cake. Ann. Agric. Sci. 2013, 58, 83–95. [Google Scholar] [CrossRef]
- Campbell, M. Extraction of Pectin from Watermelon Rind; Oklahoma State University: Stillwater, OK, USA, 2006. [Google Scholar]
- Levigne, S.; Ralet, M.C.; Thibault, J.F. Characterisation of pectins extracted from fresh sugar beet under different conditions using an experimental design. Carbohydr. Polym. 2002, 49, 145–153. [Google Scholar] [CrossRef]
- Grassino, A.N.; Halambek, J.; Djaković, S.; Rimac Brnčić, S.; Dent, M.; Grabarić, Z. Utilization of tomato peel waste from canning factory as a potential source for pectin production and application as tin corrosion inhibitor. Food Hydrocoll. 2016, 52, 265–274. [Google Scholar] [CrossRef]
- Mikshina, P.V.; Makshakova, O.N.; Petrova, A.A.; Gaifullina, I.Z.; Idiyatullin, B.Z.; Gorshkova, T.A.; Zuev, Y.F. Gelation of rhamnogalacturonan I is based on galactan side chain interaction and does not involve chemical modifications. Carbohydr. Polym. 2017, 171, 143–151. [Google Scholar] [CrossRef]
- Pasandide, B.; Khodaiyan, F.; Mousavi, Z.; Hosseini, S.S. Pectin extraction from citron peel: Optimization by Box–Behnken response surface design. Food Sci. Biotechnol. 2018, 27, 997–1005. [Google Scholar] [CrossRef] [PubMed]
- Korish, M. Potential utilization of Citrullus lanatus var. Colocynthoides waste as a novel source of pectin. J. Food Sci. Technol. 2015, 52, 2401–2407. [Google Scholar] [CrossRef] [PubMed]
- Rodsamran, P.; Sothornvit, R. Microwave heating extraction of pectin from lime peel: Characterization and properties compared with the conventional heating method. Food Chem. 2019, 278, 364–372. [Google Scholar] [CrossRef]
- Khamsucharit, P.; Laohaphatanalert, K.; Gavinlertvatana, P.; Sriroth, K.; Sangseethong, K. Characterization of pectin extracted from banana peels of different varieties. Food Sci. Biotechnol. 2018, 27, 623–629. [Google Scholar] [CrossRef]
- Mao, G.; Wu, D.; Wei, C.; Tao, W.; Ye, X.; Linhardt, R.J.; Orfila, C.; Chen, S. Reconsidering conventional and innovative methods for pectin extraction from fruit and vegetable waste: Targeting rhamnogalacturonan I. Trends Food Sci. Technol. 2019, 94, 65–78. [Google Scholar] [CrossRef]
- Lefsih, K.; Giacomazza, D.; Dahmoune, F.; Mangione, M.R.; Bulone, D.; San Biagio, P.L.; Passantino, R.; Costa, M.A.; Guarrasi, V.; Madani, K. Pectin from Opuntia ficus indica: Optimization of microwave-assisted extraction and preliminary characterization. Food Chem. 2017, 221, 91–99. [Google Scholar] [CrossRef] [PubMed]
- Jafari, F.; Khodaiyan, F.; Kiani, H.; Hosseini, S.S. Pectin from carrot pomace: Optimization of extraction and physicochemical properties. Carbohydr. Polym. 2017, 157, 1315–1322. [Google Scholar] [CrossRef]
- Moorthy, I.G.; Maran, J.P.; Surya, S.M.; Naganyashree, S.; Shivamathi, C.S. Response surface optimization of ultrasound assisted extraction of pectin from pomegranate peel. Int. J. Biol. Macromol. 2015, 72, 1323–1328. [Google Scholar] [CrossRef]
- Denman, L.J.; Morris, G.A. An experimental design approach to the chemical characterisation of pectin polysaccharides extracted from Cucumis melo Inodorus. Carbohydr. Polym. 2015, 117, 364–369. [Google Scholar] [CrossRef]
- Kumar, A.; Chauhan, G.S. Extraction and characterization of pectin from apple pomace and its evaluation as lipase (steapsin) inhibitor. Carbohydr. Polym. 2010, 82, 454–459. [Google Scholar] [CrossRef]
- Ognyanov, M.; Georgiev, Y.; Petkova, N.; Ivanov, I.; Vasileva, I.; Kratchanova, M. Isolation and characterization of pectic polysaccharide fraction from in vitro suspension culture of Fumaria officinalis L. Int. J. Polym. Sci. 2018, 2018, 1–13. [Google Scholar] [CrossRef]
- Ismail, N.S.M.; Ramli, N.; Hani, N.M.; Meon, Z. Extraction and characterization of pectin from dragon fruit (Hylocereus polyrhizus) using various extraction conditions. Sains Malays. 2012, 41, 41–45. [Google Scholar]
- Ngouémazong, D.E.; Tengweh, F.F.; Fraeye, I.; Duvetter, T.; Cardinaels, R.; Van Loey, A.; Moldenaers, P.; Hendrickx, M. Effect of de-methylesterification on network development and nature of Ca2+-pectin gels: Towards understanding structure-function relations of pectin. Food Hydrocoll. 2012, 26, 89–98. [Google Scholar] [CrossRef]
- Babbar, N.; Dejonghe, W.; Gatti, M.; Sforza, S.; Elst, K. Pectic oligosaccharides from agricultural by-products: Production, characterization and health benefits. Crit. Rev. Biotechnol. 2016, 36, 594–606. [Google Scholar] [CrossRef]
- Kyomugasho, C.; Christiaens, S.; Shpigelman, A.; Van Loey, A.M.; Hendrickx, M.E. FT-IR spectroscopy, a reliable method for routine analysis of the degree of methylesterification of pectin in different fruit- and vegetable-based matrices. Food Chem. 2015, 176, 82–90. [Google Scholar] [CrossRef]
- Koh, J.; Xu, Z.; Wicker, L. Blueberry pectin extraction methods influence physico-chemical properties. J. Food Sci. 2018, 83, 2954–2962. [Google Scholar] [CrossRef] [PubMed]
- Chen, H.; Qiu, S.; Gan, J.; Liu, Y.; Zhu, Q.; Yin, L. New insights into the functionality of protein to the emulsifying properties of sugar beet pectin. Food Hydrocoll. 2016, 57, 262–270. [Google Scholar] [CrossRef]
- Karnik, D.; Jung, J.; Hawking, S.; Wicker, L. Sugar beet pectin fractionated using isopropanol differs in galacturonic acid, protein, ferulic acid and surface hydrophobicity. Food Hydrocoll. 2016, 60, 179–185. [Google Scholar] [CrossRef]
- Funami, T.; Zhang, G.; Hiroe, M.; Noda, S.; Nakauma, M.; Asai, I.; Cowman, M.K.; Al-Assaf, S.; Phillips, G.O. Effects of the proteinaceous moiety on the emulsifying properties of sugar beet pectin. Food Hydrocoll. 2007, 21, 1319–1329. [Google Scholar] [CrossRef]
- Kacuráková, M.; Capek, P.; Sasinková, V.; Wellner, N.; Ebringerová, A. FT-IR study of plant cell wall model compounds: Pectic polysaccharides and hemicelluloses. Carbohydr. Polym. 2000, 43, 195–203. [Google Scholar] [CrossRef]
- Koubala, B.B.; Christiaens, S.; Kansci, G.; Van Loey, A.M.; Hendrickx, M.E. Isolation and structural characterisation of papaya peel pectin. Food Res. Int. 2014, 55, 215–221. [Google Scholar] [CrossRef]
 ) and harsh (
 ) conditions in comparison with commercial apple pectin (AP) and citrus pectin (CP).
) and harsh () conditions in comparison with commercial apple pectin (AP) and citrus pectin (CP).
) conditions in comparison with commercial apple pectin (AP) and citrus pectin (CP).
) and harsh () conditions in comparison with commercial apple pectin (AP) and citrus pectin (CP). ), 3 (
 ), 11 (
 ), 1 (
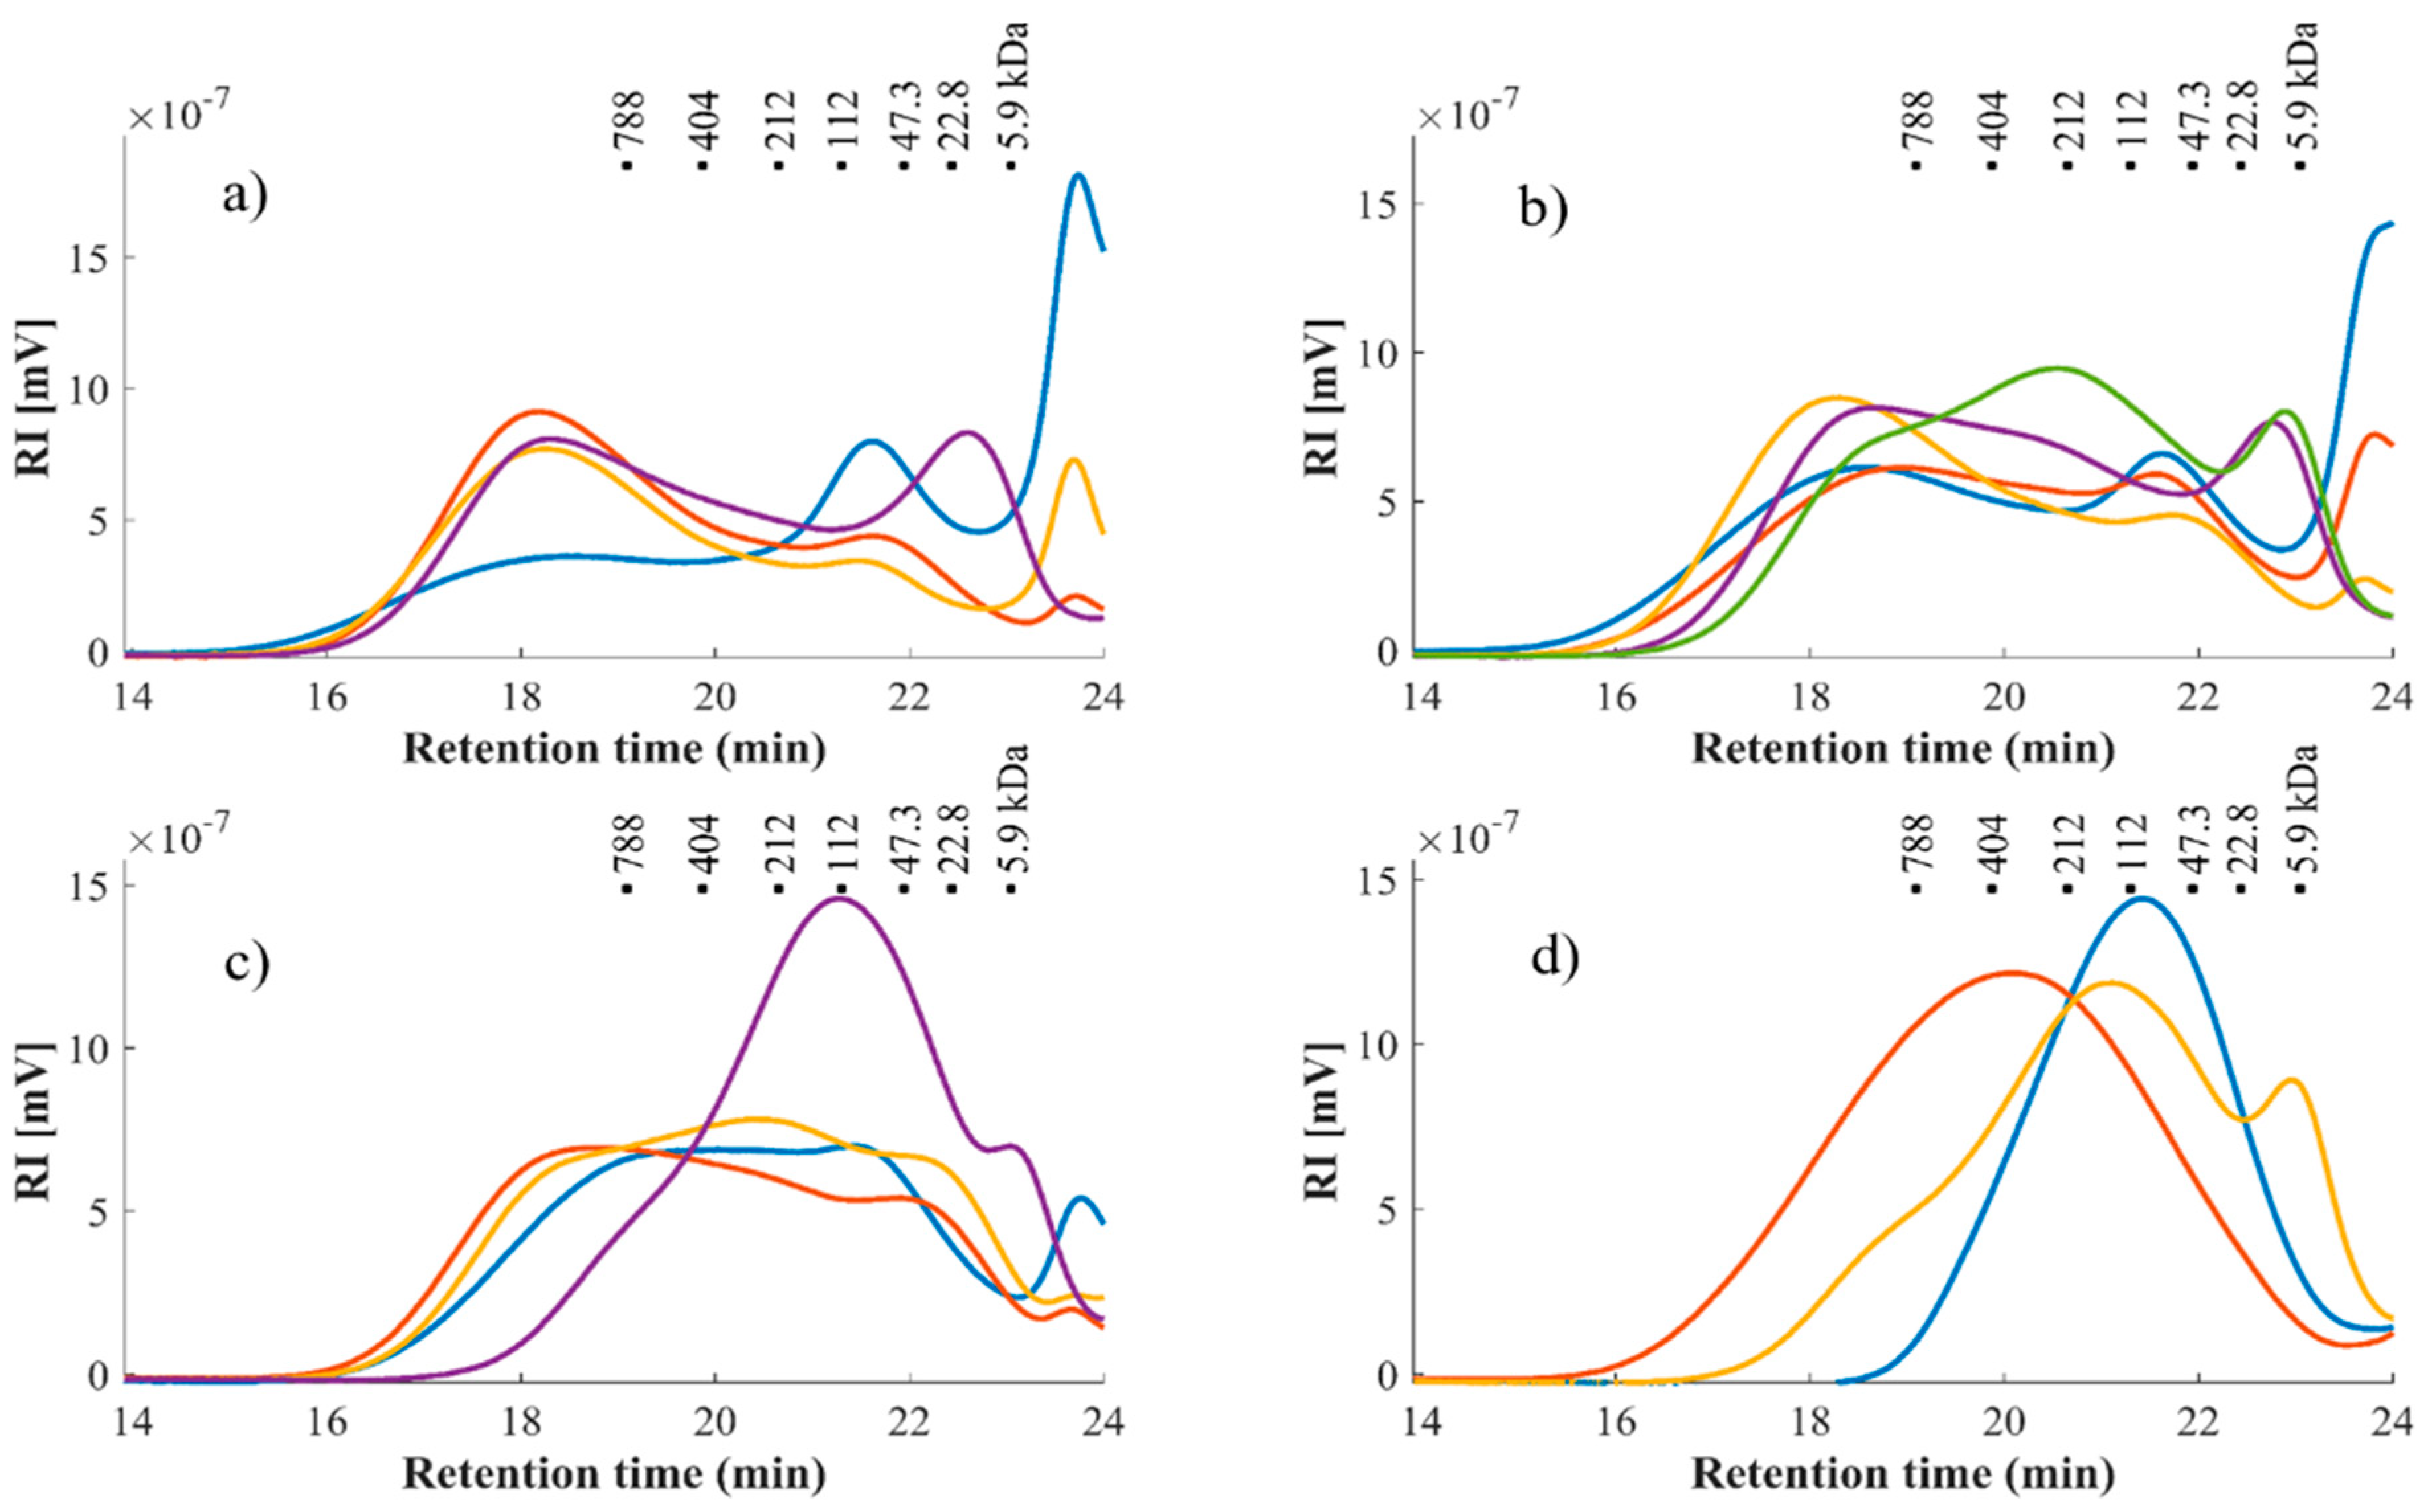
 ). (b) 82.5 °C treatment runs: 4 (), 12 (), 13 (), 7 (), 10(
 ). (c) 95 °C treatment runs: 8 (), 2(), 9 (), 5 (). (d) citrus pectin (), apple pectin () and optimum point condition pectin (). For interpretation of the numbers listed, please refer to the Table 1. The black squares correspond to pullulan standards with matching molar mass (MM).
), 3 (), 11 (), 1 (). (b) 82.5 °C treatment runs: 4 (), 12 (), 13 (), 7 (), 10(). (c) 95 °C treatment runs: 8 (), 2(), 9 (), 5 (). (d) citrus pectin (), apple pectin () and optimum point condition pectin (). For interpretation of the numbers listed, please refer to the Table 1. The black squares correspond to pullulan standards with matching molar mass (MM).
). (c) 95 °C treatment runs: 8 (), 2(), 9 (), 5 (). (d) citrus pectin (), apple pectin () and optimum point condition pectin (). For interpretation of the numbers listed, please refer to the Table 1. The black squares correspond to pullulan standards with matching molar mass (MM).
), 3 (), 11 (), 1 (). (b) 82.5 °C treatment runs: 4 (), 12 (), 13 (), 7 (), 10(). (c) 95 °C treatment runs: 8 (), 2(), 9 (), 5 (). (d) citrus pectin (), apple pectin () and optimum point condition pectin (). For interpretation of the numbers listed, please refer to the Table 1. The black squares correspond to pullulan standards with matching molar mass (MM).

| Independent Variables | Experimental Values | ||||||
|---|---|---|---|---|---|---|---|
| Run | X1 (°C) | X2 (min) | X3 (pH) | Y (%) | DE (%) | AUA (%) | MeO (%) |
| 1 | −1 (70) | 0 (60) | −1 (1) | 6.88 | 65.47 | 59.54 | 6.87 |
| 2 | +1 (95) | −1 (30) | 0 (2) | 10.72 | 75.30 | 56.92 | 7.55 |
| 3 | −1 (70) | +1 (90) | 0 (2) | 7.55 | 76.65 | 55.56 | 7.51 |
| 4 | 0 (82.5) | −1 (30) | +1 (3) | 2.45 | 87.28 | 43.22 | 6.66 |
| 5 | +1 (95) | 0 (60) | −1 (1) | 9.95 | 52.48 | 69.08 | 6.39 |
| 6 | −1 (70) | 0 (60) | +1 (3) | 2.03 | 81.04 | 33.48 | 4.78 |
| 7 | 0 (82.5) | −1 (30) | −1 (1) | 8.50 | 62.97 | 66.96 | 7.43 |
| 8 | +1 (95) | 0 (60) | +1 (3) | 4.44 | 88.25 | 49.70 | 7.73 |
| 9 | +1 (95) | +1 (90) | 0 (2) | 12.19 | 76.08 | 57.29 | 7.68 |
| 10 | 0 (82.5) | +1 (90) | −1 (1) | 10.81 | 58.98 | 66.44 | 6.90 |
| 11 | −1 (70) | −1 (30) | 0 (2) | 6.92 | 76.85 | 53.60 | 7.26 |
| 12 | 0 (82.5) | +1 (90) | +1 (3) | 3.44 | 89.05 | 47.91 | 7.03 |
| 13 | 0 (82.5) | 0 (60) | 0 (2) | 8.61 | 78.52 | 61.32 | 8.48 |
| 14 | 0 (82.5) | 0 (60) | 0 (2) | 8.04 | 80.88 | 63.16 | 9.00 |
| 15 | 0 (82.5) | 0 (60) | 0 (2) | 7.80 | 80.83 | 54.85 | 7.80 |
| OP | 95 | 90 | 1.36 | 13.4 | 61.62 | 66.42 | 6.76 |
| AP | - | - | - | - | 77.18 | 62.17 | 9.00 |
| CP | - | - | - | - | 55.19 | 69.62 | 6.78 |
| Proximate Analysis | Content (Dry Basis wt (%)) a | Monosaccharide Composition (µg/mg Dry Basis) b | |
|---|---|---|---|
| Ash | 2.55 ± 0.17 | GalA | 167.1 ± 7.58 |
| Fats | 1.05 ± 0.15 | Rha | 9.2 ± 0.31 |
| Protein | 17.23 ± 0.11 | Gal | 111 ± 4.39 |
| Carbohydrates | 83.9 ± 3.45 | Ara | 17.1 ± 1.56 |
| of which | Fuc | 11.7 ± 0.29 | |
| Pectin c | 31.61 ± 1.4 | Xyl | 38.8 ± 8.85 |
| Free sugars d | 19.47 ± 0.58 | Man | 9.6 ± 2.19 |
| Cellulose e | 14.28 ± 1.4 | Glu | 354.93 ± 45.4 |
| Others f | 14.21 + 1.12 | Fru | 120.2 ± 4.20 |
| Responses | Main Effects (p ≤ 0.05) | Lack of Fit (p ≥ 0.05) | R2 |
|---|---|---|---|
| 0.18 | 97.91 | ||
| 0.63 | 99.55 | ||
| 0.72 | 90.24 | ||
| 0.54 | 92.62 | ||
| 0.72 | 99.31 | ||
| 0.08 | 94.19 | ||
| 0.31 | 99.60 | ||
| 0.22 | 98.26 | ||
| 0.11 | 95.16 | ||
| - | 65.76 |
| Run | Fucose (µg/mg) | Rha (µg/mg) | Ara (µg/mg) | Gal (µg/mg) | Xyl (µg/mg) | GalA (µg/mg) |
|---|---|---|---|---|---|---|
| 1 | 3.44 ± 0.21 ab | 15.71 ± 0.69 f | 9.09 ± 0.65 g | 248.49 ± 12.46 a | 0 ± 0 i | 357.72 ± 15.00 ef |
| 2 | 3.35 ± 0.32 abc | 17.36 ± 1.77 ef | 22.44 ± 2.38 e | 190.9 ± 20.32 bc | 0.46 ± 0.80 hi | 442.08 ± 51.95 d |
| 3 | 3.30 ± 0.30 abcd | 16.67 ± 1.13 f | 31.49 ± 2.5 d | 162.4 ± 12.14 de | 0.96 ± 0.84 ghi | 339.07 ± 30.11 f |
| 4 | 2.93 ± 0.15 bcde | 7.45 ± 0.83 ij | 47.31 ± 2.49 b | 113.02 ± 7.68 g | 4.75 ± 0.49 b | 254.07 ± 17.53 g |
| 5 | 1.83 ± 0.19 f | 24.65 ± 1.3 a | 0 ± 0 i | 139.04 ± 9.67 ef | 2 ± 0.22 def | 615.84 ± 54.75 a |
| 6 | 2.84 ± 0.24 cde | 5.67 ± 0.41 j | 59.9 ± 4.11 a | 121.71 ± 8.44 fg | 4.61 ± 0.19 b | 199.72 ± 10.97 g |
| 7 | 3.34 ± 0.12 abc | 23.76 ± 0.63 ab | 5.71 ± 0.2 h | 252.28 ± 7.76 a | 0.97 ± 0.85 gh | 522.44 ± 3.52 bc |
| 8 | 2.94 ± 0.3 bcde | 10.43 ± 0.88 h | 30.4 ± 2.65 d | 106.42 ± 12.9 gh | 2.32 ± 0.29 cd | 368.86 ± 34.65 ef |
| 9 | 3.33 ± 0.28 abc | 19.23 ± 1.54 de | 18.65 ± 1.31 f | 203.7 ± 18.28 b | 1.01 ± 0.87 gh | 451.38 ± 39.38 d |
| 10 | 2.57 ± 0.3 e | 22.95± 1.97 abc | 1.7 ± 1.47 i | 211.81 ± 18.38 b | 1.05 ± 0.92 fgh | 517.28± 31.78 bc |
| 11 | 2.6 ± 0.05 e | 13.23 ± 0.19 g | 37.64 ± 0.55 c | 88.43 ± 1.37 h | 2.06 ± 0.06 de | 340.74 ± 18.56 ef |
| 12 | 2.78 ± 0.19 de | 8.7 ± 0.67 hi | 38.73 ± 2.74 c | 109.9 ± 11.78 gh | 3.07 ± 0.51 c | 333.7 ± 36.41 f |
| Cep a | 3.54 ± 0.11 a | 16.7 ± 1.32 f | 32.82 ± 2.44 d | 176.57 ± 12.4 cd | 1.52 ± 0.53 efg | 386.74 ± 36.4 e |
| OP b | 2.51 ± 0.99 e | 21.19 ± 0.85 cd | 2.26 ± 0.06 i | 204.95 ± 5.00 b | 1.9 ± 0.17 defg | 540.34 ± 37.02 b |
| AP | 1.65 ± 0 f | 24.19 ± 0.96 ab | 18.47 ± 0.58 f | 49.44 ± 1.68 i | 14.15 ± 0.76 a | 481.97± 17.89 cd |
| CP | 0.57 ± 0.21 g | 22.27 ± 0.53 bc | 19.46 ± 0.71 ef | 35.18 ± 1.59 i | 3.14 ± 0.1 c | 565.91± 22.27 ab |
| Responses | Experimental Value | Model Value |
|---|---|---|
| Y (%) | 13.4 ± 0.05 | 13.09 |
| DE (%) | 61.55 ± 1.36 | 61.19 |
| MeO (%) | 6.55 ± 0.81 | 6.88 |
| AUA (%) | 57.88 ± 2.75 | 64.27 |
| MM (kDa) | 106.1 ± 2.69 | * - |
| GalA (µg/mg) | 540.34 ± 37.02 | 558.19 |
| Ara (µg/mg) | 2.26 ± 0.06 | 5.37 |
| Fuc (µg/mg) | 3.47 ± 0.23 | 2.23 |
| Gal (µg/mg) | 204.95 ± 5 | 165.78 |
| Xyl (µg/mg) | 1.71 ± 0.22 | 1.77 |
| Rha (µg/mg) | 21.19 ± 0.85 | 23.5 |
Publisher’s Note: MDPI stays neutral with regard to jurisdictional claims in published maps and institutional affiliations. |
© 2021 by the authors. Licensee MDPI, Basel, Switzerland. This article is an open access article distributed under the terms and conditions of the Creative Commons Attribution (CC BY) license (https://creativecommons.org/licenses/by/4.0/).
Share and Cite
Méndez, D.A.; Fabra, M.J.; Gómez-Mascaraque, L.; López-Rubio, A.; Martinez-Abad, A. Modelling the Extraction of Pectin towards the Valorisation of Watermelon Rind Waste. Foods 2021, 10, 738. https://doi.org/10.3390/foods10040738
Méndez DA, Fabra MJ, Gómez-Mascaraque L, López-Rubio A, Martinez-Abad A. Modelling the Extraction of Pectin towards the Valorisation of Watermelon Rind Waste. Foods. 2021; 10(4):738. https://doi.org/10.3390/foods10040738
Chicago/Turabian StyleMéndez, Daniel Alexander, María José Fabra, Laura Gómez-Mascaraque, Amparo López-Rubio, and Antonio Martinez-Abad. 2021. "Modelling the Extraction of Pectin towards the Valorisation of Watermelon Rind Waste" Foods 10, no. 4: 738. https://doi.org/10.3390/foods10040738
APA StyleMéndez, D. A., Fabra, M. J., Gómez-Mascaraque, L., López-Rubio, A., & Martinez-Abad, A. (2021). Modelling the Extraction of Pectin towards the Valorisation of Watermelon Rind Waste. Foods, 10(4), 738. https://doi.org/10.3390/foods10040738