Article

Bioactive Compounds and Antioxidant Capacity in Pearling Fractions of Hulled, Partially Hull-Less and Hull-Less Food Barley Genotypes

AGROTECNIO-CERCA Center, University of Lleida, Av. Rovira Roure 191, 25198 Lleida, Spain
*
Author to whom correspondence should be addressed.
Foods 2021, 10(3), 565; https://doi.org/10.3390/foods10030565
Submission received: 3 February 2021 / Revised: 3 March 2021 / Accepted: 4 March 2021 / Published: 9 March 2021

Abstract

:
Three food barley genotypes differing in the presence or absence of husks were sequentially pearled and their fractions analyzed for ash, proteins, bioactive compounds and antioxidant capacity in order to identify potential functional food ingredients. Husks were high in ash, arabinoxylans, procyanidin B3, prodelphinidin B4 and p-coumaric, ferulic and diferulic bound acids, resulting in a high antioxidant capacity. The outermost layers provided a similar content of those bioactive compounds and antioxidant capacity that were high in husks, and also an elevated content of tocols, representing the most valuable source of bioactive compounds. Intermediate layers provided high protein content, β-glucans, tocopherols and such phenolic compounds as catechins and bound hydroxybenzoic acid. The endosperm had very high β-glucan content and relative high levels of catechins and hydroxybenzoic acid. Based on the spatial distribution of the bioactive compounds, the outermost 30% pearling fractions seem the best option to exploit the antioxidant capacity of barley to the full, whereas pearled grains supply β-glucans enriched flours. Current regulations require elimination of inedible husks from human foods. However, due to their high content in bioactive compounds and antioxidant capacity, they should be considered as a valuable material, at least for animal feeds.

Graphical Abstract

1. Introduction

Barley (Hordeum vulgare L.) is the fourth most cultivated cereal in the world after maize, wheat and rice [1]. It is widely used for feed and malt, with limited consumption as human food in some specific regions, such as the Maghreb and the high plateaus of the Himalayas. However, in recent years, it has attracted growing interest worldwide due to the health promoting properties of its bioactive compounds. In terms of health, several reports have demonstrated the positive effect of barley on the glycemic index, cholesterol and heart diseases [2]. This is mainly due to the presence of β-glucans (2–11% d.w.), a dietary fiber component for which health claims have been approved by the US Food and Drug Administration and the European Food Safety Authority [3,4]. Additional beneficial effects have been described for β-glucans. These include their properties as enhancers of the immune system against infectious diseases and some types of cancer, and also as a key modulator of the composition and activity of human microbiota [5,6,7]. Arabinoxylans are the second major component of barley dietary fiber (2–9% d.w.). Their proven health benefits include effects on the postprandial glucose response, cholesterol metabolism and immune response [8,9]. In barley, arabinoxylans are particularly associated with antioxidant activity due to the presence of phenolic acids linked to their structure [10]. Barley is also a significant source of antioxidant compounds [11,12]. It contains more vitamin E than most cereals (17–49 μg/g d.w.), this being in the form of α-tocopherol and α-tocotrienol. Furthermore, barley contains high levels of phenolic compounds such as phenolic acids and flavan 3-ols which can be found free or ester-bound to the fiber. Flavan 3-ols like catechins, procyanidins and prodelphinidins are the most abundant free phenols, while phenolic acids such as ferulic, p-coumaric and vanillic are the major constituents within the bounds. Anthocyanins are also present in considerable concentrations in some barley genotypes with colored kernels. All these phenolic compounds are considered potent antioxidants, free radical scavengers and inhibitors of lipid peroxidation [13,14]. In addition, preclinical studies and clinical trials have shown that polyphenols could greatly modulate the gut microbiota, thus favoring the growth of potential beneficial organisms and simultaneously inhibiting pathogenic bacteria [15].
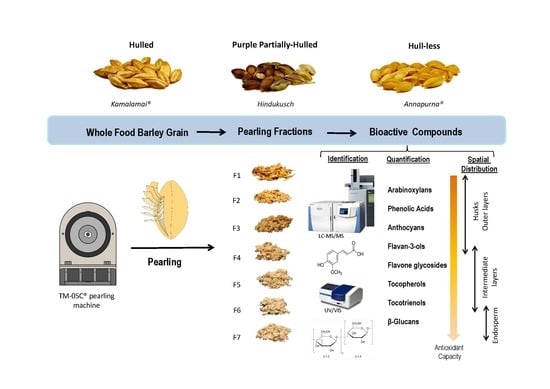
Barley grains may differ in important morphological characters. These include being hulled (covered), when the husks adhere to the caryopsis, partially hull-less (skinned), when a partial loss of the husks occurs, and hull-less (naked), when the husks are freely threshed at harvest, the latter being what is preferred for human consumption; grains from two or six rowed spikes or grains with colors such black, blue or purple, alternative to yellow. Based on the grain composition, barley is further classified as normal, high amylopectin (waxy) or high amylose starch types, high β-glucan, high lysine, and proanthocyanidin-free. All these types of grain differ widely in their physical and compositional characteristics and, accordingly, are processed differently and used for different commercial purposes.
The bioactive compounds are not uniformly distributed across the barley grains. It is known that arabinoxylans, tocotrienols and phenolics are mainly located in the outer layers, tocopherols in the germ, and β-glucans in the endosperm [16]. Thus, physical processes like pearling, an abrasive technique that gradually removes grain layers to obtain polished grain and by-products, allow favorable separation of fractions enriched in specific compounds and these can be used as functional ingredients. Several fold enrichment of antioxidant compounds has been described in barley pearled fractions [17,18] that have been used to improve the nutritional value of such wheat-based products as cookies, pasta and bread [19,20,21,22].
In recent years, increased efforts have been carried in a few countries to release new specific barley varieties for human consumption and for the food industry. In our food barley breeding program, we aim to produce varieties rich in β-glucans as well as antioxidant compounds adapted to the Spanish agro-climatic conditions. Three distinct high β-glucan barley genotypes from our program, differing in the type of grain (Kamalamai, hulled; Hindukusch, partially hull-less; Annapurna, hull-less) were selected to identify specific potential ingredients for the functional food industry. Thus, the main objectives of this work were as follows: (1) to analyze β-glucans, arabinoxylans, tocols, phenolic compounds and antioxidant capacity in the whole flours and pearling fractions of different types of barley grains; (2) to identify pearling fractions to be used potentially as functional ingredients. This research could provide further knowledge about the spatial distribution of a large number of bioactive compounds in barley pearling fractions, since most published works have focused on changes in various bioactive compounds separately [16,17,23]. To the best of our knowledge, this is the first time that such an integrative study of the major health-promoting components in barley genotypes specifically bred for human food has been explored.

2. Materials and Methods

2.1. Plant Material

  • Kamalamai: registered Spanish variety, hulled, two rowed, normal endosperm (semillas Batlle SA).
  • Hindukusch: Afghan landrace, naked but often suffering from grain skinning, two rowed, normal endosperm and purple grain used as parent in our crosses.
  • Annapurna: registered Spanish variety, hull-less, two rowed, waxy endosperm (semillas Batlle SA).
The three genotypes were cultivated under similar conditions in Bell-lloc d’Urgell, Lleida (Spain) during the 2018–2019 growing season.

2.2. Whole Flours and Pearling Fractions

Grain with size above 2.5 mm was screened for this study using a stainless-steel mesh. Six pearling fractions from each genotype were obtained by sequential processing of grain using theTM-05C pearling machine (Satake Corporation, Hiroshima, Japan) at 1060 rpm. The grains were initially pearled to remove the 5% of the original grain weight that resulted in the first fraction F1 (0–5% w/w). The remained grains were pearled to remove the second fraction F2 (5–10%), and then the process was repeated to get fractions F3 (10–15%), F4 (15–20%), F5 (20–25%), F6 (25–30%), and the residual 70% pearled grain F7 (30–100% w/w). After each pearling session, the pearling machine was cleaned to avoid mixtures between fractions. Fractions, pearled grains and whole grains were ground in a Foss Cyclotec 1093™ mill equipped with a 0.5-mm screen (Foss Iberia, Barcelona, Spain) prior to chemical analyses.

2.3. Protein and Ash Content

The protein content was done according to the Kjeldahl method in a Kjeltec system I (Foss Tecator AB, Höganäs, Sweden) using the conversion factor of 5.7. The ash content was determined in a muffle furnace according to the AOAC Official Method 942.05 [24].

2.4. β-Glucan and Arabinoxylan Content

The β-glucan and arabinoxylan contents were determined by means of the mixed-linkage β-glucan assay (K-BGLU) and D-xylose assay (K-XYLOSE) kits from Megazyme (Wicklow, Ireland).

2.5. Tocols Content

Tocopherols and tocotrienols (α-, β-, γ-, and δ-isomers) were quantified by high performance liquid chromatography (HPLC) coupled to a fluorescence detector. One gram of each barley genotype was extracted three times with 10 mL n-hexane and the extract collected after centrifuging at 9000× g for 10 min. The supernatants were pooled, reduced to dryness under a flow of nitrogen, and reconstituted in 1 mL of n-hexane. Normal phase HPLC with fluorescence detection (excitation 292 nm, emission 325 nm) was used to analyze tocopherols and tocotrienols. Aliquots of 50 μL were injected into the HPLC system following the chromatographic conditions described by Martínez-Subirà et al. [12]. Tocopherols and tocotrienols isomers were quantified with external standard curves. Results were expressed as μg/g dry sample.

2.6. Phenolic Compounds (PCs) and Anthocyanin Analysis by UPLC-MS/MS

Free phenolic compounds were extracted three times by adding 1 mL of 79.5% methanol, 19.5% Milli Q water, and 1% formic acid solution to 150 mg of barley flours. The samples were sonicated for 30 s and centrifuged at 9000× g for 10 min. The supernatants from each extraction were pooled and filtered through 0.22 μm polyvinylidene fluoride (PVDF) filter discs before chromatographic analysis. The residue was subjected to alkaline hydrolysis by adding 6 mL of 2 mol/L NaOH to obtain bound phenols. The samples were left over-night at room temperature for complete hydrolysis. Then, they were sonicated for 1 min and centrifuged at 9000× g for 10 min; the supernatant was acidified with HCl 37% (w/w) to pH 2. A total of 350 μL of supernatant was mixed with phosphoric acid 10 min, centrifuged at 9000× g, and subjected to μSPE clean-up according to Serra et al. [25]. Briefly, the micro-cartridges were pre-conditioned with acidified water (pH 2) and methanol. The samples were loaded onto the μSPE and subsequently washed with water and water/methanol 95/5 (v/v). The PCs were eluted with methanol, and 2.5 μL of the eluate was directly analyzed by liquid chromatography. The extracts were analyzed by Ac Quity Ultra-Performance TM liquid chromatography coupled to a tandem mass spectrometer (UPLC-MS/MS), equipped with the analytical column Ac Quity BEH C18 (100 mm × 2.1 mm i.d., 1.7 μm) and the Van Guard TM Pre-Column Ac Quity BEH C 18 (5 mm × 2.1 mm, 1.7 μm), all from Waters, Milford, MA, USA. The mobile phase was 0.2% (v/v) acetic acid and acetonitrile for the phenolic compounds (PCs), and 10% acetic acid (v/v) and acetonitrile for the anthocyanins. The UPLC system was coupled to a triple quadrupole detector mass spectrometer from Waters equipped with a Z-spray electrospray interface for ionization, operating in the negative mode [M−H] for the PCs and the positive mode [M−H]+ for the anthocyanins. Quantification was based on a 0.02–25 ng calibration curve of commercially available standards, and the results were expressed as μg/g dry sample. A linear response was obtained for all standards and tested by linear regression analysis. The limits of detection (LOD) ranged from 0.007 to 0.09 ng and the limits of quantification (LOQ) from 0.02 to 0.30 ng.

2.7. Antioxidant Capacity (AC) Analysis

The Oxygen Radical Absorbance Capacity (ORAC) of both the free and bound extracts was measured as described Huang et al. [26]. The antioxidant capacity (AC) was determined using the FLUO star OPTIMA fluorescence reader (BMG Labtech, Offenburg, Germany) in a 96-well polystyrene microplate controlled by the OPTIMA 2.10 R2 software. Changes in fluorescence were measured under controlled temperature (37 °C) in a reader with fluorescence filters with 485 nm excitation and 520 nm emission wavelengths. Trolox (6-hydroxy-2, 5, 7, 8-tetramethylchroman-2-carboxylic acid) was used as control, with one ORAC unit being equal to the antioxidant protection given by 1 μmol Trolox. The results were expressed as μmols of Trolox-equivalents per 100 g of dry sample.

2.8. Statistical Analysis

All statistical analyses were conducted using JMP®Pro14 (SAS institute Inc., Cary, NC, USA). Analytical measurements were carried out in triplicate and the results were presented as mean values. Data was checked for normality and for homoscedasticity of variances based on a number of diagnostic tools, such as residual plots, Box-Cox′s Lambda and Levene’s test of equality of variances, provided by JMP. When needed, a logarithmic transformation was used and indicated in the text. For multiple comparisons, Tukey–Kramer’s honestly-significant-difference tests (HSD) (α = 0.05) were conducted once the corresponding ANOVA F-tests were found significant. Principal Component Analysis (PCA) was used to graphically represent the association between fractions, genotypes and bioactive compounds using standardized data.

3. Results and Discussion

3.1. Ash and Protein Contents

The ash and protein contents of the whole flours and pearling fractions are shown in Table 1. The hulled genotype Kamalamai showed the highest ash content and Hindukush, the partially hull-less genotype, the highest protein amount. The distribution through the grain showed a progressive decrease in the ash content from the first pearling fraction F1 of the three genotypes toward the endosperm. This was because the mineral components are mainly localized in the outer layers of the kernel. The protein content was the lowest in the initial surface F1 fraction of the Kamalamai, which mainly correspond to husks, whereas the highest content was detected in the middle fraction F4 of both genotypes containing husks, and F3 of the hull-less Annapurna genotype. These results were in accordance to that observed by other authors on barley fractions obtained by pearling or roller-milling processes [16,22].

3.2. β-Glucans, Arabinoxylans and Tocols Contents

In barley, the β-glucan content depends on genetic and environmental factors as well as on the interaction between these [8,27]. In our work, the three barley genotypes were high in β-glucans with amounts ranging from 8.3 to 9.5 g/100 g (Table 2). Annapurna had the highest β-glucan content while both genotypes containing husks showed similar values. These results agree with earlier studies which described higher β-glucan levels in hull-less and waxy genotypes like Annapurna rather than in hulled barley with normal endosperm [2,28]. The distribution of this fiber component through the grain is shown in Figure 1. β-glucans increased gradually from the outer to inner layers of the grains in accordance with previous findings [22,29]. The lowest concentrations were detected in the outer fraction F1 of the three genotypes and progressively increased until F4 of Annapurna, F5 of Kamalamai, and F6 of Hindukusch, after wich they remained constant. The net effect was that removing the 30% outer fractions of Kamalamai and Hindukusch increased the β-glucan content by 9% and 6%, respectively, while this increase was only 3% in the hull-less genotype Annapurna.
Arabinoxylans in cereals are mainly localized in the husks and cell walls of the outer layers of the grain including pericarp, testa and aleurone. In barley, aleurone cell walls are built up mainly of arabinoxylans (60 to 70%) whereas the endosperm cell walls contain only about 20 to 40% [30]. In our work, the arabinoxylan content of whole barley flours ranged from 5.5 to 6.6 g/100 g; Hindukusch being the highest (Table 2). These values were in accordance with those reported for different barley accessions in a previous work [31]. Contrary to the β-glucans, the arabinoxylans decreased progressively from the outer to the inner layers of the grain (Figure 2). The highest arabinoxylans amounts were observed in all F1 fractions. These mainly correspond to the hulls, testa and to the pericarp of both genotypes containing husks, and to pericarp, testa and some aleurone layers of Annapurna. The arabinoxylan level detected in the outermost layer F1 of the three genotypes was on average four times higher than that in whole barley flours. This finding may draw attention to barley husks as a good source of arabinoxylans.
Tocols are plant metabolites with interest for their potential benefits for human health [32]. Tocols, which consist of tocopherol and tocotrienols, are found in cereals at moderate levels ranging between 17 and 49 μg/g [17,33]. Among cereals, barley is one of the best sources of tocols due to the high content and favorable distribution of all eight major tocols, α-, β-, γ- and δ- tocopherols and tocotrienols [34]. While all tocol forms have similar antioxidant properties, α tocopherol (αT) is the only one that meets the Recommended Daily Allowance for vitamin E [35,36]. In our study, there were detectable concentrations of the eight tocol isomers in all whole barley flours (Table 2). Total tocols ranged from 38 to 44 μg/g in good accordance with values found in other barley cultivars [12,16,17,18]. Tocotrienols accounted for 79% of the total tocols while the tocopherols were 21%. αT and α tocotrienols (αT3) were the main isomers in each tocol class, and their concentrations ranged from 6.2 to 8.3 μg/g and 17 to 20 μg/g respectively. Significant differences were identified among genotypes for most tocol forms. Both genotypes containing husks were the highest in αT, γT3 and total tocols. The tocopherol and tocotrienol contents in the fractions are shown in Figure 3A,B and Table S1. In line with previous finding, tocopherols and tocotrienols are distributed in a tissue specific manner with tocopherols mainly located in the germ whit tocotrienols in the aleurone and sub-aleurone layers [16,17,35]. In this study, the highest tocopherol contents were detected between the middle fractions F3 to F6 of genotypes containing husk. This correspond to the highest amount of protein as described above, whereas the content was uniformly distributed across the grain in the hull-less genotype Annapurna. Tocotrienols were more abundant in the outer layers F2 and F3 of the genotypes containing husks, and F1 to F3 of the hull-less one. Fractions F2 to F4 of the genotypes containing husks, and F1 to F3 of Annapurna would provide average tocol contents of 194 μg/g. These selected fractions contain over five times more tocols than whole flours and could be used as a valuable source of natural tocols.

3.3. Phenolic Compounds (PCs) Contents

Phenolic compounds in barley can be found free or bound to the fiber being differentially distributed across the grain [37]. The analysis of PCs in whole barley flours carried out by ultra-performance liquid chromatography-tandem mass spectrometer (UPLC-MS/MS) included free and bound forms (Table 3). Total free PCs ranged from 369 to 600 μg/g among which, flavan-3-ols accounted for 80%, phenolic acids for 16% and flavone glycosides for 4.1%. Total bound PCs ranged from 781 to 1194 μg/g and were comprised of 99.8% of phenolic acids and 0.2% of flavone glycosides. Bound phenolic acids were predominant in all whole flours representing 65–76% of the total PCs.
Looking at the pearling fractions, the results showed a wide range of phenolic contents with differences between fractions and genotypes. Twenty-two different free phenols were detected. Their distribution within the fractions is detailed in Table 4. Procyanidin B3 and Prodelphinidin B4 were the most abundant flavan-3-ols in all the external fractions. Fractions F2 and F3 of the genotypes containing husks and F1 and F2 of Annapurna showed the highest concentrations of most flavan-3-ols which then progressively decreased until the endosperm except for catechins whose content did not vary as much between fractions. Fraction F1 was the richest in free phenolic acids in the three genotypes. This excludes gallic acid (the major free phenolic acid) whose content was similar within the external fractions. Some free phenolic acids, such as decarboxylated diferulic, hidroxybenzoic, caffeic and cinnamic, were exclusively detected in F1, F2 and F3 and were absent in the rest of the grain. Moreover, decarboxylated diferulic, hydroxybenzoic and 2,4-dihydroxybenzoic were not detected in Annapurna. F1 and F2 had also the highest concentrations of some free flavone glycosides such as apigenin 6-C-arabinoside 8-C-glucoside and ixovitexin 7-rutinoside, while the concentration of the remained free flavones was homogeneous or randomly distributed across the grain. Isoorientin was not detected in Annapurna nor was isovitexin 7-(6’’’-sinapoylglucoside) 4’-glucoside in Hindukusch and Annapurna.
With reference to bound phenolic acids, their distribution across the grain was similar in the three genotypes (Table 5). The highest values were detected in the outermost fraction (F1) and gradually decreased toward the core of the grain, as did arabinoxylans, with which they are esterified. In fact, arabinoxylans positively correlated with bound phenolic acids (r = 0.93, p < 0.001). Ferulic acid was found to be the most abundant bound phenolic acid found in the three genotypes, accounting for 68–83% of total bound; p-coumaric acid came second in the genotypes containing husks (12–15%) and the diferulic acid in Annapurna (6%). Several authors detected high amounts of bound phenolic acids in husks [29,30]. This might explain the results observed in our study: the genotypes containing husks being the richest in these compounds. In general, F1 was remarkably high in bound phenolic acids and might provide an important source of antioxidants. Minor bound phenolic acids, such as hydroxybenzoic acid, were uniformly distributed across the grain, and the distribution of others, like isoferulic, hydroxybenzoic, 2,4-dihydroxybenzoic, caffeic, sinapic and cinnamic acids, was not very marked. Bound diferulic tetrahydrofuran acid seemed to be exclusively present in the husks and pericarp layers as it was only detected in the F1 and F2 of both genotypes containing husks. Bound flavone glycosides showed similar distribution pattern as did the free forms.
Considering total PCs, similar distribution patterns between pearling fractions were observed in the three genotypes (Figure 4). F1 to F3 of the genotypes containing husks were those with the highest total PCs with the average content of 4339 μg/g, being on average 3 times higher than the contents in whole flours. On the contrary, F1 of the hull-less genotype was the highest in total PCs.
Most studies into the spatial distribution of PCs in barley have focused on either the total PCs by colorimetric methods [21,22] or just the major phenolic acids [38,39], or have analyzed representative phenolic acids and free flavan-3-ols in a few fractions of previously dehulled cultivars [18,40]. The results obtained in the present study show for the first time the specific distribution of a great variety of phenolic compounds determined by HPLC-MS/MS. These include phenolic acids, flavan-3-ols and flavone glycosides in seven pearling fractions in three food barley genotypes differing in the presence of the husk in the threshed grain.

3.4. Anthocyanins

In this work, the anthocyanin content of Kamalamai and Annapurna was negligible, whereas a total of 24 anthocyanins were detected in the purple Hidukusch genotype. These included pelargonidin, cyanidin, peonidin, delphinidin, petunidin and malvinidin conjugates of glucose, acetylglucose, malonylglucose, dimalonylglucose, arabinose, rutinose and dihexose. The total anthocyanin content was 47 μg/g, which was lower than or similar to those detected in other purple barley cultivars [12,41,42]. This indicates a great diversity, probably associated with genetic and environmental factors. Cyanidin dimalonyl glucoside represented 45% of the total anthocyanins followed by cyaniding glucoside, which accounted for 35%. Several studies have shown that anthocyanins are mainly concentrated in the pericarp and some aleurone layers that provide the grain colour [35]. In this study, the distribution of anthocyanins between the barley fractions showed fractions F1 and F2 as the highest (Table 6 and Table S2). The total anthocyanin contents detected in F2 was upon 10 times higher than that in whole flour. Like most phenolic compounds, the anthocyanin concentration decreased progressively from F2 to F7 where minor contents were detected.

3.5. Antioxidant Capacity (AC)

Antioxidant capacity is an important integrative parameter for evaluating the potential health benefits of foods. The oxygen radical absorbance capacity (ORAC) values of the free, bound and total phenolic compounds of whole barley flours were in the ranges from 46 to 71, 28 to 58, and 74 to 119 μmol Trolox/g respectively (Table 7).
The contribution of free PCs to the total AC was higher than that of the bound PCs. This suggested that free PCs had excellent AC as determined by the ORAC assay, since they were at much lower concentrations than bound PCs as explained above. The average ORAC values of genotypes containing husks were significantly higher than that of Annapurna. The ORAC values detected in the three barley genotypes were similar or relatively higher than those reported for whole barley flours in previous works [23,43,44,45].
When the ORAC assay was measured in the pearling fractions, the highest values were found in the first three fractions of the genotypes containing husks and F1 of Annapurna (Figure 5). F1 of Kamalamai showed a similar AC to F2 and F3 despite having higher amounts of total PCs. These results should be attributed to the strong antioxidant capacity of free PCs in F2 and F3, which matched the ORAC values of F1. In the case of the purple Hindukusch genotype, the highest AC was detected in F2. This fraction contained the highest amount of free PCs, including anthocyanins, whose AC exceeded that of the components in F1 and F3. Finally, F1 of Annapurna (equivalent to F2 of the genotypes containing husks) showed the highest AC, and this value decreased going toward the inner part of the grain as did free, bound and total PCs. Based on these results, the 0–15% outer fractions of the genotypes containing husks and the 0–5% fraction of Annapurna made significant contributions to the total antioxidant capacity of all whole flours.

3.6. Association between Variables

Figure 6 shows the PCA biplot of ash, protein, bioactive compounds and antioxidant capacity in the seven pearling fractions of the three food barley genotypes. The first two principal component axes explained more than two thirds of the total variability in the standardized data from Figure 1, Figure 2 and Figure 3 and and Table 4 and Table 5. The first axis, explaining 50% of the total variation, seemed to be related to the contrast between the bioactive compounds found in the outer fractions (ash, arabinoxylans, phenolic compounds and tocotrienols) and the β-glucans present in the endosperm. The second, explaining 17% of the total, seemed to be related to compounds such as tocopherols, protein and minor phenolic compounds like catechins (Cat) and bound hydroxybenzoic acid (OHB) found in intermediate layers.
The size of the circles for each pearling fractions was proportional to their total antioxidant capacity and clearly descends from fraction F1 to F7 for all genotypes. The distribution pattern was similar for all genotypes, with little differences for the outermost fractions. The size of the blue squares representing the 28 phenolic compounds was proportional to their content within the fractions. Overall, Hindukusch, with the outermost fractions being further away from the origin of coordinates, seemed higher in such bioactive compounds as tocotreinols, prodelphinidin B4 (PdB4) bound ferulic acid (B-F), and anthocyanins (AN) than the other two genotypes. Highlighted in quadrant II, bound p-coumaric acid (p-Cm) showed higher content in the fractions that mainly contain husks, and in quadrant I the bound ferulic (B-F) and diferulic (B-DiF) acids, and the procyanidin B3 (PcB3) and prodelphinidin B4 (PdB4) present in the outer external fraction.
Whereas PCA is an extremely powerful tool for the visualization of multidimensional data, it does not allow for statistical inferences about contents across grain sections. These comparisons are shown in Figure 7, which summarizes the Tukey’s HSD Mean Comparison groupings for four sequential spatial sections of the barley grain, determined by differential aggregation of the seven pearling fraction from each of the three, hulled, partially-hull-less and hull-less food barley genotypes used. The husks had a high content in ash, arabinoxylans, some specific major phenolic compounds such as bound p-coumaric, ferulic and diferulic acids, procyanidin B3 and prodelphinidin B4, resulting in a high antioxidant capacity, similar to that of the outermost layers. Current regulations require removal of the inedible husks from hulled barley to be used for human food [46]. However, due to its high content of bioactive compounds, either the whole hulled barley grains or the external husks of food hulled barley genotypes should be considered as a valuable material for animal feeds. Apart from providing the same concentration of bioactive compounds as husks, the outermost layers also had high contents of tocols. Therefore, the outermost layers of naked barley or previously de-husked barley for human food represent the most valuable source of bioactive compounds. The intermediate layers, provide high contents of protein, β-glucans, tocopherols and some phenolic compounds such as catechins and hydroxybenzoic acid. Finally, the endosperm has the highest β-glucans contents and relative high presence of catechins and hydroxybenzoic acid.
In conclusion, high β-glucan food barley genotypes can be an excellent source of not just of dietary fiber but a plethora of phenolic compounds with potential health promoting properties. Whole or lightly pearled grains, as well as their specific pearling fractions, could be used as a diverse source of valuable functional ingredients.

Supplementary Materials

The following are available online at https://www.mdpi.com/2304-8158/10/3/565/s1, Table S1: Tocopherol and Tocotrienol contents in pearling fractions of three barley genotypes; Table S2: Anthocyanins contents (µg/g) in the pearling fractions of the partially-hull-less and purple genotype.

Author Contributions

Conceptualization, M.M. and M.-P.R.; methodology, M.M.-S., M.M. and M.-P.R.; formal chemical analyses, M.M.-S., A.M. and E.P.; statistical analyses and data curation, M.M.-S. and I.R.; writing—original draft preparation, M.M.-S.; writing—review and editing, I.R., M.-P.R. and M.M.; supervision, M.M.; funding acquisition, I.R. and M.M. All authors have read and agreed to the published version of the manuscript.

Funding

This work was funded by project AGL 2015-69435-C3-1 from the Spanish Ministry of Economy and Competitiveness. Mariona Martínez-Subirà was supported by a pre-doctoral fellowship (BES-2016-078654/AGL 2015-69435-C3-1).

Institutional Review Board Statement

Not applicable.

Informed Consent Statement

Not applicable.

Data Availability Statement

Data will be available at https://dataverse.csuc.cat/dataverse/Agrotecnio, accessed on 30 October 2020.

Acknowledgments

Our thanks to Semillas Batlle, SA (Bell-lloc d’Urgell, Lleida, Spain) for providing the food barley genotypes used in this work.

Conflicts of Interest

The authors declare no conflict of interest.

References

  1. Faostat. Available online: http://faostat.fao.org (accessed on 20 January 2021).
  2. Baik, B.-K.; Ullrich, S.E. Barley for food: Characteristics, improvement, and renewed interest. J. Cereal Sci. 2008, 48, 233–242. [Google Scholar] [CrossRef]
  3. FDA. Food Labeling: Health Claims, Soluble Dietary Fiber from Certain Foods and Coronary Heart Disease. Available online: https://www.federalregister.gov/documents/2008/02/25/E8-3418/food-labeling-health-claims-soluble-fiber-from-certain-foods-and-risk-of-coronary-heart-disease (accessed on 30 October 2020).
  4. EFSA. Scientific Opinion on the Substantiation of Health Claims Related to β-Glucans from Oats and Barley and Maintenance of Normal Blood LDL-Cholesterol Concentrations (ID 1236, 1299), Increase in Satiety Leading to a Reduction in Energy Intake (ID 851, 852), Reduction of Post-Prandial Glycaemic Responses (ID 821, 824), and “Digestive Function” (ID 850) Pursuant to Article 13 (1) of Regulation (EC) No 1924/2006. EFSA J. 2011, 9, 2207. [Google Scholar]
  5. De Graaff, P.; Govers, C.; Wichers, H.J.; Debets, R. Consumption of β-glucans to spice up T cell treatment of tumors: A review. Expert Opin. Biol. Ther. 2018, 18, 1023–1040. [Google Scholar] [CrossRef] [PubMed]
  6. Hong, F.; Yan, J.; Baran, J.T.; Allendorf, D.J.; Hansen, R.D.; Ostroff, G.R.; Xing, P.X.; Cheung, N.-K.V.; Ross, G.D. Mechanism by Which Orally Administered β-1,3-Glucans Enhance the Tumoricidal Activity of Antitumor Monoclonal Antibodies in Murine Tumor Models. J. Immunol. 2004, 173, 797–806. [Google Scholar] [CrossRef] [Green Version]
  7. Bai, J.; Ren, Y.; Li, Y.; Fan, M.; Qian, H.; Wang, L.; Wu, G.; Zhang, H.; Qi, X.; Xu, M.; et al. Physiological functionalities and mechanisms of β-glucans. Trends Food Sci. Technol. 2019, 88, 57–66. [Google Scholar] [CrossRef]
  8. Izydorczyk, M.; Dexter, J. Barley β-glucans and arabinoxylans: Molecular structure, physicochemical properties, and uses in food products—A Review. Food Res. Int. 2008, 41, 850–868. [Google Scholar] [CrossRef]
  9. Fadel, A.; Mahmoud, A.M.; Ashworth, J.J.; Li, W.; Ng, Y.L.; Plunkett, A. Health-related effects and improving extractability of cereal arabinoxylans. Int. J. Biol. Macromol. 2018, 109, 819–831. [Google Scholar] [CrossRef] [Green Version]
  10. Malunga, L.N.; Beta, T. Antioxidant Capacity of Water-Extractable Arabinoxylan from Commercial Barley, Wheat, and Wheat Fractions. Cereal Chem. J. 2015, 92, 29–36. [Google Scholar] [CrossRef]
  11. Gangopadhyay, N.; Rai, D.K.; Brunton, N.P.; Gallagher, E.; Hossain, M.B. Antioxidant-guided isolation and mass spectrometric identification of the major polyphenols in barley (Hordeum vulgare) grain. Food Chem. 2016, 210, 212–220. [Google Scholar] [CrossRef] [PubMed] [Green Version]
  12. Martínez, M.; Motilva, M.J.; López de las Hazas, M.C.; Romero, M.P.; Vaculova, K.; Ludwig, I.A. Phytochemical composition and β-glucan content of barley genotypes from two different geographic origins for human health food production. Food Chem. 2018, 245, 61–70. [Google Scholar] [CrossRef]
  13. Abdel-Aal, E.-S.M.; Choo, T.-M.; Dhillon, S.; Rabalski, I. Free and Bound Phenolic Acids and Total Phenolics in Black, Blue, and Yellow Barley and Their Contribution to Free Radical Scavenging Capacity. Cereal Chem. J. 2012, 89, 198–204. [Google Scholar] [CrossRef]
  14. Suriano, S.; Iannucci, A.; Codianni, P.; Fares, C.; Russo, M.; Pecchioni, N.; Marciello, U.; Savino, M. Phenolic acids profile, nutritional and phytochemical compounds, antioxidant properties in colored barley grown in southern Italy. Food Res. Int. 2018, 113, 221–233. [Google Scholar] [CrossRef]
  15. Corrêa, T.A.F.; Rogero, M.M.; Hassimotto, N.M.A.; Lajolo, F.M. The Two-Way Polyphenols-Microbiota Interactions and Their Effects on Obesity and Related Metabolic Diseases. Front. Nutr. 2019, 6, 188. [Google Scholar] [CrossRef] [Green Version]
  16. Panfili, G.; Fratianni, A.; Di Criscio, T.; Marconi, E. Tocol and β-glucan levels in barley varieties and in pearling by-products. Food Chem. 2008, 107, 84–91. [Google Scholar] [CrossRef]
  17. Badea, A.; Carter, A.; Legge, W.G.; Swallow, K.; Johnston, S.P.; Izydorczyk, M.S. Tocols and oil content in whole grain, brewer’s spent grain, and pearling fractions of malting, feed, and food barley genotypes. Cereal Chem. J. 2018, 95, 779–789. [Google Scholar] [CrossRef]
  18. Irakli, M.; Lazaridou, A.; Mylonas, I.; Biliaderis, C.G. Bioactive Components and Antioxidant Activity Distribution in Pearling Fractions of Different Greek Barley Cultivars. Foods 2020, 9, 783. [Google Scholar] [CrossRef]
  19. Sharma, P.; Gujral, H.S. Cookie making behavior of wheat-barley flour blends and effects on antioxidant properties. LWT 2014, 55, 301–307. [Google Scholar] [CrossRef]
  20. Martínez-Subirà, M.; Romero, M.P.; Puig, E.; Macià, A.; Romagosa, I.; Moralejo, M. Purple, high β-glucan, hulless barley as valuable ingredient for functional food. LWT 2020, 131, 109582. [Google Scholar] [CrossRef]
  21. Marconi, E.; Graziano, M.; Cubadda, R. Composition and Utilization of Barley Pearling By-Products for Making Functional Pastas Rich in Dietary Fiber and β-Glucans. Cereal Chem. J. 2000, 77, 133–139. [Google Scholar] [CrossRef]
  22. Blandino, M.; Locatelli, M.; Sovrani, V.; Coïsson, J.D.; Rolle, L.; Travaglia, F.; Giacosa, S.; Bordiga, M.; Scarpino, V.; Reyneri, A.; et al. Progressive Pearling of Barley Kernel: Chemical Characterization of Pearling Fractions and Effect of Their Inclusion on the Nutritional and Technological Properties of Wheat Bread. J. Agric. Food Chem. 2015, 63, 5875–5884. [Google Scholar] [CrossRef] [PubMed]
  23. Madhujith, T.; Shahidi, F. Antioxidant potential of barley as affected by alkaline hydrolysis and release of insoluble-bound phenolics. Food Chem. 2009, 117, 615–620. [Google Scholar] [CrossRef]
  24. Thiex, N.; Novotny, L.; Crawford, A. Determination of Ash in Animal Feed: AOAC Official Method 942.05 Revisited. J. AOAC Int. 2012, 95, 1392–1397. [Google Scholar] [CrossRef] [PubMed]
  25. Serra, A.; Rubio, L.; Macià, A.; Valls, R.-M.; Catalán, Ú.; De La Torre, R.; Motilva, M.-J. Application of dried spot cards as a rapid sample treatment method for determining hydroxytyrosol metabolites in human urine samples. Comparison with microelution solid-phase extraction. Anal. Bioanal. Chem. 2013, 405, 9179–9192. [Google Scholar] [CrossRef] [PubMed]
  26. Huang, D.; Ou, B.; Hampsch-Woodill, M.; Flanagan, J.A.; Prior, R.L. High-Throughput Assay of Oxygen Radical Absorbance Capacity (ORAC) Using a Multichannel Liquid Handling System Coupled with a Microplate Fluorescence Reader in 96-Well Format. J. Agric. Food Chem. 2002, 50, 4437–4444. [Google Scholar] [CrossRef]
  27. Swanston, J.S.; Ellis, R.P.; Pérez-Vendrell, A.; Voltas, J.; Molina-Cano, J.-L. Patterns of Barley Grain Development in Spain and Scotland and Their Implications for Malting Quality. Cereal Chem. J. 1997, 74, 456–461. [Google Scholar] [CrossRef]
  28. Andersson, A.A.M.; Lampi, A.-M.; NyströmL; Piironen, V.; Li, L.; Ward, J.L.; Gebruers, K.; Courtin, C.M.; Delcour, J.A.; Boros, D.; et al. Phytochemical and Dietary Fiber Components in Barley Varieties in the Healthgrain Diversity Screen. J. Agric. Food Chem. 2008, 56, 9767–9776. [Google Scholar] [CrossRef]
  29. Izydorczyk, M.S.; McMillan, T.; Bazin, S.; Kletke, J.; Dushnicky, L.; Dexter, J.; Chepurna, A.; Rossnagel, B. Milling of Canadian oats and barley for functional food ingredients: Oat bran and barley fibre-rich fractions. Can. J. Plant Sci. 2014, 94, 573–586. [Google Scholar] [CrossRef]
  30. Izydorczyk, S.M.; Biliaderis, C.G. Arabinoxylans: Technologically and Nutritionally Functional Plant Polysaccharides. In Functional Food Carbohydrates; Biliaderis, C.G., Izydorczyk, S.M., Eds.; Taylor & Francis Group: Boca Raton, FL, USA, 2007; pp. 250–290. [Google Scholar]
  31. Hassan, A.S.; Houston, K.; Lahnstein, J.; Shirley, N.; Schwerdt, J.G.; Gidley, M.J.; Waugh, R.; Little, A.; Burton, R.A. A Genome Wide Association Study of arabinoxylan content in 2-row spring barley grain. PLoS ONE 2017, 12, e0182537. [Google Scholar] [CrossRef] [PubMed] [Green Version]
  32. Cavallero, A.; Gianinetti, A.; Finocchiaro, F.; Delogu, G.; Stanca, A.M. Tocols in hull-less and hulled barley genotypes grown in contrasting environments. J. Cereal Sci. 2004, 39, 175–180. [Google Scholar] [CrossRef]
  33. Lampi, A.-M.; Nurmi, T.; Ollilainen, V.; Piironen, V. Tocopherols and Tocotrienols in Wheat Genotypes in the Healthgrain Diversity Screen. J. Agric. Food Chem. 2008, 56, 9716–9721. [Google Scholar] [CrossRef]
  34. Moreau, R.A.; Flores, R.A.; Hicks, K.B. Composition of Functional Lipids in Hulled and Hulless Barley in Fractions Obtained by Scarification and in Barley Oil. Cereal Chem. J. 2007, 84, 1–5. [Google Scholar] [CrossRef] [Green Version]
  35. Idehen, E.; Tang, Y.; Sang, S. Bioactive phytochemicals in barley. J. Food Drug Anal. 2017, 25, 148–161. [Google Scholar] [CrossRef] [Green Version]
  36. Graebner, R.C.; Wise, M.; Cuesta-Marcos, A.; Geniza, M.; Blake, T.; Blake, V.C.; Butler, J.; Chao, S.; Hole, D.J.; Horsley, R.; et al. Quantitative Trait Loci Associated with the Tocochromanol (Vitamin E) Pathway in Barley. PLoS ONE 2015, 10, e0133767. [Google Scholar] [CrossRef] [Green Version]
  37. Gamel, T.; Abdel-Aal, E.-S.M. Phenolic acids and antioxidant properties of barley wholegrain and pearling fractions. Agric. Food Sci. 2012, 21, 118–131. [Google Scholar] [CrossRef]
  38. Holtekjølen, A.K.; Sahlstrøm, S.; Knutsen, S.H. Phenolic contents and antioxidant activities in covered whole-grain flours of Norwegian barley varieties and in fractions obtained after pearling. Acta Agric. Scand. Sect. B Plant Soil Sci. 2011, 61, 67–74. [Google Scholar] [CrossRef]
  39. Giordano, D.; Reyneri, A.; Locatelli, M.; Coïsson, J.D.; Blandino, M. Distribution of bioactive compounds in pearled fractions of tritordeum. Food Chem. 2019, 301, 125228. [Google Scholar] [CrossRef] [PubMed]
  40. Gangopadhyay, N.; Harrison, S.M.; Brunton, N.P.; Hidalgo-Ruiz, J.L.; Gallagher, E.; Rai, D.K. Brans of the roller-milled barley fractions rich in polyphenols and health-promoting lipophilic molecules. J. Cereal Sci. 2018, 83, 213–221. [Google Scholar] [CrossRef]
  41. Lee, C.; Han, D.; Kim, B.; Baek, N.; Baik, B.-K. Antioxidant and anti-hypertensive activity of anthocyanin-rich extracts from hulless pigmented barley cultivars. Int. J. Food Sci. Technol. 2013, 48, 984–991. [Google Scholar] [CrossRef]
  42. Zhang, X.-W.; Jiang, Q.-T.; Wei, Y.-M.; Liu, C. Inheritance analysis and mapping of quantitative trait loci (QTL) controlling individual anthocyanin compounds in purple barley (Hordeum vulgare L.) grains. PLoS ONE 2017, 12, e0183704. [Google Scholar] [CrossRef] [PubMed] [Green Version]
  43. Yoshida, A.; Sonoda, K.; Nogata, Y.; Nagamine, T.; Sato, M.; Oki, T.; Hashimoto, S.; Ohta, H. Determination of Free and Bound Phenolic Acids, and Evaluation of Antioxidant Activities and Total Polyphenolic Contents in Selected Pearled Barley. Food Sci. Technol. Res. 2010, 16, 215–224. [Google Scholar] [CrossRef] [Green Version]
  44. Zhu, Y.; Li, T.; Fu, X.; Abbasi, A.M.; Zheng, B.; Liu, R.H. Phenolics content, antioxidant and antiproliferative activities of dehulled highland barley (Hordeum vulgare L.). J. Funct. Foods 2015, 19, 439–450. [Google Scholar] [CrossRef]
  45. Xia, X.; Xing, Y.; Kan, J. Antioxidant activity of Qingke (highland hull-less barley) after extraction/hydrolysis and in vitro simulated digestion. J. Food Process. Preserv. 2019, 44, 14331. [Google Scholar] [CrossRef]
  46. FDA. Draft Guidance for Industry and FDA Staff: Whole Grain Label Statements (Docket No FDA-2006-D-0298). Issued by: Center for Food Safety and Applied Nutrition. Available online: https://www.regulations.gov/docket?D=FDA-2006-D-0298 (accessed on 21 January 2021).
Figure 1. β-Glucan content (g/100 g) in barley pearling fractions. The results are presented as the mean; different letters indicate significant differences within the pearled fraction of each genotype; (Tukey-Kramer’s HSD for α = 0.05). F1–7: fraction1–7.
Foods 10 00565 g001
Figure 2. Arabinoxylan contents (g/100 g) in barley pearling fractions. Results are presented as the mean; different letters indicate significant differences within pearled fraction of each genotype; (Tukey-Kramer’s HSD for α = 0.05).
Foods 10 00565 g002
Figure 3. (A) α-, β-, γ-, δ- Tocopherol contents (µg/g), and (B) α-, β-, γ-, δ- Tocotrienol contents (µg/g) in barley pearling fractions. Results are presented as the mean; different letters indicate significant differences between pearled fractions of each genotype on log-transformed data; (Tukey-Kramer’s HSD for α = 0.05).
Foods 10 00565 g003
Figure 4. Total phenols contents (µg/g) in seven pearling fractions of three food barley genotypes. Results are presented as the mean; different letters indicate significant differences between pearled fractions of each genotype on log-transformed data; (Tukey-Kramer’s HSD for α = 0.05).
Foods 10 00565 g004
Figure 5. Antioxidant capacity (µmol Trolox/g) detected in seven pearling fractions in three food barley genotypes. Results are presented as the mean; different letters indicate significant differences between pearled fractions of each genotype on log-transformed data; (Tukey-Kramer’s HSD for α = 0.05).
Foods 10 00565 g005
Figure 6. Biplot of the Principal Component Analysis of ash, protein, dietary fiber and 60 bioactive compounds in seven sequential pearling fractions in three food barley genotypes. The size of the squares is proportional to each phenolic compound content; Circle size is proportional to total antioxidant capacity. F: fraction; AS: Ash; P: Protein; βG: β-glucans; AX: arabinoxylans; T: tocopherols; T3: tocotrienols. The following eight main phenolic compounds are also labeled: FA: bound ferulic acid; p-Cm: bound p-coumaric acid; DiF: bound diferulic acid; Cat: catechins; OHB: m- or o-hydroxybenzoic acid; PcB3: procyanindin B3, PdB4: prodelfinidin B4; Light blue squares: flavone glycosides; AN: total anthocyanins.
Foods 10 00565 g006
Figure 7. Tukey’s HSD groupings for a number of compounds for the different sections of the grains across three food barley genotypes. The colored left columns represent the different pearling fractions (F1–F7) of the Kamalamai (K), Hindukusch (H) and Annapurna (A) used for the aggregation into four grain sections shown in the first column. A: Ash; P: protein; βG: β-glucans; AX: arabinoxylans; T: tocopherols; T3: tocotrienols; Cat: catechins; PB3: Procyanidin B3; PB4: prodelphinidin B4; OHB: m- or o-hydroxybenzoic acid; pCm: bound p-coumaric acid, FA: bound ferulic acid; DiF: bound diferulic acid; AC: total antioxidant capacity. ‡ Analyses carried out on log-transformed data.
Foods 10 00565 g007
Table 1. Ash and protein contents in whole barley flours and pearling fractions.
Ash (%)Protein (%)
KamalamaiHindukushAnnapurna Kamalamai HindukushAnnapurna
Whole flour1.97 a1.68 a1.48 b 14.62 b 15.26 a14.83 ab
Fractions
F16.64 a6.52 a5.16 a7.77 g10.54 e19.97 e
F25.60 b5.75 b4.74 b17.88 e17.17 d25.63 c
F35.00 c5.86 b3.81 c24.18 d23.10 c27.88 a
F43.93 d5.09 c3.23 d26.72 a27.57 a27.34 b
F53.17 e3.94 d2.26 e26.11 b27.34 a25.33 c
F62.50 f2.76 e1.77 f25.21 c26.81 b23.11 d
F70.87 g0.76 f1.13 g12.80 f10.54 f11.93 f
SED0.040.050.030.130.110.14
Results are presented as the mean. Means within a column followed by different letters indicate significant differences; (Tukey-Kramer’s HSD for α = 0.05) SED: standard error of the difference between means. F1–7: fraction1–7.
Table 2. β-glucans, arabinoxylans and tocols contents in whole barley flours.
KamalamaiHindukuschAnnapurna
β-glucans (g/100 g)8.41 ± 0.09 b8.26 ± 0.07 b9.46 ± 0.10 a
Arabinoxylans (g/100 g)5.52 ± 0.27 b6.60 ± 0.44 a5.52 ± 0.19 b
α-Tocopherol (µg/g)8.32 ± 0.21 a7.53 ± 0.22 a6.22 ± 0.19 b
β-Tocopherol (µg/g)0.03 ± 0.01 a0.03 ± 0.01 a0.03 ± 0.01 a
γ-Tocopherol (µg/g)1.58 ± 0.00 a1.08 ± 0.01 c1.21 ± 0.01 b
δ-Tocopherol (µg/g)0.03 ± 0.00 a0.02 ± 0.00 c0.03 ± 0.00 b
Total Tocopherol (µg/g)9.97 ± 0.05 a8.66 ± 0.06 b7.49 ± 0.05 c
α-Tocotrienol (µg/g)17.03 ± 0.42 b20.06 ± 0.90 a18.84 ± 0.23 a,b
β-Tocotrienol (µg/g)2.05 ± 0.00 b3.93 ± 0.15 a3.61 ± 0.04 a
γ-Tocotrienol (µg/g)9.06 ± 0.20 a9.05 ± 0.46 a5.63 ± 0.03 b
δ-Tocotrienol (µg/g)2.07 ± 0.02 b2.72 ± 0.07 a2.19 ± 0.03 b
Total Tocotrienol (µg/g)30.21 ± 0.16 b35.77 ± 0.40 a30.27 ± 0.08 b
Total Tocols (µg/g)40.18 ± 0.81 a,b44.43 ± 0.82 a37.77 ± 0.81 b
Results are presented as the mean ± standard error of the mean. Means within rows followed by different letters indicate significant differences; (Tukey-Kramer’s HSD for α = 0.05).
Table 3. Phenolic compounds contents (µg/g) in whole barley flours.
KamalamaiHindukuschAnnapurna
Flavan-3-ols500.7 ± 33.2 a272.3 ± 12.8 b320.7 ± 14.6 b
Free phenolic acids81.1 ± 6.1 a70.6 ± 2.3 a,b59.6 ± 2.3 b
Free flavones glycosides18.4 ± 0.5 b26.0 ± 0.4 a9.0 ± 0.2 c
Total free600.2 ± 30.9 a368.8 ± 14.8 b389.3 ± 12.2 b
Bound phenolic acids1092.1 ± 113.4 a,b1192.6 ± 215.6 a779.5 ± 32.9 b
Bound flavones glycosides1.9 ± 0.1 a1.8 ± 0.0 a1.8 ± 0.0 a
Total bound1093.9 ± 113.5 a,b1194.4 ± 215.6 a781.3 ± 32.9 b
Total phenols1694.1 ± 117.4 a1563.2 ± 211.5 a,b1038.6 ± 36.7 b
Results are presented as the mean ± standard error of the mean. Means within rows followed by different letters indicate significant differences; (Tukey-Kramer’s HSD for α = 0.05).
Table 4. Free phenolic compounds contents in barley pearling fractions.
Flavan-3-ols (µg/g)Phenolic Acids (µg/g) Flavones Glycosides (µg/g)
CatCat-gPc B3Pd B4GallicFerulicDC diFp-Cmp-OHBOHB2,4- diOHBVanillCaffSyringCinnaAp gIsosc gIsosc rIsoorIsov gIsov g-gIsov r
Kamalamai
F153 d102 b374 c312 c35.9 a27.1 a1.1 a25.7 a21.5 a10.9 a 16.9 a78.4 a11.6 b23.3 a12.8 a13.8 a13.4 a,b8.3 a7.3 a0.2 d1.7 a1.8 a
F296 c173 a662 a536 b37.0 a20.0 a1.1 a17.2 a16.5 b10.8 a14.5 b48.1 b12.8 a17.2 b11.5 b10.0 b14.7 a8.1 a7.1 a,b0.2 c,d1.7 a1.1 a,b
F3125 a,b194 a740 a644 a39.8 a12.8 b-6.6 b12.8 c--14.6 c12.6 a10.6 c-3.4 c10.4 d,e7.2 b6.6 b0.4 b,c0.3 b0.7 b,c
F4143 a125 b434 b322 c38.8 a7.2 c-3.5 b,c11.3 d--8.3 d-8.3 d-1.4 d11.4 c,d7.1 b6.7 a,b0.7 a-0.4 c
F5121 a,b76 c264 d192 d37.4 a7.0 c,d-3.1 b,c11.1 d--8.6 d-8.3 d-1.0 e12.8 b,c7.0 b6.9 a,b0.7 a-0.4 c
F6104 b,c56 d202 e134 e28.3 b5.3 d,e-2.7 c10.9 d--7.0 d-7.5 d-0.7 f12.3 b,c6.9 b7.0 a,b0.5 a,b-0.4 c
F773 d19 e61 f36 f18.0 c4.1 e-0.4 d1.5 e--2.5 e-1.1 e-0.1 g9.5 e1.0 c1.0 c0.1 e-0.1 d
SED0.10.10.10.10.10.10.10.30.030.10.40.10.20.10.10.10.040.020.030.20.10.2
Hindukusch
F134 c53 b227 b385 b24.1 a,b24.6 a1.9 a14.2 a21.8 a15.540.6 a58.4 a11.7 a15.0 a-11.3 a8.3 b9.1 a7.7 a1.5 a-2.2 a
F248 a,b100 a359 a612 a27.8 a,b14.3 b1.1 b5.9 b18.8 b-31.3 b44.7 b10.8 b11.4 b-7.2 b8.4 b9.1 a7.4 a,b2.1 a-2.0 a,b
F358 a101 a349 a544 a29.5 a,b10.2 c0.7 c3.7 b,c16.5 c-21.7 c36.2 c10.5 b9.4 c-4.3 c8.3 b8.0 b7.0 b,c1.5 a-1.3 b,c
F446 b56 b235 b316 c31.1 a7.8 d-3.0 c,d15.3 d-15.9 d28.8 d-8.4 c,d-2.1 d7.5 c7.5 b,c6.9 c0.8 b-0.9 c,d
F533 c24 c107 c129 d32.6 a6.2 d-1.9 d,e14.1 e-14.1 d23.5 e-7.9 d-1.2 e8.7 b7.3 c6.9 c0.6 b,c-0.7 d
F627 c14 d49 d48 e20.5 b,c4.4 e-1.1 e13.1 e-1.9 e17.2 f-7.6 d-0.6 f9.5 a7.1 c6.9 c0.3 c-0.3 e
F716 d2 d13 e8 f16.1 c3.5 f--10.5 f--5.9 g-0.1 e-0.1 g8.3 b1.0 d1.0 d0.1 d-0.03 f
SED0.10.10.030.10.10.10.10.20.020.10.10.10.20.04 0.10.030.020.020.2 0.2
Annapurna
F191 b349 a927 a554 a25.4 a11.9 a-4.5 a12.4 a--25.8 a11.3 a11.7 a12.1 a3.7 a10.7 a8.5 a-0.2 b,c-1.0 a
F285 c 245 a601 b339 a,b24.1 a8.1 b-2.2 b10.9 b--16.9 a,b10.3 b9.2 b11.4 a,b1.4 b8.7 d7.2 b-0.3 a,b-0.5 b
F391 b,c139 b302 c164 b22.3 a6.1 b,c-1.8 b,c10.9 b--12.5 b-7.9 c10.9 b0.5 c9.0 c,d7.0 b-0.3 a,b-0.2 c
F4105 a79 c156 d71 c21.3 a4.7 c,d,e-1.8 b,c10.7 b--6.5 c-7.3 c-0.4 c,d9.7 b,c--0.4 a,b-0.2 c
F590 b,c53 c108 e49 c21.0 a5.2 c,d-1.6 c10.2 b,c--6.4 c-7.1 c-0.4 c,d11.3 a--0.5 a-0.2 c
F689 b,c29 d55 f20 d22.2 a,b3.6 e--10.3 b,c--4.3 c-7.1 c-0.2 d10.6 a,b--0.1 c--
F751 d15 e30 g15 d16.4 b4.2 d,e--9.8 c--2.2 d-1.0 d--7.7 e-----
SED0.10.10.10.20.10.1 0.10.02 0.10.10.030.30.20.030.01 0.2 0.1
Results are presented as the mean. Means within a column followed by different letters indicate significant differences on log-transformed data; (Tukey-Kramer’s HSD for α = 0.05). SED: standard error of the difference between means. Cat: Catechin, Cat-g: Catechin-glucoside, Pc B3: Procyanidin B3, Pd B4: Prodelphinidin B4, DCDiF: Decarboxylated diferulic acid, p-Cm: p-coumaric acid, p-OHB: p-hydroxybenzoic acid, OHB: m- or o-hydroxybenzoic acid, 2,4-diOHB: 2,4-dihydroxyenzoic acid, Vanill: Vanillic acid, Caff: Caffeic acid, Syring: Syringic acid, Cinna: Cinnamic acid, Ag g: Apigenin 6-C-arabinoside 8-C-glucoside, Isosc g: Isoscoparin 7-glucoside, Isosc r: Isoscoparin 7-rutinoside, Isoor: Isoorientin, Isov g: Isovitexin 7-glucoside, Isov g-g: Isovitexin 7-(6’’’-sinapoylglucoside) 4’-glucoside, Isov r: Isovitexin 7-rutinoside.—Not detected.
Table 5. Bound phenolic compounds contents (µg/g) in barley pearling fractions.
Phenolic Acids (µg/g)Flavones Glycosides (µg/g)
FerulicisoFDiFTriFDC DiFTHF DiF p-Cmm-Cmp-OHBOHB2,4-diOHBVanillic Caffeic SyringicSinapic CinnaAg gIsosc-gIsosc rIsov g
Kamalamai
F11367 a17 b,c330 a21.2 a34.3 a5.5 a978 a21.3 a22.8 a3.0 c3.5 b,c117 a5.1 c19.6 a14.1 a,b3.8 d1.6 a1.7 d-0.05 b
F21260 a15 b,c165 b15.8 a18.2 b1.9 b523 b8.1 b15.3 b4.6 a,b4.2 b78 b7.2 b15.9 a20.3 a5.5 a1.1 a2.4 a-0.09 a
F31184 a15 b,c151 b31.7 a3.0 c-182 c3.5 c11.1 c4.9 a,b6.0 a44 c16.1 a9.4 b21.1 a5.9 a0.2 b2.1 b--
F4804 b20 b69 c3.8 b1.1 d-65 d2.2 c,d6.8 d4.8 a,b2.8 c18 d3.9 c,d4.9 c11.2 b,c4.5 b0.1 c2.0 b,c--
F5833 b32 a70 c2.2 b0.9 d,e-53 d,e3.4 c6.6 d5.4 a-17 d3.8 c,d4.4 c10.0 b,c4.4 b,c0.1 c2.1 b,c--
F6575 c14 c46 d2.5 b0.7 e-38 e1.6 d5.1 e4.2 b-11 e2.8 d3.3 d7.1 c3.9 c,d0.1 c1.9 c--
F7206 d6 d17 e1.8 b0.1 f-14 f0.9 e3.3 f4.3 b-4 f0.4 e2.1 e1.1 d3.1 e0.01 d0.3 e--
SED0.10.10.10.30.10.10.10.20.10.30.30.10.10.10.20.040.30.03 0.01
Hindukusch
F12030 a16 b,c342 a29.5 a18.7 a1.9 a939 a12.1 a45.8 a4.7 a37.3 a,b128 a5.2 b,c14.7 a44.1 a,b5.3 b0.8 a2.0 a1.7 a0.2 a
F22237 a20 a,b374 a26.2 a9.2 b0.6 b355 b3.7 b48.0 a5.3 a77.5 a135 a6.8 a,b11.5 a,b57.4 a6.3 a0.3 b2.0 a,b1.7 a0.1 b
F31968 a25 a,b309 a23.1 a5.8 b-154 c1.7 c33.3 b5.3 a63.9 a99 a,b8.7 a10.3 b,c47.9 a,b5.6 a,b0.2 b1.8 b,c1.6 a0.1 b
F41643 a30 a204 b10.1 b3.0 c-111 c1.5 c22.5 c5.7 a26.3 b69 b4.4 c8.4 c32.1 b5.0 b0.1 c1.7 c1.6 a0.1 b
F51130 b24 a,b114 c6.7 b,c1.9 c,d-53 d1.1 c13.8 d5.6 a7.4 c41 c3.1 d5.7 d17.1 c4.2 c0.1 c1.8 b,c1.1 a0.1 b
F6840 b25 a,b74 d4.2 c1.3 d-35 d1.3 c10.1 e5.3 a4.2 c29 c2.8 d4.4 d12.2 c3.7 c0.1 c1.9 a,b,c1.6 a0.04 c
F7353 c10 c24 e1.2 c0.2 e-9 e0.1 d5.3 f5.4 a3.3 c9 d0.4 e2.4 e1.1 d3.2 d-0.3 d--
SED0.10.20.10.20.70.10.20.20.10.40.20.10.10.10.20.040.20.030.010.2
Annapurna
F11850 a15 b,c262 a28.5 a5.2 a0.30169 a1.7 a11.1 a4.6 a,b-43 a5.9 a,b10.2 a42.0 a6.3 a0.2 a2.3 a--
F21697 a16 b,c179 b13.3 b1.6 b-78 b0.8 b8.7 b4.9 a-26 b11.7 a7.2 b27.9 b5.1 b0.1 b2.2 a,b--
F31323 b19 a,b109 c3.8 c0.9 c-37 c0.6 b,c6.7 c4.6 a,b-16 c3.6 b5.2 c15.4 c4.4 b-2.1 b,c--
F4968 c25 a69 d3.1 c,d1.0 c-21 d0.5 b,c4.9 d4.3 b,c-9 d2.8 b3.5 d8.3 d3.5 c-2.0 c,d--
F5809 d20 a,b58 d2.1 d,e2.3 b-20 d0.5 b,c4.1 e4.0 c-7 d,e2.7 b2.8 e5.4 e3.4 c,d-1.9 d--
F6623 e14 c42 e2.3 d2.1 b-15 d0.5 b,c3.9 e4.3 b,c-6 e2.6 b2.5 e4.1 e3.3 c,d-1.9 d--
F7259 f6 d18 f1.4 e0.1 d-7 e0.4 c3.1 f4.1 c-3 f-1.9 f-2.9 d----
SED0.10.10.10.10.10.00.10.20.040.1 0.10.30.10.10.10.10.02
Results are presented as the mean. Means within a column followed by different letters indicate significant differences on log-transformed data; (Tukey-Kramer’s HSD for α = 0.05). SED: standard error of the difference between means. iso-F: isoferulic, DiF: Diferulic acid, TriF: Triferulic acid, DC DiF: Decarboxylated diferulic acid, DiF THF: Diferulic tetrahydrofuran, p-Cm: p-Coumaric acid, m-Cm: m-Coumaric acid, p-OHB: p--hydroxybenzoic acid, OHB: m- or o-hydroxybenzoic acid, 2,4DiOHB: 2,4-dihydroxyenzoic acid, Cinna: Cinnamic acid, Ag-g: Apigenin 6-C-arabinoside 8-C-glucoside, Isosc g: Isoscoparin 7-glucoside, Isosc r: Isoscoparin 7-rutinoside, Isov g: Isovitexin 7-glucoside.—Not detected.
Table 6. Anthocyanins contents (µg/g) in barley pearling fractions.
PelagonidinsCyanidinsPeonidinsDelphinidins Petunidins Malvinidins Total Anthocyanins
Hindukusch
F141.0 a285.3 a5.87 b17.8 a3.42 a1.15 a354.5 a
F250.0 a366.3 a21.59 a20.3 a2.01 a1.29 a461.2 a
F325.0 b188.6 b0.45 b,c12.6 b1.50 a,b1.06 a229.2 b
F49.6 c72.5 c0.25 b,c6.4 c0.89 a,b0.61 a,b90.2 c
F54.6 d32.8 d0.17 b,c,d3.4 d0.59 b,c0.40 a,b,c42.0 d
F62.7 e19.3 e0.10 c,d2.1 e0.20 c0.30 b,c24.7 e
F71.1 f7.0 f0.02 d0.7 f0.04 d0.14 c9.0 f
SED0.10.10.70.10.30.30.1
Results are presented as the mean. Means within a column followed by different letters indicate significant differences on log-transformed data; (Tukey-Kramer’s HSD for α = 0.05). SED: standard error of the difference between means.
Table 7. Antioxidant Capacity (µmol Trolox/g) of whole barley flours.
KamalamaiHindukuschAnnapurna
Free AC70.7 ± 1.3 a61.9 ± 0.2 b45.6 ± 0.9 c
Bound AC39.5 ± 2.4 b57.4 ± 3.3 a28.1 ± 0.9 c
Total AC110.2 ± 1.1 a119.3 ± 3.5 a74.0 ± 1.8 b
Results are presented as the mean ± standard error of the mean. Means within a rows followed by different letters indicate significant differences; (Tukey-Kramer’s HSD for α = 0.05).
Publisher’s Note: MDPI stays neutral with regard to jurisdictional claims in published maps and institutional affiliations.

