
Potential of Flow Cytometric Approaches for Rapid Microbial Detection and Characterization in the Food Industry—A Review

 ,
,  and
and
Abstract
1. Introduction
2. Microbial Habitats and Detection Targets within the Food Industry and Bioindustry
2.1. Water
2.2. Air and Aerosols
2.3. Abiotic and Biotic Surfaces
3. Non-Specific State-of-the-Art Flow Cytometric Applications for Detection and Monitoring
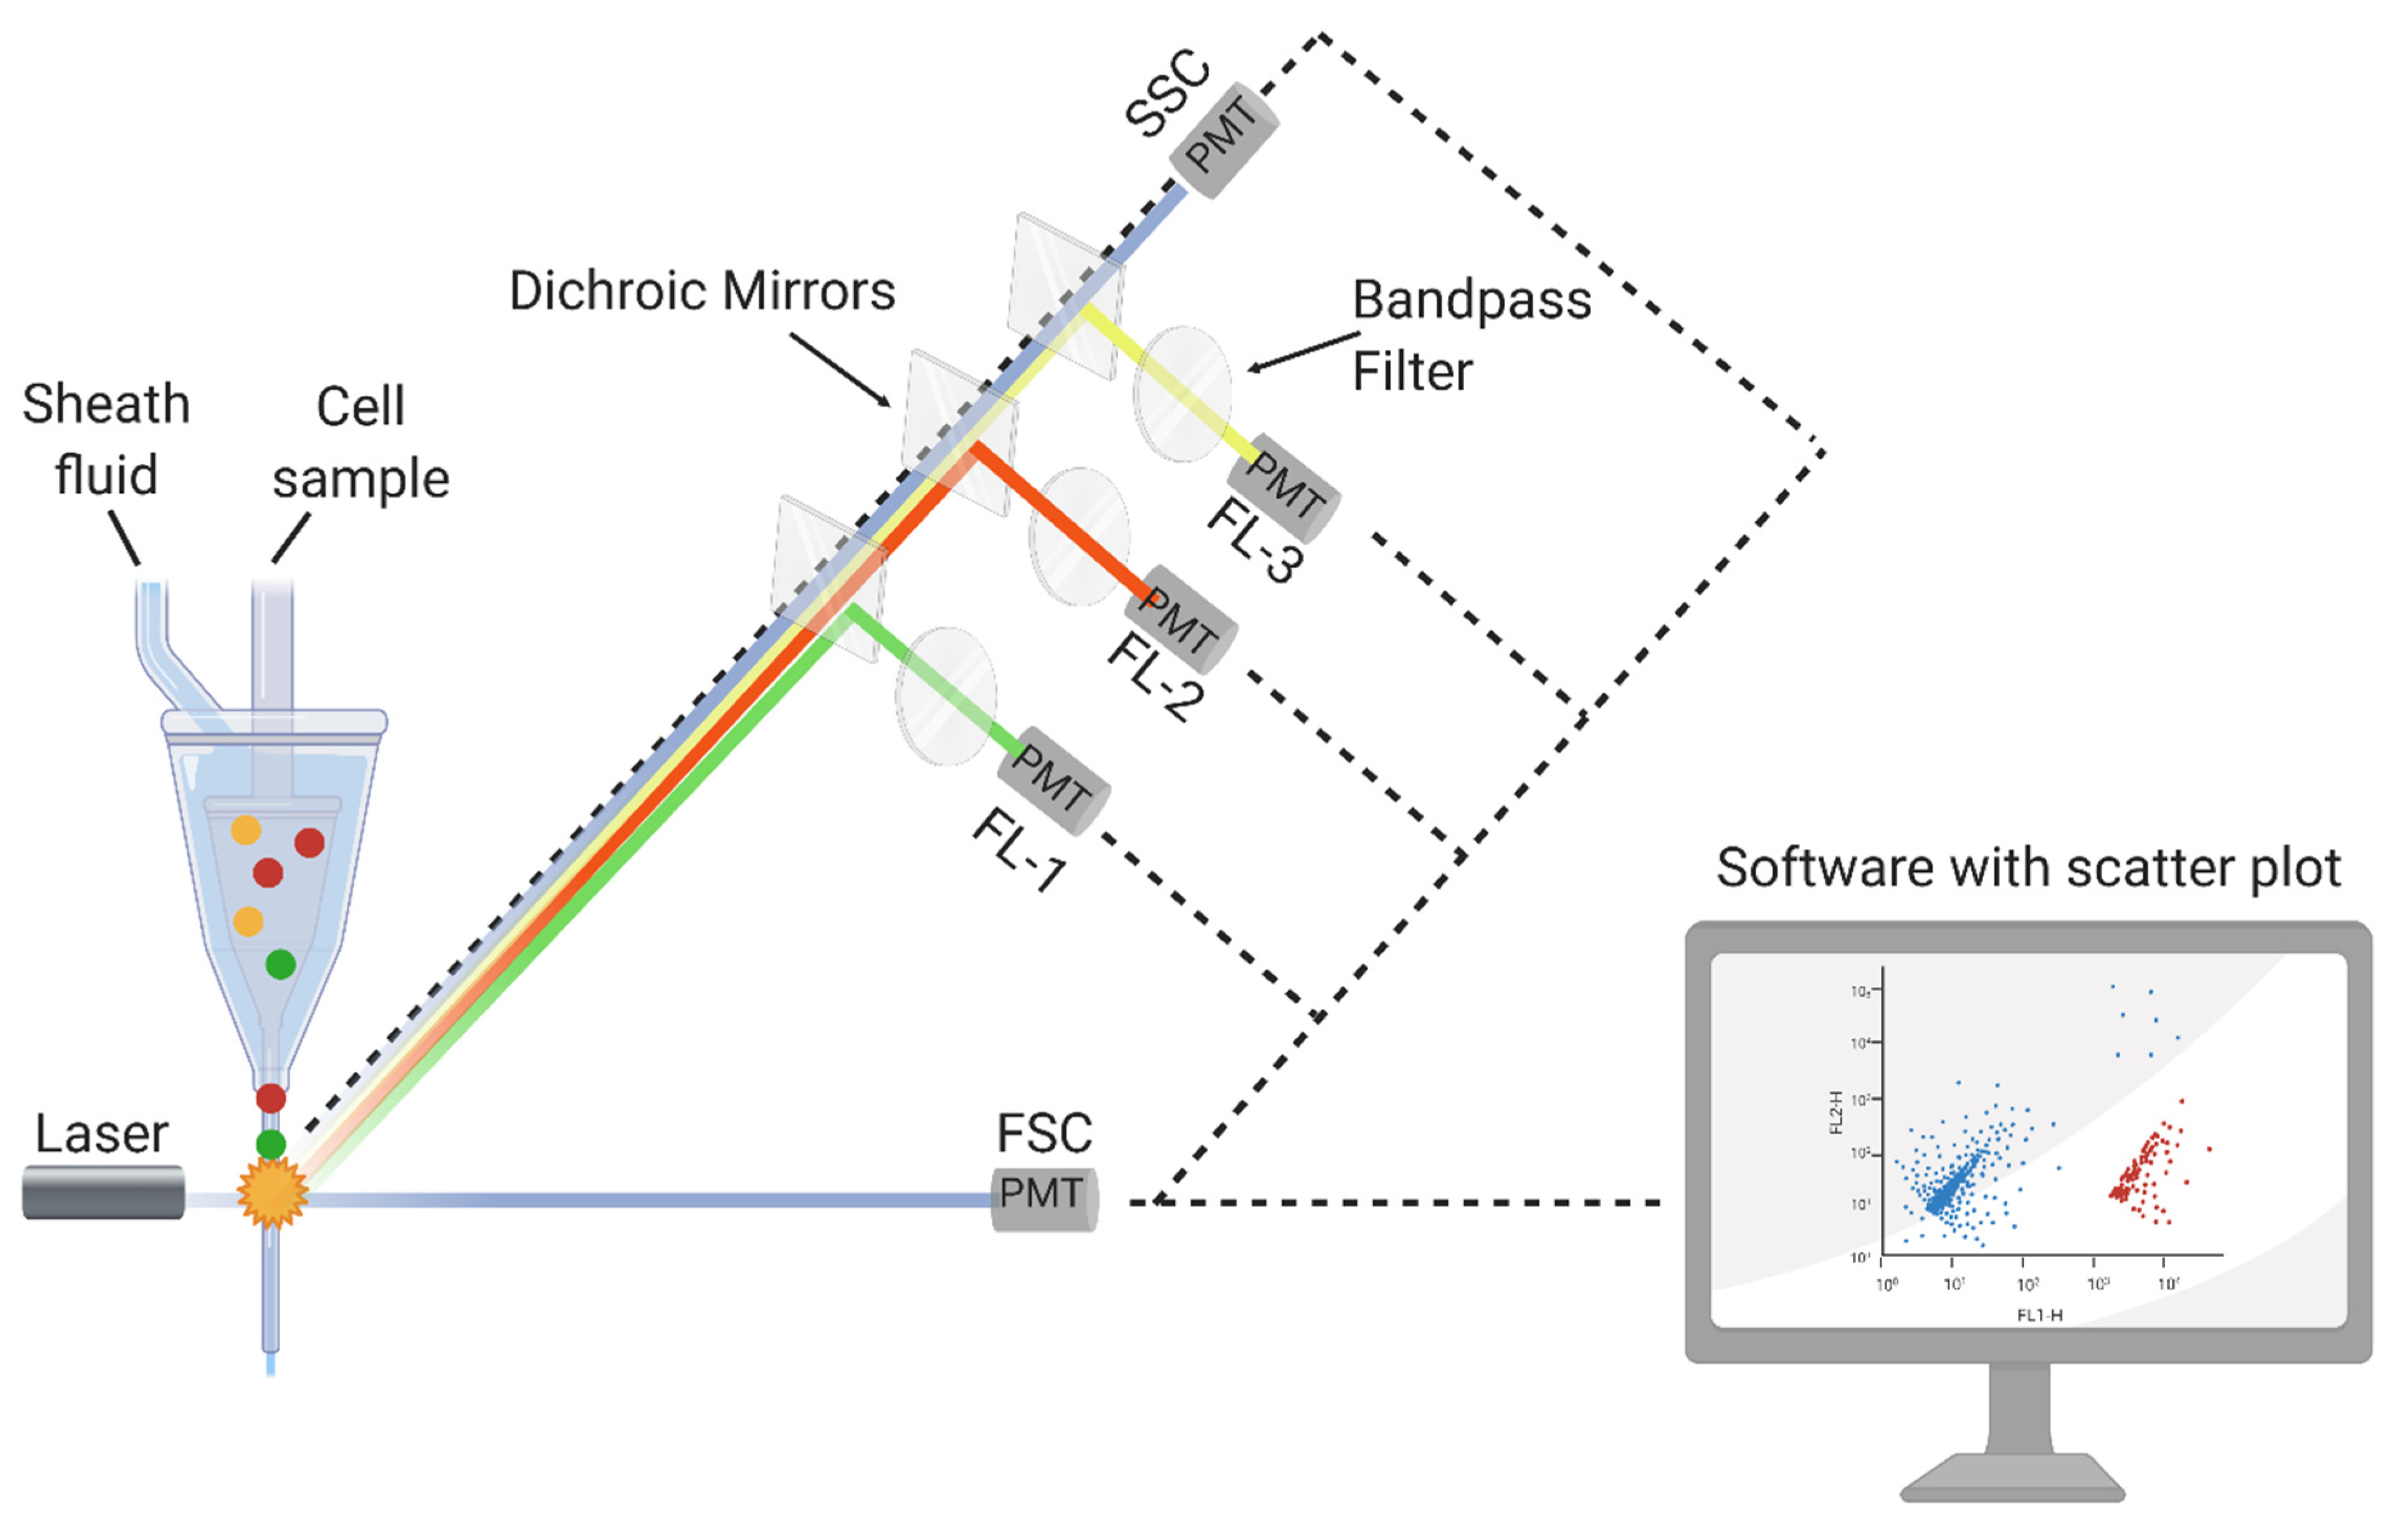
3.1. FCM Principle and Detection Mechanisms
3.2. Food-Related FCM Applications
3.3. Water and Bioaerosol FCM Applications
4. Specific State-of-the-Art Flow-FISH Methods and Applications for Monitoring and Detection
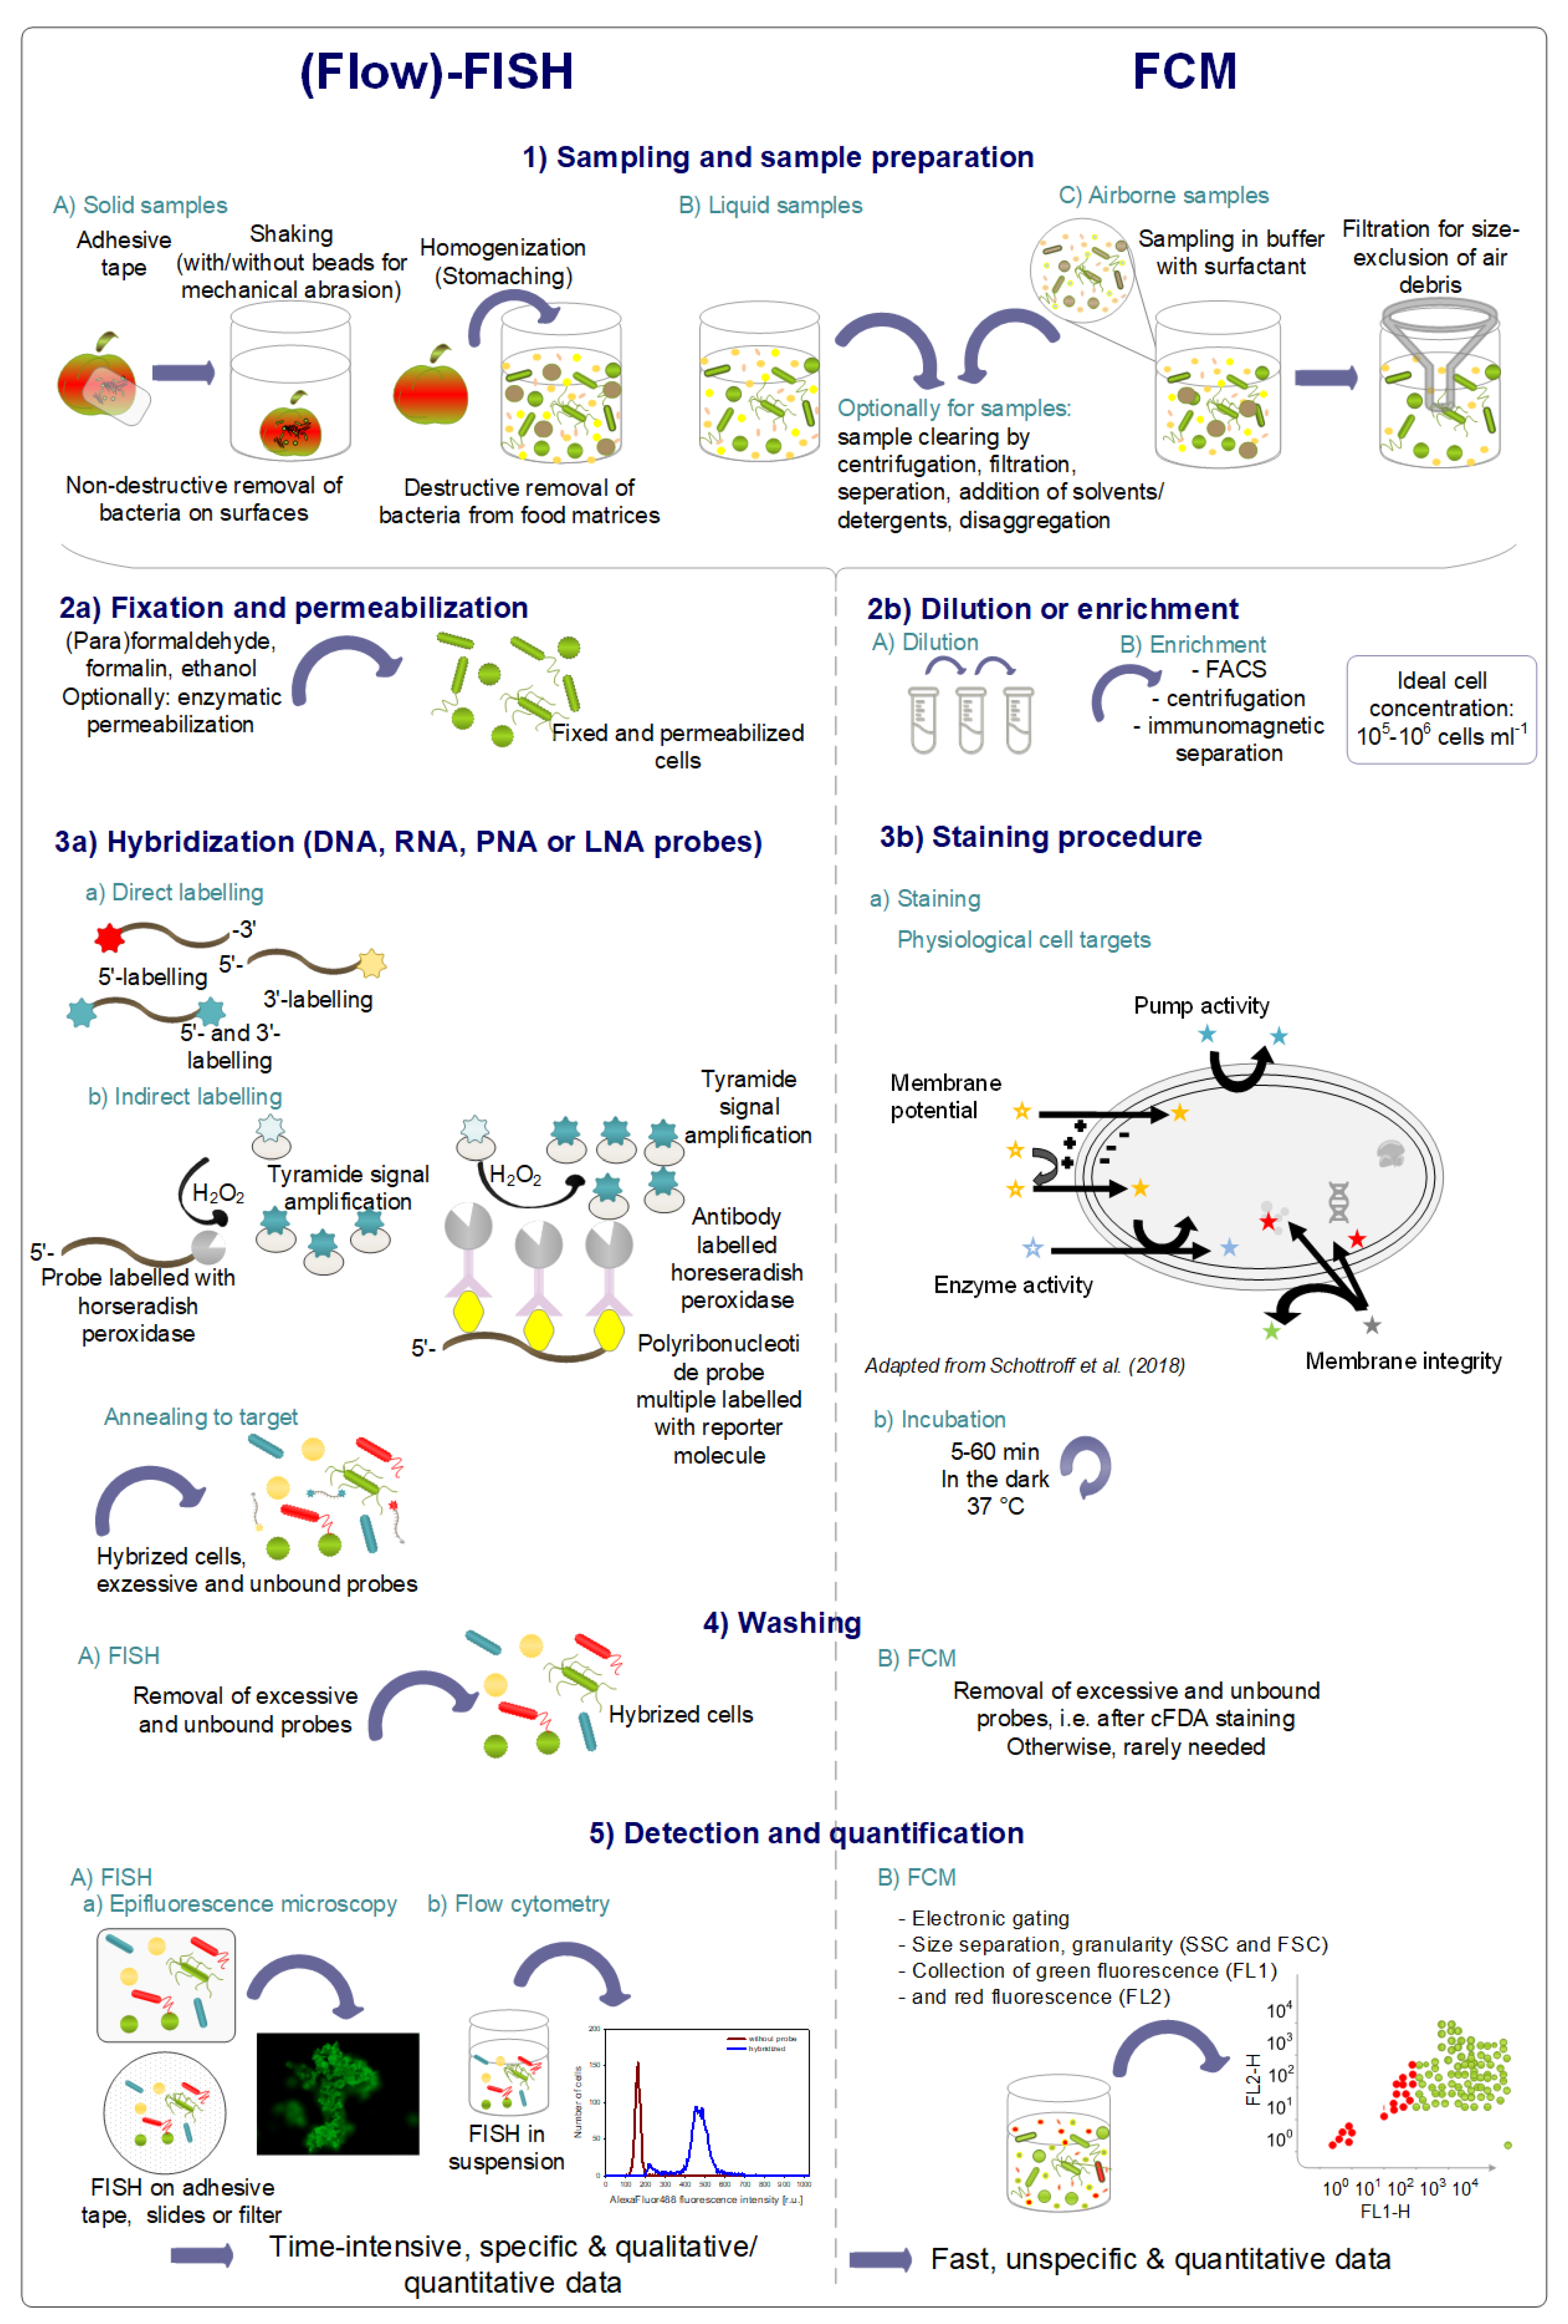
4.1. Principle of FISH
4.2. Flow-FISH in Food Microbiology
4.3. Flow-FISH in Water and Bioaerosols
5. General and Food-Related Limitations for Specific and Non-Specific Methods
5.1. Instrumental Limitations
5.2. Hazardous and Toxic Substances for FCM and FISH Applications
5.3. Limitations of Traditional Flow-FISH Protocols
5.4. Interference with Food Matrices
5.5. Challenges for Rapid Bioaerosol Detection
6. Strategies to Overcome Limitations and to Improve Detection Methods
6.1. Alternative Non-Hazardous Stains and Solvents to Improve Safety
6.2. PEF-Assisted FCM and Flow-FISH Approaches
6.3. Optimized Flow-FISH Concepts
6.4. Improvements of FCM-Based Bioaerosol Detection
7. Conclusions and Future Research Needs
Author Contributions
Funding
Institutional Review Board Statement
Informed Consent Statement
Conflicts of Interest
Nomenclature
| CARD | Catalyzed reporter deposition |
| CTC | 5-cyano-2,3-ditolyl tetrazolium chloride |
| cFDA | Arboxyfluorescein diacetate |
| DiOC2(3) | 3,3′-Diethyloxacarbocyanine Iodide |
| DiBA-C4(3) | Bis-(1,3-Dibutylbarbituric Acid)Trimethine Oxonol |
| DPH | 1,6-Diphenyl-1,3,5-hexatriene |
| DOPE | Double Labeling of Oligonucleotide Probes |
| ICC | Intact cell count |
| ELISA | Enzyme-linked immunosorbent assay |
| EtBr | Ethidium bromide |
| FCM | Flow cytometry |
| FISH | Fluorescence in situ hybridization |
| FFS | Forward scatter |
| FDA | Fluorescin diacetate |
| FACS | Fluorescence-activated cell sorters |
| HCR | Hybridization chain reaction |
| LNA | Locked nucleic acids |
| PNA | Peptide nucleic acids |
| PCR | Polymerase chain reaction |
| PD | Photodiodes |
| PMT | Photomultiplier tubes |
| PI | Propidium iodide |
| PEF | Pulsed electric fields |
| SSC | Side scatter |
| SG1 | SYBR® Green |
| TO | Thiazole orange |
| TCC | Total cell count |
| VBNC | Viable but non-culturable |
References
- Rohde, A.; Hammerl, J.A.; Appel, B.; Dieckmann, R.; Al Dahouk, S. FISHing for bacteria in food—A promising tool for the reliable detection of pathogenic bacteria? Food Microbiol. 2015, 46, 395–407. [Google Scholar] [CrossRef]
- Havelaar, A.H.; Brul, S.; De Jong, A.; De Jonge, R.; Zwietering, M.H.; Ter Kuile, B.H. Future challenges to microbial food safety. Int. J. Food Microbiol. 2010, 139, S79–S94. [Google Scholar] [CrossRef]
- Juzwa, W.; Duber, A.; Myszka, K.; Bialas, W.; Czaczyk, K. Identification of microbes from the surfaces of food-processing lines based on the flow cytometric evaluation of cellular metabolic activity combined with cell sorting. Biofouling 2016, 32, 841–851. [Google Scholar] [CrossRef]
- Lelieveld, H.L.M.; Holah, J.; Gabric, D. Handbook of Hygiene Control in the Food Industry; Elsevier Science: Amsterdam, The Netherlands, 2016. [Google Scholar]
- Wang, R. Biofilms and meat safety: A mini-review. J. Food Prot. 2019, 82, 120–127. [Google Scholar] [CrossRef]
- Weber, M.; Liedtke, J.; Plattes, S.; Lipski, A. Bacterial community composition of biofilms in milking machines of two dairy farms assessed by a combination of culture-dependent and –independent methods. PLoS ONE 2019, 14, e0222238. [Google Scholar] [CrossRef]
- Hameed, S.; Xie, L.; Ying, Y. Conventional and emerging detection techniques for pathogenic bacteria in food science: A review. Trends Food Sci. Technol. 2018, 81, 61–73. [Google Scholar] [CrossRef]
- Marušić, A. Food safety and security: What were favourite topics for research in the last decade? J. Glob. Health 2011, 1, 72–78. [Google Scholar] [PubMed]
- Pepe, T.; De Dominicis, R.; Esposito, G.; Ventrone, I.; Fratamico, P.M.; Cortesi, M.L. Detection of Campylobacter from poultry carcass skin samples at slaughter in Southern Italy. J. Food Prot. 2009, 72, 1718–1721. [Google Scholar] [CrossRef]
- Rohde, A.; Hammerl, J.A.; Al Dahouk, S. Detection of foodborne bacterial zoonoses by fluorescence in situ hybridization. Food Control 2016, 69, 297–305. [Google Scholar] [CrossRef]
- WHO. WHO Estimates of the Global Burden of Foodborne Diseases: Foodborne Disease Burden Epidemiology Reference Group 2007–2015; World Health Organization: Geneva, Switzerland, 2015. [Google Scholar]
- Ge, B.; Meng, J. Advanced technologies for pathogen and toxin detection in foods: Current applications and future directions. JALA J. Assoc. Lab. Autom. 2009, 14, 235–241. [Google Scholar] [CrossRef]
- Rajapaksha, P.; Elbourne, A.; Gangadoo, S.; Brown, R.; Cozzolino, D.; Chapman, J. A review of methods for the detection of pathogenic microorganisms. Analyst 2019, 144, 396–411. [Google Scholar] [CrossRef] [PubMed]
- Velusamy, V.; Arshak, K.; Korostynska, O.; Oliwa, K.; Adley, C. An overview of foodborne pathogen detection: In the perspective of biosensors. Biotechnol. Adv. 2010, 28, 232–254. [Google Scholar] [CrossRef] [PubMed]
- Ricke, S.C.; Feye, K.M.; Chaney, W.E.; Shi, Z.; Pavlidis, H.; Yang, Y. Developments in rapid detection methods for the detection of foodborne campylobacterin the United States. Front. Microbiol. 2019, 10, 3280. [Google Scholar] [CrossRef] [PubMed]
- Wei, Q.Y.; Wang, X.M.; Sun, D.W.; Pu, H.B. Rapid detection and control of psychrotrophic microorganisms in cold storage foods: A review. Trends Food Sci. Technol. 2019, 86, 453–464. [Google Scholar] [CrossRef]
- Safford, H.R.; Bischel, H.N. Flow cytometry applications in water treatment, distribution, and reuse: A review. Water Res. 2019, 151, 110–133. [Google Scholar] [CrossRef]
- Kennedy, D.; Wilkinson, M.G. Application of flow cytometry to the detection of pathogenic bacteria. Curr. Issues Mol. Biol. 2017, 23, 21–38. [Google Scholar] [CrossRef]
- Dias, G.; Rathnayaka, U. Fluorescence in situ hybridization (FISH) in food pathogen detection. Int. J. Mol. Biol. 2018, 3, 143–149. [Google Scholar] [CrossRef]
- Law, J.W.-F.; Ab Mutalib, N.-S.; Chan, K.-G.; Lee, L.-H. Rapid methods for the detection of foodborne bacterial pathogens: Principles, applications, advantages and limitations. Front. Microbiol. 2015, 5, 770. [Google Scholar] [CrossRef]
- Beneduce, L.; Gatta, G.; Bevilacqua, A.; Libutti, A.; Tarantino, E.; Bellucci, M.; Troiano, E.; Spano, G. Impact of the reusing of food manufacturing wastewater for irrigation in a closed system on the microbiological quality of the food crops. Int. J. Food Microbiol. 2017, 260, 51–58. [Google Scholar] [CrossRef]
- Dzieciol, M.; Schornsteiner, E.; Muhterem-Uyar, M.; Stessl, B.; Wagner, M.; Schmitz-Esser, S. Bacterial diversity of floor drain biofilms and drain waters in a Listeria monocytogenes contaminated food processing environment. Int. J. Food Microbiol. 2016, 223, 33–40. [Google Scholar] [CrossRef] [PubMed]
- Magaña, S.; Schlemmer, S.M.; Davidson, G.R.; Ryser, E.T.; Lim, D.V. Laboratory and pilot-scale dead-end ultrafiltration concentration of sanitizer-free and chlorinated lettuce wash water for improved detection of Escherichia coli O157:H7. J. Food Prot. 2014, 77, 1260–1268. [Google Scholar] [CrossRef]
- Wagner, M.; Stessl, B. Sampling the food processing environment: Taking up the cudgel for preventive quality management in food processing environments. In Listeria Monocytogenes. Methods in Molecular Biology (Methods and Protocols); Jordan, K.F.E., Wagner, M., Eds.; Springer: Berlin/Heidelberg, Germany, 2014; Volume 1157, pp. 275–283. [Google Scholar]
- Berrang, M.E.; Frank, J.F. Generation of airborne Listeria innocua from model floor drains. J. Food Prot. 2012, 75, 1328–1331. [Google Scholar] [CrossRef] [PubMed]
- Brown, K.; Wray, S. Control of airborne contamination in food processing. In Hygiene in Food Processing; Elsevier: Amsterdam, The Netherlands, 2014; pp. 174–202. [Google Scholar]
- Faille, C.; Cunault, C.; Dubois, T.; Bénézech, T. Hygienic design of food processing lines to mitigate the risk of bacterial food contamination with respect to environmental concerns. Innov. Food Sci. Emerg. Technol. 2018, 46, 65–73. [Google Scholar] [CrossRef]
- Fink, R.; Oder, M.; Stražar, E.; Filip, S. Efficacy of cleaning methods for the removal of Bacillus cereus biofilm from polyurethane conveyor belts in bakeries. Food Control 2017, 80, 267–272. [Google Scholar] [CrossRef]
- Khatoon, Z.; McTiernan, C.D.; Suuronen, E.J.; Mah, T.-F.; Alarcon, E.I. Bacterial biofilm formation on implantable devices and approaches to its treatment and prevention. Heliyon 2018, 4, e01067. [Google Scholar] [CrossRef]
- Costerton, J.W. Bacterial biofilms: A common cause of persistent infections. Science 1999, 284, 1318–1322. [Google Scholar] [CrossRef] [PubMed]
- Silva, V.O.; Soares, L.O.; Silva Junior, A.; Mantovani, H.C.; Chang, Y.F.; Moreira, M.A.S. Biofilm formation on biotic and abiotic surfaces in the presence of antimicrobials by Escherichia coli isolates from cases of bovine mastitis. Appl. Environ. Microbiol. 2014, 80, 6136–6145. [Google Scholar] [CrossRef] [PubMed]
- Zand, E.; Pfanner, H.; Domig, K.J.; Sinn, G.; Zunabovic-Pichler, M.; Jaeger, H. Biofilm-Forming Ability of Microbacterium lacticum and Staphylococcus capitis Considering Physicochemical and Topographical Surface Properties. Foods 2021, 10, 611. [Google Scholar] [CrossRef] [PubMed]
- Rajwar, A.; Srivastava, P.; Sahgal, M. Microbiology of fresh produce: Route of contamination, detection methods, and remedy. Crit. Rev. Food Sci. Nutr. 2016, 56, 2383–2390. [Google Scholar] [CrossRef]
- Jacxsens, L.; Uyttendaele, M.; Luning, P.; Allende, A. Food safety management and risk assessment in the fresh produce supply chain. IOP Conf. Ser. Mater. Sci. Eng. 2017, 193, 012020. [Google Scholar] [CrossRef]
- Lopez-Galvez, F.; Gil, M.I.; Andujar, S.; Allende, A. Suitability of centrifuge water for detecting the presence of Escherichia coli versus finished fresh-cut lettuce testing. Food Microbiol. 2019, 84, 103271. [Google Scholar] [CrossRef] [PubMed]
- Comas-Riu, J.; Rius, N. Flow cytometry applications in the food industry. J. Ind. Microbiol. Biotechnol. 2009, 36, 999–1011. [Google Scholar] [CrossRef]
- Paparella, A.; Serio, A.; Chaves, C. Flow cytometry applications in food safety studies. Flow Cytom.-Recent Perspect. 2012, 69–102. [Google Scholar] [CrossRef]
- Veal, D.A.; Deere, D.; Ferrari, B.; Piper, J.; Attfield, P.V. Fluorescence staining and flow cytometry for monitoring microbial cells. J. Immunol. Methods 2000, 243, 191–210. [Google Scholar] [CrossRef]
- Wu, L.N.; Wang, S.; Song, Y.Y.; Wang, X.; Yan, X.M. Applications and challenges for single-bacteria analysis by flow cytometry. Sci. China-Chem. 2016, 59, 30–39. [Google Scholar] [CrossRef]
- Wilkinson, M.G. Flow cytometry as a potential method of measuring bacterial viability in probiotic products: A review. Trends Food Sci. Technol. 2018, 78, 1–10. [Google Scholar] [CrossRef]
- Díaz, M.; Herrero, M.; García, L.; Quirós, C. Application of flow cytometry to industrial microbial bioprocesses. Biochem. Eng. J. 2010, 48, 385–407. [Google Scholar] [CrossRef]
- Allegra, S.; Berger, F.; Berthelot, P.; Grattard, F.; Pozzetto, B.; Riffard, S. Use of Flow Cytometry To Monitor Legionella Viability. Appl. Environ. Microbiol. 2008, 74, 7813. [Google Scholar] [CrossRef] [PubMed]
- Nielsen, T.H.; Sjøholm, O.R.; Sørensen, J. Multiple physiological states of a Pseudomonas fluorescens DR54 biocontrol inoculant monitored by a new flow cytometry protocol. FEMS Microbiol. Ecol. 2009, 67, 479–490. [Google Scholar] [CrossRef]
- Carrillo, M.G.; Ferrario, M.; Guerrero, S. Effectiveness of UV-C light assisted by mild heat on Saccharomyces cerevisiae KE 162 inactivation in carrot-orange juice blend studied by flow cytometry and transmission electron microscopy. Food Microbiol. 2018, 73, 1–10. [Google Scholar] [CrossRef]
- Laflamme, C.; Lavigne, S.; Ho, J.; Duchaine, C. Assessment of bacterial endospore viability with fluorescent dyes. J. Appl. Microbiol. 2004, 96, 684–692. [Google Scholar] [CrossRef]
- Rault, A.; Bouix, M.; Béal, C. Fermentation pH Influences the Physiological-State Dynamics of Lactobacillus bulgaricus CFL1 during pH-Controlled Culture. Appl. Environ. Microbiol. 2009, 75, 4374–4381. [Google Scholar] [CrossRef] [PubMed]
- Tracy, B.P.; Gaida, S.M.; Papoutsakis, E.T. Flow cytometry for bacteria: Enabling metabolic engineering, synthetic biology and the elucidation of complex phenotypes. Curr. Opin. Biotechnol. 2010, 21, 85–99. [Google Scholar] [CrossRef] [PubMed]
- Bunthof, C.J.; van den Braak, S.; Breeuwer, P.; Rombouts, F.M.; Abee, T. Rapid Fluorescence Assessment of the Viability of Stressed Lactococcus lactis. Appl. Environ. Microbiol. 1999, 65, 3681–3689. [Google Scholar] [CrossRef]
- Favere, J.; Buysschaert, B.; Boon, N.; De Gusseme, B. Online microbial fingerprinting for quality management of drinking water: Full-scale event detection. Water Res. 2020, 170, 115353. [Google Scholar] [CrossRef]
- Winson, M.K.; Davey, H.M. Flow cytometric analysis of microorganisms. Methods 2000, 21, 231–240. [Google Scholar] [CrossRef] [PubMed]
- Liu, X.; Lendormi, T.; Le Fellic, M.; Lemée, Y.; Lanoisellé, J.-L. Hygienization of mixed animal by-product using pulsed electric field: Inactivation kinetics modeling and recovery of indicator bacteria. Chem. Eng. J. 2019, 368, 1–9. [Google Scholar] [CrossRef]
- Azevedo, N.F.; Jardim, T.; Almeida, C.; Cerqueira, L.; Almeida, A.J.; Rodrigues, F.; Keevil, C.W.; Vieira, M.J. Application of flow cytometry for the identification of Staphylococcus epidermidis by peptide nucleic acid fluorescence in situ hybridization (PNA FISH) in blood samples. Antonie Van Leeuwenhoek 2011, 100, 463–470. [Google Scholar] [CrossRef] [PubMed][Green Version]
- Kennedy, D.; Cronin, U.P.; Piterina, A.; Wilkinson, M.G. Heat and chemical treatments affect the viability, morphology, and physiology of Staphylococcus aureus and its subsequent antibody labeling for flow cytometric analysis. Appl. Environ. Microbiol. 2019, 85, e01006-19. [Google Scholar] [CrossRef]
- Barros, C.P.; Pires, R.P.S.; Guimarães, J.T.; Abud, Y.K.D.; Almada, C.N.; Pimentel, T.C.; Sant’Anna, C.; De-Melo, L.D.B.; Duarte, M.C.K.H.; Silva, M.C.; et al. Ohmic heating as a method of obtaining paraprobiotics: Impacts on cell structure and viability by flow cytometry. Food Res. Int. 2021, 140, 110061. [Google Scholar] [CrossRef]
- Braschi, G.; Patrignani, F.; Siroli, L.; Lanciotti, R.; Schlueter, O.; Froehling, A. Flow Cytometric Assessment of the Morphological and Physiological Changes of Listeria monocytogenes and Escherichia coli in Response to Natural Antimicrobial Exposure. Front. Microbiol. 2018, 9, 2783. [Google Scholar] [CrossRef]
- Fröhling, A.; Baier, M.; Ehlbeck, J.; Knorr, D.; Schlüter, O. Atmospheric pressure plasma treatment of Listeria innocua and Escherichia coli at polysaccharide surfaces: Inactivation kinetics and flow cytometric characterization. Innov. Food Sci. Emerg. Technol. 2012, 13, 142–150. [Google Scholar] [CrossRef]
- Fröhling, A.; Wienke, M.; Rose-Meierhofer, S.; Schlüter, O. Improved method for mastitis detection and evaluation of disinfectant efficiency during milking process. Food Bioprocess Technol. 2010, 3, 892–900. [Google Scholar] [CrossRef]
- Jaeger, H.; Schulz, A.; Karapetkov, N.; Knorr, D. Protective effect of milk constituents and sublethal injuries limiting process effectiveness during PEF inactivation of Lb. rhamnosus. Int. J. Food Microbiol. 2009, 134, 154–161. [Google Scholar] [CrossRef]
- Schenk, M.; Raffellini, S.; Guerrero, S.; Blanco, G.A.; Alzamora, S.M. Inactivation of Escherichia coli, Listeria innocua and Saccharomyces cerevisiae by UV-C light: Study of cell injury by flow cytometry. LWT-Food Sci. Technol. 2011, 44, 191–198. [Google Scholar] [CrossRef]
- Tamburini, S.; Ballarini, A.; Ferrentino, G.; Moro, A.; Foladori, P.; Spilimbergo, S.; Jousson, O. Comparison of quantitative PCR and flow cytometry as cellular viability methods to study bacterial membrane permeabilization following supercritical CO2 treatment. Microbiology 2013, 159, 1056–1066. [Google Scholar] [CrossRef]
- Teixeira, P.; Fernandes, B.; Silva, A.M.; Dias, N.; Azeredo, J. Evaluation by flow cytometry of Escherichia coli viability in lettuce after disinfection. Antibiotics 2020, 9, 14. [Google Scholar] [CrossRef] [PubMed]
- Zand, E.; Schottroff, F.; Steinacker, E.; Mae-Gano, J.; Schoenher, C.; Wimberger, T.; Wassermann, K.J.; Jaeger, H. Advantages and limitations of various treatment chamber designs for reversible and irreversible electroporation in life sciences. Bioelectrochemistry 2021, 141, 107841. [Google Scholar] [CrossRef] [PubMed]
- Fröhling, A.; Schlüter, O. Flow cytometric evaluation of physico-chemical impact on Gram-positive and Gram-negative bacteria. Front. Microbiol. 2015, 6, 939. [Google Scholar] [CrossRef]
- Khan, M.M.T.; Pyle, B.H.; Camper, A.K. Specific and Rapid Enumeration of Viable but Nonculturable and Viable-Culturable Gram-Negative Bacteria by Using Flow Cytometry. Appl. Environ. Microbiol. 2010, 76, 5088–5096. [Google Scholar] [CrossRef]
- Mao, C.; Xue, C.; Wang, X.; He, S.; Wu, L.; Yan, X. Rapid quantification of pathogenic Salmonella Typhimurium and total bacteria in eggs by nano-flow cytometry. Talanta 2020, 217, 121020. [Google Scholar] [CrossRef]
- Yu, M.X.; Wu, L.N.; Huang, T.X.; Wang, S.; Yan, X.M. Rapid detection and enumeration of total bacteria in drinking water and tea beverages using a laboratory-built high-sensitivity flow cytometer. Anal. Methods 2015, 7, 3072–3079. [Google Scholar] [CrossRef]
- Coronel-Leon, J.; Lopez, A.; Espuny, M.J.; Beltran, M.T.; Molinos-Gomez, A.; Rocabayera, X.; Manresa, A. Assessment of antimicrobial activity of N-alpha-lauroyl arginate ethylester (LAE (R)) against Yersinia enterocolitica and Lactobacillus plantarum by flow cytometry and transmission electron microscopy. Food Control 2016, 63, 1–10. [Google Scholar] [CrossRef]
- Barer, M.R.; Gribbon, L.T.; Harwood, C.R.; Nwoguh, C.E. The viable but non-culturable hypothesis and medical bacteriology. Rev. Med Microbiol. 1993, 4, 183–191. [Google Scholar] [CrossRef]
- Schottroff, F.; Fröhling, A.; Zunabovic-Pichler, M.; Krottenthaler, A.; Schlüter, O.; Jäger, H. Sublethal Injury and Viable but Non-culturable (VBNC) State in Microorganisms During Preservation of Food and Biological Materials by Non-thermal Processes. Front. Microbiol. 2018, 9, 2773. [Google Scholar] [CrossRef] [PubMed]
- Malacrinò, P.; Zapparoli, G.; Torriani, S.; Dellaglio, F. Rapid detection of viable yeasts and bacteria in wine by flow cytometry. J. Microbiol. Methods 2001, 45, 127–134. [Google Scholar] [CrossRef]
- Maukonen, J.; Alakomi, H.L.; Nohynek, L.; Hallamaa, K.; Leppamaki, S.; Matto, J.; Saarela, M. Suitability of the fluorescent techniques for the enumeration of probiotic bacteria in commercial non-dairy drinks and in pharmaceutical products. Food Res. Int. 2006, 39, 22–32. [Google Scholar] [CrossRef]
- Bunthof, C.J.; Abee, T. Development of a flow cytometric method to analyze subpopulations of bacteria in probiotic products and dairy starters. Appl. Environ. Microbiol. 2002, 68, 2934–2942. [Google Scholar] [CrossRef] [PubMed]
- Fröhling, A.; Durek, J.; Schnabel, U.; Ehlbeck, J.; Bolling, J.; Schlüter, O. Indirect plasma treatment of fresh pork: Decontamination efficiency and effects on quality attributes. Innov. Food Sci. Emerg. Technol. 2012, 16, 381–390. [Google Scholar] [CrossRef]
- Ma, Z.; Bumunang, E.W.; Stanford, K.; Bie, X.; Niu, Y.D.; McAllister, T.A. Biofilm formation by shiga toxin-producing Escherichia coli on stainless steel coupons as affected by temperature and incubation time. Microorganisms 2019, 7, 95. [Google Scholar] [CrossRef] [PubMed]
- Besmer, M.D.; Epting, J.; Page, R.M.; Sigrist, J.A.; Huggenberger, P.; Hammes, F. Online flow cytometry reveals microbial dynamics influenced by concurrent natural and operational events in groundwater used for drinking water treatment. Sci. Rep. 2016, 6, 38462. [Google Scholar] [CrossRef]
- Cao, R.; Wan, Q.; Tan, L.; Xu, X.; Wu, G.; Wang, J.; Xu, H.; Huang, T.; Wen, G. Evaluation of the vital viability and their application in fungal spores’ disinfection with flow cytometry. Chemosphere 2021, 269, 128700. [Google Scholar] [CrossRef] [PubMed]
- Day, J.P.; Kell, D.B.; Griffith, G.W. Differentiation of Phytophthora infestans sporangia from other airborne biological particles by flow cytometry. Appl. Environ. Microbiol. 2002, 68, 37–45. [Google Scholar] [CrossRef]
- Farhat, N.; Kim, L.H.; Vrouwenvelder, J.S. Online characterization of bacterial processes in drinking water systems. NPJ Clean Water 2020, 3, 16. [Google Scholar] [CrossRef]
- Koch, C.; Harnisch, F.; Schröder, U.; Müller, S. Cytometric fingerprints: Evaluation of new tools for analyzing microbial community dynamics. Front. Microbiol. 2014, 5, 273. [Google Scholar] [CrossRef] [PubMed]
- Lange, J.L.; Thorne, P.S.; Lynch, N. Application of flow cytometry and fluorescent in situ hybridization for assessment of exposures to airborne bacteria. Appl. Environ. Microbiol. 1997, 63, 1557–1563. [Google Scholar] [CrossRef]
- Prest, E.I.; Hammes, F.; Kotzsch, S.; van Loosdrecht, M.C.M.; Vrouwenvelder, J.S. Monitoring microbiological changes in drinking water systems using a fast and reproducible flow cytometric method. Water Res. 2013, 47, 7131–7142. [Google Scholar] [CrossRef]
- Ramseier, M.K.; von Gunten, U.; Freihofer, P.; Hammes, F. Kinetics of membrane damage to high (HNA) and low (LNA) nucleic acid bacterial clusters in drinking water by ozone, chlorine, chlorine dioxide, monochloramine, ferrate(VI), and permanganate. Water Res. 2011, 45, 1490–1500. [Google Scholar] [CrossRef]
- Zacharias, N.; Kistemann, T.; Schreiber, C. Application of flow cytometry and PMA-qPCR to distinguish between membrane intact and membrane compromised bacteria cells in an aquatic milieu. Int. J. Hyg. Environ. Health 2015, 218, 714–722. [Google Scholar] [CrossRef]
- Liang, X.; Soupir, M.L.; Rigby, S.; Jarboe, L.R.; Zhang, W. Flow cytometry is a promising and rapid method for differentiating between freely suspended Escherichia coli and E. coli attached to clay particles. J. Appl. Microbiol. 2014, 117, 1730–1739. [Google Scholar] [CrossRef]
- Ma, L.L.; Mao, G.N.; Liu, J.; Yu, H.; Gao, G.H.; Wang, Y.Y. Rapid quantification of bacteria and viruses in influent, settled water, activated sludge and effluent from a wastewater treatment plant using flow cytometry. Water Sci. Technol. 2013, 68, 1763–1769. [Google Scholar] [CrossRef]
- Delanoë, A.; Guillamin, M.; Heutte, N.; Gente, S.; Séguin, V.; Garon, D. Interest of the qPCR method calibrated with flow cytometry to quantify Aspergillus versicolor in mold-damaged homes and comparison with the cultural approach. Atmospheric Pollut. Res. 2018, 9, 871–876. [Google Scholar] [CrossRef]
- SLMB. Determining the total cell count and ratios of high and low nucleic acid content cells in freshwater using flow cytometry. Vol. Swiss Food Book 2012, 67, 1636–1645. [Google Scholar] [CrossRef]
- Afari, G.K.; Hung, Y.C. Detection and verification of the viable but nonculturable (VBNC) state of Escherichia coli O157: H7 and Listeria monocytogenes using flow cytometry and standard plating. J. Food Sci. 2018, 83, 1913–1920. [Google Scholar] [CrossRef]
- Massicotte, R.; Mafu, A.A.; Ahmad, D.; Deshaies, F.; Pichette, G.; Belhumeur, P. Comparison between flow cytometry and traditional culture methods for efficacy assessment of six disinfectant agents against nosocomial bacterial species. Front. Microbiol. 2017, 8, 112. [Google Scholar] [CrossRef]
- Prest, E.I.; Weissbrodt, D.G.; Hammes, F.; van Loosdrecht, M.C.M.; Vrouwenvelder, J.S. Long-term bacterial dynamics in a full-scale drinking water distribution system. PLoS ONE 2016, 11, e0164445. [Google Scholar] [CrossRef]
- Berney, M.; Hammes, F.; Bosshard, F.; Weilenmann, H.U.; Egli, T. Assessment and interpretation of bacterial viability by using the LIVE/DEAD BacLight Kit in combination with flow cytometry. Appl. Environ. Microbiol. 2007, 73, 3283–3290. [Google Scholar] [CrossRef]
- Hammes, F.; Broger, T.; Weilenmann, H.-U.; Vital, M.; Helbing, J.; Bosshart, U.; Huber, P.; Peter Odermatt, R.; Sonnleitner, B. Development and laboratory-scale testing of a fully automated online flow cytometer for drinking water analysis. Cytom. Part A 2012, 81, 508–516. [Google Scholar] [CrossRef] [PubMed]
- Proctor, C.R.; Besmer, M.D.; Langenegger, T.; Beck, K.; Walser, J.-C.; Ackermann, M.; Bürgmann, H.; Hammes, F. Phylogenetic clustering of small low nucleic acid-content bacteria across diverse freshwater ecosystems. ISME J. 2018, 12, 1344–1359. [Google Scholar] [CrossRef]
- Bray, J.R.; Curtis, J.T. An ordination of the upland forest communities of Southern Wisconsin. Ecol. Monogr. 1957, 27, 325–349. [Google Scholar] [CrossRef]
- Greenacre, M.; Primicerio, R. Measures of distance between samples: Noneuclidean. In Multivariate Analysis of Ecological Data; Fundación BBVA: Bilbao, Spain, 2014. [Google Scholar]
- DeLong, E.F.; Wickham, G.S.; Pace, N.R. Phylogenetic stains: Ribosomal RNA-based probes for the identification of single cells. Science 1989, 243, 1360–1363. [Google Scholar] [CrossRef] [PubMed]
- Amann, R.I.; Binder, B.J.; Olson, R.J.; Chisholm, S.W.; Devereux, R.; Stahl, D.A. Combination of 16S ribosomal-RNA-targeted oligonucleotide probes with flow-cytometry for analyzing mixed microbial-populations. Appl. Environ. Microbiol. 1990, 56, 1919–1925. [Google Scholar] [CrossRef] [PubMed]
- Oliveira, R.; Almeida, C.; Azevedo, N.F. Detection of microorganisms by fluorescence in situ hybridization using peptide nucleic acid. In Peptide Nucleic Acids: Methods and Protocols; Nielsen, P.E., Ed.; Springer: New York, NY, USA, 2020; pp. 217–230. [Google Scholar] [CrossRef]
- Wagner, M.; Haider, S. New trends in fluorescence in situ hybridization for identification and functional analyses of microbes. Curr. Opin. Biotechnol. 2012, 23, 96–102. [Google Scholar] [CrossRef] [PubMed]
- Amann, R.; Fuchs, B.M.; Behrens, S. The identification of microorganisms by fluorescence in situ hybridisation. Curr. Opin. Biotechnol. 2001, 12, 231–236. [Google Scholar] [CrossRef]
- Amann, R.; Fuchs, B.M. Single-cell identification in microbial communities by improved fluorescence in situ hybridization techniques. Nat. Rev. Microbiol. 2008, 6, 339–348. [Google Scholar] [CrossRef]
- Amann, R.I.; Ludwig, W.; Schleifer, K.H. Phylogenetic identification and in-situ detection of individual microbial-cells without cultivation. Microbiol. Rev. 1995, 59, 143–169. [Google Scholar] [CrossRef]
- Bokulich, N.A.; Mills, D.A. Next-generation approaches to the microbial ecology of food fermentations. BMB Rep. 2012, 45, 377–389. [Google Scholar] [CrossRef]
- Amann, R.I.; Krumholz, L.; Stahl, D.A. Fluorescent-oligonucleotide probing of whole cells for determinative, phylogenetic, and environmental studies in microbiology. J. Bacteriol. 1990, 172, 762–770. [Google Scholar] [CrossRef]
- Gunasekera, T.S.; Veal, D.A.; Attfield, P.V. Potential for broad applications of flow cytometry and fluorescence techniques in microbiological and somatic cell analyses of milk. Int. J. Food Microbiol. 2003, 85, 269–279. [Google Scholar] [CrossRef]
- Zwirglmaier, K. Fluorescence in situ hybridisation (FISH)—The next generation. FEMS Microbiol. Lett. 2005, 246, 151–158. [Google Scholar] [CrossRef]
- Moter, A.; Göbel, U.B. Fluorescence in situ hybridization (FISH) for direct visualization of microorganisms. J. Microbiol. Methods 2000, 41, 85–112. [Google Scholar] [CrossRef]
- Bottari, B.; Ercolini, D.; Gatti, M.; Neviani, E. Application of FISH technology for microbiological analysis: Current state and prospects. Appl. Microbiol. Biotechnol. 2006, 73, 485–494. [Google Scholar] [CrossRef]
- Cerqueira, L.; Azevedo, N.F.; Almeida, C.; Jardim, T.; Keevil, C.W.; Vieira, M.J. DNA mimics for the rapid identification of microorganisms by fluorescence in situ hybridization (FISH). Int. J. Mol. Sci. 2008, 9, 1944–1960. [Google Scholar] [CrossRef]
- Schönhuber, W.; Fuchs, B.; Juretschko, S.; Amann, R. Improved sensitivity of whole-cell hybridization by the combination of horseradish peroxidase-labeled oligonucleotides and tyramide signal amplification. Appl. Environ. Microbiol. 1997, 63, 3268–3273. [Google Scholar] [CrossRef]
- DeLong, E.F.; Taylor, L.T.; Marsh, T.L.; Preston, C.M. Visualization and enumeration of marine planktonic archaea and bacteria by using polyribonucleotide probes and fluorescent in situ hybridization. Appl. Environ. Microbiol. 1999, 65, 5554–5563. [Google Scholar] [CrossRef] [PubMed]
- Wagner, M.; Schmid, M.; Juretschko, S.; Trebesius, K.-H.; Bubert, A.; Goebel, W.; Schleifer, K.-H. In situ detection of a virulence factor mRNA and 16S rRNA in Listeria monocytogenes. FEMS Microbiol. Lett. 1998, 160, 159–168. [Google Scholar] [CrossRef] [PubMed]
- Bisha, B.; Brehm-Stecher, B.F. Simple adhesive-tape-based sampling of tomato surfaces combined with rapid fluorescence in situ hybridization for Salmonella detection. Appl. Environ. Microbiol. 2009, 75, 1450–1455. [Google Scholar] [CrossRef]
- Ercolini, D.; Villani, F.; Aponte, M.; Mauriello, G. Fluorescence in situ hybridisation detection of Lactobacillus plantarum group on olives to be used in natural fermentations. Int. J. Food Microbiol 2006, 112, 291–296. [Google Scholar] [CrossRef]
- Bisha, B.; Brehm-Stecher, B.F. Flow-through imaging cytometry for characterization of Salmonella subpopulations in alfalfa sprouts, a complex food system. Biotechnol. J. 2009, 4, 880–887. [Google Scholar] [CrossRef]
- Vieira-Pinto, M.; Oliveira, M.; Aranha, J.; Martins, C.; Bernardo, F. Influence of an enrichment step on Salmonella sp. detection by fluorescent in situ hybridization on pork samples. Food Control 2008, 19, 286–290. [Google Scholar] [CrossRef]
- Oliveira, M.; Vieira-Pinto, M.; Martins da Costa, P.; Vilela, C.L.; Martins, C.; Bernardo, F. Occurrence of Salmonella spp. in samples from pigs slaughtered for consumption: A comparison between ISO 6579:2002 and 23S rRNA fluorescent in situ hybridization method. Food Res. Int. 2012, 45, 984–988. [Google Scholar] [CrossRef]
- Rohde, A.; Hammerl, J.A.; Appel, B.; Dieckmann, R.; Al Dahouk, S. Differential detection of pathogenic Yersinia spp. by fluorescence in situ hybridization. Food Microbiol. 2017, 62, 39–45. [Google Scholar] [CrossRef]
- Rathnayaka, R.M.U.S.K. Effect of sample pre-enrichment and characters of food samples on the examination for the Salmonella by plate count method and fluorescent in-situ hybridization technique. Am. J. Food Technol. 2011, 6, 851–856. [Google Scholar] [CrossRef]
- Rocha, R.; Sousa, J.M.; Cerqueira, L.; Vieira, M.J.; Almeida, C.; Azevedo, N.F. Development and application of peptide nucleic acid fluorescence in situ hybridization for the specific detection of Listeria monocytogenes. Food Microbiol. 2019, 80, 1–8. [Google Scholar] [CrossRef]
- Shimizu, S.; Ootsubo, M.; Kubosawa, Y.; Fuchizawa, I.; Kawai, Y.; Yamazaki, K. Fluorescent in situ hybridization in combination with filter cultivation (FISHFC) method for specific detection and enumeration of viable Clostridium perfringens. Food Microbiol. 2009, 26, 425–431. [Google Scholar] [CrossRef]
- Moreno, Y.; Hernández, M.; Ferrús, M.A.; Alonso, J.L.; Botella, S.; Montes, R.; Hernández, J. Direct detection of thermotolerant campylobacters in chicken products by PCR and in situ hybridization. Res. Microbiol. 2001, 152, 577–582. [Google Scholar] [CrossRef]
- Salimi, G.; Mousavi, Z.E.; Kiani, H. Efficiency of fluorescence in situ hybridization (FISH) method for the rapid detection of Salmonella in minced lamb meat: Method analysis and optimization. J. Microbiol. Methods 2020, 175, 105989. [Google Scholar] [CrossRef] [PubMed]
- Fang, Q.; Brockmann, S.; Botzenhart, K.; Wiedemann, A. Improved detection of Salmonella spp. in foods by fluorescent in situ hybridization with 23S rRNA probes: A comparison with conventional culture methods. J. Food Prot. 2003, 66, 723–731. [Google Scholar] [CrossRef]
- Cocolin, L.; Diez, A.; Urso, R.; Rantsiou, K.; Comi, G.; Bergmaier, I.; Beimfohr, C. Optimization of conditions for profiling bacterial populations in food by culture-independent methods. Int. J. Food Microbiol. 2007, 120, 100–109. [Google Scholar] [CrossRef] [PubMed]
- Fuchizawa, I.; Shimizu, S.; Kawai, Y.; Yamazaki, K. Specific detection and quantitative enumeration of Listeria spp. using fluorescent in situ hybridization in combination with filter cultivation (FISHFC). J. Appl. Microbiol. 2008, 105, 502–509. [Google Scholar] [CrossRef] [PubMed]
- Fuchizawa, I.; Shimizu, S.; Ootsubo, M.; Kawai, Y.; Yamazaki, K. Specific and rapid quantification of viable Listeria monocytogenes using fluorescence in situ hybridization in combination with filter cultivation. Microbes Environ. 2009, 24, 273–275. [Google Scholar] [CrossRef]
- Ootsubo, M.; Shimizu, T.; Tanaka, R.; Sawabe, T.; Tajima, K.; Ezura, Y. Seven-hour fluorescence in situ hybridization technique for enumeration of Enterobacteriaceae in food and environmental water sample. J. Appl. Microbiol. 2003, 95, 1182–1190. [Google Scholar] [CrossRef] [PubMed]
- Graczyk, T.K.; Conn, D.B.; Lucy, F.; Minchin, D.; Tamang, L.; Moura, L.N.S.; DaSilva, A.J. Human waterborne parasites in zebra mussels (Dreissena polymorpha) from the Shannon River drainage area, Ireland. Parasitol. Res. 2004, 93, 385–391. [Google Scholar] [CrossRef] [PubMed]
- Ercolini, D.; Hill, P.J.; Dodd, C.E.R. Development of a fluorescence in situ hybridization method for cheese using a 16S rRNA probe. J. Microbiol. Methods 2003, 52, 267–271. [Google Scholar] [CrossRef]
- Mounier, J.; Monnet, C.; Jacques, N.; Antoinette, A.; Irlinger, F. Assessment of the microbial diversity at the surface of Livarot cheese using culture-dependent and independent approaches. Int. J. Food Microbiol. 2009, 133, 31–37. [Google Scholar] [CrossRef]
- Kollöffel, B.; Meile, L.; Teuber, M. Analysis of brevibacteria on the surface of Gruyère cheese detected by in situ hybridization and by colony hybridization. Lett. Appl. Microbiol. 1999, 29, 317–322. [Google Scholar] [CrossRef]
- Babot, J.D.; Hidalgo, M.; Argañaraz-Martínez, E.; Apella, M.C.; Perez Chaia, A. Fluorescence in situ hybridization for detection of classical propionibacteria with specific 16S rRNA-targeted probes and its application to enumeration in Gruyère cheese. Int. J. Food Microbiol. 2011, 145, 221–228. [Google Scholar] [CrossRef] [PubMed]
- Fornasari, M.E.; Rossetti, L.; Remagni, C.; Giraffa, G. Quantification of Enterococcus italicus in traditional Italian cheeses by fluorescence whole-cell hybridization. Syst. Appl. Microbiol. 2008, 31, 223–230. [Google Scholar] [CrossRef]
- Almeida, C.; Cerqueira, L.; Azevedo, N.F.; Vieira, M.J. Detection of Salmonella enterica serovar Enteritidis using real time PCR, immunocapture assay, PNA FISH and standard culture methods in different types of food samples. Int. J. Food Microbiol. 2013, 161, 16–22. [Google Scholar] [CrossRef]
- Almeida, C.; Sousa, J.M.; Rocha, R.; Cerqueira, L.; Fanning, S.; Azevedo, N.F.; Vieira, M.J. Detection of Escherichia coli O157 by peptide nucleic acid fluorescence in situ hybridization (PNA-FISH) and comparison to a standard culture method. Appl. Environ. Microbiol. 2013, 79, 6293–6300. [Google Scholar] [CrossRef]
- Zhang, X.; Wu, S.; Li, K.; Shuai, J.; Dong, Q.; Fang, W. Peptide nucleic acid fluorescence in situ hybridization for identification of Listeria genus, Listeria monocytogenes and Listeria ivanovii. Int. J. Food Microbiol. 2012, 157, 309–313. [Google Scholar] [CrossRef]
- Almeidaa, C.; Azevedo, N.F.; Fernandes, R.M.; Keevil, C.W.; Vieira, M.J. Fluorescence in situ hybridization method using a peptide nucleic acid probe for identification of Salmonella spp. in a broad spectrum of samples. Appl. Environ. Microbiol. 2010, 76, 4476–4485. [Google Scholar] [CrossRef] [PubMed]
- Bottari, B.; Santarelli, M.; Neviani, E.; Gatti, M. Natural whey starter for Parmigiano Reggiano: Culture-independent approach. J. Appl. Microbiol. 2010, 108, 1676–1684. [Google Scholar] [CrossRef]
- Friedrich, U.; Lenke, J. Improved enumeration of lactic acid bacteria in mesophilic dairy starter cultures by using multiplex quantitative real-time PCR and flow cytometry-fluorescence in situ hybridization. Appl. Environ. Microbiol. 2006, 72, 4163–4171. [Google Scholar] [CrossRef] [PubMed]
- Olsen, K.N.; Brockmann, E.; Molin, S. Quantification of Leuconostoc populations in mixed dairy starter cultures using fluorescence in situ hybridization. J. Appl. Microbiol. 2007, 103, 855–863. [Google Scholar] [CrossRef]
- Yamaguchi, N.; Kitaguchi, A.; Nasu, M. Selective enumeration of viable Enterobacteriaceae and Pseudomonas spp. in milk within 7 h by multicolor fluorescence in situ hybridization following microcolony formation. J. Biosci. Bioeng. 2012, 113, 746–750. [Google Scholar] [CrossRef]
- Angelidis, A.S.; Tirodimos, I.; Bobos, M.; Kalamaki, M.S.; Papageorgiou, D.K.; Arvanitidou, M. Detection of Helicobacter pylori in raw bovine milk by fluorescence in situ hybridization (FISH). Int. J. Food Microbiol. 2011, 151, 252–256. [Google Scholar] [CrossRef] [PubMed]
- Laflamme, C.; Gendron, L.; Turgeon, N.; Filion, G.; Ho, J.; Duchaine, C. Rapid detection of germinating Bacillus cereus cells using fluorescent in situ hybridization. J. Rapid Methods Autom. Microbiol. 2009, 17, 80–102. [Google Scholar] [CrossRef]
- Gunasekera, T.S.; Dorsch, M.R.; Slade, M.B.; Veal, D.A. Specific detection of Pseudomonas spp. in milk by fluorescence in situ hybridization using ribosomal RNA directed probes. J. Appl. Microbiol. 2003, 94, 936–945. [Google Scholar] [CrossRef] [PubMed]
- Machado, A.; Almeida, C.; Carvalho, A.; Boyen, F.; Haesebrouck, F.; Rodrigues, L.; Cerca, N.; Azevedo, N.F. Fluorescence in situ hybridization method using a peptide nucleic acid probe for identification of Lactobacillus spp. in milk samples. Int. J. Food Microbiol. 2013, 162, 64–70. [Google Scholar] [CrossRef]
- Mikš-Krajnik, M.; Babuchowski, A. 16S rRNA-targeted oligonucleotide probes for direct detection of Propionibacterium freudenreichii in presence of Lactococcus lactis with multicolour fluorescence in situ hybridization. Lett. Appl. Microbiol. 2014, 59, 320–327. [Google Scholar] [CrossRef] [PubMed]
- Kitaguchi, A.; Yamaguchi, N.; Nasu, M. Enumeration of respiring Pseudomonas spp. in milk within 6 hours by fluorescence in situ hybridization following formazan reduction. Appl. Environ. Microbiol. 2005, 71, 2748–2752. [Google Scholar] [CrossRef] [PubMed][Green Version]
- Stender, H.; Kurtzman, C.; Hyldig-Nielsen, J.J.; Sørensen, D.; Broomer, A.; Oliveira, K.; Perry, O.; Keefe, H.; Sage, A.; Young, B.; et al. Identification of Dekkera bruxellensis (Brettanomyces) from wine by fluorescence in situ hybridization using peptide nucleic acid probes. Appl. Environ. Microbiol. 2001, 67, 938. [Google Scholar] [CrossRef]
- Blasco, L.a.; Ferrer, S.; Pardo, I. Development of specific fluorescent oligonucleotide probes for in situ identification of wine lactic acid bacteria. FEMS Microbiol. Lett. 2003, 225, 115–123. [Google Scholar] [CrossRef]
- Xufre, A.; Albergaria, H.; Inácio, J.; Spencer-Martins, I.; Gírio, F. Application of fluorescence in situ hybridisation (FISH) to the analysis of yeast population dynamics in winery and laboratory grape must fermentations. Int. J. Food Microbiol. 2006, 108, 376–384. [Google Scholar] [CrossRef]
- Andorra, I.; Monteiro, M.; Esteve-Zarzoso, B.; Albergaria, H.; Mas, A. Analysis and direct quantification of Saccharomyces cerevisiae and Hanseniaspora guilliermondii populations during alcoholic fermentation by fluorescence in situ hybridization, flow cytometry and quantitative PCR. Food Microbiol. 2011, 28, 1483–1491. [Google Scholar] [CrossRef] [PubMed]
- Wang, C.; Esteve-Zarzoso, B.; Mas, A. Monitoring of Saccharomyces cerevisiae, Hanseniaspora uvarum, and Starmerella bacillaris (synonym Candida zemplinina) populations during alcoholic fermentation by fluorescence in situ hybridization. Int. J. Food Microbiol. 2014, 191, 1–9. [Google Scholar] [CrossRef]
- Branco, P.; Monteiro, M.; Moura, P.; Albergaria, H. Survival rate of wine-related yeasts during alcoholic fermentation assessed by direct live/dead staining combined with fluorescence in situ hybridization. Int. J. Food Microbiol. 2012, 158, 49–57. [Google Scholar] [CrossRef]
- Branco, P.; Candeias, A.; Caldeira, A.T.; González-Pérez, M. A simple procedure for detecting Dekkera bruxellensis in wine environment by RNA-FISH using a novel probe. Int. J. Food Microbiol. 2020, 314, 108415. [Google Scholar] [CrossRef]
- Yasuhara, T.; Yuuki, T.; Kagami, N. Novel quantitative method for detection of pectinatus using rRNA targeted fluorescent probes. J. Am. Soc. Brew. Chem. 2001, 59, 117–121. [Google Scholar] [CrossRef]
- Trček, J.; Lipoglavšek, L.; Avguštin, G. 16S rRNA in situ hybridization followed by flow cytometry for rapid identification of acetic acid bacteria involved in submerged industrial vinegar production. Food Technol. Biotechnol. 2016, 54, 108–112. [Google Scholar] [CrossRef] [PubMed]
- Almeida, C.; Azevedo, N.F.; Santos, S.; Keevil, C.W.; Vieira, M.J. Correction: Discriminating multi-species populations in biofilms with peptide nucleic acid fluorescence in situ hybridization (PNA FISH). PLoS ONE 2013, 8, e14786. [Google Scholar] [CrossRef]
- Bragança, S.M.; Azevedo, N.F.; Simões, L.C.; Keevil, C.W.; Vieira, M.J. Use of fluorescent in situ hybridisation for the visualisation of Helicobacter pylori in real drinking water biofilms. Water Sci. Technol. 2007, 55, 387–393. [Google Scholar] [CrossRef] [PubMed]
- Timke, M.; Wolking, D.; Wang-Lieu, N.Q.; Altendorf, K.; Lipski, A. Microbial composition of biofilms in a brewery investigated by fatty acid analysis, fluorescence in situ hybridisation and isolation techniques. Appl. Microbiol. Biotechnol. 2004, 66, 100–107. [Google Scholar] [CrossRef] [PubMed]
- Šilhová, L.; Moťková, P.; Šilha, D.; Vytřasová, J. FISH detection of Campylobacter and Arcobacter adhered to stainless steel coupons. J. Microbiol. Biotechnol. Food Sci. 2015, 4, 347–351. [Google Scholar] [CrossRef]
- Bottari, B.; Mancini, A.; Ercolini, D.; Gatti, M.; Neviani, E. FISHing for food microorganisms. In Fluorescence In Situ Hybridization (FISH): Application Guide; Liehr, T., Ed.; Springer: Berlin/Heidelberg, Germany, 2017; pp. 511–530. [Google Scholar] [CrossRef]
- Yamaguchi, N.; Goto, S. Rapid quantification of Escherichia coli in potable water by fluorescence in situ hybridization performed in liquid (liq-FISH) and a microfluidic system. Water Air Soil Pollut. 2019, 230, 285. [Google Scholar] [CrossRef]
- Lehtola, M.J.; Loades, C.J.; Keevil, C.W. Advantages of peptide nucleic acid oligonucleotides for sensitive site directed 16S rRNA fluorescence in situ hybridization (FISH) detection of Campylobacter jejuni, Campylobacter coli and Campylobacter lari. J. Microbiol. Methods 2005, 62, 211–219. [Google Scholar] [CrossRef]
- Lehtola, M.J.; Torvinen, E.; Miettinen, I.T.; Keevil, C.W. Fluorescence in situ hybridization using peptide nucleic acid probes for rapid detection of Mycobacterium avium subsp. avium and Mycobacterium avium subsp. paratuberculosis in potable-water biofilms. Appl. Environ. Microbiol. 2006, 72, 848–853. [Google Scholar] [CrossRef]
- Brient, L.; Ben Gamra, N.; Periot, M.; Roumagnac, M.; Zeller, P.; Bormans, M.; Méjean, A.; Ploux, O.; Biegala, I.C. Rapid Characterization of Microcystin-Producing Cyanobacteria in Freshwater Lakes by TSA-FISH (Tyramid Signal Amplification-Fluorescent In Situ Hybridization). Front. Environ. Sci. 2017, 5, 43. [Google Scholar] [CrossRef]
- Gerdts, G.; Luedke, G. FISH and chips: Marine bacterial communities analyzed by flow cytometry based on microfluidics. J. Microbiol. Methods 2006, 64, 232–240. [Google Scholar] [CrossRef]
- Glöckner, F.O.; Fuchs, B.M.; Amann, R. Bacterioplankton compositions of lakes and oceans: A first comparison based on fluorescence in situ hybridization. Appl. Environ. Microbiol. 1999, 65, 3721–3726. [Google Scholar] [CrossRef]
- Khandeparker, D.L.; Desai, D.; Anil, A.; Sawant, S.; Krishnamurthy, V.; Mapari, K.; Jolkifli, Z.; Karim, N.; Thoha, H.; Hadiyanto, H.; et al. Application of Fluorescence in situ hybridization-Flow cytometry (FISH-FCM) technique to detect and quantify Vibrio cholerae populations from different geographic regions. ASEAN J. Sci. Technol. Dev. 2018, 35, 159–165. [Google Scholar] [CrossRef]
- Lee, J.; Katano, T.; Chang, M.; Han, M.S. Application of tyramide signal amplification-fluorescence in situ hybridisation and flow cytometry to detection of Heterosigma akashiwo (Raphidophyceae) in natural waters. N. Z. J. Mar. Freshw. Res. 2012, 46, 137–148. [Google Scholar] [CrossRef]
- Manti, A.; Boi, P.; Amalfitano, S.; Puddu, A.; Papa, S. Experimental improvements in combining CARD-FISH and flow cytometry for bacterial cell quantification. J. Microbiol. Methods 2011, 87, 309–315. [Google Scholar] [CrossRef] [PubMed]
- Neuenschwander, S.M.; Salcher, M.M.; Pernthaler, J. Fluorescence in situ hybridization and sequential catalyzed reporter deposition (2C-FISH) for the flow cytometric sorting of freshwater ultramicrobacteria. Front. Microbiol. 2015, 6, 247. [Google Scholar] [CrossRef] [PubMed]
- Sekar, R.; Fuchs, B.M.; Amann, R.; Pernthaler, J. Flow sorting of marine bacterioplankton after fluorescence in situ hybridization. Appl. Environ. Microbiol. 2004, 70, 6210–6219. [Google Scholar] [CrossRef] [PubMed]
- Tang, Y.Z.; Gin, K.Y.H.; Lim, T.H. High-temperature fluorescent in Situ hybridization for detecting Escherichia coli in Seawater samples, using rRNA-targeted oligonucleotide probes and flow cytometry. Appl. Environ. Microbiol. 2005, 71, 8157–8164. [Google Scholar] [CrossRef]
- Kristiansen, A.; Saunders, A.M.; Hansen, A.A.; Nielsen, P.H.; Nielsen, J.L. Community structure of bacteria and fungi in aerosols of a pig confinement building. FEMS Microbiol. Ecol. 2012, 80, 390–401. [Google Scholar] [CrossRef]
- Chi, M.-C.; Li, C.-S. Fluorochrome and Fluorescent In Situ Hybridization to Monitor Bioaerosols in Swine Buildings. Aerosol Sci. Technol. 2005, 39, 1101–1110. [Google Scholar] [CrossRef]
- Neef, A.; Kämpfer, P. Molecular Identification of Airborne Microorganisms from Composting Facilities. In Microbiology of Composting; Springer: Berlin/Heidelberg, Germany, 2002; pp. 585–594. [Google Scholar]
- Deloge-Abarkan, M.; Ha, T.-L.; Robine, E.; Zmirou-Navier, D.; Mathieu, L. Detection of airborne Legionella while showering using liquid impingement and fluorescent in situ hybridization (FISH). J. Environ. Monit. 2007, 9, 91–97. [Google Scholar] [CrossRef]
- Gunasekera, T.S.; Attfield, P.V.; Veal, D.A. A flow cytometry method for rapid detection and enumeration of total bacteria in milk. Appl. Environ. Microbiol. 2000, 66, 1228–1232. [Google Scholar] [CrossRef] [PubMed]
- Gasol, J.M.; Del Giorgio, P.A. Using flow cytometry for counting natural planktonic bacteria and understanding the structure of planktonic bacterial communities. Sci. Mar. 2000, 64, 197–224. [Google Scholar] [CrossRef]
- Ou, F.; McGoverin, C.; Swift, S.; Vanholsbeeck, F. Absolute bacterial cell enumeration using flow cytometry. J. Appl. Microbiol. 2017, 123, 464–477. [Google Scholar] [CrossRef] [PubMed]
- Stiefel, P.; Schmidt-Emrich, S.; Maniura-Weber, K.; Ren, Q. Critical aspects of using bacterial cell viability assays with the fluorophores SYTO9 and propidium iodide. BMC Microbiol. 2015, 15, 36. [Google Scholar] [CrossRef] [PubMed]
- Rosenberg, M.; Azevedo, N.F.; Ivask, A. Propidium iodide staining underestimates viability of adherent bacterial cells. Sci. Rep. 2019, 9, 6483. [Google Scholar] [CrossRef]
- Sayas, E.; García-López, F.; Serrano, R. Toxicity, mutagenicity and transport in Saccharomyces cerevisiae of three popular DNA intercalating fluorescent dyes. Yeast 2015, 32, 595–606. [Google Scholar] [CrossRef]
- Lin, F.; Li, C.; Chen, Z. Exopolysaccharide-derived carbon dots for microbial viability assessment. Front. Microbiol. 2018, 9, 2697. [Google Scholar] [CrossRef]
- Haines, A.M.; Tobe, S.S.; Kobus, H.J.; Linacre, A. Properties of nucleic acid staining dyes used in gel electrophoresis. Electrophoresis 2015, 36, 941–944. [Google Scholar] [CrossRef]
- Vujanovic, S.; Goh, Y.K.; Vujanovic, V. Natural fruit extracts as non-toxic fluorescent dyes for staining fungal chlamydospores. World J. Microbiol. Biotechnol. 2012, 28, 387–390. [Google Scholar] [CrossRef]
- Kurutos, A.; Ilic-Tomic, T.; Kamounah, F.S.; Vasilev, A.A.; Nikodinovic-Runic, J. Non-cytotoxic photostable monomethine cyanine platforms: Combined paradigm of nucleic acid staining and in vivo imaging. J. Photochem. Photobiol. A Chem. 2020, 397, 112598. [Google Scholar] [CrossRef]
- Volpi, E.V. Formamide-free fluorescence in situ hybridization (FISH). In Fluorescence In Situ Hybridization (FISH): Application Guide; Liehr, T., Ed.; Springer: Berlin/Heidelberg, Germany, 2017; pp. 135–139. [Google Scholar]
- Adeyemo, S.; Akinloye, A.; Adekanmi, G. The use of plant dyes for microbial staining and identification: An eco-friendly and non-toxic alternative method. J. Adv. Biol. Biotechnol. 2018, 16, 1–10. [Google Scholar] [CrossRef]
- Ommen, P.; Zobek, N.; Meyer, R.L. Quantification of biofilm biomass by staining: Non-toxic safranin can replace the popular crystal violet. J. Microbiol. Methods 2017, 141, 87–89. [Google Scholar] [CrossRef]
- Jasson, V.; Jacxsens, L.; Luning, P.; Rajkovic, A.; Uyttendaele, M. Alternative microbial methods: An overview and selection criteria. Food Microbiol. 2010, 27, 710–730. [Google Scholar] [CrossRef] [PubMed]
- Bunthof, C.J. Flow Cytometry, Fluorescent Probes, and Flashing Bacteria; Wageningen University: Wageningen, The Netherlands, 2002. [Google Scholar]
- Wilkinson, M.G. Flow cytometry in food microbiology: Challenges, opportunities and progress to date. Tec. Lab. 2016, 417, 722–728. [Google Scholar]
- Boulanger, C.A.; Edelstein, P.H. Precision and accuracy of recovery of Legionella pneumophila from seeded tap water by filtration and centrifugation. Appl. Environ. Microbiol. 1995, 61, 1805–1809. [Google Scholar] [CrossRef]
- Chen, P.-S.; Li, C.-S. Real-time monitoring for bioaerosols—Flow cytometry. Analyst 2007, 132, 14–16. [Google Scholar] [CrossRef]
- Yoo, K.; Lee, T.K.; Choi, E.; Yang, J.; Shukla, S.; Hwang, S.-I.; Park, J. Approach of molecular methods for the detection and monitoring of microbial communities in bioaerosols: A review. J. Environ. Sci. 2016, 51, 234–247. [Google Scholar] [CrossRef]
- Liesche, J.; Marek, M.; Günther-Pomorski, T. Cell wall staining with Trypan blue enables quantitative analysis of morphological changes in yeast cells. Front. Microbiol. 2015, 6, 107. [Google Scholar] [CrossRef]
- Zhu, X.; Shi, H.; Shen, Y.; Zhang, B.; Zhao, J.; Li, G. A green method of staining DNA in polyacrylamide gel electrophoresis based on fluorescent copper nanoclusters synthesized in situ. Nano Res. 2015, 8, 2714–2720. [Google Scholar] [CrossRef]
- Chiaraviglio, L.; Kirby, J.E. Evaluation of impermeant, DNA-binding dye fluorescence as a real-time readout of eukaryotic cell toxicity in a high throughput screening format. ASSAY Drug Dev. Technol. 2014, 12, 219–228. [Google Scholar] [CrossRef]
- Tashyreva, D.; Elster, J.; Billi, D. A novel staining protocol for multiparameter assessment of cell heterogeneity in Phormidium populations (Cyanobacteria) employing fluorescent dyes. PLoS ONE 2013, 8, e55283. [Google Scholar] [CrossRef] [PubMed]
- Kotenkova, E.; Bataeva, D.; Minaev, M.; Zaiko, E. Application of EvaGreen for the assessment of Listeria monocytogenes ATCC 13932 cell viability using flow cytometry. AIMS Microbiol. 2019, 5, 39–47. [Google Scholar] [CrossRef]
- Matthiesen, S.H.; Hansen, C.M. Fast and non-toxic in situ hybridization without blocking of repetitive sequences. PLoS ONE 2012, 7, e40675. [Google Scholar] [CrossRef] [PubMed]
- Kalinka, A.; Myśliwy, M.; Achrem, M. Comparison of ethylene carbonate and formamide as components of the hybridization mixture in FISH. Sci. Agric. 2021, 78, e20190315. [Google Scholar] [CrossRef]
- Golczyk, H. A simple non-toxic ethylene carbonate fluorescence in situ hybridization (EC-FISH) for simultaneous detection of repetitive DNA sequences and fluorescent bands in plants. Protoplasma 2019, 256, 873–880. [Google Scholar] [CrossRef]
- Sinigaglia, C.; Thiel, D.; Hejnol, A.; Houliston, E.; Leclere, L. A safer, urea-based in situ hybridization method improves detection of gene expression in diverse animal species. bioRxiv 2018, 434, 15–23. [Google Scholar] [CrossRef] [PubMed]
- Aistleitner, K.; Sieper, T.; Stürz, I.; Jeske, R.; Tritscheller, S.; Mantel, S.; Tscherne, A.; Zange, S.; Stoecker, K.; Wölfel, R. NOTIFy (non-toxic lyophilized field)-FISH for the identification of biological agents by fluorescence in situ hybridization. PLoS ONE 2020, 15, e0230057. [Google Scholar] [CrossRef]
- Camp, J.E.; Nyamini, S.B.; Scott, F.J. Cyrene™ is a green alternative to DMSO as a solvent for antibacterial drug discovery against ESKAPE pathogens. RSC Med. Chem. 2020, 11, 111–117. [Google Scholar] [CrossRef] [PubMed]
- Yi, X.; Liu, M.; Luo, Q.; Zhuo, H.; Cao, H.; Wang, J.; Han, Y. Toxic effects of dimethyl sulfoxide on red blood cells, platelets, and vascular endothelial cellsin vitro. FEBS Open Biol. 2017, 7, 485–494. [Google Scholar] [CrossRef] [PubMed]
- Raso, J. Fundamental and applied aspects of pulsed electric fields for microbial inactivation. In 1st World Congress on Electroporation and Pulsed Electric Fields in Biology, Medicine and Food & Environmental Technologies; Springer: Singapore, 2016; pp. 11–14. [Google Scholar]
- Bensalem, S.; Pareau, D.; Cinquin, B.; Français, O.; Le Pioufle, B.; Lopes, F. Impact of pulsed electric fields and mechanical compressions on the permeability and structure of Chlamydomonas reinhardtii cells. Sci. Rep. 2020, 10, 2668. [Google Scholar] [CrossRef]
- Novickij, V.; Lastauskienė, E.; Švedienė, J.; Grainys, A.; Staigvila, G.; Paškevičius, A.; Girkontaitė, I.; Zinkevičienė, A.; Markovskaja, S.; Novickij, J. Membrane permeabilization of pathogenic yeast in alternating sub-microsecond electromagnetic fields in combination with conventional electroporation. J. Membr. Biol. 2018, 251, 189–195. [Google Scholar] [CrossRef]
- Schottroff, F.; Kastenhofer, J.; Spadiut, O.; Jaeger, H.; Wurm, D.J. Selective release of recombinant periplasmic protein from E. coli using continuous pulsed electric field treatment. Front. Bioeng. Biotechnol. 2020, 8, 1584. [Google Scholar] [CrossRef]
- Martínez, J.M.; Delso, C.; Álvarez, I.; Raso, J. Pulsed electric field-assisted extraction of valuable compounds from microorganisms. Compr. Rev. Food Sci. Food Saf. 2020, 19, 530–552. [Google Scholar] [CrossRef]
- Zhao, W.; Yang, R.; Shen, X.; Zhang, S.; Chen, X. Lethal and sublethal injury and kinetics of Escherichia coli, Listeria monocytogenes and Staphylococcus aureus in milk by pulsed electric fields. Food Control 2013, 32, 6–12. [Google Scholar] [CrossRef]
- Elez-Martínez, P.; Escolà-Hernández, J.; Soliva-Fortuny, R.C.; Martín-Belloso, O. Inactivation of Lactobacillus brevis in orange juice by high-intensity pulsed electric fields. Food Microbiol. 2005, 22, 311–319. [Google Scholar] [CrossRef]
- Wouters, P.C.; Bos, A.P.; Ueckert, J. Membrane permeabilization in relation to inactivation kinetics of Lactobacillus species due to pulsed electric fields. Appl. Environ. Microbiol. 2001, 67, 3092–3101. [Google Scholar] [CrossRef] [PubMed]
- Vaessen EM, J.; den Besten HM, W.; Patra, T.; van Mossevelde NT, M.; Boom, R.M.; Schutyser MA, I. Pulsed electric field for increasing intracellular trehalose content in Lactiplantibacillus plantarum WCFS1. Innov. Food Sci. Emerg. Technol. 2018, 47, 256–261. [Google Scholar] [CrossRef]
- Campana, L.G.; Edhemovic, I.; Soden, D.; Perrone, A.M.; Scarpa, M.; Campanacci, L.; Cemazar, M.; Valpione, S.; Miklavčič, D.; Mocellin, S.; et al. Electrochemotherapy—Emerging applications technical advances, new indications, combined approaches, and multi-institutional collaboration. Eur. J. Surg. Oncol. 2019, 45, 92–102. [Google Scholar] [CrossRef] [PubMed]
- Kos, S.; Vanvarenberg, K.; Dolinsek, T.; Cemazar, M.; Jelenc, J.; Préat, V.; Sersa, G.; Vandermeulen, G. Gene electrotransfer into skin using noninvasive multi-electrode array for vaccination and wound healing. Bioelectrochemistry 2017, 114, 33–41. [Google Scholar] [CrossRef] [PubMed]
- Vaessen, E.M.J.; Timmermans, R.A.H.; Tempelaars, M.H.; Schutyser, M.A.I.; Den Besten, H.M.W. Reversibility of membrane permeabilization upon pulsed electric field treatment in Lactobacillus plantarum WCFS1. Sci. Rep. 2019, 9, 19990. [Google Scholar] [CrossRef]
- Zand, E.; Schottroff, F.; Schoenher, C.; Zimmermann, K.S.; Zunabovic-Pichler, M.; Jaeger, H. An alternative method to describe intermediate cellular states induced by pulsed electric field treatment. Food Control. 2021. submitted. [Google Scholar]
- Fröhling, A.; Nettmann, E.; Jäger, H.; Knorr, D.; Schlüter, O. Specific detection of bacteria from food using a combination of PEF and Flow-FISH. In Proceedings of the DGG-Proceedings, Bonn, Germany, 27 February–2 March 2013; pp. 1–5. [Google Scholar]
- Ruark-Seward, C.L.; Davis, E.L.; Sit, T.L. Electropermeabilization-based fluorescence in situ hybridization of whole-mount plant parasitic nematode specimens. MethodsX 2019, 6, 2720–2728. [Google Scholar] [CrossRef] [PubMed]
- Volpi, E.V.; Bridger, J.M. FISH glossary: An overview of the fluorescence in situ hybridization technique. Biotechniques 2008, 45, 385. [Google Scholar] [CrossRef]
- Stoecker, K.; Dorninger, C.; Daims, H.; Wagner, M. Double labeling of oligonucleotide probes for fluorescence in situ hybridization (DOPE-FISH) improves signal intensity and increases rRNA accessibility. Appl. Environ. Microbiol. 2010, 76, 922–926. [Google Scholar] [CrossRef]
- Pernthaler, A.; Pernthaler, J.; Amann, R. Fluorescence in situ hybridization and catalyzed reporter deposition for the identification of marine bacteria. Appl. Environ. Microbiol. 2002, 68, 3094–3101. [Google Scholar] [CrossRef]
- Schönhuber, W.; Zarda, B.; Eix, S.; Rippka, R.; Herdman, M.; Ludwig, W.; Amann, R. In situ identification of Cyanobacteria with horseradish peroxidase-labeled, rRNA-targeted oligonucleotide probes. Appl. Environ. Microbiol. 1999, 65, 1259–1267. [Google Scholar] [CrossRef]
- Grieb, A.; Bowers, R.M.; Oggerin, M.; Goudeau, D.; Lee, J.; Malmstrom, R.R.; Woyke, T.; Fuchs, B.M. A pipeline for targeted metagenomics of environmental bacteria. Microbiome 2020, 8, 21. [Google Scholar] [CrossRef]
- Takahashi, H.; Horio, K.; Kato, S.; Kobori, T.; Watanabe, K.; Aki, T.; Nakashimada, Y.; Okamura, Y. Direct detection of mRNA expression in microbial cells by fluorescence in situ hybridization using RNase H-assisted rolling circle amplification. Sci. Rep. 2020, 10, 9588. [Google Scholar] [CrossRef] [PubMed]
- Batani, G.; Bayer, K.; Böge, J.; Hentschel, U.; Thomas, T. Fluorescence in situ hybridization (FISH) and cell sorting of living bacteria. Sci. Rep. 2019, 9, 18618. [Google Scholar] [CrossRef]
- Choi, J.; Kang, M.; Jung, J.H. Integrated micro-optofluidic platform for real-time detection of airborne microorganisms. Sci. Rep. 2015, 5, 15983. [Google Scholar] [CrossRef]
- Chang, C.W.; Ting, Y.T.; Horng, Y.J. Collection efficiency of liquid-based samplers for fungi in indoor air. Indoor Air 2019, 29, 380–389. [Google Scholar] [CrossRef] [PubMed]
- Choi, J.; Hong, S.C.; Kim, W.; Jung, J.H. Highly Enriched, Controllable, Continuous Aerosol Sampling Using Inertial Microfluidics and Its Application to Real-Time Detection of Airborne Bacteria. ACS Sens. 2017, 2, 513–521. [Google Scholar] [CrossRef] [PubMed]


| Research Area/ Food Matrix | Model Microorganism/ Sample Type/ Sample Location | Detection Target, Fluorochrome(s), and Gating | Sample Preparation and Observation Methods | References |
|---|---|---|---|---|
| Wine | Yeasts (Saccharomyces cerevisiae and Saccharomyces bayanus strains) Malolactic bacteria (Oenococcus oeni strains); Fresh wine samples from different wineries | Viability (Rhodamine 123, calcein acetoxymethyl ester, 2″, 7″-bis(carboxyethyl)-5(6)-carboxyfluorescein acetoxymethyl ester, fluorescein diacetate (FDA)) | Samples were diluted, centrifuged and suspended in PBS Incubation (5 min for yeasts and 15 min for malolactic bacteria cells) FCM and CFU enumeration | [70] |
| Milk, fermentation starters and probiotic products | Lactiplantibacillus plantarum WCFS 1 for milk samples Commercially available diary starters (mixed cultures) Probiotic products (mixed cultures) | TCC (SYTO 9) Viability, based on enzymatic activity and membrane-permeabilized cells (carboxyfluorescein diacetate (cFDA) and TOTO-1) | Milk samples: L. plantarum samples within the exponential growth phase were resuspended in semi-skimmed pasteurized milk and cleared The cheese starter was analyzed directly and after incubation Yogurt starters were analyzed without any further preparation Probiotic products (Yakult, Orthiflorplus, Mona Vifit yogurt drink) were cleared before sampling Total assay time (1 h) FCM compared to CFU enumeration and fluorescence microscopy | [72] |
| Non-dairy probiotic drinks and pharmaceutical products | Pure cultures: four different Lactobacillus strains and Bifidobacterium animalis subsp. lactis Two commercially available pharmaceutical probiotic products and six probiotic drinks | Intracellular enzymatic reaction and intact cell membrane (ChemChrome, cFDA, cFDA-AM, sFDA, and CAM) Viability (SYTO 9 and propidium iodide (PI)) | Samples were suspended in either ringer solution or PBS Incubation with ChemChrome (10 min), with other esterase activity dyes (15–60 min) FCM, fluorescence microscopy and fluorometer | [71] |
| Pulsed electric field (PEF) inactivation Milk | Lactobacillus rhamnosus E522 | Esterase activity and membrane integrity (cFDA and PI) | PEF-treated samples were centrifuged (2600× g, 10 min), resuspension in 50 mM PBS Incubation (10 min, 37 °C, cFDA), washing to remove excessive cFDA, incubation (10 min, on ice, PI) FCM and colony count | [58] |
| Detection of VBNC for increased microbiological safety | P. aeruginosa Pseudomonas syringae S. Typhimurium E. coli O157:H7 | TCC, viability, and VBNC (SYTO 9, SYTO 13, SYTO 17, or SYTO 40 in combination with PI) | Strains were used at the late log phase in either King’s broth or Luria–Bertani broth (and heat-treated at 72 °C for 5–15 min) Total assay time (70 min), incubation (60 min) FCM and CFU enumeration | [64]) |
| Disinfection efficiency and Mastitis detection Milk | E. coli DSM 1116 | Cell membrane integrity (Thiazole orange (TO) and PI) Metabolic activity and membrane integrity (cFDA + PI) Cell membrane potential (3,3′-diethyloxacarbocyanine iodide (DiOC2(3)) | E. coli was analyzed at stationary phase in PBS (pH 7.0) Incubation (TO + PI, 10 min; cFDA + PI, 45 min; DiOC2(3), 15 min) FCM, coulter counter and CFU enumeration | [57] |
| Food preservation | E. coli ATCC 11229 L. innocua ATCC 33090 S. cerevisiae KE162 | Membrane integrity (PI) and esterase activity (fluorescein diacetate (FDA)) | Strains were analyzed at the stationary phase in PBS buffer (pH 7.0) Incubation (PI, 10 min; FDA, 30 min) FCM and CFU enumeration | [59] |
| Indirect plasma treatment Fresh pork | Fresh pork (directly from the slaughterhouse) | Viability based on esterase activity and membrane integrity (cFDA and PI) | After plasma treatment of meat samples Homogenization of meat samples and centrifugation (200× g, 4 °C, 2 min) to remove meat particles Centrifugation of supernatant (4000× g, 4 °C, 6 min) Re-suspension (in 0.05 M PBS) Incubation (15 min, 37 C) FCM, fluorescence spectrometer, UV/Vis/NIR spectrophotometer, and colony count | [73] |
| Non-thermal plasma treatment Bacterial model system on polysaccharide gels | L. innocua DSM 20649 E. coli DSM 1116 | Esterase activity (cFDA) Membrane integrity and RNA and DNA damage (TO and PI) | Gelrite® polysaccharide gels were inoculated with 25 μL bacteria suspension After plasma treatment, bacteria were resuspended in 0.05 M PBS and agitated (5 min, 750 rpm, 37 °C) Incubation (15 min + 10 min for L. innocua and 45 min + 10 min for E. coli, cFDA and PI; 10 min, TO + PI) After cFDA and PI staining, centrifugation (4000× g, 6 min, 4 °C) to remove cFDA FCM and colony count | [56] |
| Fresh food preservation and analytical viability methods | L. monocytogenes E. coli Salmonella enterica | Viability SYBR® Green I (SG1) and PI) | In vitro experiment: type cultures were incubated until stationary phase (16 h) Incubation (15 min) FCM vs. propidium monoazide quantitative PCR Reference methods: CFU enumeration and fluorescence microscopy | [60] |
| Drinking water and tea | E. coli ER2738 | TCC, viability and VBNC state (PicoGreen, for tea samples: +1 mM EDTA 2) Gating with FSC and SSC | E. coli cells were used in stationary phase and spiked to either water or jasmine green tea sample Assay time (<20 min) New FCM approach and CFU enumeration | [66] |
| New inactivation technologies (peracetic acid, ozonated water, cold atmospheric pressure plasma) Fruits and vegetables | E. coli DSM 1116 L. innocua DSM 20649 Pectobacterium carotovorum spp. carotovorum DSM 30168 | Membrane integrity and RNA/DNA damage (TO and PI) Esterase activity (cFDA) Membrane potential (DiOC2(3)) | Treated samples were centrifuged (3220× g for 15 min, 4 °C) and resuspended in 50 mM PBS or directly resuspended in PBS and agitated (5 min, 750 rpm, 37 °C) Incubation (10 min, TO + PI; 15 min, DiOC2(3); 15 or 45 min for Gram-positive or Gram-negative bacteria, respectively, cFDA) FCM and colony count | [63] |
| Antimicrobial surfactant and food safety | Yersinia enterocolitica ATCC 9610 L. plantarum ATCC 8014 | Viability (PI and bis-oxonol) The cell population was selected via gating of FSC vs. SSC Aggregates and cell debris were excluded | After treatment, strains were diluted in filtered buffered peptone water and stains were added Incubation (n.a. 1) FCM and transmission electron microscopy | [67] |
| Juice preservation | S. cerevisiae KE 162 | Viability, esterase activity, and membrane integrity (FDA and PI) | S. cerevisiae cells were analyzed in either peptone water or carrot–orange juice Incubation (30 min, FDA; 10 min, PI) FCM, TEM and CFU enumeration | [44] |
| Essential oils against foodborne pathogens | L. monocytogenes Scott A E. coli MG 1655 | Membrane integrity (TO and PI) Cell membrane potential (DiOC2(3)) Viability based on cell membrane integrity and esterase activity (cFDA and PI) | After treatment, bacterial cells were centrifuged (7000× g, 4 °C, 15 min), resuspended in 50 mM PBS, and centrifuged (7000× g, 4 °C, 5 min) Incubation (10–15 min, TO; 5 min, PI; 45 min, cFDA, and PI; 15 min, DiOC2(3)) FCM and colony count | [55] |
| Food-borne pathogens | Staphylococcus aureus | Viability (SYTO 9 and PI Cyanide 3-chlorophenylhydrazone (CCCP) and DiOC2 Calcein-AM, PI and cetyltrimethyl ammonium bromide (CTAB)) | Cultures were cultivated in nutrient broth until exponential phase Incubation (30 min, calcein-AM; 15 min, other dyes) FCM and scanning electron microscopy | [53] |
| Lettuce disinfection | E. coli CECT 434 | Viability (SYTO-BC and PI) | Inoculated and disinfected lettuce samples were suspended and stirred in 0.9% NaCl, from what 2 mL were removed for FCM and 200 µL for CFU enumeration Incubation (10 min) FCM and CFU enumeration | [61] |
| Microbial egg safety | Eggs spiked with pathogenic Salmonella Typhimurium and harmless E. coli K12 | TCC | E. coli strain, clay, PBS, and fluorochromes were mixed at fixed volumes to a sample mixture Total assay time (1.5 h) FCM and settling method | [65] |
| Ohmic heating Paraprobiotics production | Lactobacillus acidophilus LA-5, Lacticaseibacillus casei 01 and Bifidobacterium animalis subsp. lactis Bb-12 | Viability (TO and PI) | Ohmic heating treated samples were centrifuged (3500× g × 3 min, 4 °C), washed and resuspended in PBS Incubation (10 min, TO; 5 min; PI) FCM, SEM, plate counts, Gram staining, catalase test | [54] |
| PEF treatment Model solution for liquid foods | Model solution containing E. coli ATCC 9637 | Viability (SG1PI) | PEF treated E. coli suspension (~105 cells/mL) was immediately stored on ice until staining Incubation (13 min, SG1PI) FCM and plate counts | [62] |
| Microbial food safety—Contamination monitoring of stainless steel surfaces | Sampling location: Stainless steel conveyor belts after cleaning procedures Reference strains: E. coli ATCC 10536 Sarcina lutea Bacillus subtilis ATCC 6633 S. aureus ATCC 33592 | Cellular redox potential and cell sorting for the identification and discrimination between active and non-active sub-populations (BacLightTM RedoxSensorTM Green Vitality Kit, including FITC-A and PE-Texas Red-A) Viability (fluorescein isothiocyanate (FITC) and PI) | Swabs of 100 cm2 stainless steel areas within a fruit and vegetable processing company were taken and immediately placed in 2 mL 1% PBS solution In situ analysis Incubation (n.a. 1) FCM, cell sorting, and CFU enumeration | [3] |
| Research Area/Analyzed Matrix | Model Microorganism/ Sample Type/ Sample Location | Detection Target, Fluorochrome(s), and Gating | Sample Preparation and Observation Methods | References |
|---|---|---|---|---|
| Microbial particle transition from environmental to water samples | E. coli (three environmental strains; one modified pathogenic strain) | Viability (SYTO 11) and propidium iodide (PI) and VBNC state Cell distinction is mainly based on SSC scattering, as unattached E. coli cells show low SSC and attached cells indicate high SSC | E. coli strain, clay, PBS, and fluorochromes were suspended at defined volumes Total assay time (~1 h) FCM vs. settling method | [84] |
| Aquatic milieu/water | Legionella pneumophila and E. coli | LIVE/DEAD® BacLightTM Bacterial Viability Kit (SYTO 9 and PI) | Cells were harvested at an exponential growth phase and heat-treated according to the experimental plan prior to FCM analysis Incubation (15 min, Syto 9, 25 min, Syto 9 and PI) FCM vs. propidium monoazide quantitative PCR | [83] |
| Drinking water | Bacterial cells within the native drinking water | TCC and permeabilized membranes (SYBR® Green I (SG1) and PI) Gating to distinguish between high- and low-nucleic-acid-content bacteria | Collected at a drinking water tap of a distribution system Samples were buffered with 10 mM borate (pH 8.0) Incubation (14–18 min) FCM | [82] |
| Drinking water | Drinking water samples | TCC (SG1) and distinction between high and low nucleic content Fixed gating between green and red fluorescence was used, whereas for low and high nucleic acid content gates were set on the green fluorescent spectra | n.a. 1 Total assay time (<15 min), incubation (10 min) FCM | [81] |
| Drinking water | Groundwater site in Switzerland (further used for drinking water) | TCC (SG1) Gating to distinguish between high- and low-nucleic-acid-content bacteria | Sampling was conducted every 15 min during 14 days Incubation (10 min) Online FCM with automated staining module | [75] |
| Drinking water | Samples from drinking water treatment plant | TCC (SG1) Gating to distinguish between high- and low-nucleic-acid-content bacteria | Sampling every 10 min for 10 days Total assay time (10–30 min), incubation (10 min) FCM and heterotrophic plate count | [78] |
| Drinking water | Sampling location: incoming and existing water streams of water towers | TCC (SG1) Bray–Curtis dissimilarity 2 to assess dissimilarities between microbial communities | Automated online sampling every 40 min from all streams Real-time monitoring, incubation (20 min) Online FCM | [49] |
| Drinking water Disinfection | Fungal spore suspensions (Asperigillus niger, Trichoderma harzianum, and Penicillium polonicum) | Viability (SG1 and PI) Esterase activity (cFDA) Measurement of ROS levels (dihydroethidium, DHE) | EDTA was added to the spore solution (105–106 cells/mL) Incubation (10 min, cFDA; 20 min; DHE; 25 min, SG1PI) FCM and plate counts | [76] |
| Wastewater monitoring | Different wastewater samples (bacteria and viruses) | Total bacterial count and live/dead (SG1 + PI) Total viral count (SG1 + EDTA) | Samples were collected from a wastewater treatment plant (in northern China) Total assay time (45 min), Incubation (10 min, viruses; 25 min, bacteria) FCM, ATP, and epifluorescence microscopy | [85] |
| Research Area/Analyzed Matrix | Model Microorganism/ Sample Type/ Sample Location | Detection Target, Fluorochrome(s), and Gating | Sample Preparation and Observation Methods | References |
|---|---|---|---|---|
| Bacterial quantification in the air of an agricultural environment (swine confinement building) | E. coli | A distinction of bacterial cells from other debris (4′,6-diamidino-2-phenylindole (DAPI)) | Aerosol collection with an all-glass impinger-30 and a May multistage liquid impinge Collection liquid (1% peptone, reverse-osmosis-purified H2O with 0.01% Tween 80 and 0.005% Antifoam A) Total sampling time: 30 min, flow rate: 12.5 L/min Incubation (overnight) FCM, fluorescence microscopy, colony count and FISH | [80] |
| Spore analysis and differentiation to other particles in air samples | Phytophthora infestans spores Botrytis cinerea and Alternaria alternata (isolated from potato tissues) | Spore staining [1,1′,3,3,3′,3′-hexamethylindodicarbo-cyanine iodide (DiIC1(5)), 3,3′-dipropylthiadicarbo-cyanine iodide (DiSC3(5)), TO-PRO-3 iodide, SYTO dyes (SYTO 17, 59, 60, 61, 62, 63 and 64), Nile Blue A, Calcocluor white M2R] | Suspensions were either filtered through a single layer of muslin or washed twice Incubation (15 min in the dark) FCM | [77] |
| Microbial contamination in indoor air | Aspergillus versicolor | FCM: Quantitative cell counts and calibration (with gating of FSC and SSC) qPCR: SYBR® Green amplifications with Takara master mix | Bioaerosols were collected from 38 mold-damaged homes with a liquid cyclone air sampler (Coriolis, Bertin Technologies) FCM analysis time (200 s), incubation (n.a. 1) Real-time qPCR calibrated with FCM | [86] |
| Sample | Target Microorganisms | Target Probe (5′-3′ Sequence) and Fluorophore | Sample Preparation/Fixation/Observation Method | References |
|---|---|---|---|---|
| Tomato; Jalapeno; Cilantro; Spinach | Salmonella spp. (spiked) | 23S: Sal3/Salm-63 cocktail Fluorophore: fluorescein; TexasRed, Cy5 | Bacterial removal: adhesive tapes Liquid phase enrichment: tape + TSB or BPW (5 h, 37 °C) Fixation: pelleted (5 min, 2000× g), 10% formalin (30 min, 25 °C) Fluorescence microscopy; flow cytometry | [113] |
| Olive | L. plantarum (spiked/natural) | 16S: LbpV3 (CCGTCAATACCTGAACAG) Fluorophore: fluorescein | Bacterial removal: olives in Ringer’s solution (overnight, RT, shaking); pelleted (8000 rpm, 5 min, RT); Ringer’s solution; Fixation: 4% paraformaldehyde Fluorescence microscopy | [114] |
| Sprouts | S. Typhimurium (spiked) | 23S: Sal-3 (AATCACTTCACCTACGTG) 23S: Salm-63 (GCTGCCTCCCGTAGGAGT) Fluorophore: Cy5; 6-FAM | Bacterial removal: sprouts + 0.1% PW homogenized (1 min, 230 rpm); vacuum filtered (4 layers of sterile cheesecloth; centrifuged (300× g, 30 s); Fixation: supernatant 10% formalin (1:2) 30 min Fluorescence microscopy; Flow cytometry | [115] |
| Swine carcasses | Salmonella spp. (natural) | 23S: Sal3 (AATCACTTCACCTACGTG) Fluorophore: fluorescein | Bacterial removal: swab + BPW w + 0.1% Tween 80; homogenized (90 s) Pre-enrichment: 37 °C, 18 h Fixation: centrifugation (14,000 rpm, 10 min), washed twice (PBS); 4% paraformaldehyde (2 h) Fluorescence microscopy | [116] |
| Swine carcasses | Salmonella spp. (natural) | 23S: Sal3 (AATCACTTCACCTACGTG) Fluorophore: fluorescein | Bacterial removal: swab + BPW w + 0.1% Tween 80; homogenized (90 s) Pre-enrichment: 37 °C, 18 h Fixation: centrifugation (19,500 rpm, 10 min), washed twice (PBS); 4% paraformaldehyde (4 h) Fluorescence microscopy | [117] |
| Minced pork meat | Yersinia spp. (spiked) | 16S: YersEcoI16 (TATTAAGTTATTGGCCTTCCTCCT) 16S: YersEcoII16 (TTAACCTTTATGCCTTCCTCCTC) 23S: YersEco23 (CAAGTCCCTTTACCTAATGCCAGC) 23S: YersPseu23 (ATCACGCCTCAGGGTTGATAAG) 16S: YersPseu16 (GCGTATTAAACTCAACCCCTTCC) 23S, LNA: YersPest1523-TexasRed (CTGCACCGTGGTGCATCGTC) 23S, LNA: YersPseu1523-Alexa488 (CTGCACCGTAGTGCATCGTC) 16S: Yersall-Demaneche (GTTCGCTTCACTTTGTATCT) 16S: EUB-338 (GCTGCCTCCCGTAGGAGT) Fluorophore: Alexa488, TexasRed | Selective enrichment: PSB and ITC broth (48 h) Fixation: pelleted (14,000× g); 4% PBS/formaldehyde (2 h, 4 °C) Fluorescence microscopy | [118] |
| Pork sausage | S. enterica (spiked/natural) | 23S: Sal-3 (AATCACTTCACCTACGTG) Fluorophore: fluorescein isothiocyanate (FITC) | Pre-enrichment: nutrient broth (12 h, 37 °C) Fixation: pelleted (12,500 rpm, 3 min); 4% paraformaldehyde (1 h, 4 °C) Fluorescence microscopy | [119] |
| Ground beef; Ground pork; Milk; Lettuce; Cooked shrimp | L. monocytogenes (spiked) | PNA: LmPNA1253 (GACCCTTTGTACTAT) Fluorophore: Alexa Fluor 568 | Pre pre-enrichment: One Broth Listeria (24 h); 1:10 dilution in One Broth Listeria (18 h) Fixation: Smears on slides; 4% paraformaldehyde (10 min); 50% ethanol (10 min); air dry Fluorescence microscopy | [120] |
| Ground beef | Clostridium perfringens (spiked) | 16S: CLP-180 (AATGATGATGCCATCTTTCAACA) Fluorophore: carboxytetramethylrhodamine (TAMRA) | Bacterial removal: sample + 0.1% peptone water (30 s homogenized) FISH in combination with filter cultivation: 0.1 mL food homogenate + 4 mL TSC-broth; filtered (hydrophilic polypropylene membrane filters); incubation (37 °C, 6 h) Fixation: 2 mL of ethanol (99.5%) (RT, 15 min) Fluorescence microscopy | [121] |
| Chicken | C. jejuni (spiked/natural) | 16S: CAM 1 probe Fluorophore: 5(6)-carboxyfluorescein-N-hydroxysuccinimide ester (FLUOS); tetramethylrhodamine-5-isothyocyanate (TRITC) | Bacterial removal: irradiated product + nutrient broth (2 min homogenized); incubation (1 h at 37 °C) Pre-enrichment: pre-enrichment broth + Preston selective broth (microaerophilic, 37 °C, 22 h Fixation: pelleted; 4% paraformaldehyde (2 h, 4 °C) Fluorescence microscopy | [122] |
| Chicken breast | C. jejuni (spiked) | 23S: Campy268 (AACCCCCAGTGCAAGCACTGGGTTTG)23S, LNA: CampyLNA268 (CCCCCAGTGCAAGCACTGGGTTT) 23S: Campy696 (CACTAGTTCTTACACTAGCTTCAACTTGC) 23S: Campy835 (CTACCCCCTTATATTACGACACAACGC) 23S: Campy1508 (AGCCTTTCAGTTCTCGGAGT) 23S: Campy2124 (CTGGCGTCATATACTCAAAGCCTC) 23S: Campytherm (CTTAGCCCTAAGCGTCCTT) Fluorophore: Alexa488, Texas Red, AMCA | Pre-enrichment: 1:10 in Bolton broth, (1 min homogenized); incubation (microaerophilic 4 h; 37 °C + 44 h, 42 °C) Fixation: 4% formaldehyde (15 min); washed two times in water and end-fixed in 95% ethanol (5 min) Fluorescence microscopy | [10] |
| Minced lamb meat | Salmonella Enteritidis (spiked) | 23S: Salm63 (TCGACTGACTTCAGCTCC) Fluorophore: Cy3 | Pre-enrichment: BPW (37 °C, 18 h) Fixation: 4% paraformaldehyde (30 min, refrigerated) Fluorescence microscopy | [123] |
| Chicken scraps and gizzards; Beef; Pork; Bacon; Salami; Sausage; Fish; Egg; Milk; Milk powder; Cheese; Butter; Ice cream; Pudding; Bell pepper; Lettuce; Bean sprouts | Salmonella Panama (spiked); Salmonella spp. (natural) | 23S: Sal-1 (ACAGCACATGCGCTTTTGTG) 23S: Sal-3 (AATCACTTCACCTACGTG) 23S: Sal-544 (GCAGTCACACAGGTAAAC) Fluorophore: Cy3 | Pre-enrichment: BPW (up to 24 h, 37 °C) Fixation: pelleted (13,000 rpm, 2 min); 3.7% formaldehyde (4 °C, 1 h) Fluorescence microscopy | [124] |
| Fermented sausages; Cured ham; Turkey meat; Lamb meat; Chicken meat; Minced meat (pork and beef); Beef meat; Cottage cheese; Semi-hard cheese; Fresh cheese | Natural microbial community | 16S: EUB338 (GCTGCCTCCCGTAGGAGT) 16S: ALF968 (GGTAAGGTTCTGCGCGTT) 23S: Bet42a (GCCTTCCCACTTCGTTT) 23S: Gam42a (GCCTTCCCACATCGTTT) 23S: HGC69a (TATAGTTACCACCGCCGT) 16S: LGC354ab (YGGAAGATTCCCTACTGC) 16S: Pae (TCTGGAAAGTTCTCAGCA) 16S: Sth (CATGCCTTCGCTTACGCT) 18S: EUK (ACCAGACTTGCCCTCC) Fluorophore:Cy3, 6-carboxyfluorescein (6-FAM) | Bacterial removal meat: PBS (1:4); mixed (5 min); filtered; pelleted (8000 rpm, 10 min) Bacterial removal cheese: PBS (1:4); mixed (5 min); two times centrifugation (buffer (100 mM Na2HPO4, 150 mM NaCl, 10 mM EDTA, 40 mM NaOH); 8000 rpm, 2 min) Fixation: ethanol/PBS (1:1) Fluorescence microscopy | [125] |
| Smoked salmon; Camembert; Uncured ham | Listeria spp. (spiked) | 23S: Lis-1400 (CGCACATTTCCATTCGTGCGATTCC) Fluorophore: TAMRA | Bacterial removal: sample + 0.85% NaCl (30 s homogenized) FISH in combination with filter cultivation: 0.1 mL food homogenate + 4 mL TSC-broth; filtered (hydrophilic polypropylene membrane filters); incubation (37 °C, 12 h) Fixation: ethanol (30 min) Fluorescence microscopy | [126] |
| Smoked salmon; Mozzarella; Julienne cabbage | L. monocytogenes (spiked) | 16S: mRL-2 (AGAATAGTTTTATGGGATTAGCTCCACC) Fluorophore: Alexa647 | Bacterial removal: sample + 0.85% NaCl (30 s homogenized) FISH in combination with filter cultivation: 0.1 mL food homogenate + 4 mL TSC-broth; filtered (hydrophilic polypropylene membrane filters); incubation (37 °C,12 h) Fixation: 50% ethanol (1 h) Fluorescence microscopy | [127] |
| Ikura (traditional Japanese seafood); Minced chicken meat | E. coli (spiked) | 16S: Enterobacteriaceae (TGCTCTCGCGAGGTCGCTTCTCTT) Fluorophore: TAMRA | Bacterial removal: sample + 0.8% NaCl (2 min homogenized) FISH in combination with filter cultivation: vacuum filtered through Isopore membrane filter (0.4 µm pore size); filter incubation (6 h at 37 °C, TSB) Fixation: ethanol (RT) Fluorescence microscopy | [128] |
| Zebra mussels | Cryptosporidium parvum, Giardia lamblia, Encephalitozoon intestinalis, Encephalitozoon hellem, Enterocytozoon bieneusi (natural) | Cry-1 (CGGTTATCCATGTAAAAG) Giar-4 (CGGCGGGGGGCCAATTAC) Giar-6 (CGGGGCTGCCGCGGCGCG) HEL878F (ACTCTCACACTAACTTCAG) INT-1 (GTTCTCCTGCCCGCTTCAG) BIEN-1 (AUCAACGAAUGACUUGA) Fluorophore: HEX, 6-FAM, Tet | Bacterial removal: mussel flesh was homogenized with sterile PBS; the homogenate was sieved, sedimented, and purified over a CsCl2 gradient Fluorescence microscopy | [129] |
| Stilton cheese | Bacteria (natural) | 16S: S-D-Bact-0338-a-A-18 Fluorophore: fluorescein | Fixation: cheese (0.5 × 0.3 × 1 cm) + 3.7% formaldehyde in PBS (3 h); washed in 6.8% sucrose solution in PBS (overnight), dehydrated in acetone (1 h), infiltrated with a plastic solution (8 h); mixed with hardener II (5 min), covered with cover foil (4 °C, 5 h); 5 µm sections were cut (cryostat, 4 °C), immediately straightened in sterile water, attached to lysine-coated slides, air-dried Fluorescence microscopy | [130] |
| Livarot cheese | Bacteria, Yeasts, Candida catenulata, Candida intermedia, Geotrichum spp., Yarrowia lipolytica (natural) | 16S: EUB338 (GCTGCCTCCCGTAGGAGT) 23S: Gam42a (GCCTTCCCACATCGTTT) 23S: HGC69a (TATAGTTACCACCGCCGT) 18S: EUK516 (ACCAGACTTGCCCTCC) 26S: Ccat (TTTATCTCCCGCGCCT) 26S: Cint (TTATCCACCCCTAGCA) 26S: Geo (TTACGGGGCTGTCACCCT) 26S: Ylip (CACTCATTTCCTTCCC) Fluorophore: FITC, Cy3, rhodamine | Bacterial removal: cheese rind + 10 mL (2%) trisodiumcitrate (homogenized: 8000 rpm, 1 min); pelleted and resuspended in 1× PBS Fixation: ice-cold 4% paraformaldehyde (4 °C, 4 h) Fluorescence microscopy | [131] |
| Gruyère cheese | Bacteria; Actinobacteria, Brevibacterium (natural load) | 16S: EUB338 (all bacteria) 16S: HGC1901 (Actinobacteria) 16S: BRE1239 (Brevibacteria) Fluorophore: Cy3 | Bacterial removal: 10 cm2 of the surface + 0.8% NaCl/0.1% peptone solution (homogenized: 2 min) Fixation: pelleted (7000× g, 5 min); 4% paraformaldehyde/PBS (4 °C, 12 h) Fluorescence microscopy | [132] |
| Gruyère cheese | Propionibacterium freudenreichii (natural) | 16S: Pfr435 (CTTGCGCTTCGTCATGGATGAAAG) Fluorophore: 6-FAM | Bacterial removal: 10 g cheese + 2% trisodium citrate (homogenized: 2 min), repeatedly filtered with sterile gauzes; cells were washed four times with sterile PBS and resuspended in 1/10 of the original volume; Fixation: cold 4% paraformaldehyde (4 °C, 16 h) Fluorescence microscopy | [133] |
| Italian cheese | Enterococcus italicus (natural) | 16S: ESA452 (CATTCTCTTCTCATCCTT) Fluorophore: Cy3 | Bacterial removal: cheese + sterile 2% sodium citrate solution (homogenized); centrifuged (8000× g, 15 min, 4 °C) repeated washings (3–5 times) with same buffer, pellets were dissolved in PBS Fixation: freshly prepared cold paraformaldehyde solution (4% in PBS) (4 °C, 16 h) Fluorescence microscopy | [134] |
| Egg; Milk; Mayonnaise | S. Enteritidis (spiked) | PNA (details not specified) Fluorophore: AlexaFluor 594 | Pre-enrichment: sample + pre-warmed BPW (18–21 h, 37 °C) Fixation: 4% paraformaldehyde Fluorescence microscopy | [135] |
| Ground beef; Unpasteurized milk | E. coli O157 (spiked) | 23S, PNA: EcoPNA1169 (CAACACACAGTGTC) Fluorophore: AlexaFluor 594 | Pre-enrichment: sample + pre-warmed BPW or TSB+ novobiocin (18–21 h, 37 °C or 41 °C) Fixation: 4% paraformaldehyde; pretreatment with 1% Triton X-100 to remove background fluorescence Fluorescence microscopy | [136] |
| Raw milk; Pasteurized milk; Raw meat; Ready-to-eat meat; Seafood | Listeria spp. (spiked) | Lis-16S-1 (ACTGTTGTTAGAGAAG) Lm-16S-2 (TAGTACAAAGGGTCG) Lm-16S-3 (CGAATGATAAAGTGT) Lm-16S-4 (CGCATGCCACGCTTT) Liv-16S-5 (ACGCATGTCATCACT) Fluorophore: FAM | Enrichment: according to standard procedures Fixation: centrifugation (2000× g, 5 min), washed PBS, resuspended in PBS, 10 µL placed onto a microscope coverslip, air-dried, fixed with 80% ethanol (15 min) Fluorescence microscopy | [137] |
| Powdered infant formula | Salmonella spp. (spiked) | 23S, DNA: Sal-3 (AATCACTTCACCTACGTG) 23S, DNA: Salm-63 (GCTGCCTCCCGTAGGAGT) PNA: Sal23S10 (TAAGCCGGGATGGC) PNA: SalPNA1873 (AGGAGCTTCGCTTGC) Fluorophore: AlexaFluor 594 | Pre-enrichment: sterile distilled water (8 h, 37 °C) Fixation: pelleted (10,000× g, 5 min), 4% paraformaldehyde (1 h) Fluorescence microscopy | [138] |
| Natural whey starters for Parmigiano Reggiano | Lactobacillus helveticus, Streptococcus thermophilus (natural) | 23S: Lbh1 23S: St4 Fluorophore: FITC, Cy3 | Bacterial removal: whey samples washed twice in PBS, pellets resuspended in PBS. Fixation: 4% freshly prepared cold paraformaldehyde (1 h, 4 °C) Fluorescence microscopy | [139] |
| Dairy starter cultures (PROBAT-like cultures) | Lactococcus lactis subsp. cremoris, L. lactis subsp. lactis, Leuconostoc spp. (natural) | 16S: CREM62 (CCAATCTTCATCGCTCAA) 16S: LAC62 (CCAACCTTCAGCGCTCAA) 16S: LEUC1026 (CACTTTGTCTCCGAAGAG) Fluorophore: Oregon Green | Fixation: pure cultures and cleared PROBAT cultures resuspended in PBS; mixed with equal volume ethanol (96%) Flow cytometry; fluorescence microscopy | [140] |
| Dairy starter cultures | Leuconostoc spp. (natural) | 16S: Leugen2 (GGGCATTACAAACTCCC) 16S: CHCC2114 (ACTTCGTATCATGCGAC) Fluorophore: Cy3, FITC | Fixation: starter cultures centrifuged (5 min, 14,000× g) and washed in PBS; one volume of cell suspension was mixed with three volumes of freshly prepared cold paraformaldehyde solution (4% in PBS; 4 C, 16 h) Fluorescence microscopy | [141] |
| Milk | Enterobacteriaceae; Pseudomonas spp. (spiked) | 16S: Enterobacteriaceae (TGCTCTCGCGAGGTCGCTTCTCTT) 16S: Pseudomonas spp. (GATCCGGACTACGATCGGTTT) Fluorophore: FITC, Cy5 | Milk clearing: 0.5 μL savinase + 100 μL 0.1% Triton X-100 + 100 μL milk (30 °C, 30 min) + 800 μL 150 mM NaCl solution, centrifuged (13,500× g, 5 min, 20 °C), resuspended with PBS; sample filtered (0.2 μm pore size) Colony formation: filter on Standard Methods Agar (37 °C (Enterobacteriaceae) or 30 °C (Pseudomonas spp.), 3–5 h) Fixation: microcolonies dehydrated by a filter paper soaked with 80% ethanol (10 min, RT), air-dried on a new filter paper. Fluorescence microscopy | [142] |
| Raw bovine milk | Helicobacter pylori (natural) | 16S. Hpy-1 (CACACCTGACTGACTATCCCG) Fluorophore: TAMRA | Removal of particulate milk components: milk mixed 2% sodium citrate solution (1 min, speed setting “6” in a BagMixer), centrifuged (5000× g, 10 min, 4 °C), pellets washed twice with 2% sodium citrate; resuspended in PBS Fixation: 4% paraformaldehyde solution (4 °C, 16 h) Fluorescence microscopy | [143] |
| Ultra-heat-treated milk | Bacillus cereus spores (spiked) | 16S: pB394 (ATGCGGTTCAAAATGTTATCCGG Fluorophore: Alexa488 | Fat removal: 25% sodium citrate + milk (5 min, 200 rpm), centrifuged (15,000× g, 5 min), cream adhered to the wall removed; pellet resuspended in TSB + L-alanine + inosine (1 h, 37 °C, 150 rpm) Fixation: pelleted (12,000 rpm, 2 min), 4% paraformaldehyde (15 min) Fluorescence microscopy | [144] |
| Milk | Pseudomonas spp. (spiked) | 16S: Pseudomonas spp. (GATCCGGACTACGATCGGTTT) Fluorophore: TexasRed (TR), FITC | Milk protein and fat removal: 10 µL savinase + 100 µL milk (30 °C, 30–45 min) + 0.15 M NaCl, centrifuged (10,000× g, 22 °C, 5 min), digested proteins and top layer drawn off; bacterial pellet suspended in hybridization buffer Flow cytometry; fluorescence microscopy | [145] |
| Milk | Lactobacillus spp. (spiked) | 16S, PNA: Lac663 (ACATGGAGTTCCACT) Fluorophore: AlexaFluor488 | Fixation: milk pelleted (10,000× g, 5 min), 4% paraformaldehyde (1 h) Fluorescence microscopy | [146] |
| Skimmed milk | Propionibacterium freudenreichii, Lactococcus lactis (spiked) | 16S: GLO62 (AAGGGCCTTACCGTCCGA) 16S: PEU64 (CAAGGGGCCTTACCGTCC) 16S: PFX311 (GGCACGTTCCTCACGTGT) 16S: LactV5 (GCTCCCTACATCTAGCAC) Fluorophore: Cy3, Cy5 | Fixation: sample centrifuged (12,000× g, 2 min); pellets washed twice with PBS; pellet fixed in solution of PBS/ice cold ethanol (12 h, 4 °C) Fluorescence microscopy | [147] |
| Milk | Pseudomonas spp. (spiked) | 16S: P. putida probe (TTGCCAGTTTTGGATGCAGT) 16S: Pseudomonas spp. probe (GATCCGGACTACGATCGGTTT) Fluorophore: Cy5 | Fixation: CTC-stained cells in paraformaldehyde (final concentration: 8%, 4 °C, 1 h) Fluorescence microscopy | [148] |
| Wine | Dekkera bruxellensis (natural) | PNA: BRE26S14 Fluorophore: 5(6)-carboxyfluorescein | Pre-enrichment: wine samples filtered (0.45 µm pore size, HVLP filter membranes; incubation (BSM, 30 °C); grown colonies used without fixation Fluorescence microscopy | [149] |
| Wine | Lactic acid bacteria (natural) | 16S: Lbrev (CATTCAACGGAAGCTCGTTC) 16S: Lcoll (CTTGATTTAACGGGATG) 16S: Lcory (GCTTCGGTCGACGTCAGT) 16S: Lfarc (AGCTTCAATCTTCAGGAT) 16S: Lhilg (CAACTTCATTGACCAAGACGCG) 16S. Lmali (AAGCATTCGRTGAAAGTTTTG) 16S: Lpara (GTTCCATGTTGAATCTCGG) 16S: Lzeae(5′-TTCATCGACCAAAACTC-3′) 16S: Ooeni (5′-TAGTCATTGCCTCACTTCACCCGAA-3′) 16S: Pdamn (5′-GTTGAAATCATCTTCGA-3′) 16S: Pparv (5′-CTAAAATCATCTTCGGTGCAAGCAC-3′) Fluorophore: rhodamine 6G, 5(6)-carboxy-fluorescein-N-hydroxysuccinimide ester, 6-FAM, Alexa Fluor 350, 5(6)-carboxy-tetramethylrhodamine-N-hydroxysuccinimide ester | Bacterial removal: wine samples filtered using a vacuum of 6250 mbar on black polycarbonate filters (0.2 µm pore size) Fixation: overlaying the filter twice with PBS; 96% ethanol added (3 min, RT); cell permeabilization with lysozyme Fluorescence microscopy | [150] |
| White and red must industrial fermentations | Yeasts (natural) | 26S: Cst (CTCTATGGCGTTTCTTTC) 26S: Hgu (CAATCCCAGCTAGCAGTAT) 26S: Huv (TCAATCCCGGCTAACAGTA) 26S: Kma (AGCTACAAAGTCGCCTTC) 26S: Kth (ATAGGACTAGACTCCTCG) 26S: Pan (GACAGGCAATATCAGCAGA) 26S: Pme (AGAGCTTCGCACGGCACC) 26S: Sce (TGACTTACGTCGCAGTCC) 26S: Tde (GCAGTATTTCTACAGGAT) Fluorophore: FITC | Colony preparation: yeast counting on CRB medium; 30 colonies picked for yeast identification Fixation: 4% paraformaldehyde (4 h, 4 °C) Fluorescence microscopy | [151] |
| Wine fermentation | S. cerevisiae, Hanseniaspora guilliermondii (spiked) | 26S: S. cerevisiae (CAATCCCAGCTAGCAGTAT) 26S: H. guilliermondii (TGACTTACGTCGCAGTCC) Fluorophore: FITC | Bacterial removal: samples centrifuged (5 min, 5000× g), cells washed once with PBS Fixation: 4% paraformaldehyde (3 h, 4 °C, strong agitation) Flow cytometry; fluorescence microscopy | [152] |
| Wine fermentations | S. cerevisiae, Hanseniaspora uvarum, Starmerella bacillaris (spiked/natural) | 26S: Cst (CTCTATGGCGTTTCTTTC) 26S: Hgu (CAATCCCAGCTAGCAGTAT) 26S: Huv (TCAATCCCGGCTAACAGTA) 26S: H8a (TGAGAGGCCCAAGCCCAC) 26S: H8b (AGGTAATCCCAGTTGGTT) 26S: H8b-Com (AGGCAATCCCGGTTGGTT) 26S: Sce (TGACTTACGTCGCAGTCC) 26S: Sba (CTCCATGGCGCTCCTTTC) Fluorophore: FITC | Bacterial removal: samples centrifuged (10,000 rpm, 5 min), resuspended in 1× PBS Fixation: 4% paraformaldehyde (1 h, 4 °C, 1000 rpm) Flow cytometry; fluorescence microscopy | [153] |
| Wine fermentations | S. cerevisiae, H. guilliermondii (spiked) | 26S: S. cerevisiae (CAATCCCAGCTAGCAGTAT) 26S: H. guilliermondii (TGACTTACGTCGCAGTCC) Fluorophore: FITC | Bacterial removal: samples centrifuged (5000 rpm, 5 min), resuspended in 1× PBS Fixation: 4% of paraformaldehyde for (4 h, 4 °C, 1000 rpm); DAPI/PI staining prior to fixation for viability testing Flow cytometry; fluorescence microscopy | [154] |
| Red and white wine | Dekkera bruxellensis (spiked) | 26S: Dkb271 (CCTTCCTCCTCTCTAGT) Fluorophore: ATTO 647N | Bacterial removal: cells recovered via centrifugation, washed with PBS Fixation: absolute ethanol (1 h, RT) Flow cytometry; fluorescence microscopy | [155] |
| Beer | P. cerevisiiphilus, Pectinatus frisingensis (spiked) | 16S: Pf469 (CATTCACTATACTTATTGGC) 16S: Pc469 (CATTCAATAGTGGTATTAAC), 16S: Pc593 (AAGATCCGCTTAGTCATCCG), 16S: Pc640 (AAGATGACCAGTTCGAATCC) Fluorophore: FITC | Bacterial removal: centrifugation (5 min, 10,000× g), suspended in sterile PBS Fixation: PBS + 99% ethanol (1:1; 30 min) Fluorescence microscopy | [156] |
| Vinegar | Acetic acid bacteria (natural) | 16S: Komag (GAACCTTTCGGGGTTAGTG) Fluorophore: FITC | Bacterial removal: centrifugation (2000× g, 4 °C, 10 min), washed with PBS Fixation:4% paraformaldehyde (4 °C, 12 h) Flow cytometry | [157] |
| Glass, Polypropylene Polyethylene, Polyvinyl chloride, Copper, Silicone rubber, Stainless steel | S. enterica/ L. monocytogenes/E. coli single, dual and tri-species biofilms (laboratory grown) | 23S, PNA: SalPNA1873 16S, PNA: LmPNA1253 (GACCCTTTGTACTAT) Fluorophore: Alexa594, Alexa488 | Biofilm preparation: 24–48 h biofilm formation on different materials Sample preparation: biofilm coupons in distilled water; sonicated for 5 s at 25% amplitude; centrifugation (10,000 rpm, 5 min) Fixation: 4% paraformaldehyde for 1 h Fluorescence microscopy; confocal laser scanning microscopy | [158] |
| Polyvinyl chloride coupons | H. pylori (natural) | PNA: (TAATCAGCACTCTAGCAA) Fluorophore: carboxyfluorescein | Sampling: semi-circular flow cells containing PVC coupons placed in a bypass of a drinking water distribution system, sampling after up to 72 d Fixation: coupons in 90% ethanol, 10 min Fluorescence microscopy | [159] |
| Conveyor in brewery | Natural biofilm | EUB338 EUK502 ARCH915 ALF968 BET42a GAM42a XAN818 HGC69a LGC-354A-C CF319a PLA46 AG1427 Ent183 Pae997 Hpae1 (GAAGGCACCAATCCATC) Hpae2 (TGTCAAGGCCWGGTAAGG) Fluorophore: not given | Sample preparation: removal of biofilms, lubricants, and rubbed-off conveyor material sampled with sterile spatula; washing twice with sterilized water and decane; centrifugation to remove decane Fixation: paraformaldehyde or ethanol | [160] |
| Stainless steel coupons | Arcobacter brutzleri Arcobacter cryaerophilus Arcobacter skirrowii C. jejuni C. coli biofilms (spiked) | Arc94Cy3 (TGCGCCACTTAGCTGACA) CathermCy3 (GCCCTAAGCGTCCTTCCA) EUB338FAM (GCTGCCTCCCGTAGGAGT) Fluorophore: Cy3, FAM | Biofilm preparation: stainless steel coupons in casein peptone soymeal-peptone broth containing 107 cfu/mL bacteria; culturing for 78 h at 25 °C under aerobic or microaerobic conditions Sample preparation: coupons wiped with sterile swabs; swabs with biofilm shaken in PBS (2 min, vortex); centrifugation (16,500× g, 5 min, 21 °C) Fixation: 2% formaldehyde, 24 h, 4 °C Fluorescence microscopy | [161] |
| Sample | Target Microorganisms | Target Probe (5′-3′ Sequence) and Fluorophore | Sample Preparation/Fixation/Observation Method | References |
|---|---|---|---|---|
| Water | E. coli (spiked) | 16S: ES445 (CTTTACTCCCTTCCTCCC) Fluorophore: Cy3 | Fixation: formalin (final conc. 2%) Semi-automatically polydimethylsiloxane-glass hybrid microfluidic device; fluorescence microscopy | [163] |
| Tap water | C. coli (spiked) | 16S, PNA: CJE195 Fluorophore: TAMRA | Bacterial removal: samples filtered through a track etch black membrane filter (0.2 µm) Fixation: smear air dried, gently flamed; 90% ethanol (10 min), air-dried Fluorescence microscopy | [164] |
| Water | Mycobacterium avium (spiked) | 16S, PNA: MAV148 (TGCGTCTTGAGGTCC) Fluorophore: 6-FAM | Bacterial removal: filtered through membrane filter (0.2 µm); filter shaking with 6 mL of the original water filtrate and glass beads Fixation: smear air dried, gently flamed; 90% ethanol (10 min), air-dried Fluorescence microscopy | [165] |
| Freshwater lake | Microcystis aeruginosa Planktothrix rubescens Planktothrix agardhii (spiked) | Probes labeled with horseradish peroxidase 16S: EUB338 (GCTGCCTCCCGTAGGAGT) 16S: MICR3 (TCTGCCAGTTTCCACCGCCTTTAGGT) mcyA-mRNA: MCYA (ATGAGCCGCCAATAAAACACTTT) Fluorophore: FITC-labeled tyramides | Sample preparation: filtration of water Fixation: 1% paraformaldehyde, 15 min, RT Fluorescence microscopy | [166] |
| Lakes; Oceans | Natural load | 16S: EUB338 (GCTGCCTCCCGTAGGAGT) 16S: NON338 (ACTCCTACGGGAGGCAGC) 16S: ALF968 (GGTAAGGTTCTGCGCGTT) 23S: BET42a (GCCTTCCCACTTCGTTT) 23S: GAM42a (GCCTTCCCACATCGTTT) 16S: CF319a (TGGTCCGTGTCTCAGTAC) 16S: PLA886 (GCCTTGCGACCATACTCCC) 16S: ARCH915 (GTGCTCCCCCGCCAATTCCT) Fluorophore: Cy3 | Sample preparation: concentration of water samples on white polycarbonate filters (0.2 µm pore size) Fixation: 4% paraformaldehyde, 30 min, RT Fluorescence microscopy | [168] |
| Seawater | Natural load | 16S: EUB338 (GCTGCCTCCCGTAGGAGT) Fluorophore: Cy5 | Sample preparation: large plankton particles removed by gravity filtration on 10 µm mesh; gravity filtration on 3 µm polycarbonate membranes Fixation: 2% formaldehyde, 60 min, dark, RT Microfluidic flow cytometry | [167] |
| Seawater | Heterosigma akashiwo (natural) | Probes labeled with horseradish peroxidase HSIG 1451 (CCCTCGGCAAGTCACAAT) NONEUB338 (ACTCCTACGGGAGGCAGC) EUK1209 (GGGCATCACAGACCTG) Fluorophore: not given | Fixation: 0.1% formaldehyde, 1 h, RT Fluorescence microscopy; flow cytometry | [170] |
| Seawater | Marine bacteria (natural) E. coli (spiked) | Probes labeled with horseradish peroxidase 16S: EUB338 16S: NONEUB338 Fluorophore: Alexa488 labeled tyramides | Sample preparation: samples pre-filtered on a 3-μm-diameter pore-size membrane Fixation: 2% paraformaldehyde, 1 h, RT Fluorescence microscopy; flow cytometry | [171] |
| Lake water | Ultramicrobiota (natural) | Probes labeled with horseradish peroxidase 23S: BET42a 16S: LD12-121 16S: NON338 16S: LD12-115 (CTGAACCACAAGGCAGATTCCCACAT) Fluorophore: Fluorescein-labeled tyramides Anti-Fluorescein-HRP conjugate | Sample preparation: samples pre-filtered on a 0.8-μm-diameter pore-size membrane Fixation: 1.7% paraformaldehyde, 15 min, 4 °C, collected on filters Fluorescence microscopy; flow cytometry | [172] |
| Seawater | Bacterioplankton (natural) | Probes labeled with horseradish peroxidase 23S: BET42a (GCCTTCCCACTTCGTTT) 16S: CF319a (TGGTCCGTGTCTCAGTAC) 16S: EUB338 (GCTGCCTCCCGTAGGAGT) 16S: NONEUB338 (ACTCCTACGGGAGGCAGC) 16S: ALF968 (GGTAAGGTTCTGCGCGTT) 23S: GAM42a (GCCTTCCCACATCGTTT) ROS537 (CAACGCTAACCCCCTCC) OM43-162 (ATGCGGCATTAGCTAACC) Nso190 (CGATCCCCTGCTTTTCTCC) Nso1225 (CGCCATTGTATTACGTGTGA) SAR86-1245 (TTAGCGTCCGTCTGTAT) Fluorophore: Alexa546, Alexa488 | Fixation: 2% formaldehyde, <24 h, 4 °C, collected on filters Fluorescence microscopy; flow cytometry | [173] |
| Seawater | E. coli (spiked) | 16S: Eco541 (CCGATTAACGCTTGCACC) 16S: Eco1482 (TACGACTTCACCCCAGTC) Fluorophore: FITC | Sample preparation: spiked and nonspiked seawater filtered through 15 µm membrane; centrifugation (4000× g, 4 °C, 15 min) two times Fixation: 4% cold paraformaldehyde, 4 °C, 16–18 h Fluorescence microscopy; flow cytometry | [174] |
| Seawater | Vibrio cholerae | TaqMan probe (TCAACCGATGCGATTGCCCAAGA) Fluorophore: Alexa488 | Fixation: 4% cold paraformaldehyde, 4 °C, overnight Fluorescence microscopy; flow cytometry | [169] |
| Sample | Target Microorganisms | Target Probe (5′-3′ Sequence) and Fluorophore | Sample Preparation/Fixation/Observation Method | References |
|---|---|---|---|---|
| Laboratory-generated bioaerosols; Native bioaerosols in swine barn | P. aeruginosa E. coli (spiked) Natural load | 16S: TR-EUB (GCTGCCTCCCGTAGGAGT) fl-PSMg (CCTTCCTCCCAACTT) 16S: TR-NotEUB (ACTCCTACGGGAGGCAGC Fluorophore: Texas Red, fluorescein | Sampling: 30 min sampling time, 12.5 L/min flow rate into 20 mL of medium or 20 L/min into 8 mL of medium Fixation: 1% formaldehyde for microscopy; 4% paraformaldehyde for flow cytometry Fluorescence microscopy; flow cytometry | [80] |
| Air in a sow breeding barn | Natural load | EUB mix NONEUB ALF968 ARCH915 BET42a CF319a+b CLOST I GAM42a HGC69a LGC354abc PF2 SAU SRB385 STR Fluorophore: FLUOS, Cy3 | Sampling: filtering air onto a 25-mm-thick glass fiber filter, 1–4 d; average air flow of 200 m3/h; bioaerosols eluted into a sealed container by washing the filters in sterile filtered tap water Fluorescence microscopy | [175] |
| Bioaerosols in swine buildings | Natural load | 16S: fl-Univ (ACGGGCGGTCGTGT(AG)C) 16S: fl-EUB (GCTGCCTCCCGTAGGAGT) 16S: cy-EUK (ACCAGACTTGCCCTCC) 16S: fl-PSMg (CCTTCCTCCCAACTT) 16S: fl-NotEUB (ACT-CCT-ACG-GGAGGCAGC) Fluorophore: Fluorescein, Cy3 | Sampling: AGI sampler with 12.5 L/min flow rate for 40 min Fixation: 4% cold paraformaldehyde | [176] |
| Air from a compost plant treating | Natural load | POD-labeled probes | Sampling: MD8 air samplers with 3.0 µm gelatin filters; filters incubated on top of CASO agar (30 °C, 24–48 h) Chemiluminescence detection | [177] |
| Aerosols of water | Legionella pneumophila serogroup 1 strain (Spiked/natural) | 16S: LEG705 (CTGGTGTTCCTTCCGATC) Fluorophore: carbocyanine | Sampling: impaction onto agar (Andersen sampler); impingement into liquid (SKC Biosampler (Arelco); filtration (collectron MD8 (Sartorius) Fixation: 3.7% formaldehyde, 30 min Fluorescence microscopy | [178] |
Publisher’s Note: MDPI stays neutral with regard to jurisdictional claims in published maps and institutional affiliations. |
© 2021 by the authors. Licensee MDPI, Basel, Switzerland. This article is an open access article distributed under the terms and conditions of the Creative Commons Attribution (CC BY) license (https://creativecommons.org/licenses/by/4.0/).
Share and Cite
Zand, E.; Froehling, A.; Schoenher, C.; Zunabovic-Pichler, M.; Schlueter, O.; Jaeger, H. Potential of Flow Cytometric Approaches for Rapid Microbial Detection and Characterization in the Food Industry—A Review. Foods 2021, 10, 3112. https://doi.org/10.3390/foods10123112
Zand E, Froehling A, Schoenher C, Zunabovic-Pichler M, Schlueter O, Jaeger H. Potential of Flow Cytometric Approaches for Rapid Microbial Detection and Characterization in the Food Industry—A Review. Foods. 2021; 10(12):3112. https://doi.org/10.3390/foods10123112
Chicago/Turabian StyleZand, Elena, Antje Froehling, Christoph Schoenher, Marija Zunabovic-Pichler, Oliver Schlueter, and Henry Jaeger. 2021. "Potential of Flow Cytometric Approaches for Rapid Microbial Detection and Characterization in the Food Industry—A Review" Foods 10, no. 12: 3112. https://doi.org/10.3390/foods10123112
APA StyleZand, E., Froehling, A., Schoenher, C., Zunabovic-Pichler, M., Schlueter, O., & Jaeger, H. (2021). Potential of Flow Cytometric Approaches for Rapid Microbial Detection and Characterization in the Food Industry—A Review. Foods, 10(12), 3112. https://doi.org/10.3390/foods10123112