Article

Detection of Species Substitution in the Meat Value Chain by High-Resolution Melting Analysis of Mitochondrial PCR Products

by
Jane Kagure Njaramba
1,2,
Lillian Wambua
3,*,
Titus Mukiama
2,
Nelson Onzere Amugune
2 and
Jandouwe Villinger
1
1
International Centre of Insect Physiology and Ecology (icipe), Nairobi P.O. Box 30772-00100, Kenya
2
Department of Biology, University of Nairobi, Nairobi P.O. Box 30197-00100, Kenya
3
Animal and Human Health Division, International Livestock Research Institute, Nairobi P.O Box 30709-00100, Kenya
*
Author to whom correspondence should be addressed.
Foods 2021, 10(12), 3090; https://doi.org/10.3390/foods10123090
Submission received: 28 September 2021 / Revised: 24 November 2021 / Accepted: 3 December 2021 / Published: 13 December 2021
(This article belongs to the Section Food Analytical Methods)

Abstract

:
Substituting high commercial-value meats with similar cheaper or undesirable species is a common form of food fraud that raises ethical, religious, and dietary concerns. Measures to monitor meat substitution are being put in place in many developed countries. However, information about similar efforts in sub-Saharan Africa is sparse. We used PCR coupled with high-resolution melting (PCR-HRM) analysis targeting three mitochondrial genes—cytochrome oxidase 1 (CO1), cytochrome b (cyt b), and 16S rRNA—to detect species substitution in meat sold to consumers in Nairobi, Kenya. Out of 107 meat samples representing seven livestock animals, 11 (10.3%) had been substituted, with the highest rate being observed in samples sold as goat. Our results indicate that PCR-HRM analysis is a cost- and time-effective technique that can be employed to detect species substitution. The combined use of the three mitochondrial markers produced PCR-HRM profiles that successfully allowed for the consistent distinction of species in the analysis of raw, cooked, dried, and rotten meat samples, as well as of meat admixtures. We propose that this approach has broad applications in the protection of consumers against food fraud in the meat industry in low- and middle-income countries such as Kenya, as well as in developed countries.

1. Introduction

Food fraud, the intentional act of adulterating food products, often for dishonest economic gain, is an emerging concern in global trade as a crime against consumer rights and due to the inherent risks posed to public health. Food fraud is largely perpetrated by counterfeit descriptions of products with respect to their weights, details of origin, types of processing, and constituents (ingredients) [1]. Food fraud has been reported in most value chains, including spices [2,3], milk [4,5], edible oils [6], honey [7], fish [8,9], shellfish [10], cereals [11,12], vegetables [13], and meat [14,15], whereby the fraudulent substitution of ingredients or the adulteration of products with similar but cheaper options have been highlighted as major malpractice.
In the meat industry, the major fraudulent practice entails substituting meats of high commercial value with those from cheaper or undesirable species [14,16]. Major global incidences of species substitution have been reported, such as the horsemeat scandal in the UK and Ireland, where beef was substituted with horse meat [17], and in China, where mutton was substituted with murine meat [18]. In Kenya, the substitution of beef and chevron with bushmeat [19], in addition to reports of species substitution [20], necessitates the further study of efficient methods for detecting this malpractice in meat value chains. Species substitution in meat products inhibits fair trade [21] and raises ethical and religious concerns in which species substitutes are considered offensive [14,22]. Undeclared meat species are also a health liability to those with allergies [17] and are associated with public health safety risks, such as those posed by foodborne or zoonotic diseases. Substituted species utilized are frequently acquired from unconventional sources, such as wildlife (bushmeat), which may be subjected to unhygienic handling and may not undergo quality checks like meat inspection [23].
The detection of adulteration in the meat value chain relies on analytical techniques, such as chromatography, mass spectrophotometry, imaging, and serology, to identify particular contaminants, proteins, and metabolites, and to validate authenticity [15,16,24]. However, for the analysis of species substitution, DNA-based techniques have been increasingly adopted due to the inherent limitations in specificity and sensitivity associated with the aforementioned techniques [24], leading to the recognition of “Food Forensics” as a tool to investigate food fraud [13]. The use of DNA to identify species on the basis of universal barcoding markers has been reliably tested [16,19]. Previous studies have demonstrated the potential application of DNA sequencing to identify adulteration in meat products based on the CO1 and cyt b genes [25,26]. While useful, the need for elaborate and relatively expensive post-PCR procedures, such as DNA sequencing, severely limits their usefulness in the routine monitoring of meat fraud in Kenya and other low-resource settings. A more recent technique, PCR coupled with high-resolution melting (HRM) analysis, allows for discriminating DNA variants by detection of nucleotide sequence differences, such as single nucleotide polymorphisms (SNPs) and insertions and deletions (indels) based on their melting profiles, hence enabling the genotyping of species [27].
High-resolution melting analysis utilizes dyes that fluoresce when bound to double-stranded DNA to allow for the discrimination of DNA sources based on their genetic disparity, which is evaluated by analyzing their dissociation curves [27,28]. The distinct curves, which are dependent on amplicon GC-content and sequence composition and length, allow for the distinction of closely related species [27], making it a useful tool in food authentication [28]. These curves are generated by measuring the fluorescence of amplicons as the temperature is gradually increased at a rate of 0.01–0.2 °C per second. Past studies have shown that in food analysis, HRM is an accurate, cost- and time-effective method for the detection of adulterants or the distinction of close species in fish and shellfish [9,10], meat [29], dairy products [5], honey [7], and saffron [3]. PCR-HRM approaches using multiple markers can increase the precision of analysis when some species are difficult to differentiate by one marker alone and can be evaluated by a process of elimination [19]. Such an approach has been used to identify vertebrate species in insect blood meals [30] and bushmeat [19].
Nevertheless, the accuracy of results for DNA-based analyses fundamentally depends on obtaining quality DNA to identify the species origins of frozen, cooked, processed, rotting, or mixed meat products [15,16,29], and the effect of different physicochemical states of meat on PCR efficiency remains understudied. Therefore, we studied the utility of a previously validated PCR-HRM analysis assay targeting CO1, cyt b, and 16S rRNA genes [19] to investigate species substitution in Nairobi, Kenya. We also aimed to test the effect of various food processing techniques on meat samples (e.g., fresh, dried, cooked, or rotten meat), different DNA extraction protocols, and admixtures of different species on identification by PCR-HRM analysis.

2. Materials and Methods

2.1. Meat Samples

We purchased 107 meat samples (whole pieces) in November 2018 from randomly selected stalls in Nairobi’s major meat wholesale market (Burma market) and butcheries in the surrounding districts of Eastleigh, Kariokor, Kaloleni, Mukuru Village, Mathare, Jerusalem, Jericho, Ngara, and Makongeni. Meat samples of species commonly bought by households were purchased, including 61 cattle, 30 goat, 3 camel, 9 pig, and 4 chicken samples. Each 250 g sample was packed separately and transported in cooler boxes with ice packs to the lab. Sub-samples (1 g) were carefully excised from the internal portion of each sample to obtain two replicates. Sterile blades and fresh gloves were used for each sample on a sterile surface. The replicates were then stored in 2 mL cryovials at −80 °C, pending DNA extraction. Reference meat samples (voucher specimen) from 24 vertebrates that were characterized and archived from a previous study [19] were used as positive controls (Table S1, Figure S1). Genomic DNA was DNA-extracted from the sub-samples using the ISOLATE II Genomic DNA Extraction Kit (Bioline, London, UK) following the manufacturer’s instructions.

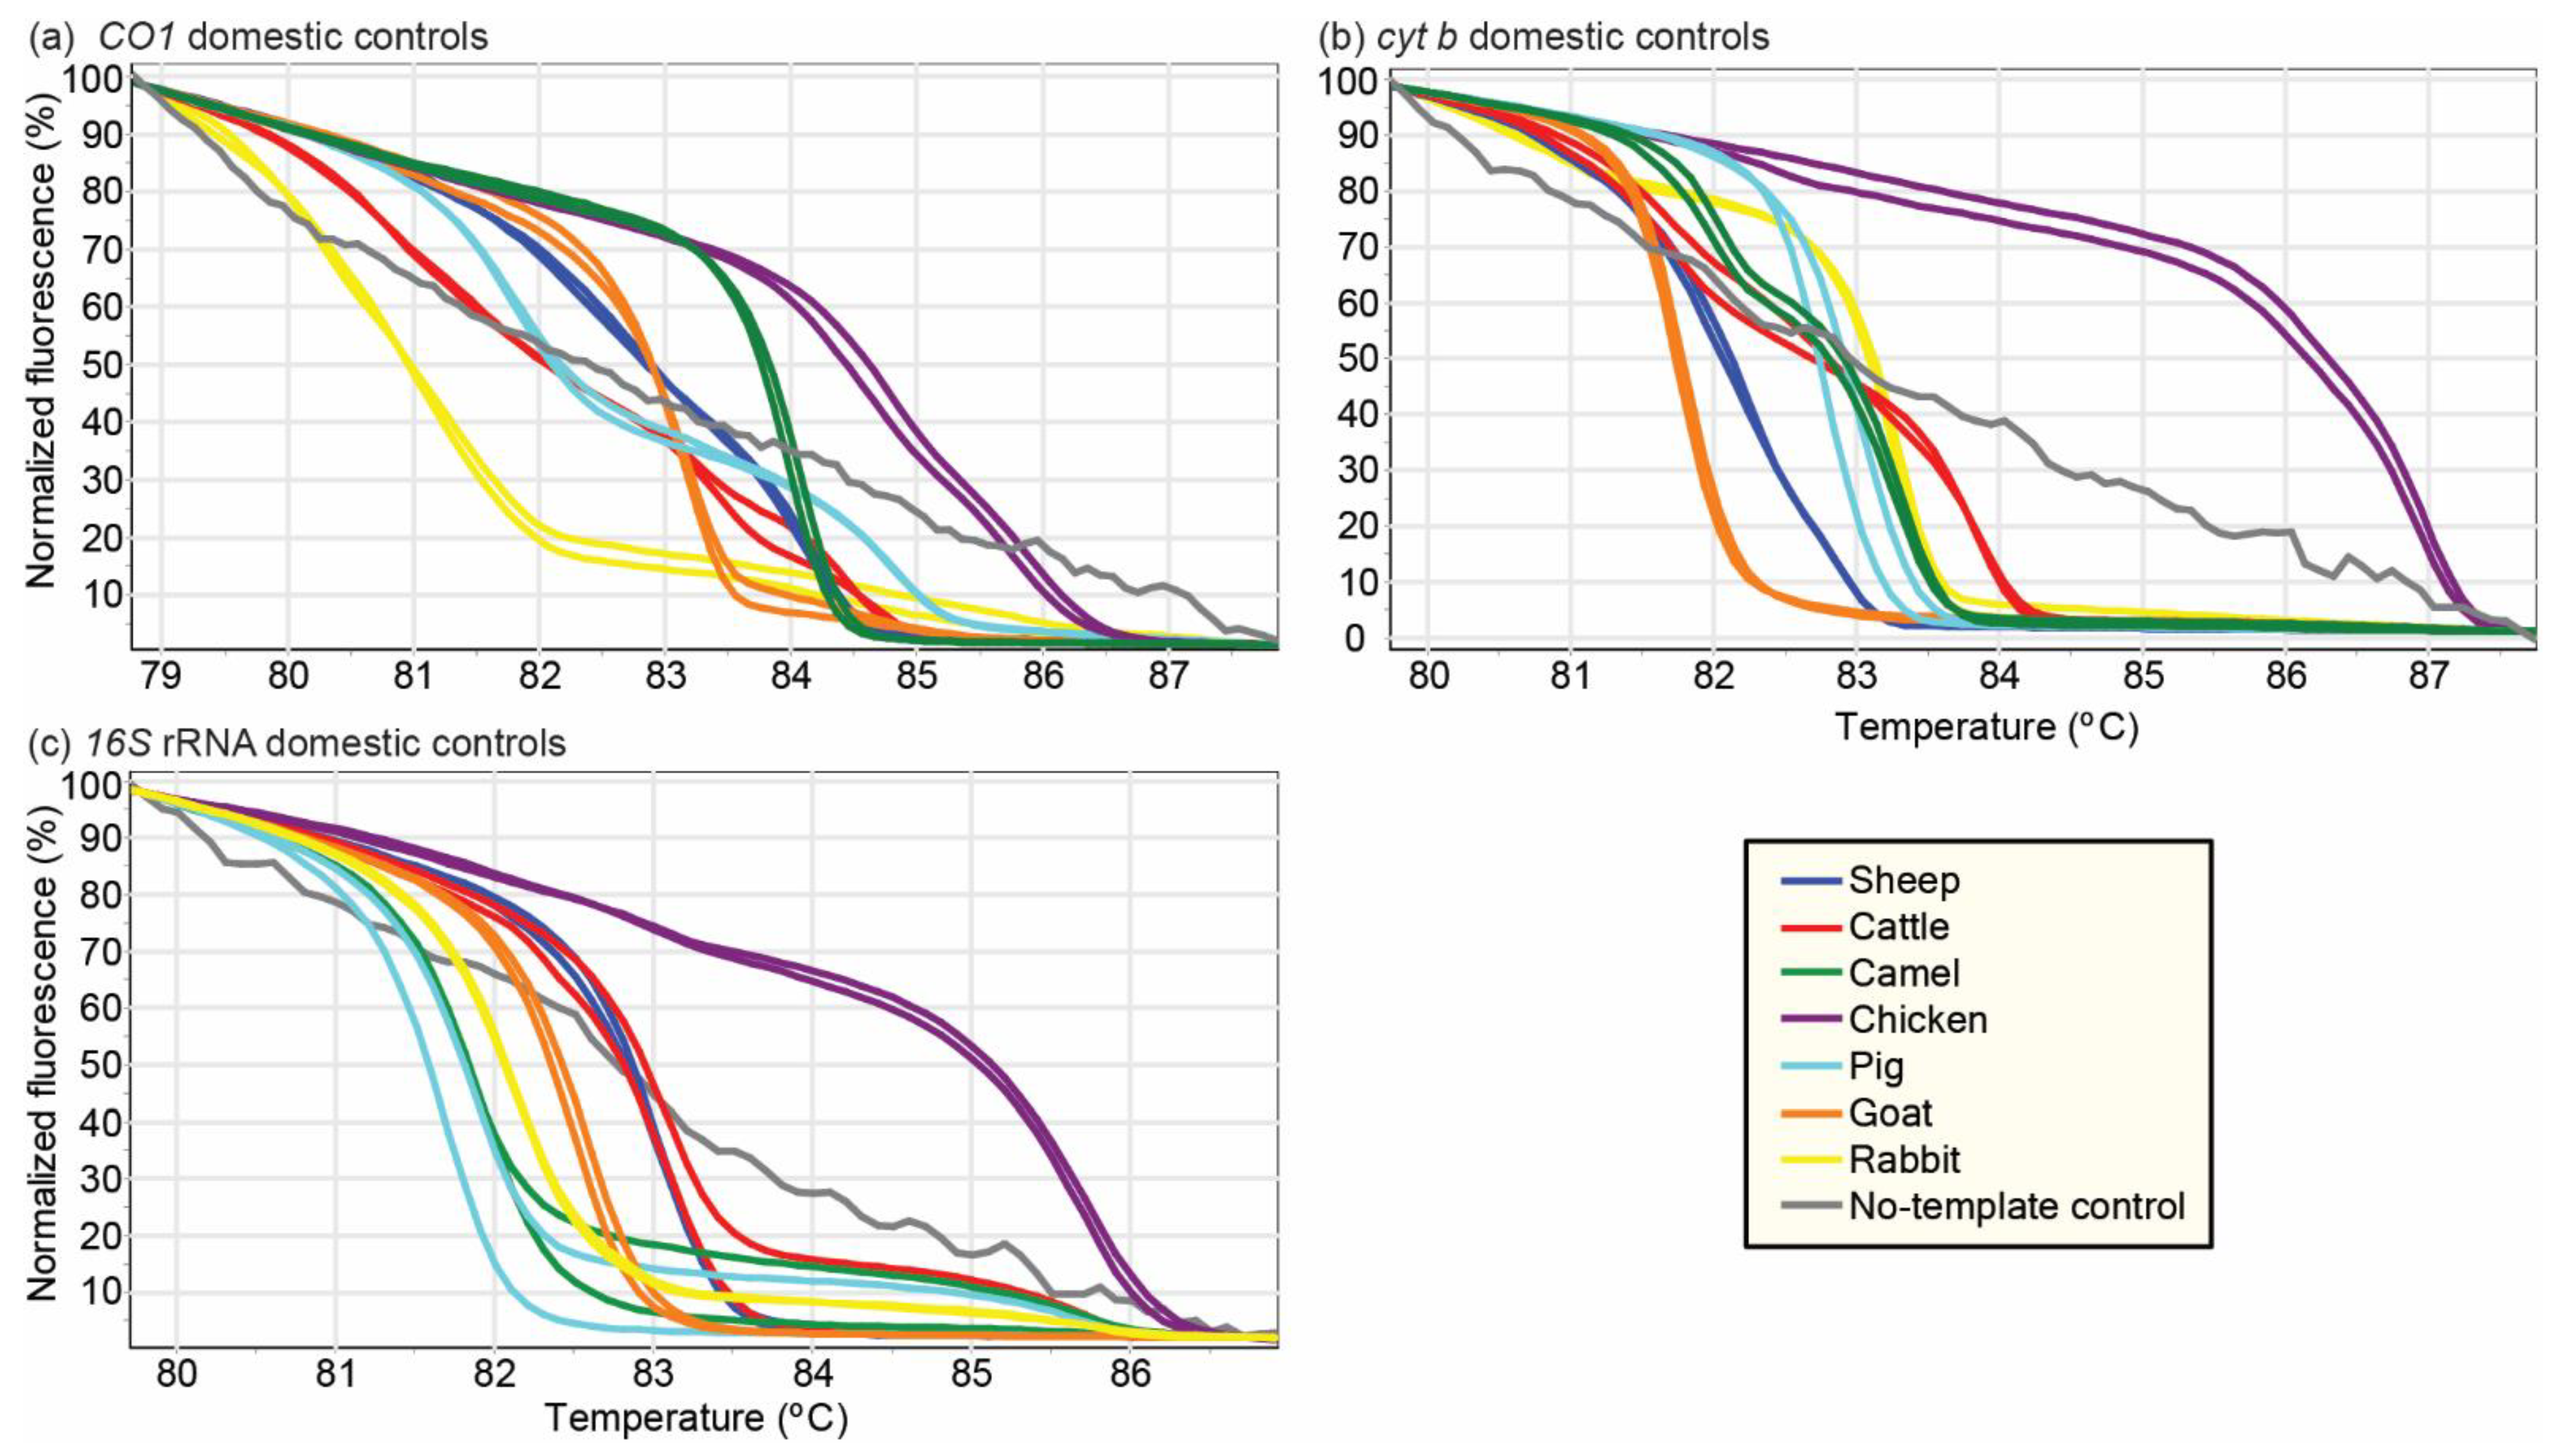
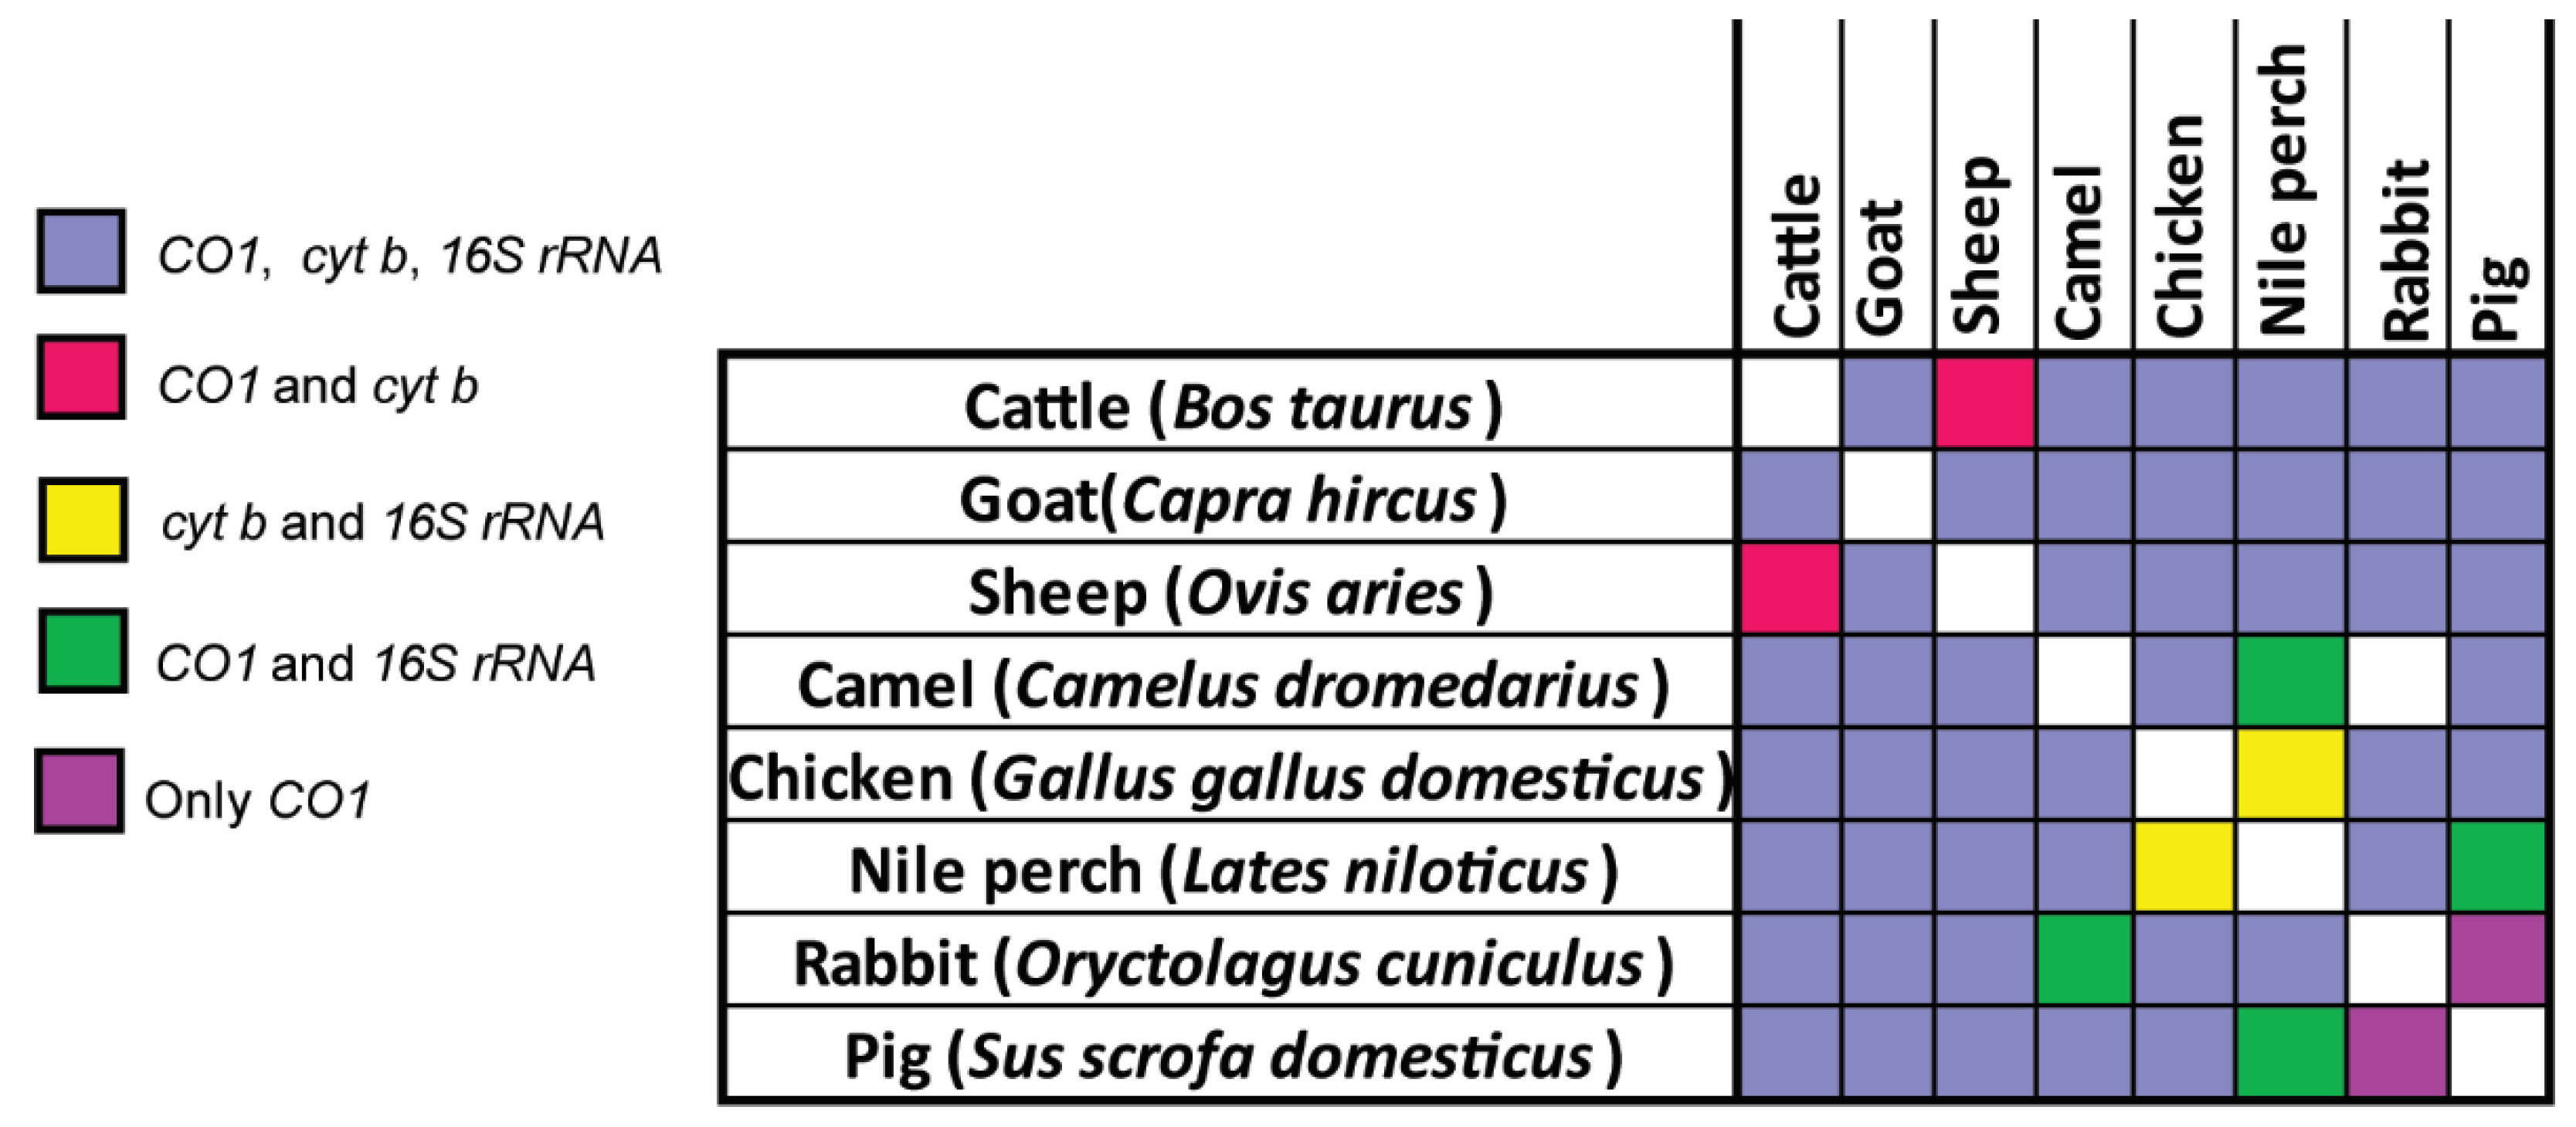
2.2. Identification of Vertebrate Sources of Meat by PCR-HRM

To identify the vertebrate species, DNA extracts from the test samples and positive controls (reference samples) were analyzed by PCR-HRM of vertebrate mitochondrial cyt b, CO1, and 16S rDNA, as previously described, and validated [19,30]. Briefly, 10 µL PCR reactions were set up, each comprising 1× HOT FIREPol® EvaGreen® HRM Mix no ROX (Solis BioDyne, Tartu, Estonia), 0.5 µM of both forward and reverse primers (Table 1), 20 ng of DNA template, and nuclease-free water. Each run included a negative control in which ddH2O was added in place of DNA template. The PCR-HRM analyses were carried out in a RotorGene Q thermocycler (Qiagen, Germany) as described by Ouso et al. (2020) [19]. Briefly, the cycling conditions involved an initial hold at 95 °C for 15 min, followed by 45 cycles of denaturation at 95 °C for 20 s, annealing for 20 s at 56 °C, and an extension step at 72 °C for 30 s. This was followed by the final extension step, an additional 5 min at 72 °C. The amplicons were then gradually melted from 75 °C to 95 °C in 0.1 °C increments while recording the fluorescence every two seconds. The melt rate and normalized HRM graphs were generated from the fluorescence data using Rotor-Gene Q Series software (Version 2.3.1 build 49). Meat-source species were distinguished by analyzing the melt rate (melting temperature (Tm) peaks) and normalizing the profiles of the test samples against those of the reference species (voucher specimen). For species with single Tm peaks, we also examined the Tm deviation from the control, with similar species expected to have Tm shifts of <1 °C.

2.3. Analysis of Various Physicochemical Treatments of Meat on PCR-HRM

To study the effect of various physicochemical conditions of meat samples on species identification by PCR-HRM analysis, we utilized sub-samples from our collection of positive controls (see Table S1). Sub-samples of goat (Capra hircus), sheep (Ovis aries), pig (Sus scrofa domesticus), chicken (Gallus domesticus), cattle (Bos taurus), and camel (Camelus dromedarius) were exposed to different treatments to simulate fresh, dried, cooked (microwaved), and rotting/decomposed meat. This was achieved by obtaining four replicates weighing 60 mg from each sub-sample and treating them as follows: the first replicate was used as the fresh meat with no treatment applied; the second replicate was dried in an oven at 65 °C for 2 h; the third replicate was heated in a microwave oven for 12 min to simulate cooking; the fourth replicate was left on the lab bench for 72 h to decompose. Genomic DNA was extracted from the replicates of all samples as described above in Section 2.1, followed by PCR-HRM of the CO1 gene, cyt b, and 16S rRNA genes, as described in Section 2.2.

2.4. Analysis of Effect of Different Extraction Protocols

To study the impact of different DNA extraction protocols on species identification by PCR-HRM, sub-samples were obtained from two cattle, four goats, one sheep, and two camels, as described in Section 2.3, and subjected to four extraction protocols. Each sub-sample was divided into four 50 mg replicates and the DNA was extracted as follows: The first replicate was extracted using the ISOLATE II Genomic DNA Kit, as described in Section 2.1, and the second using the DNeasy Blood and Tissue Kit protocol (Qiagen, Germany) according to the manufacturer’s guidelines. The third replicate was extracted using a lab-optimized protocol described by Kipanga et al. [36]. The fourth replicate was extracted using a modified version of the aforementioned protocol, in which proteinase K was omitted during the cell lysis step. The extracted DNA was then standardized to 10 ng/µL and analyzed using the PCR-HRM of CO1, cyt b, and 16S rRNA, as described in Section 2.2. The melt profiles were then compared to check for any differences in melt temperature or profile due to the varying extraction protocols.

2.5. Analysis of Species Admixtures in Meat by PCR-HRM

We investigated whether PCR-HRM could be successfully used to identify mixed species in meat, which is a common adulteration in processed meat. The following mixtures were prepared from the reference samples: cattle + sheep; sheep + goat; cattle + goat; cattle + camel; chicken + pork; chicken + Nile perch. In each case, triplicates containing 50 mg of each of the two species in the combinations above were placed into separate tubes. The genomic DNA was then extracted from the individual triplicates using the ISOLATE II Genomic DNA Kit, as described in Section 2.1. This protocol was selected because it produced high-quality DNA with a standardized concentration of ~40 ng/µL. This was followed by PCR-HRM analysis of the three mitochondrial markers (CO1, cyt b, and 16S rRNA), as previously described. DNA extracts from individual reference samples, that is, individual voucher specimens of cattle, sheep, goat, chicken, pork, camel, and Nile perch, were also analyzed alongside the mixed samples.

2.6. DNA Sequencing for Species Confirmation and Statistical Analysis

To confirm the vertebrate species in the meat samples, the DNA was amplified using primers that target a longer segment (750 bp), the barcoding region of the CO1 gene, as described previously [19,37]. This involved performing conventional PCR in 15-µL reaction volumes, which included 1× HOT FIREPol® Blend Master Mix (Solis BioDyne, Tartu, Estonia), 0.5 µM concentrations of both forward (5′-TCT CAA CCA ACC ACA ARG AYA TYG G-3′) and reverse (5′-TAG ACT TCT GGG TGG CCR AAR AAY CA-3′) primers, and 2 µL of DNA template. The cycling conditions were those described by Ouso et al. [19]. The resulting amplicons were cleaned using the ExoSAP-IT protocol (USB Corporation, Cleveland, OH) and sequenced at Macrogen Inc. (Amsterdam, the Netherlands). Sequences were analyzed using Geneious version 11.1.5 [38,39] and queried against the GenBank nr database (http://www.ncbi.nlm.nih.gov/ accessed 10 March 2019) using the Basic Local Alignment Search Tool [40] and the Barcode of Life Database (BOLD; http://www.boldsystems.org (accessed 10 March 2019) [41]. The statistical software NCSS 2020 (NCSS, Kaysville, UT, USA; https://www.ncss.com/ (accessed on 28 August 2020) was used to create box plots of the variance in the melting temperatures observed using different extraction conditions and physicochemical treatments.

3. Results

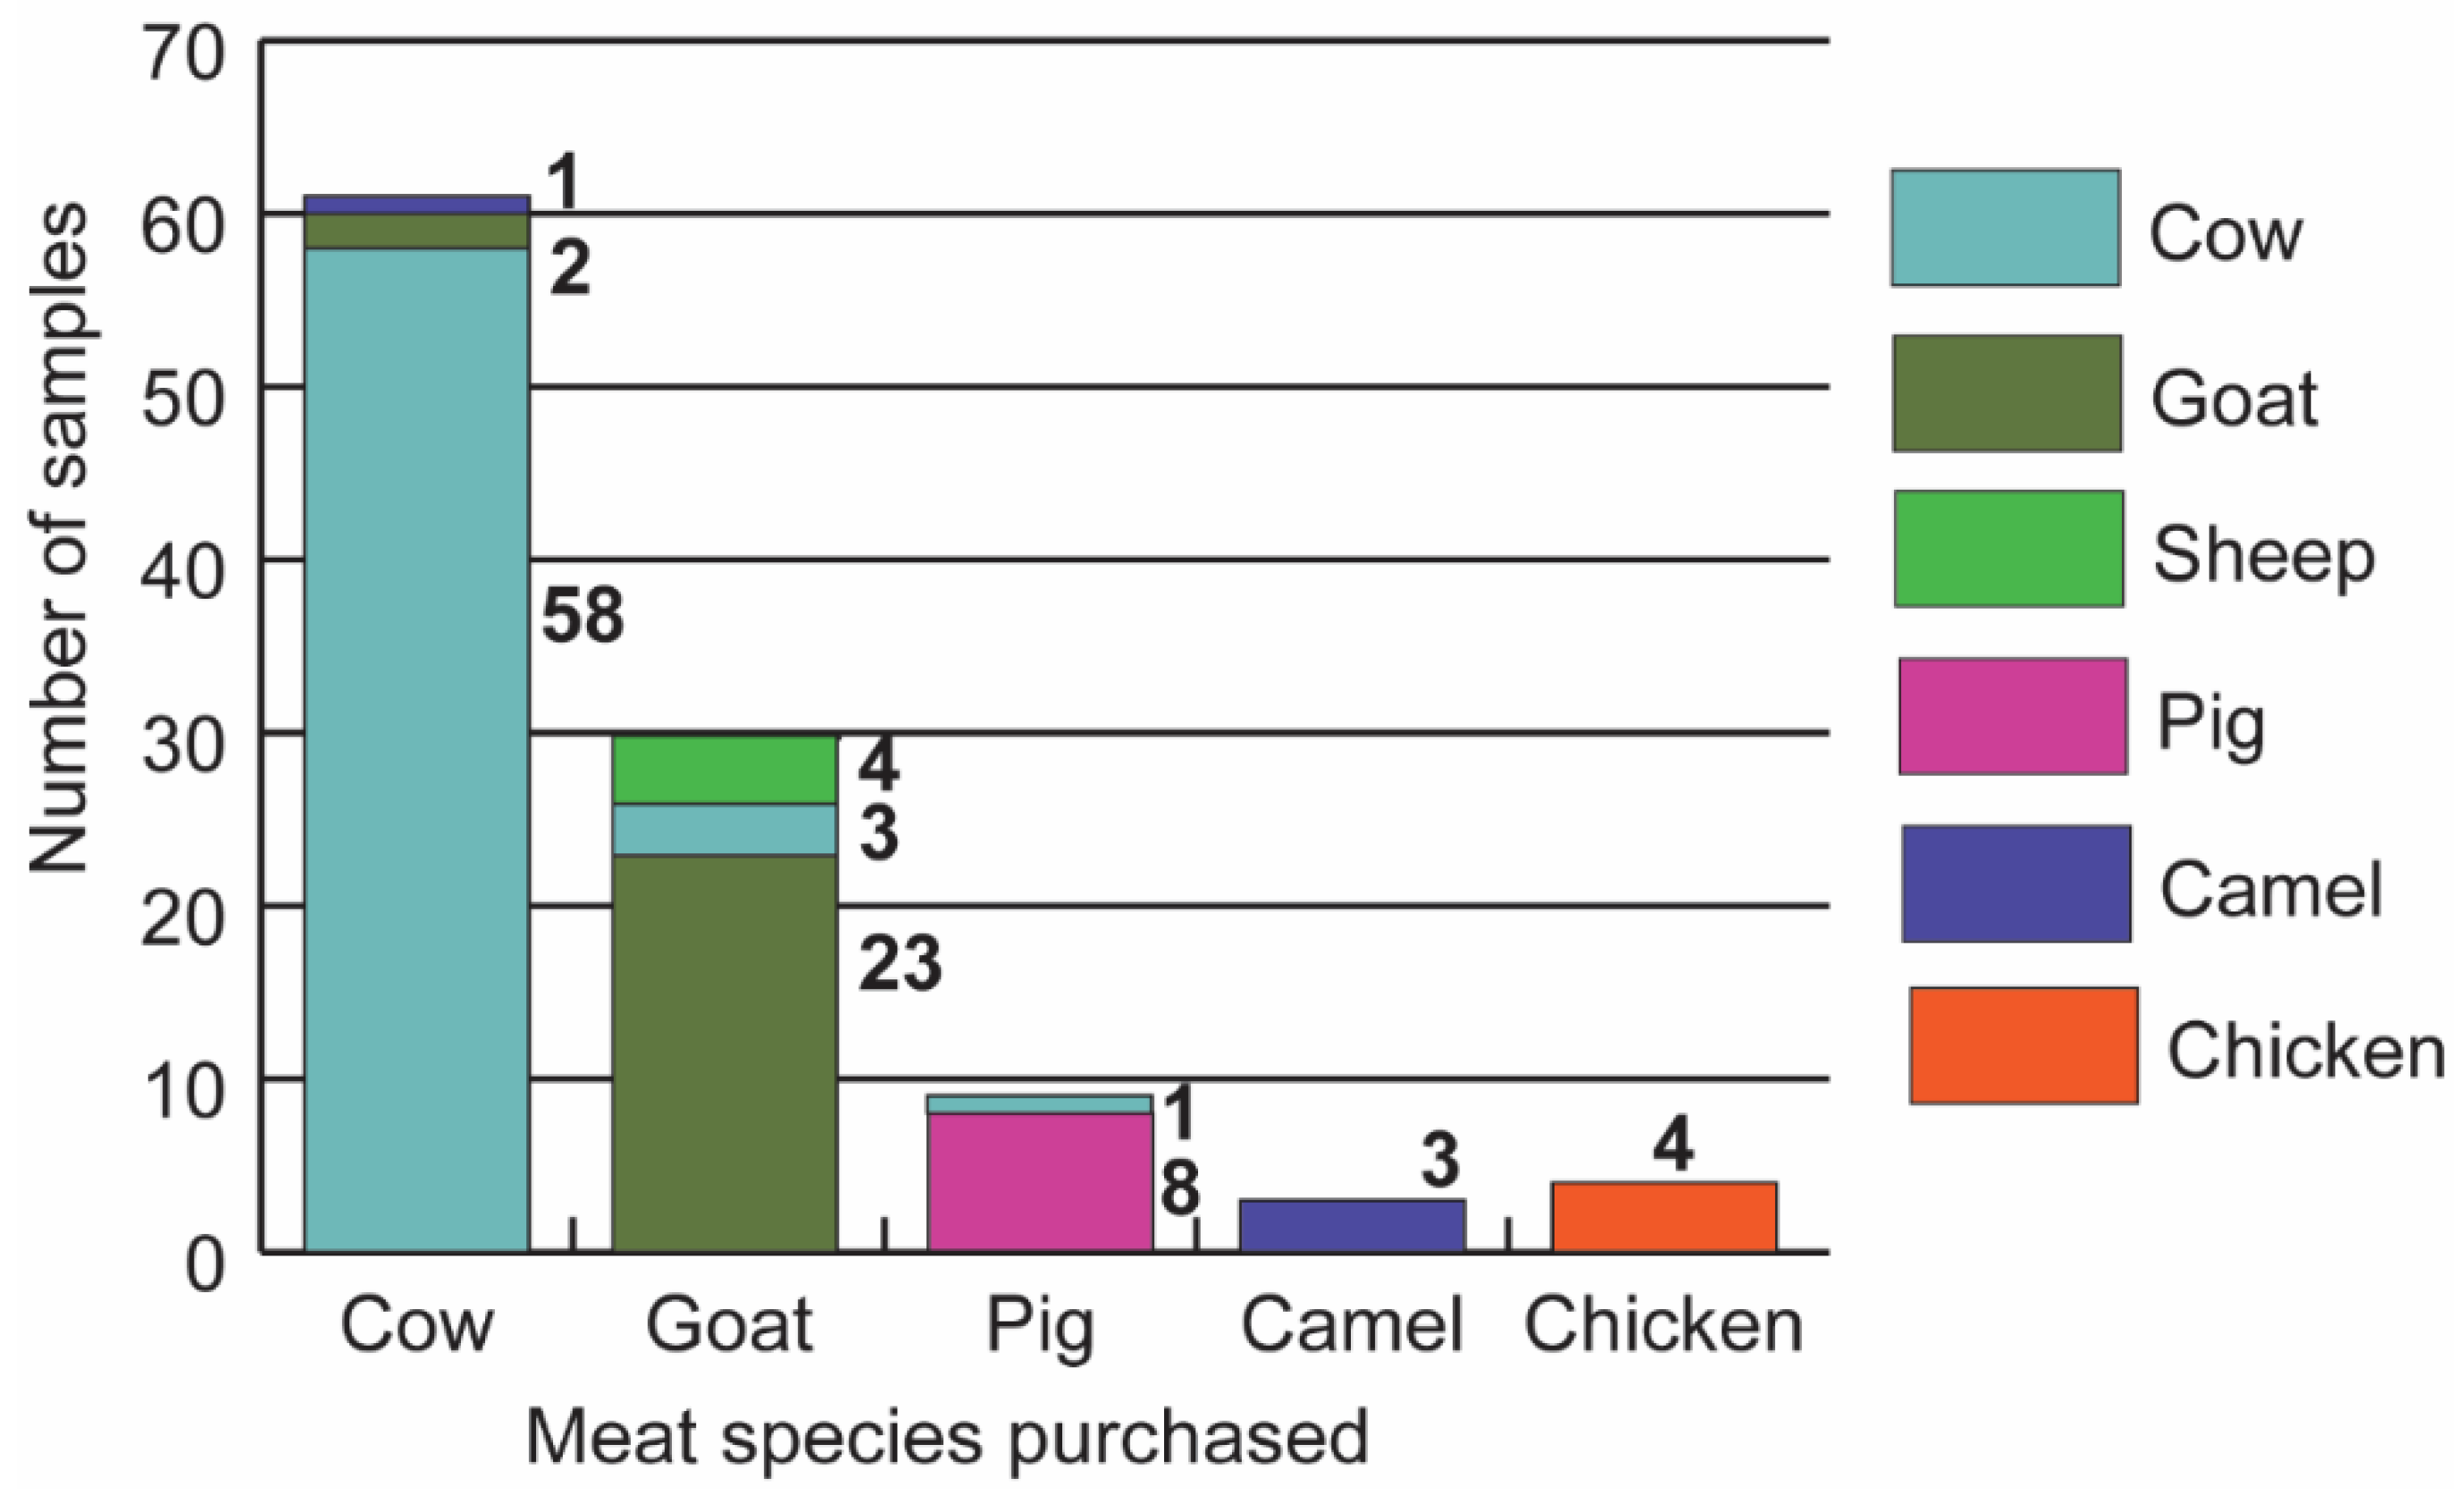
3.1. Vertebrate Sources of Meat Sold in Butcheries in Nairobi

PCR-HRM analysis of the cyt b, CO1, and 16S rRNA genes (Figure 1) of 107 meat samples revealed the vertebrate sources as 62 cattle (57.94%), 25 goats (23.36%), 8 pigs (7.47%), 4 camels (3.74%), 4 chickens (3.74%), and 4 sheep (3.74%). The identifications were confirmed by sequencing amplicons of the 750 bp segment of the CO1 barcoding region. Sequence alignments of the PCR-HRM amplicons obtained from the reference vertebrate species are seen in Figure S1. Eleven (10.3%) meat samples were misidentified by sellers. Of 61 samples sold as beef, two were substituted with goat meat and one with camel meat. Of 30 samples sold as goat meat, four were mutton (sheep meat) and three were beef. One of the nine samples purchased as pork was beef (Figure 2). A pair-wise comparison of the amplicons allowed for the distinction of different species using the three primers (Figure 3).

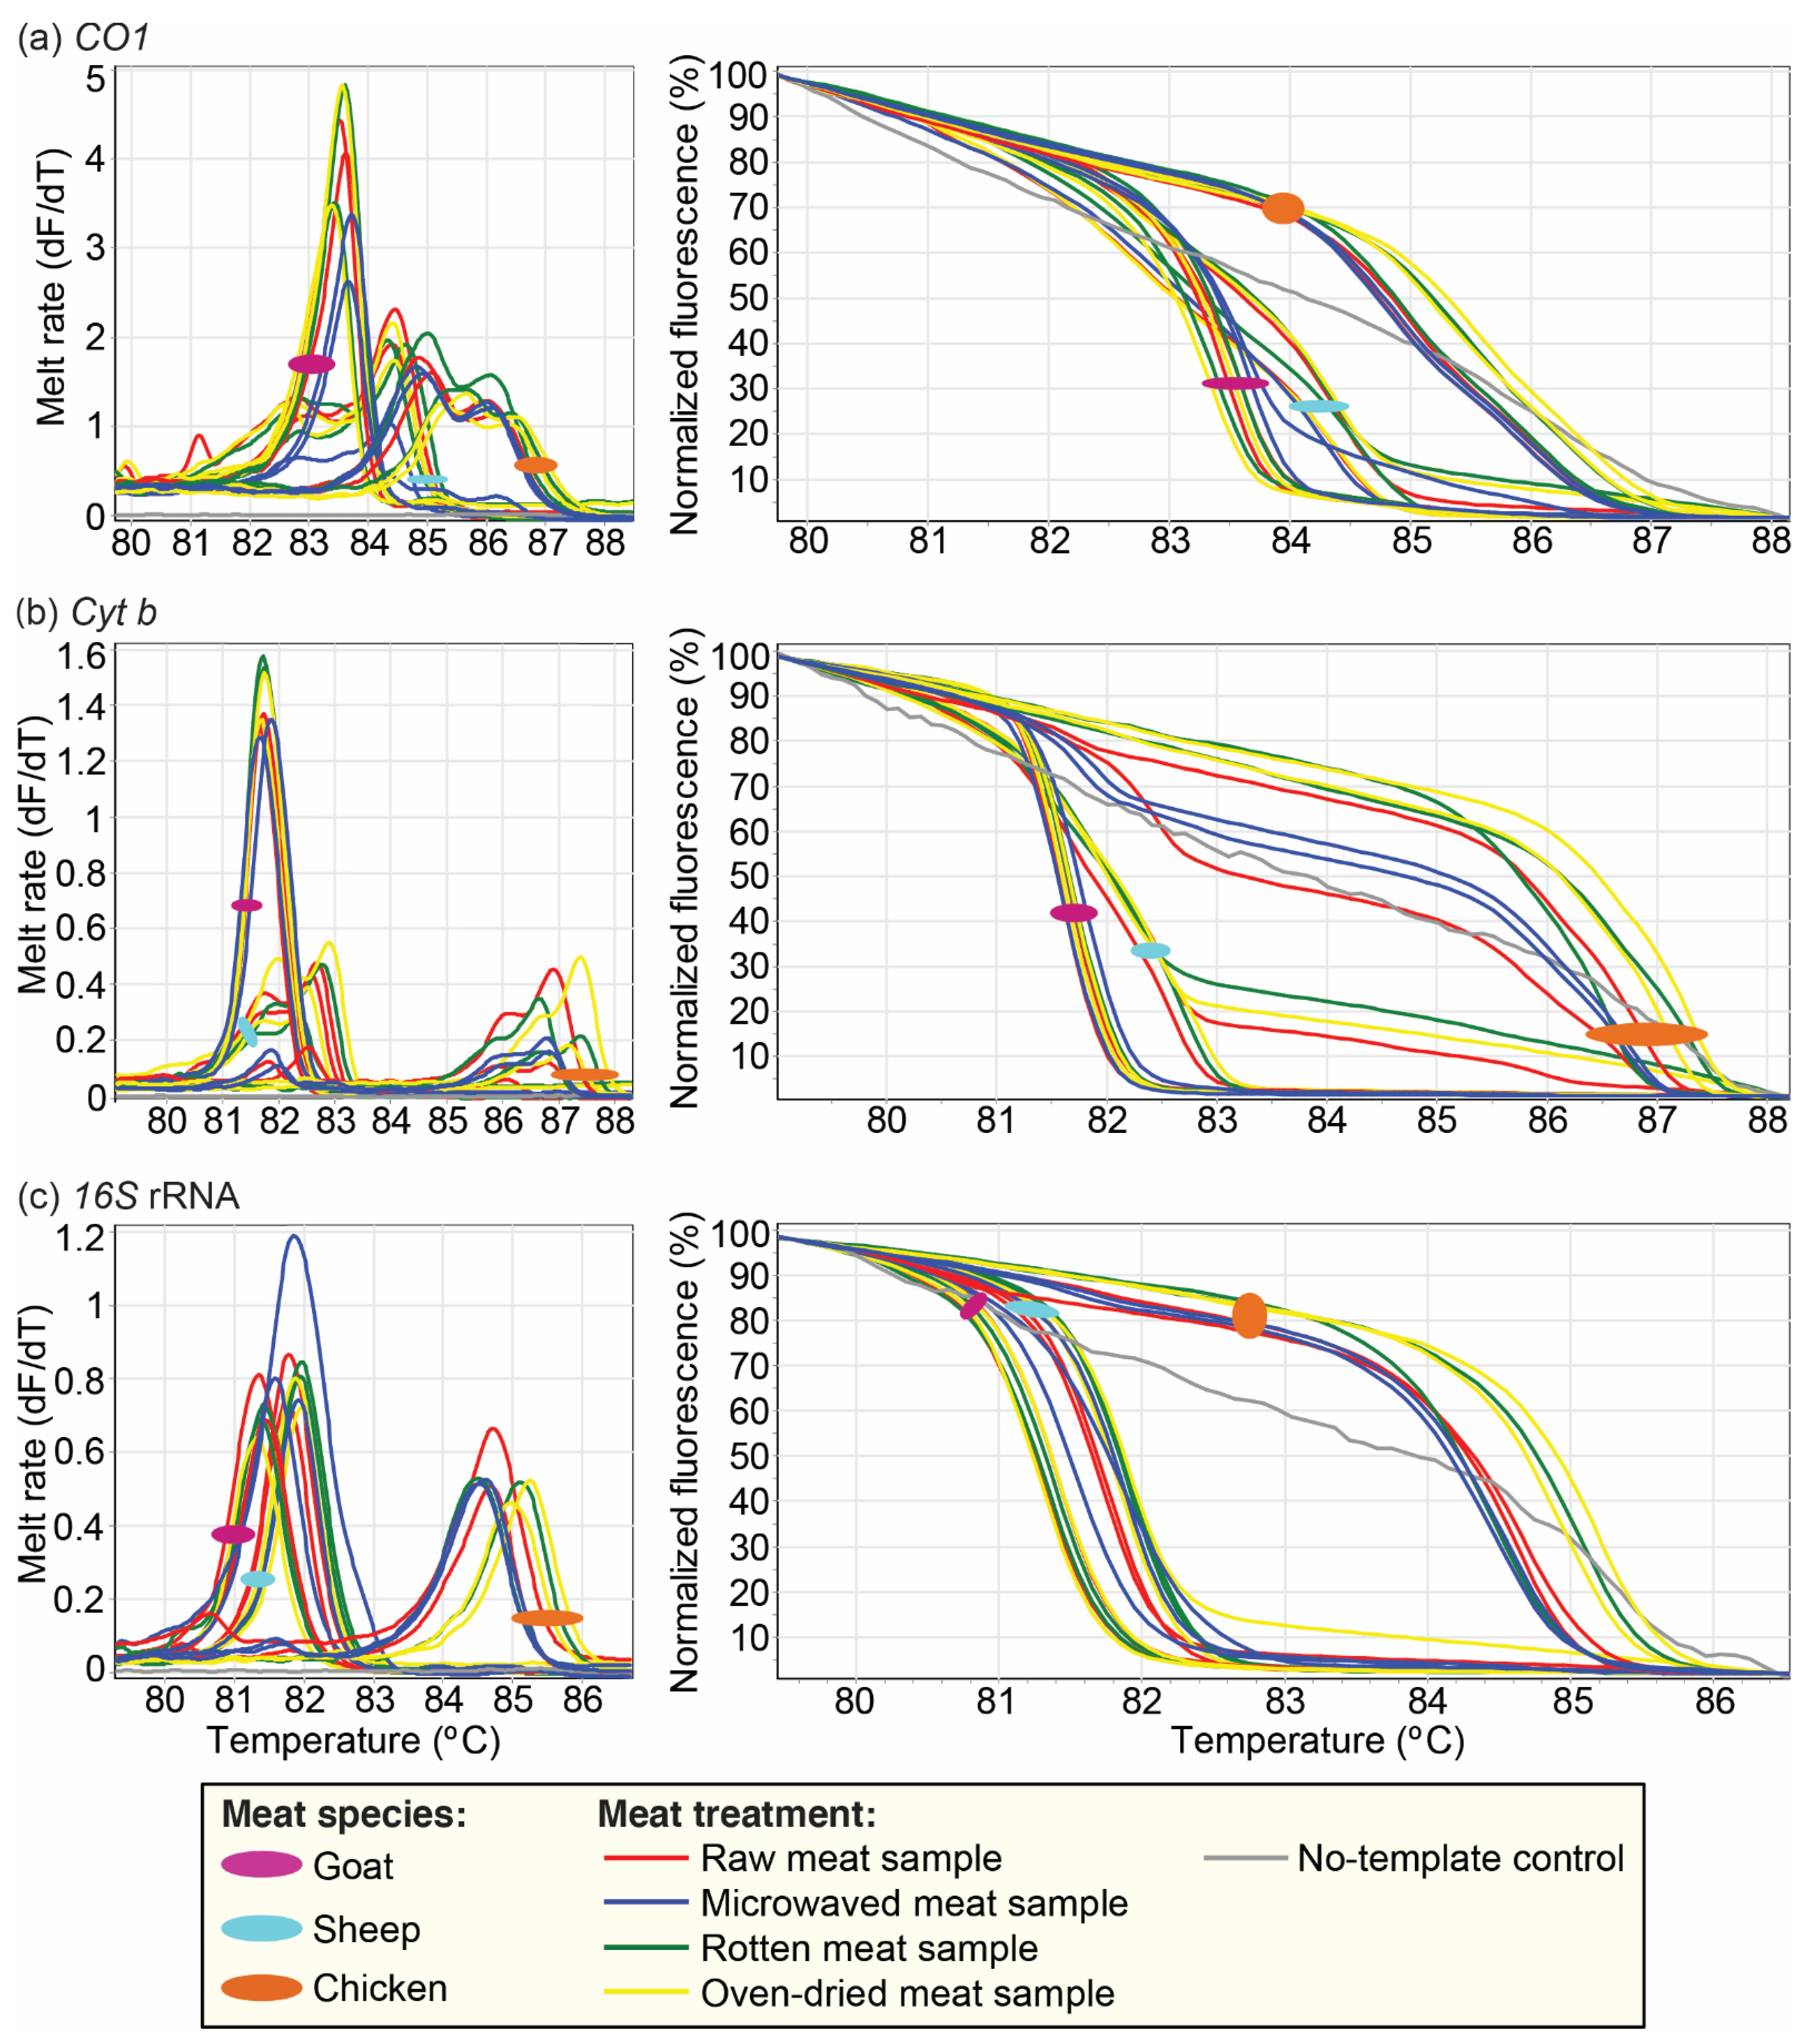
3.2. Effect of Physicochemical Condition of Meat Samples on Vertebrate Species Identification by PCR-HRM

We found that the application of various treatments had minimal effect on the HRM melt profiles of the respective PCR amplicons. All samples, irrespective of the physicochemical condition, were amplified by at least one of the markers, and the vertebrate species could be reliably identified despite slight shifts in the melting temperature (Tm) of the resulting amplicons. Amplification was highest in the raw samples, with all of them being successfully detected using all three markers. However, we observed a relative reduction in the amplification of the markers from meat processed with different treatments. In the CO1 gene, 8/16 of the microwaved, 2/16 of the rotten, and 4/16 of the oven-dried samples did not amplify, while in the assay targeting the cyt b marker, 10/16 of the microwaved samples, 2/16 of the oven-dried samples, and 1/16 rotten samples did not amplify. The 16S rRNA did not amplify for 6/16 of the microwaved and 1/16 of the oven-dried samples.
Comparing the Tm of the PCR amplicons obtained from the oven-dried, cooked, and rotten meat to the raw samples indicated slight shifts. We observed the highest range in Tm shift with the cyt b marker when samples were exposed to the different conditions, whereas the Tm of the CO1 marker was least affected by meat treatment. The shift in the Tm from the raw meat controls was <1 °C, with all markers for all samples. However, one microwaved cattle sample had a 16S rRNA Tm shift of +1.63 °C. Based on the Tm of primary peaks, the widest range in Tm was seen in microwaved samples, followed by degraded samples, with oven-dried meat showing the least variation relative to the Tm of the corresponding raw meat (Figure 4, Figure S2). We further noted that the amplification of the 16S rRNA marker resulted in single peaks in all the species tested, whereas the cyt b and CO1 markers resulted in prominent secondary peaks that helped to distinguish cattle, sheep, and chicken (Figure S3). The camel samples had double peaks only in the cyt b region, whereas pig only had multiple peaks in the CO1 region.

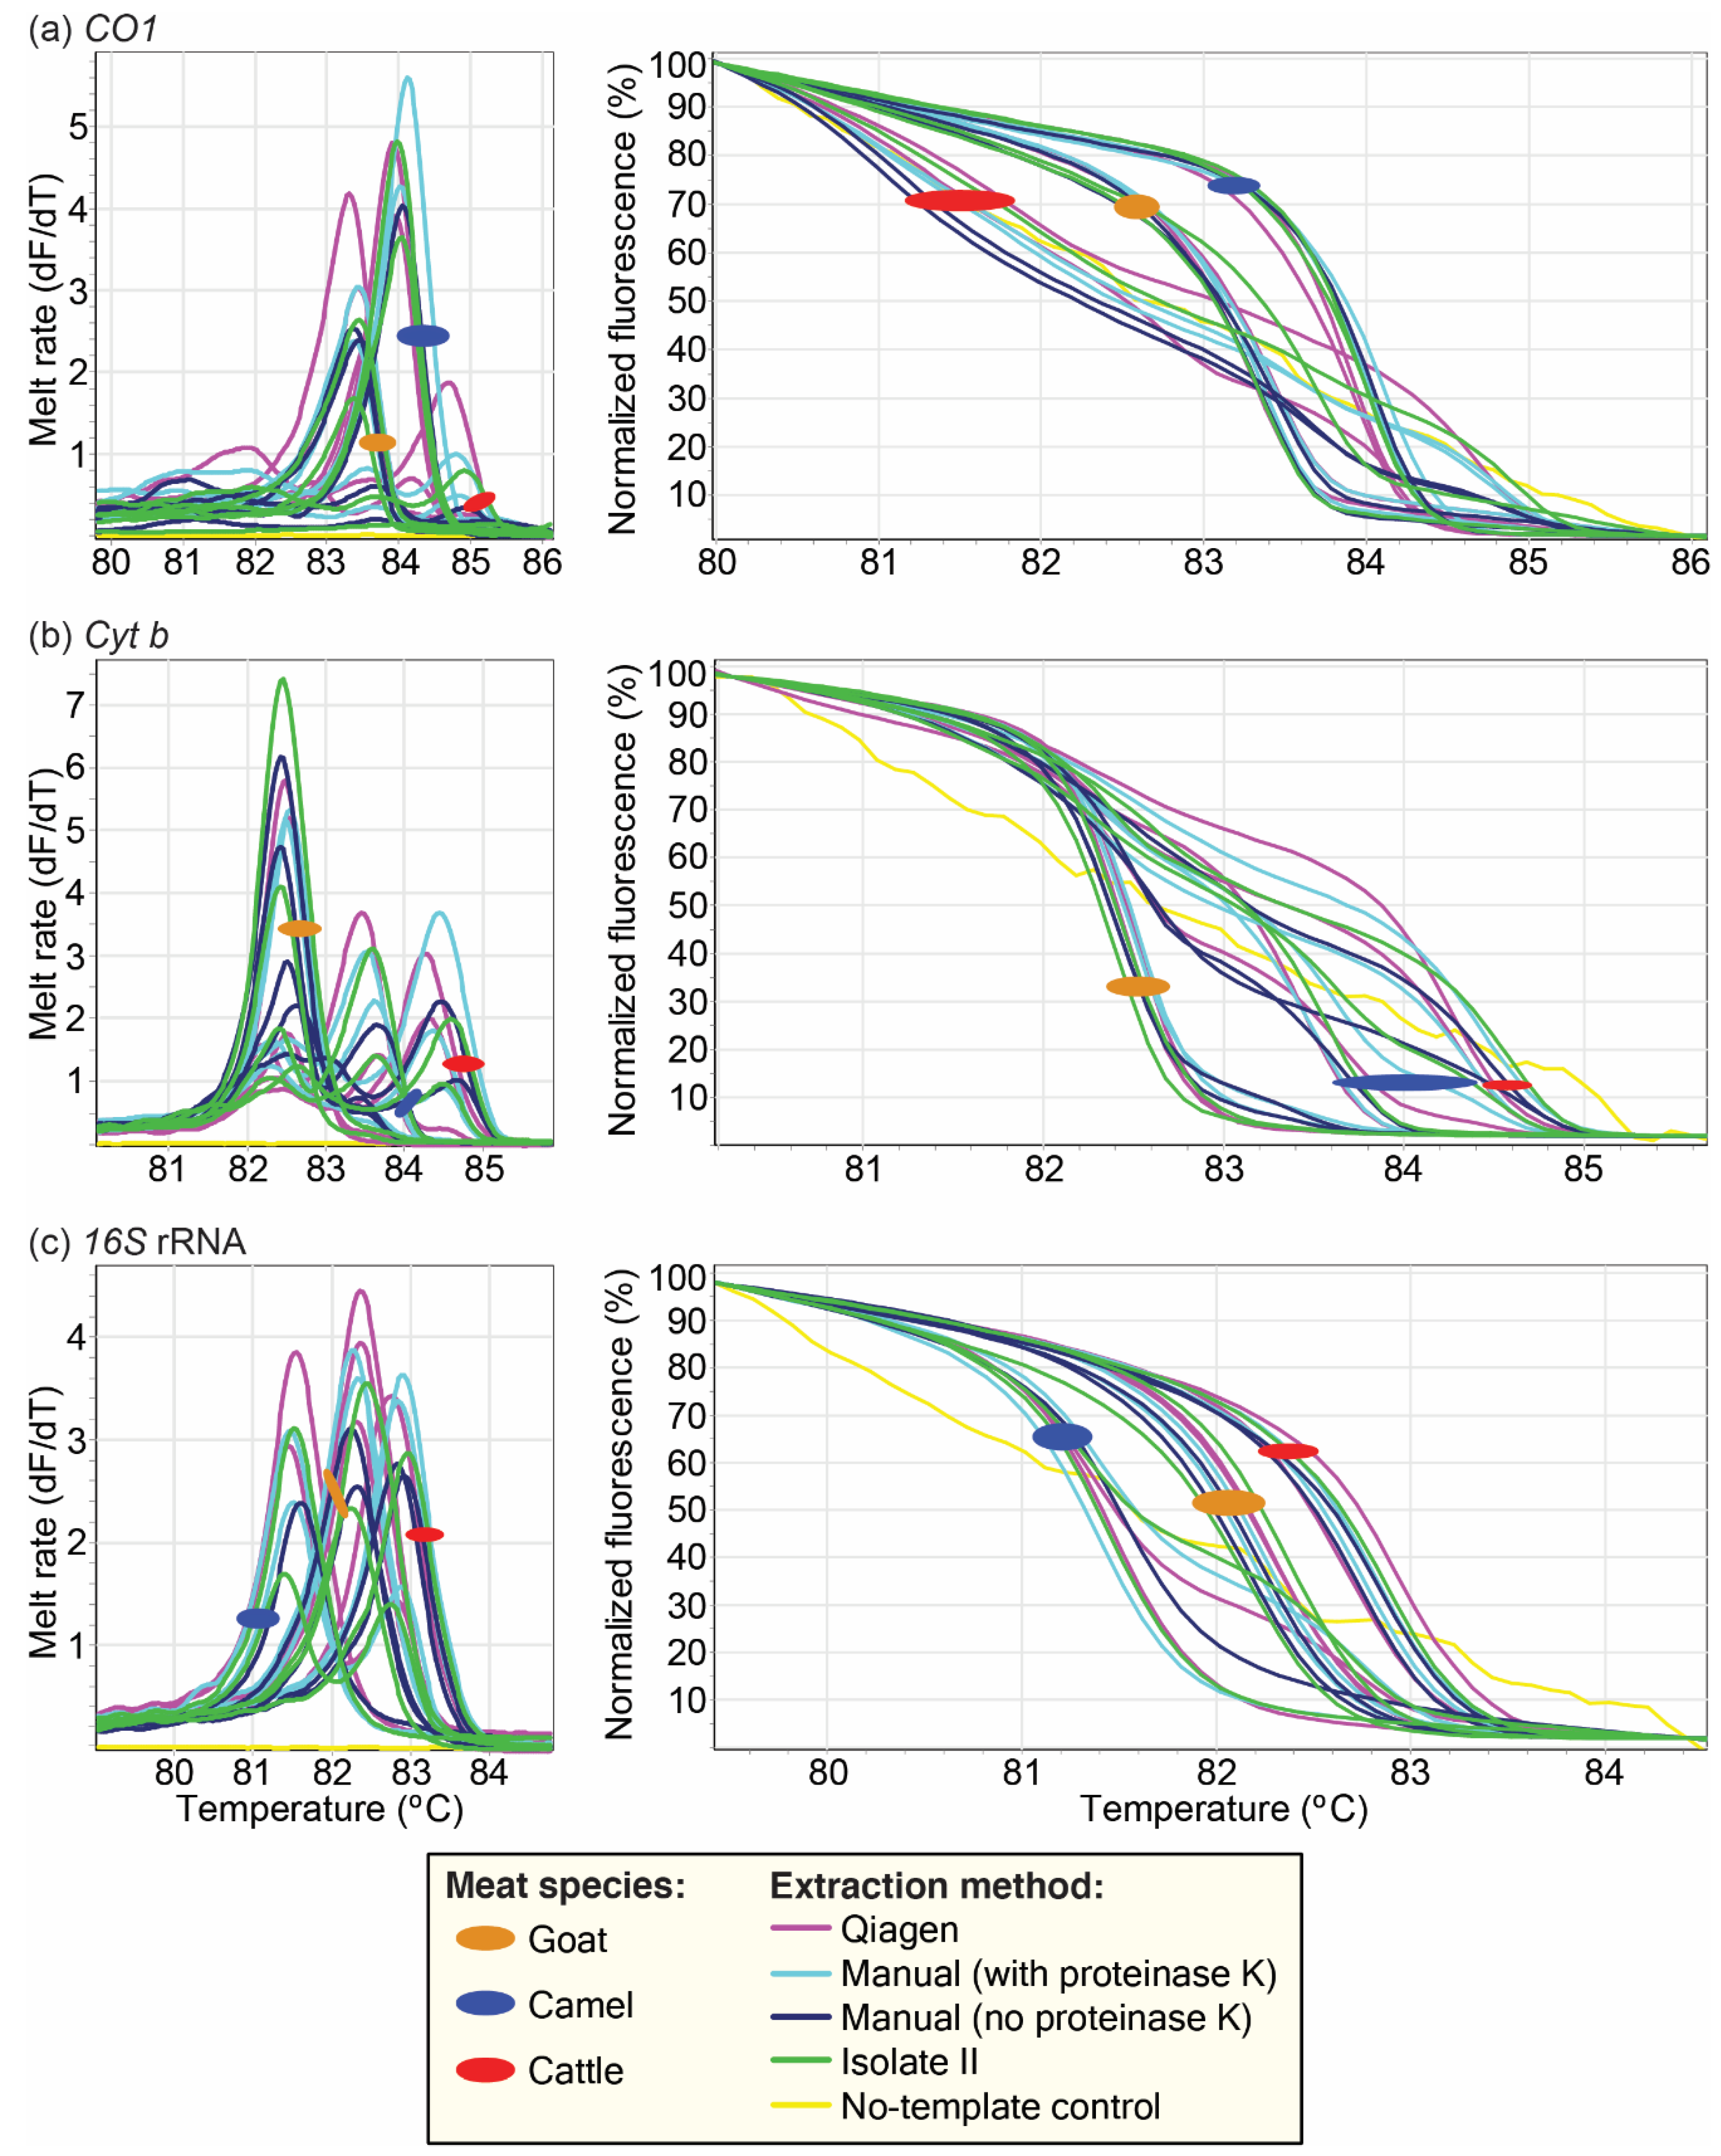
3.3. Effect of Different DNA Extraction Protocols on PCR-HRM

Using the different DNA extraction protocols, we observed similar melt profiles with minimal Tm shifts (<1 °C). The CO1 marker had the widest range in Tm, followed by cyt b (Figure 5, Figure S4). The use of different extraction protocols did not result in overlapping of profiles of any of the species analyzed. All markers could be used to distinguish the species of the samples regardless of the extraction protocol used, with the exception of cattle and sheep, which yielded similar HRM melt profiles with the 16S rRNA marker, as previously described [19].

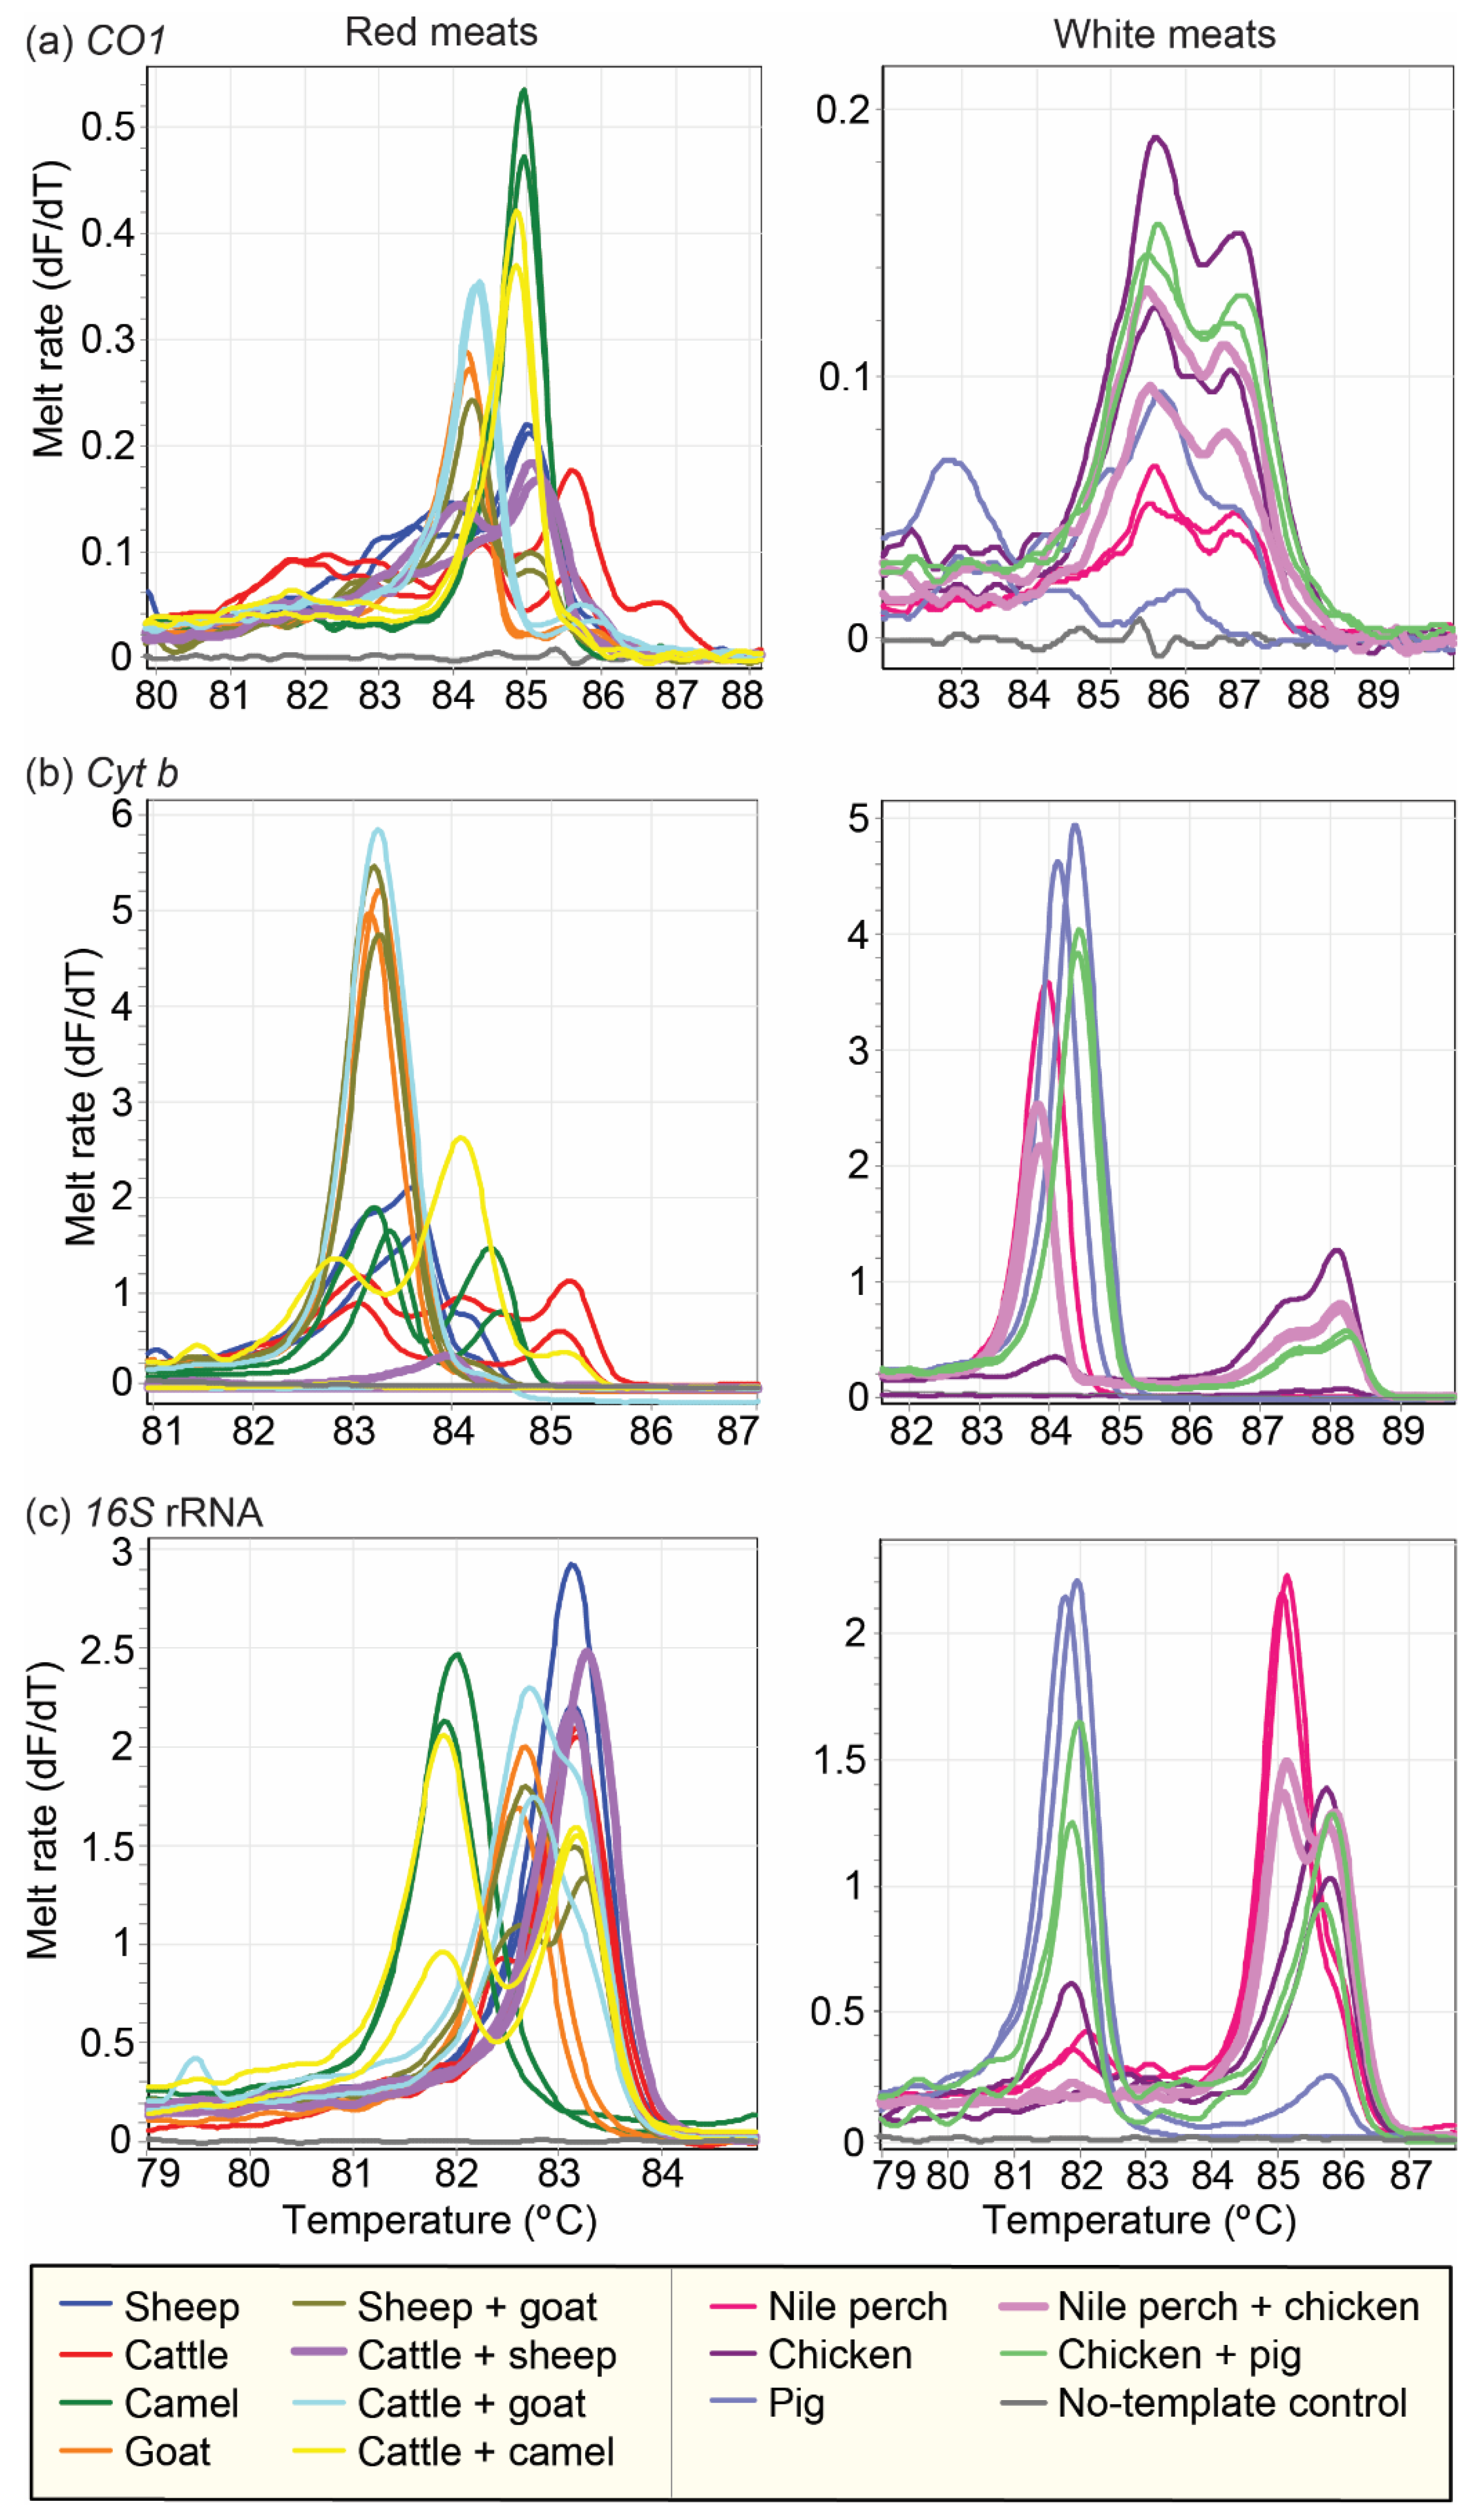
3.4. Distinction of Species in Mixed Meat Samples Using PCR-HRM

Amplification targeting the marker 16S rRNA gave the best resolution in distinguishing the individual vertebrate species in mixed meat samples (meat samples with two or more vertebrate species). The only mixed samples that could not be determined using the 16S rRNA marker were mixtures of cattle and sheep meat, which could, however, be distinguished by the cyt b marker (Figure 3 and Figure 6). The cyt b marker clearly resolved white meat mixtures, including chicken and pork and Nile perch and pork, with individual HRM curves corresponding with the composite vertebrate species. However, differentiating sources of red meat using the cyt b marker was limited. For instance, all mixtures that contained goat meat only showed the cyt b melt profile of goat, and the “camel+cattle” admixture most resembled the camel sample, with a smaller third peak similar to the “cattle” samples. The melting profiles obtained from the CO1 marker showed slight variations between the pure samples (meat samples with one vertebrate species) and the mixed meat samples.

4. Discussion

This study revealed significant levels of species substitution in products retailed in Nairobi’s major meat market. Goat meat had the highest levels of substitution, with mutton and beef being used as alternatives. Our results are comparable with those of Cawthorn et al. [15], who reported detecting mutton and beef as common substitutes in the meat value chain in South Africa. In Kenya, this substitution is likely to be driven by the relatively higher price of goat meat (USD 5.5–6.0 per kg) relative to mutton and beef (USD 3–4.5 per kg) [42]. Goat meat is preferred for preparing “Nyama Choma”, a roasted meat delicacy in eastern Africa that is increasingly being consumed in high quantities [43]. Growing evidence that associates the consumption of beef and mutton with a severe allergic reaction, termed “midnight anaphylaxis”, implies that substitution with these meats may pose a health risk to susceptible populations [44]. While the detection of these undeclared species could be a result of unintentional cross-contamination, such as from dirty knives or surfaces, we accounted for these potential mishaps by aseptically excising and testing inner parts of the raw meat samples. These results highlight the need for intensified surveillance of species substitution in the meat value chain in Kenya. Targeted surveillance may also be applied to goat value chains and other high-value species, in which adulteration could be linked to fraudulent financial gain.
This study demonstrates the utility of PCR-HRM for detecting multiple vertebrate species in meat products. We were able to detect composite vertebrate species in mixed meat samples by using different combinations of CO1, cyt b, and 16S rRNA markers. The adulteration of meat with products from multiple species is increasingly being reported [17,45,46,47,48], thereby raising the demand for affordable and faster techniques for their detection. Many studies describing multi-species analyses of vertebrates in meat have utilized multiplex PCR [45,46,47,49]. While useful, multiplex PCR requires the use of expensive probes and post-PCR procedures, such as gel electrophoresis for the size separation of amplicons and/or DNA sequencing, thereby increasing analysis time, cost, and the risk of cross-contamination. Hence, PCR-HRM allows for real-time detection while minimizing downstream steps and costs. The PCR-HRM technique used here is hinged on measuring the dissociation rate of the PCR amplicons of three universal barcoding markers (CO1, cyt b, and 16S rRNA) from their double-stranded to single-stranded forms when subjected to gradual heating. Therefore, this approach has wide application, as it is not limited to identifying specific species represented by species-specific primers. In a previous study, we demonstrated the utility of this PCR-HRM approach in distinguishing up to 32 vertebrate species [19], whereby DNA sequencing was performed only on representative samples for purposes of species confirmation, or to investigate samples with questionable or novel melt profiles.
This study shows that PCR-HRM would be particularly useful in investigating admixtures of vertebrate species in commercially processed meat products, such as sausages, kebabs, meatballs, and hams, which are frequently adulterated with multiple undeclared meats during processing [49]. In performing such analysis, our findings underpin the need to employ more than one marker to ensure accurate species identification in meat admixtures. Over-reliance on a single marker could result in overlaps in melt curves of different species, resulting in decreased sensitivity and poor resolution of meat mixtures [50]. Although the 16S rRNA and CO1 markers generated peaks that corresponded with the individual species that constituted the admixtures we tested, the cyt b marker showed a lower resolution, especially with red meats. This poor resolution could be attributed to the section of the cyt b region amplified, which resulted in melting profiles that were close to each other. Due to the unpredictability associated with meat mixtures, we hereby recommend the use of multiple mitochondrial markers, coupled with careful design and the selection of primers for PCR-HRM studies.
The application of various treatments of the meat samples allowed us to mimic the conditions and states of degradation that meat samples may be found in due to post-slaughter changes from cooking, sun-drying, or rotting [51]. The melting profiles were similar across raw, cooked, and rotten meat samples, with most samples having Tm shifts of <1 °C. However, exposure to heat treatment in the microwaved samples resulted in lower amplification rates and increased the 16S rRNA marker Tm of one cattle sample by >1 °C. It has previously been demonstrated that the efficiency of PCR may be varied in meat samples subjected to different heat processes, possibly due to alterations in salt concentration and DNA fragmentation [52]. A shift of this magnitude was, however, not evident when targeting the CO1 marker, showing that the use of this marker in conjunction with the others will improve species identification in meats exposed to heat post-slaughter. Our findings also imply that although reliable species distinction requires a Tm shift of <1 °C, it can be more in treated samples, hence the need for further studies to optimize acceptable thresholds. Nonetheless, across markers, species identification by PCR-HRM is reproducible despite varying physicochemical states of the meat samples.
Our results also demonstrate that the use of different DNA extraction protocols yielded only slight variations between same-species samples. Notably, the deviation from the control DNA isolation kit (the ISOLATE II commercial kit) was minimal (<1 °C), with the lab-optimized protocol having a slightly wider range in melting temperature compared to the other protocols used. The variation in melting temperature across different protocols was likely caused by the difference in salt concentrations of the DNA yielded. Cations such as Mg2+ and Na+ interact with the highly charged DNA polyanion, favoring DNA melting in conditions with lower Na+ concentrations [19,53]. Nevertheless, despite the marginal amplicon Tm shifts, melting profiles did not vary, confirming that PCR-HRM can be used with various DNA extraction protocols.
While PCR-HRM allows for the efficient and reliable differentiation of species substitution in the meat value chain, it is not without limitations. PCR-HRM relies on the identification of vertebrate species against reference samples that are run alongside the assays as positive controls. However, the samples selected as references may be subjective, determined by what researchers may deem as important, hence leaving out other species in the initial analysis. Nevertheless, our previous studies show that PCR-HRM analysis provides a degree of discovery of novel/uncharacterized species, which can be identified by DNA sequencing [19]. Furthermore, the mitochondrial markers CO1 and cyt b are often used singly in species identification [17,46,50], but our results indicate the need to use multiple markers in tandem for accurate species identification. Finally, mitochondrial markers, which are commonly used for the DNA barcoding of species, are not appropriate for the quantification of species adulteration in meat mixtures because there are major differences in the gene copies of mtDNA markers in different species [54].

5. Conclusions

This study demonstrates the utility of PCR-HRM for the efficient and reliable detection of species substitution as a form of fraud in the meat value chain. We utilized this technique to identify species substitution in Nairobi’s major meat market. We also showed that PCR-HRM is a robust technique, providing reproducible results in both single and mixed-species samples despite variations in physicochemical properties or the presence of multiple DNA extraction protocols. Our study shows that PCR-HRM enables the identification of vertebrate species in meat samples without having to perform extensive DNA sequencing on most of the samples, making it the molecular tool of choice for the surveillance of food fraud in low-resource settings, such as those found in sub-Saharan Africa and other developing economies. Finally, this work demonstrates the importance of using multiple mitochondrial markers, including CO1, cyt b, and 16S rRNA, to accurately distinguish species.

Supplementary Materials

The following are available online at https://www.mdpi.com/article/10.3390/foods10123090/s1, Table S1: Metadata of reference species. Metadata of voucher specimens used as positive controls in this study. Figure S1: Sequence alignments of reference species (A) CO1, (B) cyt b, and (C) 16S rRNA PCR products used to differentiate livestock species by HRM analysis, Figure S2: Box plots of peak PCR-HRM melting temperatures of DNA from meat samples exposed to different physicochemical conditions, Figure S3: PCR-HRM distinction of double-peaked profiles, Figure S4: Box plots of peak PCR-HRM melting temperatures of DNA extracted from meat samples using different protocols.

Author Contributions

Conceptualization, L.W. and J.K.N.; methodology, L.W. and J.V.; formal analysis, J.K.N., L.W., and J.V.; investigation, J.K.N.; resources, J.V.; data curation, J.K.N.; writing—original draft preparation, J.K.N. and L.W.; writing—review and editing, J.K.N., L.W., N.O.A., T.M., and J.V.; visualization, J.V.; supervision, T.M., N.O.A., L.W., and J.V.; funding acquisition, L.W. and J.V. All authors have read and agreed to the published version of the manuscript.

Funding

This study was funded by the United States Agency for International Development Partnerships for Enhanced Engagement in Research (USAID-PEER) cycle 4, which was awarded to LW and JV under the USAID grant number AID-OAA-A-11-00012, and sub-awarded by the American National Academy of Sciences (NAS) under agreement No. 2000006204. Further support was provided by icipe institutional funding from the UK’s Foreign Commonwealth and Development Office (FCDO), the Swiss Agency for Development and Cooperation (SDC), the Swedish International Development Cooperation Agency (SIDA), and the Kenyan government. These funding bodies did not play a role in the design of this study, the data collection, interpretation of the data, or the writing or submission of this publication.

Institutional Review Board Statement

Ethical clearance for this research was sought from and approved by the Kenya Wildlife Service (KWS) Research Authorization committee under the permit KWS/BRM/122016.

Informed Consent Statement

Informed consent of meat vendors was waived to prevent bias in the study, as this was a covert analysis of substitution of vertebrate species in meat, for both domestic and wildlife species.

Data Availability Statement

The data contained in this study are available in the main manuscript, and in the supplementary materials.

Acknowledgments

We acknowledge the technical support of Nancy Kagendi, Edward Makhulu, and Joseph Oundo of icipe’s ML-EID laboratory, and James Kabii of the Molecular Biology and Bioinformatics Unit. We are thankful to Daniel Ouso for the provision of the vertebrate positive controls used in the study. We also acknowledge the logistic support of Faith Kyengo and Margaret Ochanda of the Capacity Building Unit at icipe, and Daudi Mutua of the Procurement Unit.

Conflicts of Interest

The authors declare no conflict of interest.

References

  1. Spink, J.; Moyer, D.C. Defining the Public Health Threat of Food Fraud. J. Food Sci. 2011, 76, R157–R163. [Google Scholar] [CrossRef] [PubMed]
  2. Silvis, I.; van Ruth, S.; van der Fels-Klerx, H.; Luning, P. Assessment of food fraud vulnerability in the spices chain: An explorative study. Food Control. 2017, 81, 80–87. [Google Scholar] [CrossRef]
  3. Villa, C.; Costa, J.; Meira, L.; Oliveira, M.B.P.; Mafra, I. Exploiting DNA mini-barcodes as molecular markers to authenticate saffron (Crocus sativus L.). Food Control. 2016, 65, 21–31. [Google Scholar] [CrossRef]
  4. Handford, C.E.; Campbell, K.L.; Elliott, C.T. Impacts of milk fraud on food safety and nutrition with special emphasis on developing countries. Compr. Rev. Food Sci. Food Saf. 2016, 15, 130–142. [Google Scholar] [CrossRef] [Green Version]
  5. Sakaridis, I.; Ganopoulos, I.; Argiriou, A.; Tsaftaris, A. High resolution melting analysis for quantitative detection of bovine milk in pure water buffalo mozzarella and other buffalo dairy products. Int. Dairy J. 2013, 28, 32–35. [Google Scholar] [CrossRef]
  6. Yadav, S. Edible oil adulterations: Current issues, detection techniques, and health hazards. Int. J. Chem. Stud. 2018, 6, 1393–1397. [Google Scholar]
  7. Soares, S.; Grazina, L.; Costa, J.; Amaral, J.S.; Oliveira, M.B.; Mafra, I. Botanical authentication of lavender (Lavandula spp.) honey by a novel DNA-barcoding approach coupled to high resolution melting analysis. Food Control. 2018, 86, 367–373. [Google Scholar] [CrossRef] [Green Version]
  8. Cawthorn, D.-M.; Duncan, J.; Kastern, C.; Francis, J.; Hoffman, L. Fish species substitution and misnaming in South Africa: An economic, safety and sustainability conundrum revisited. Food Chem. 2015, 185, 165–181. [Google Scholar] [CrossRef]
  9. Fernandes, T.J.; Costa, J.; Oliveira, M.B.P.; Mafra, I. DNA barcoding coupled to HRM analysis as a new and simple tool for the authentication of Gadidae fish species. Food Chem. 2017, 230, 49–57. [Google Scholar] [CrossRef]
  10. Fernandes, T.J.; Silva, C.R.; Costa, J.; Oliveira, M.B.P.; Mafra, I. High resolution melting analysis of a COI mini-barcode as a new approach for Penaeidae shrimp species discrimination. Food Control. 2017, 82, 8–17. [Google Scholar] [CrossRef]
  11. Nasreen, S.; Ahmed, T. Food adulteration and consumer awareness in Dhaka City, 1995-2011. J. Health Popul. Nutr. 2014, 32, 452–464. [Google Scholar] [PubMed]
  12. Martín-Fernández, B.; Costa, J.; De-Los-Santos-Álvarez, N.; López-Ruiz, B.; Oliveira, M.B.P.; Mafra, I. High resolution melting analysis as a new approach to discriminate gluten-containing cereals. Food Chem. 2016, 211, 383–391. [Google Scholar] [CrossRef]
  13. Woolfe, M.; Primrose, S. Food forensics: Using DNA technology to combat misdescription and fraud. Trends Biotechnol. 2004, 22, 222–226. [Google Scholar] [CrossRef]
  14. Chuah, L.-O.; Bin He, X.; Effarizah, M.E.; Syahariza, Z.A.; Shamila-Syuhada, A.K.; Rusul, G. Mislabelling of beef and poultry products sold in Malaysia. Food Control. 2016, 62, 157–164. [Google Scholar] [CrossRef]
  15. Cawthorn, D.-M.; Steinman, H.A.; Hoffman, L. A high incidence of species substitution and mislabelling detected in meat products sold in South Africa. Food Control. 2013, 32, 440–449. [Google Scholar] [CrossRef] [Green Version]
  16. Farag, M.R. Identification of different animal species in meat and meat products: Trends and advances. Adv. Anim. Veter- Sci. 2015, 3, 334–346. [Google Scholar] [CrossRef] [Green Version]
  17. Di Pinto, A.; Bottaro, M.; Bonerba, E.; Bozzo, G.; Ceci, E.; Marchetti, P.; Mottola, A.; Tantillo, G.M. Occurrence of mislabeling in meat products using DNA-based assay. J. Food Sci. Technol. 2015, 52, 2479–2484. [Google Scholar] [CrossRef] [PubMed]
  18. Fang, X.; Zhang, C. Detection of adulterated murine components in meat products by TaqMan© real-time PCR. Food Chem. 2016, 192, 485–490. [Google Scholar] [CrossRef]
  19. Ouso, D.O.; Otiende, M.Y.; Jeneby, M.M.; Oundo, J.W.; Bargul, J.L.; Miller, S.E.; Wambua, L.; Villinger, J. Three-gene PCR and high-resolution melting analysis for differentiating vertebrate species mitochondrial DNA for biodiversity research and complementing forensic surveillance. Sci. Rep. 2020, 10, 1–13. [Google Scholar] [CrossRef] [Green Version]
  20. Kenya Markets Trust. A Study on Meat End-Market Trends in Kenya. 2019. Available online: https://www.kenyamarkets.org/wp-content/uploads/2019/11/Meat-End-Market-Trends-in-Kenya.pdf (accessed on 14 August 2020).
  21. Ballin, N.Z.; Vogensen, F.; Karlsson, A.H. Species determination—Can we detect and quantify meat adulteration? Meat Sci. 2009, 83, 165–174. [Google Scholar] [CrossRef]
  22. Al-Kahtani, H.A.; Ismail, E.; Ahmed, M.A. Pork detection in binary meat mixtures and some commercial food products using conventional and real-time PCR techniques. Food Chem. 2017, 219, 54–60. [Google Scholar] [CrossRef]
  23. Alarcon, P.; Fèvre, E.M.; Muinde, P.; Murungi, M.K.; Kiambi, S.; Akoko, J.; Rushton, J. Urban livestock keeping in the city of Nairobi: Diversity of production systems, supply chains, and their disease management and risks. Front. Veter-Sci. 2017, 4, 171. [Google Scholar] [CrossRef] [Green Version]
  24. Abbas, O.; Zadravec, M.; Baeten, V.; Mikuš, T.; Lešić, T.; Vulić, A.; Prpić, J.; Jemeršić, L.; Pleadin, J. Analytical methods used for the authentication of food of animal origin. Food Chem. 2018, 246, 6–17. [Google Scholar] [CrossRef]
  25. Bourguiba-Hachemi, S.; Fathallah, M.D. DNA Testing of meat foods raises issues beyond adulteration. Sky J. Food Sci. 2016, 8, 1–7. [Google Scholar]
  26. Mbugua, D.; Kimwele, C.N.; Jung’a, J.O.; Gatebe, E.; Gakuya, F.; Kinuthia, M.J.; Kwamboka, E.S. Use of cytochrome oxidase 1 gene region: A molecular tool for the domestic and wildlife industry in Kenya. Sci. J. Anim. Sci. 2014, 3, 87–94. [Google Scholar] [CrossRef]
  27. Reed, G.H.; Kent, J.O.; Wittwer, C.T. High-resolution DNA melting analysis for simple and efficient molecular diagnostics. Pharmacogenomics 2007, 8, 597–608. [Google Scholar] [CrossRef] [PubMed] [Green Version]
  28. Druml, B.; Cichna-Markl, M. High resolution melting (HRM) analysis of DNA–Its role and potential in food analysis. Food Chem. 2014, 158, 245–254. [Google Scholar] [CrossRef] [PubMed]
  29. Sakaridis, I.; Ganopoulos, I.; Argiriou, A.; Tsaftaris, A. A fast and accurate method for controlling the correct labeling of products containing buffalo meat using High Resolution Melting (HRM) analysis. Meat Sci. 2013, 94, 84–88. [Google Scholar] [CrossRef] [PubMed]
  30. Ogola, E.; Villinger, J.; Mabuka, D.; Omondi, D.; Orindi, B.; Mutunga, J.; Owino, V.; Masiga, D.K. Composition of Anopheles mosquitoes, their blood-meal hosts, and Plasmodium falciparum infection rates in three islands with disparate bed net coverage in Lake Victoria, Kenya. Malar. J. 2017, 16, 1–12. [Google Scholar] [CrossRef]
  31. Lee, P.-S.; Sing, K.-W.; Wilson, J.-J. Reading mammal diversity from flies: The persistence period of amplifiable mammal mtdna in blowfly guts (Chrysomya megacephala) and a new DNA Mini-Barcode target. PLoS ONE 2015, 10, e0123871. [Google Scholar] [CrossRef] [Green Version]
  32. Meusnier, I.; Singer, G.A.; Landry, J.-F.; Hickey, D.A.; Hebert, P.D.; Hajibabaei, M. A universal DNA mini-barcode for biodiversity analysis. BMC Genom. 2008, 9, 214. [Google Scholar] [CrossRef] [PubMed] [Green Version]
  33. Omondi, D.; Masiga, D.K.; Ajamma, Y.U.; Fielding, B.C.; Njoroge, L.; Villinger, J. Unraveling Host-Vector-Arbovirus Interactions by Two-Gene High Resolution Melting Mosquito Bloodmeal Analysis in a Kenyan Wildlife-Livestock Interface. PLoS ONE 2015, 10, e0134375. [Google Scholar] [CrossRef] [PubMed] [Green Version]
  34. Boakye, D.A.; Tang, J.; Truc, P.; Merriweather, A.; Unnasch, T.R. Identification of bloodmeals in haematophagous Diptera by cytochrome B heteroduplex analysis. Med. Veter-Èntomol. 1999, 13, 282–287. [Google Scholar] [CrossRef] [Green Version]
  35. Peña-García, V.H.; Fernandez, G.J.; Gómez-Palacio, A.; Mejía-Jaramillo, A.; Cantillo, O.; Triana-Chávez, O. High-Resolution Melting (HRM) of the Cytochrome B Gene: A Powerful Approach to Identify Blood-Meal Sources in Chagas Disease Vectors. PLOS Neglected Trop. Dis. 2012, 6, e1530. [Google Scholar] [CrossRef] [Green Version]
  36. Kipanga, P.N.; Omondi, D.; Mireji, P.O.; Sawa, P.; Masiga, D.K.; Villinger, J. High-resolution melting analysis reveals low Plasmodium parasitaemia infections among microscopically negative febrile patients in western Kenya. Malar. J. 2014, 13, 429. [Google Scholar] [CrossRef] [Green Version]
  37. Ivanova, N.V.; Clare, E.L.; Borisenko, A.V. DNA barcoding in mammals. In Methods in Molecular Biology; Springer Science and Business Media LLC: Berlin/Heidelberg, Germany, 2012; Volume 858, pp. 153–182. [Google Scholar]
  38. Kearse, M.; Moir, R.; Wilson, A.; Stones-Havas, S.; Cheung, M.; Sturrock, S.; Buxton, S.; Cooper, A.; Markowitz, S.; Duran, C.; et al. Geneious Basic: An integrated and extendable desktop software platform for the organization and analysis of sequence data. Bioinformatics 2012, 28, 1647–1649. [Google Scholar] [CrossRef]
  39. Lee, H.C.; Lai, K.; Lorenc, M.T.; Imelfort, M.; Duran, C.; Edwards, D. Bioinformatics tools and databases for analysis of next-generation sequence data. Briefings Funct. Genom. 2011, 11, 12–24. [Google Scholar] [CrossRef] [Green Version]
  40. Altschul, S.F.; Gish, W.; Miller, W.; Myers, E.W.; Lipman, D.J. Basic local alignment search tool. J. Mol. Biol. 1990, 215, 403–410. [Google Scholar] [CrossRef]
  41. Ratnasingham, S.; Hebert, P.D.N. BOLD: The Barcode of Life Data System (http://www.barcodinglife.org). Mol. Ecol. Notes 2007, 7, 355–364. [Google Scholar] [CrossRef] [Green Version]
  42. Alarcon, P.; Fevre, E.; Murungi, M.K.; Muinde, P.; Akoko, J.; Dominguez-Salas, P.; Kiambi, S.; Ahmed, S.; Haesler, B.; Rushton, J. Mapping of beef, sheep and goat food systems in Nairobi—A framework for policy making and the identification of structural vulnerabilities and deficiencies. Agric. Syst. 2017, 152, 1–17. [Google Scholar] [CrossRef] [PubMed] [Green Version]
  43. Gorski, I.; Chung, W.-C.; Herr, K.; Mehta, K. Nyama Choma culture: Implications of increased red meat and alcohol consumption in East Africa. J. Sustain. Dev. 2016, 9, 96. [Google Scholar] [CrossRef]
  44. Gray, C.; van Zyl, A.; Strauss, L. ‘Midnight Anaphylaxis’ to Red Meat in Patients with Alpha-Gal Sensitisation: A Recent Discovery in the Food Allergy World and a Case Report from South Africa. Curr. Allergy Clin. Immunol. 2016, 29, 102–104. [Google Scholar]
  45. Ali, E.; Razzak, A.; Hamid, S.B.A.; Rahman, M.; Amin, A.; Rashid, N.R. Asing Multiplex PCR assay for the detection of five meat species forbidden in Islamic foods. Food Chem. 2015, 177, 214–224. [Google Scholar] [CrossRef] [PubMed]
  46. Izadpanah, M.; Mohebali, N.; Gorji, Z.E.; Farzaneh, P.; Vakhshiteh, F.; Fazeli, S.A.S. Simple and fast multiplex PCR method for detection of species origin in meat products. J. Food Sci. Technol. 2018, 55, 698–703. [Google Scholar] [CrossRef] [PubMed]
  47. Kitpipit, T.; Sittichan, K.; Thanakiatkrai, P. Direct-multiplex PCR assay for meat species identification in food products. Food Chem. 2014, 163, 77–82. [Google Scholar] [CrossRef] [PubMed]
  48. O’Mahony, P.J. Finding horse meat in beef products—A global problem. Qjm Int. J. Med. 2013, 106, 595–597. [Google Scholar] [CrossRef] [PubMed] [Green Version]
  49. Wang, W.; Wang, X.; Zhang, Q.; Liu, Z.; Zhou, X.; Liu, B. A multiplex PCR method for detection of five animal species in processed meat products using novel species-specific nuclear DNA sequences. Eur. Food Res. Technol. 2020, 246, 1351–1360. [Google Scholar] [CrossRef]
  50. López-Oceja, A.; Nuñez, C.; Baeta, M.; Gamarra, D.; de Pancorbo, M. Species identification in meat products: A new screening method based on high resolution melting analysis of cyt b gene. Food Chem. 2017, 237, 701–706. [Google Scholar] [CrossRef] [PubMed]
  51. Ramanan, S.S.; Kerala Agricultural University; Khapugin, A.A.; Reserve, M.S.N. Mordovia State University Book Review: Problematic Wildlife: A Cross-Disciplinary Approach. Nat. Conserv. Res. 2017, 2. [Google Scholar] [CrossRef] [Green Version]
  52. Arslan, A.; Ilhak, O.I.; Calicioglu, M. Effect of method of cooking on identification of heat processed beef using polymerase chain reaction (PCR) technique. Meat Sci. 2006, 72, 326–330. [Google Scholar] [CrossRef]
  53. Tan, Z.-J.; Chen, S.-J. Nucleic acid helix stability: Effects of salt concentration, cation valence and size, and chain length. Biophys. J. 2006, 90, 1175–1190. [Google Scholar] [CrossRef] [PubMed] [Green Version]
  54. Cai, Y.; He, Y.; Lv, R.; Chen, H.; Wang, Q.; Pan, L. Detection and quantification of beef and pork materials in meat products by duplex droplet digital PCR. PLoS ONE 2017, 12, e0181949. [Google Scholar] [CrossRef] [PubMed] [Green Version]
Figure 1. Distinct normalized PCR-HRM profiles of meat from seven reference livestock species. HRM profiles are represented as percent fluorescence with increasing temperatures for (a) CO1, (b) cyt b, and (c) 16S rRNA markers. All unknown samples were compared against these reference profiles for identification of vertebrate species.
Foods 10 03090 g001
Figure 2. Species substitution of meat sampled in Nairobi. Stacked bar graph showing vertebrate species of meat identified by PCR-HRM against the identity of the species purchased in the meat market. Numbers against each species refer to n, the number of species identified using PCR-HRM. Species substitution was identified in cattle, goat, and pig samples.
Foods 10 03090 g002
Figure 3. Pairwise discrimination of vertebrate sources of meat by PCR-HRM analysis: Three mitochondrial markers, CO1, cyt b, and 16S rRNA, were compared. The abilities of these markers to distinguish eight different vertebrate species commonly consumed in Kenyan households were compared and the summary matrix was generated.
Foods 10 03090 g003
Figure 4. PCR-HRM profiles of representative reference samples exposed to different physicochemical conditions. Goat, sheep, and chicken meat samples were exposed in replicate to different conditions—raw, rotten, oven-dried, and microwaved. Their PCR-HRM profiles were then assessed using CO1, cyt b, and 16S rRNA. For each marker, the HRM profiles are represented as melt rates and normalized HRM profiles. Melt rates are represented as changes in fluorescence units with increasing temperatures (dF/dT), and HRM profiles are represented as percent fluorescence with increasing temperatures for (a) CO1, (b) cyt b, and (c) 16S rRNA markers.
Foods 10 03090 g004
Figure 5. PCR-HRM profiles of representative reference samples whose DNA was extracted using different extraction protocols. DNA was extracted from goat, camel, and cattle meat samples using four different extraction protocols. These protocols included two kits, the DNeasy Blood and Tissue Kit protocol and the ISOLATE II Genomic DNA Extraction Kit, and two manual extraction protocols. Their PCR-HRM profiles were then assessed using CO1, cyt b, and 16S rRNA. For each marker, the HRM profiles are represented as melt rates and normalized HRM profiles. Melt rates are represented as changes in fluorescence units with increasing temperatures (dF/dT) and HRM profiles are represented as percent fluorescence with increasing temperatures for (a) CO1, (b) cyt b, and (c) 16S rRNA markers.
Foods 10 03090 g005
Figure 6. PCR-HRM melt rate profiles of pure and mixed meat samples assessed using three mitochondrial markers. The left column represents red meat sources (sheep, goat, cattle, and camel) and their corresponding mixtures, whereas the right column represents DNA from white meat sources (Nile perch, chicken, and pig) and their mixtures. Distinct melt rates are represented as changes in fluorescence units with increasing temperatures (dF/dT) for (a) CO1, (b) cyt b, and (c) 16S rRNA markers.
Foods 10 03090 g006
Table 1. Oligonucleotide primers used for vertebrate identification.
Target GenePrimer Name Primer Sequence (5′-3′)Amplicon Size (bp)Citation
CO1Uni-Minibar-F1TCCACTAATCACAARGATATTGGTAC205[19,31,32]
Ronping_RTATCAGGGGCTCCGATTAT
16S rRNAVert16S ForGAGAAGACCCTRTGGARCTT200[33]
Vert16S RevCGCTGTTATCCCTAGGGTA
cyt bCyt b ForCCCCTCAGAATGATATTTGTCCTCA383[34,35]
Cyt b RevCATCCAACATCTCAGCATGATGAAA
Publisher’s Note: MDPI stays neutral with regard to jurisdictional claims in published maps and institutional affiliations.

