
Microencapsulation of Cyclocarya paliurus (Batal.) Iljinskaja Extracts: A Promising Technique to Protect Phenolic Compounds and Antioxidant Capacities

 ,
,
Abstract
:1. Introduction
2. Materials and Methods
2.1. Materials and Chemicals
2.2. Preparation of C. paliurus Extracts
2.3. Feed Solution and Spray-Drying Process
2.4. Characterization of Spray-Dried Powders
2.4.1. Moisture Content and Water Activity
2.4.2. Color Analysis
2.4.3. Bulk Density
2.4.4. Hygroscopicity
2.4.5. Solubility
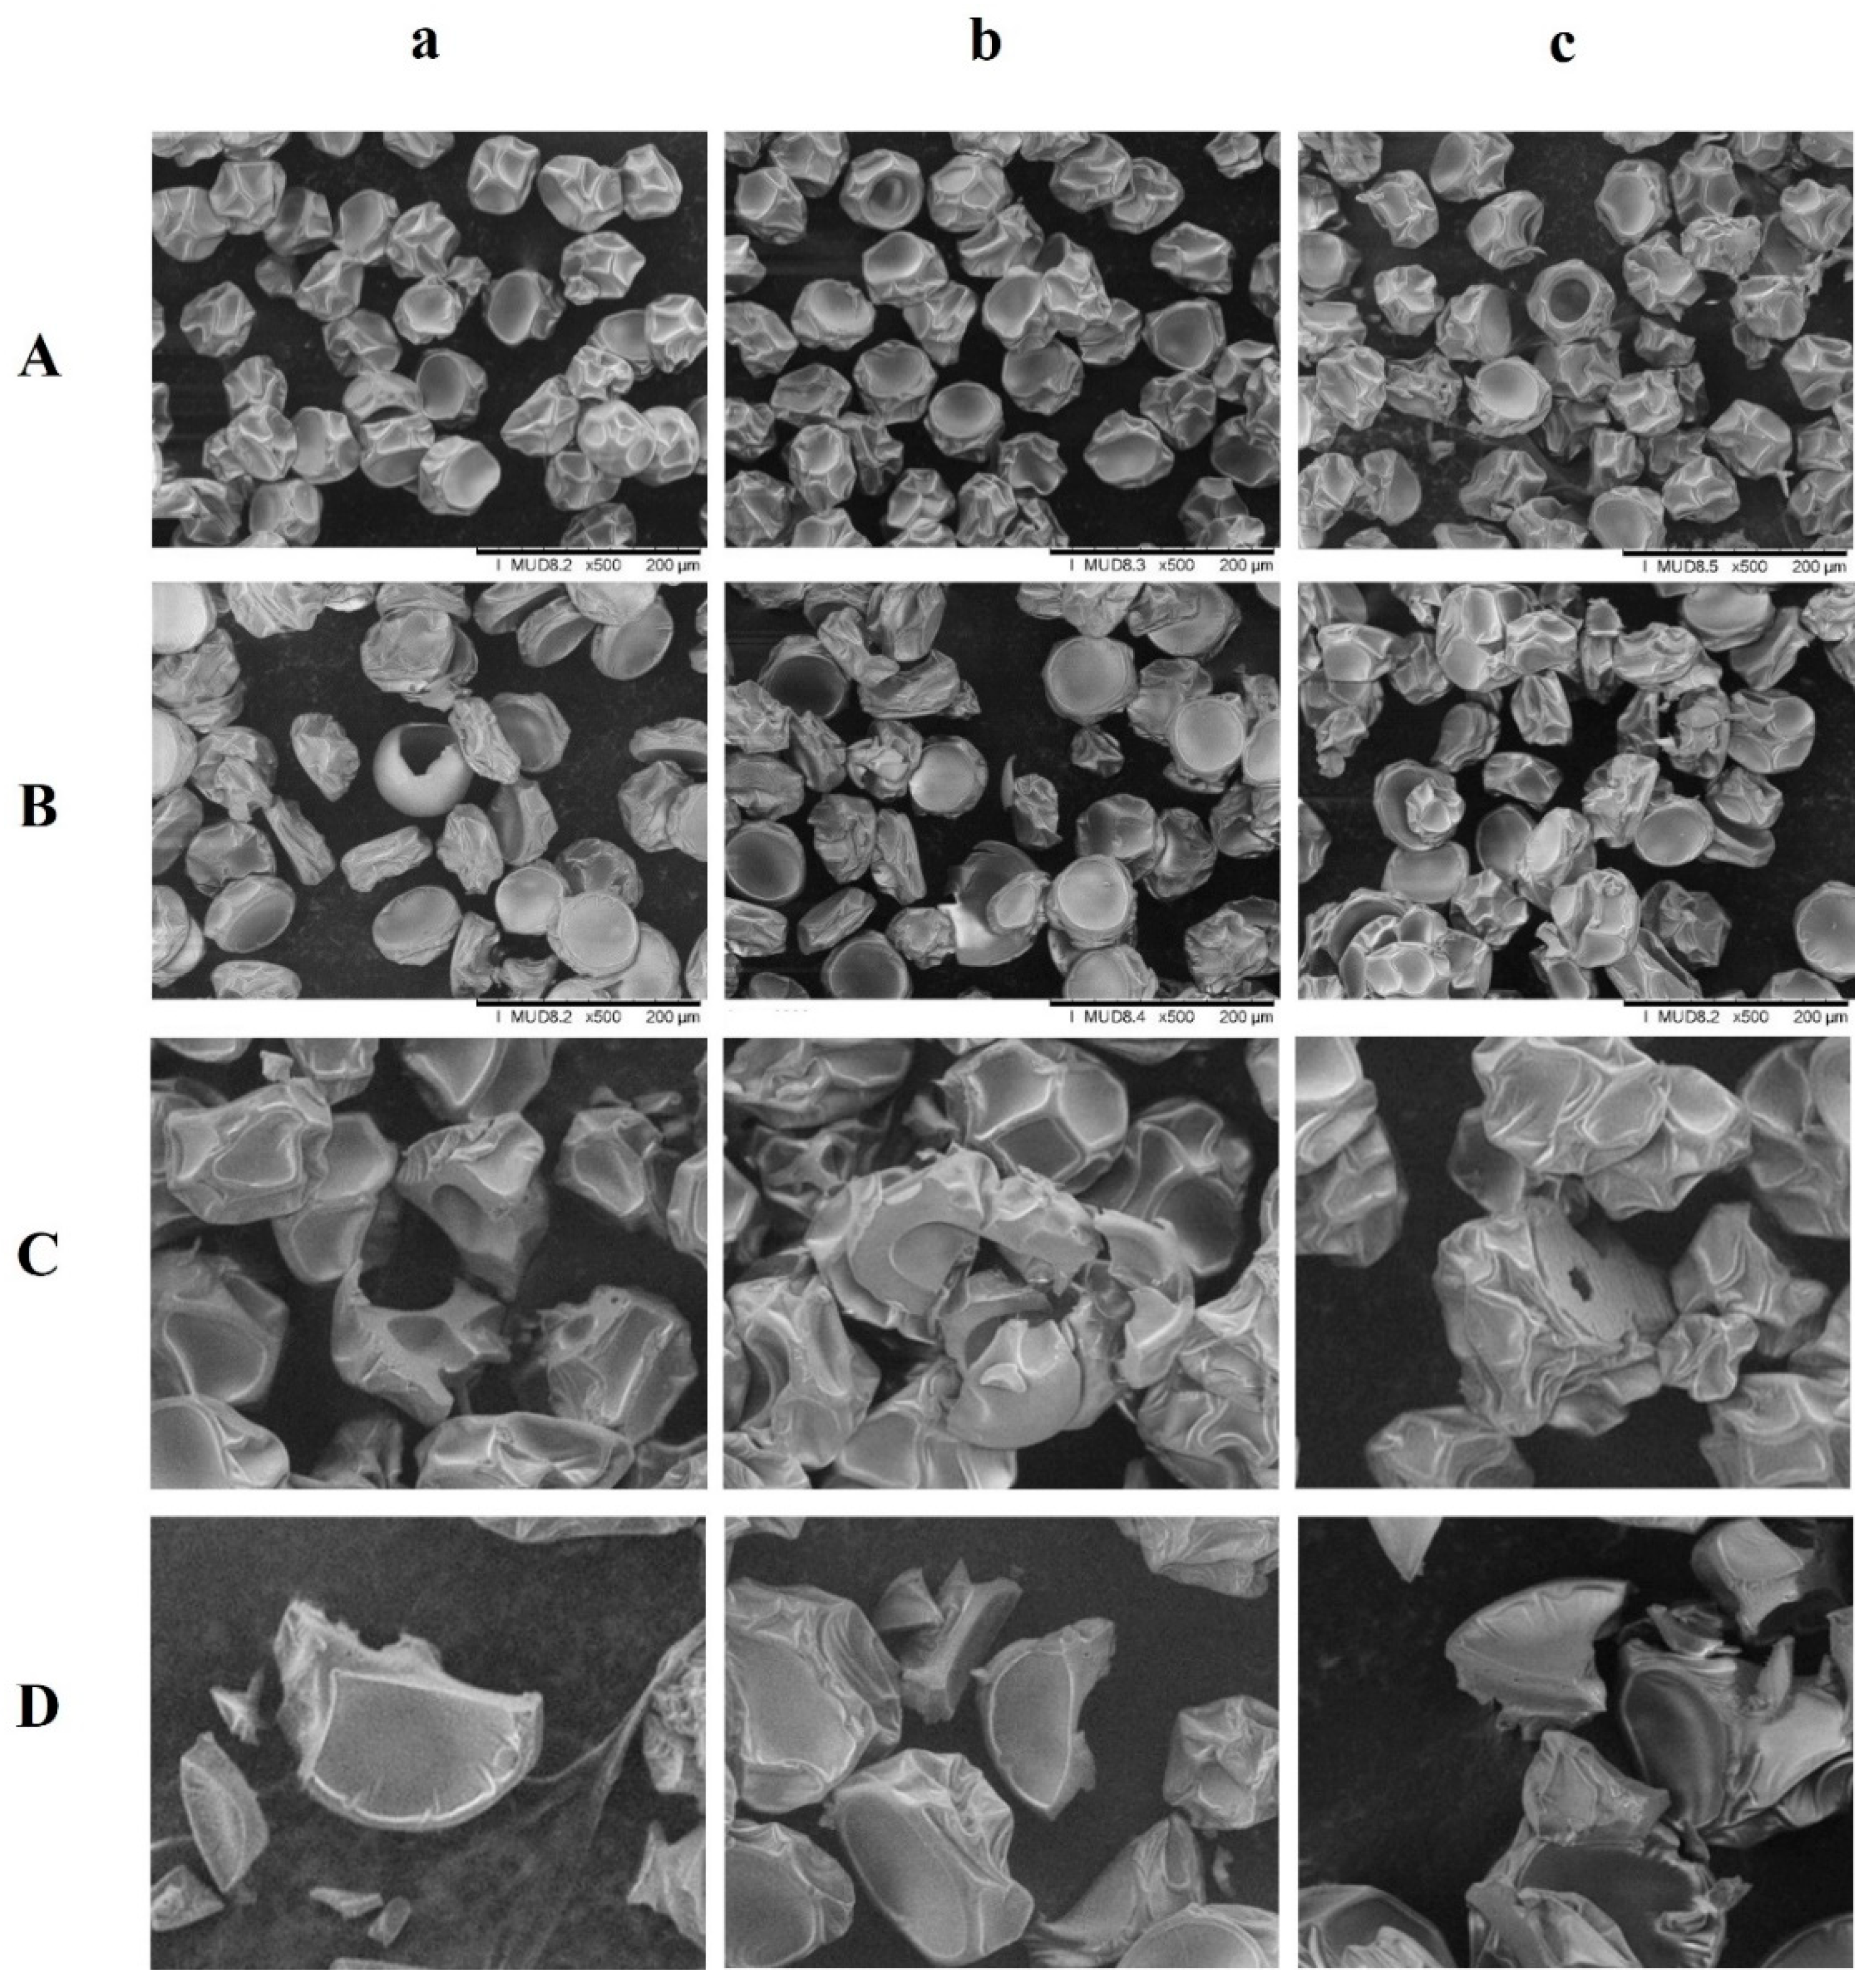
2.5. Particle Morphology
2.6. Total Phenolic Content (TPC) Analysis
2.7. Antioxidant Capacity (AOC) Analysis
2.7.1. DPPH Assay
2.7.2. Ferric Reducing Antioxidant Powder (FRAP) Assay
2.8. Individual Phenolic Compound Analysis
2.9. Statistical Analysis
3. Results and Discussion
3.1. Physical Properties of Spray-Dried C. paliurus Extracts
3.1.1. Water Activity and Moisture Content
3.1.2. Hygroscopicity
3.1.3. Solubility
3.1.4. Bulk Density
3.1.5. Color Evaluation
3.2. Morphology Observation
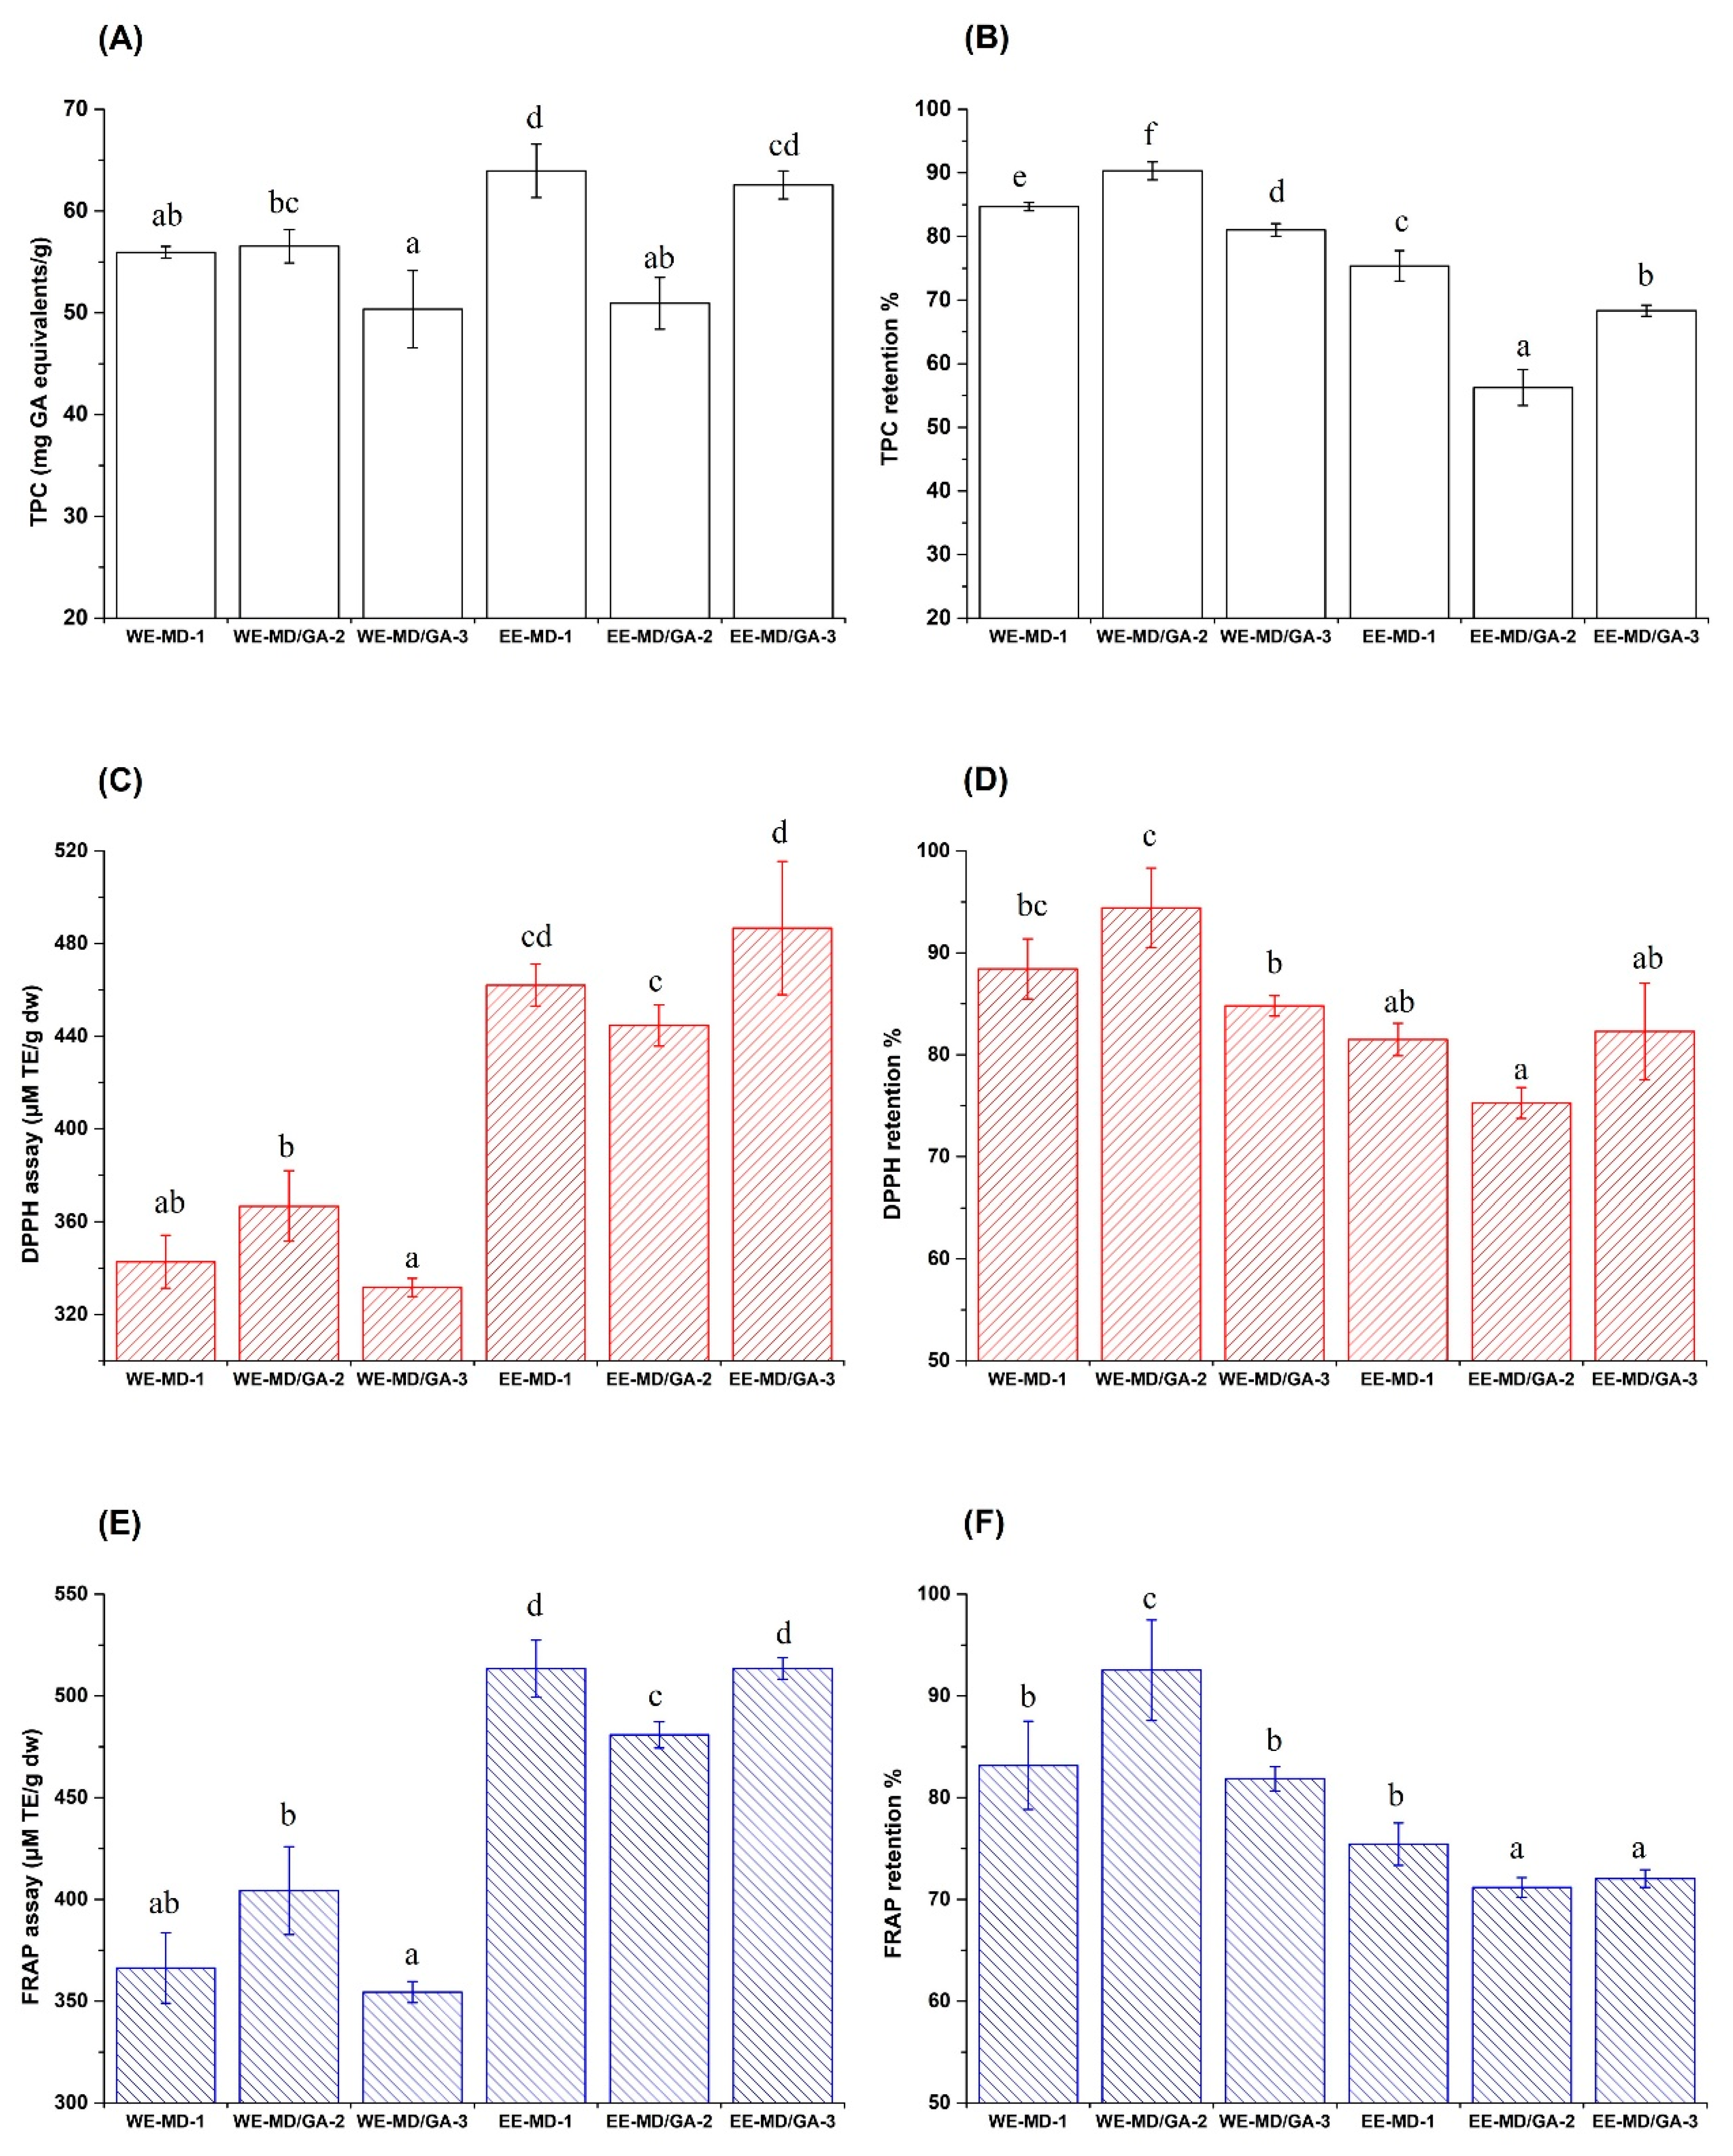
3.3. Retentions of TPC and AOC after Spray Drying
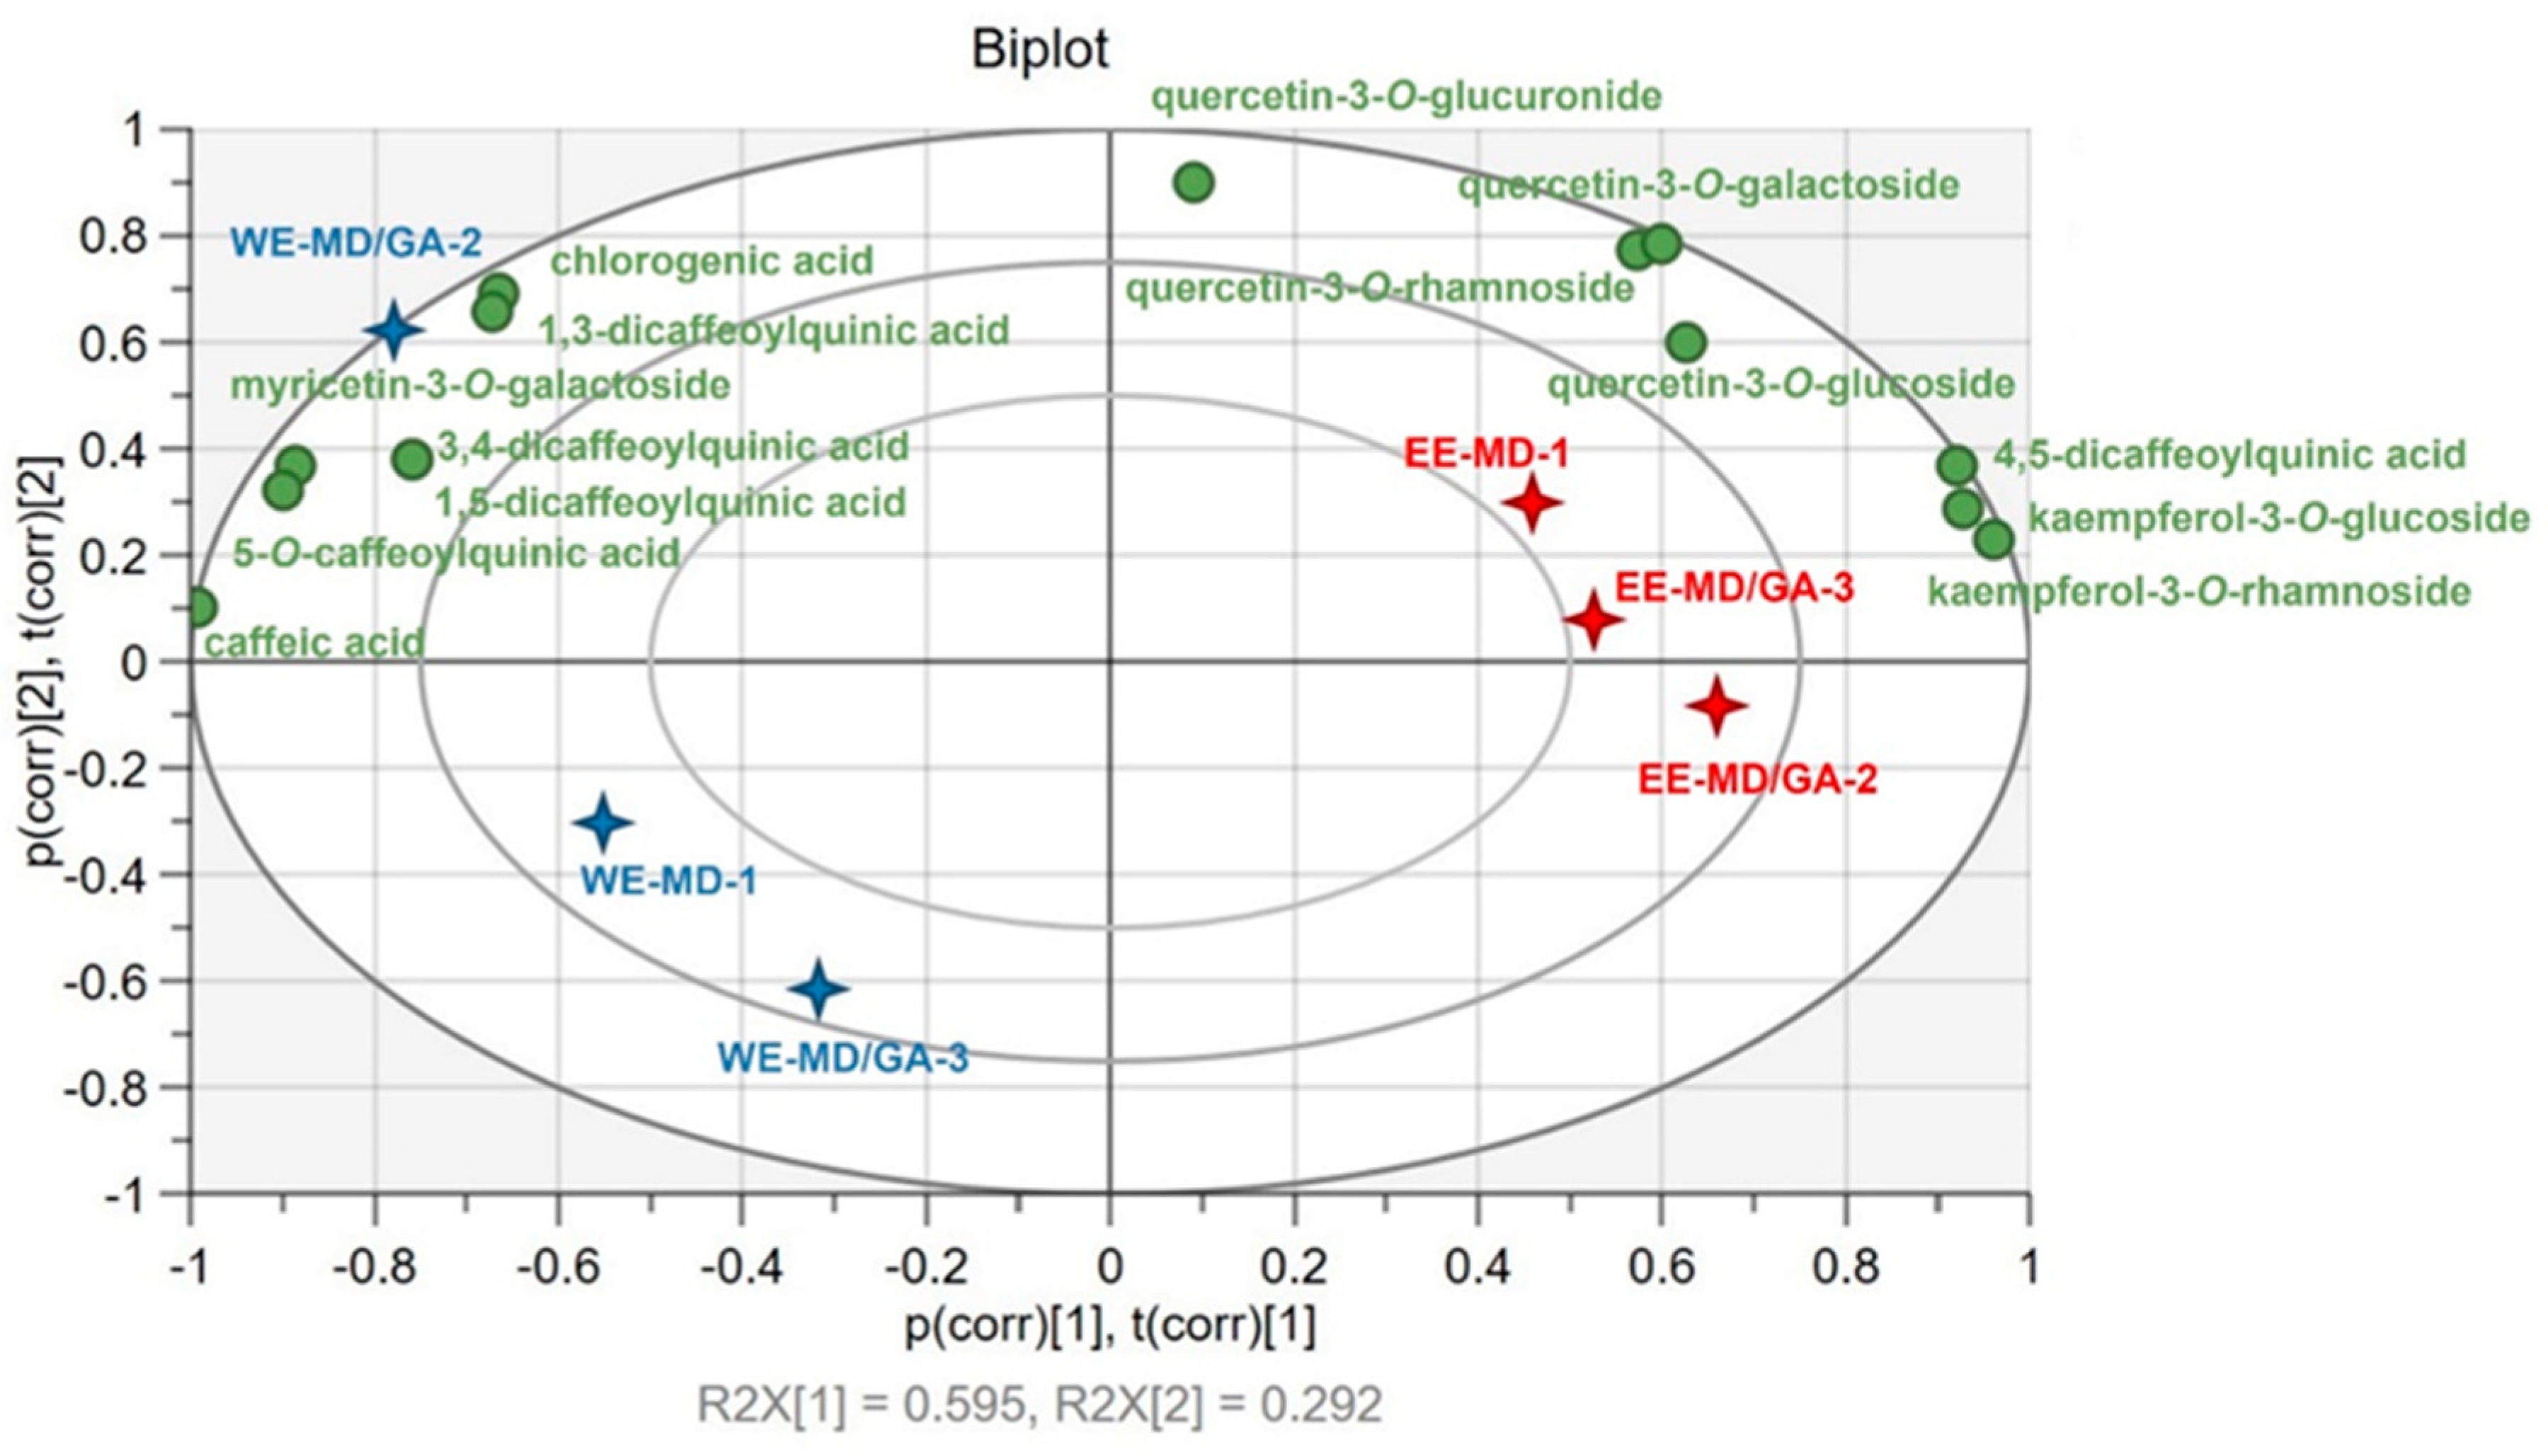
3.4. Individual Phenolic Compounds in C. paliurus Powders
3.5. Retention of Individual Phenolic Compounds after Spray Drying
4. Conclusions
Supplementary Materials
Author Contributions
Funding
Acknowledgments
Conflicts of Interest
References
- Fang, S.; Yang, W.; Chu, X.; Shang, X.; She, C.; Fu, X. Provenance and temporal variations in selected flavonoids in leaves of Cyclocarya paliurus. Food Chem. 2011, 124, 1382–1386. [Google Scholar] [CrossRef]
- Wang, K.Q.; Cao, Y. Research progress in the chemical constituents and pharmacologic activities of Cyclocarya paliurus (Batal.) Iljinshaja. Heilongjiang Med. J. 2007, 31, 577–579. [Google Scholar]
- Wang, Q.; Jiang, C.; Fang, S.; Wang, J.; Ji, Y.; Shang, X.; Ni, Y.; Yin, Z.; Zhang, J. Antihyperglycemic, antihyperlipidemic and antioxidant effects of ethanol and aqueous extracts of Cyclocarya paliurus leaves in type 2 diabetic rats. J. Ethnopharmacol. 2013, 150, 1119–1127. [Google Scholar] [CrossRef]
- Xie, J.-H.; Xie, M.-Y.; Nie, S.-P.; Shen, M.-Y.; Wang, Y.-X.; Li, C. Isolation, chemical composition and antioxidant activities of a water-soluble polysaccharide from Cyclocarya paliurus (Batal.) Iljinskaja. Food Chem. 2010, 119, 1626–1632. [Google Scholar] [CrossRef]
- Lei, X.; Hu, W.-B.; Yang, Z.-W.; Hui, C.; Wang, N.; Liu, X.; Wang, W.-J. Enzymolysis-ultrasonic assisted extraction of flavanoid from Cyclocarya paliurus (Batal.) Iljinskaja:HPLC profile, antimicrobial and antioxidant activity. Ind. Crop. Prod. 2019, 130, 615–626. [Google Scholar]
- Xie, J.H.; Shen, M.Y.; Xie, M.Y.; Nie, S.P.; Chen, Y.; Li, C.; Huang, D.F.; Wang, Y.X. Ultrasonic-assisted extraction, antimicrobial and antioxidant activities of Cyclocarya paliurus (Batal.) Iljinskaja polysaccharides. Carbohydr. Polym. 2012, 89, 177–184. [Google Scholar] [CrossRef]
- Liu, X.; Xie, J.; Jia, S.; Huang, L.; Wang, Z.; Li, C.; Xie, M. Immunomodulatory effects of an acetylated Cyclocarya paliurus polysaccharide on murine macrophages RAW264. 7. Int. J. Biol. Macromol. 2017, 98, 576–581. [Google Scholar] [CrossRef]
- Xie, M.Y.; Li, L.; Nie, S.P.; Wang, X.R.; Lee, F.S. Determination of speciation of elements related to blood sugar in bioactive extracts from Cyclocarya paliurus leaves by FIA-ICP-MS. Eur. Food Res. Technol. 2006, 223, 202–209. [Google Scholar] [CrossRef]
- Zhang, J.; Shen, Q.; Lu, J.-C.; Li, J.-Y.; Liu, W.-Y.; Yang, J.-J.; Li, J.; Xiao, K. Phenolic compounds from the leaves of Cyclocarya paliurus (Batal.) Ijinskaja and their inhibitory activity against PTP1B. Food Chem. 2010, 119, 1491–1496. [Google Scholar] [CrossRef]
- Hu, W.-B.; Zhao, J.; Chen, H.; Xiong, L.; Wang, W.-J. Polysaccharides from Cyclocarya paliurus: Chemical composition and lipid-lowering effect on rats challenged with high-fat diet. J. Funct. Foods 2017, 36, 262–273. [Google Scholar] [CrossRef]
- Zhou, M.; Chen, P.; Lin, Y.; Fang, S.; Shang, X. A Comprehensive assessment of bioactive metabolites, antioxidant and antiproliferative activities of Cyclocarya paliurus (Batal.) Iljinskaja leaves. Forests 2019, 10, 625. [Google Scholar] [CrossRef] [Green Version]
- Yang, Z.; Wang, J.; Li, J.; Xiong, L.; Chen, H.; Liu, X.; Wang, N.; Ouyang, K.; Wang, W. Antihyperlipidemic and hepatoprotective activities of polysaccharide fraction from Cyclocarya paliurus in high-fat emulsion-induced hyperlipidaemic mice. Carbohydr. Polym. 2018, 183, 11–20. [Google Scholar] [CrossRef]
- Zhou, M.; Quek, S.Y.; Shang, X.; Fang, S. Geographical variations of triterpenoid contents in Cyclocarya paliurus leaves and their inhibitory effects on HeLa cells. Ind. Crop. Prod. 2021, 162, 113314. [Google Scholar] [CrossRef]
- Minatel, I.O.; Borges, C.V.; Ferreira, M.I.; Gomez, H.A.G.; Chen, O.; Lima, G. Phenolic Compounds: Functional Properties, Impact of Processing and Bioavailability. In Phenolic Compounds—Biological Activity; Soto-Hernandez, M., Palma-Tenango, M., del Rosario Garcia Mateos, M., Eds.; InTech: Nappanee, IN, USA, 2017. [Google Scholar] [CrossRef] [Green Version]
- Wu, W.D.; Amelia, R.; Hao, N.; Selomulya, C.; Zhao, D.; Chiu, Y.-L.; Chen, X.D. Assembly of uniform photoluminescent microcomposites using a novel micro-fluidic-jet-spray-dryer. AIChE J. 2010, 57, 2726–2737. [Google Scholar] [CrossRef]
- Zhang, C.; Khoo, S.L.A.; Chen, X.D.; Quek, S.Y. Microencapsulation of fermented noni juice via micro-fluidic-jet spray drying: Evaluation of powder properties and functionalities. Powder Technol. 2019, 361, 995–1005. [Google Scholar] [CrossRef]
- Wang, Y.; Liu, W.; Chen, X.D.; Selomulya, C. Micro-encapsulation and stabilization of DHA containing fish oil in protein-based emulsion through mono-disperse droplet spray dryer. J. Food Eng. 2016, 175, 74–84. [Google Scholar] [CrossRef]
- Huang, E.; Quek, S.Y.; Fu, N.; Wu, W.D.; Chen, X.D. Co-encapsulation of coenzyme Q10 and vitamin E: A study of micro-capsule formation and its relation to structure and functionalities using single droplet drying and micro-fluidic-jet spray drying. J. Food Eng. 2019, 247, 45–55. [Google Scholar] [CrossRef]
- Fu, N.; You, Y.-J.; Quek, S.Y.; Wu, W.D.; Chen, X.D. Interplaying Effects of Wall and Core Materials on the Property and Functionality of Microparticles for Co-Encapsulation of Vitamin E with Coenzyme Q10. Food Bioprocess Technol. 2020, 13, 705–721. [Google Scholar] [CrossRef]
- Zhang, J.; Zhang, C.; Chen, X.; Quek, S.Y. Effect of spray drying on phenolic compounds of cranberry juice and their stability during storage. J. Food Eng. 2019, 269, 109744. [Google Scholar] [CrossRef]
- Chen, X.; Ting, J.L.H.; Peng, Y.; Tangjaidee, P.; Zhu, Y.; Li, Q.; Shan, Y.; Quek, S.Y. Comparing Three Types of Mandarin Powders Prepared via Microfluidic-Jet Spray Drying: Physical Properties, Phenolic Retention and Volatile Profiling. Foods 2021, 10, 123. [Google Scholar] [CrossRef]
- Pasrija, D.; Ezhilarasi, P.; Indrani, D.; Anandharamakrishnan, C. Microencapsulation of green tea polyphenols and its effect on incorporated bread quality. LWT—Food Sci. Technol. 2015, 64, 289–296. [Google Scholar] [CrossRef]
- Ballesteros, L.F.; Ramirez, M.J.; Orrego, C.; Teixeira, J.; Mussatto, S.I. Encapsulation of antioxidant phenolic compounds extracted from spent coffee grounds by freeze-drying and spray-drying using different coating materials. Food Chem. 2017, 237, 623–631. [Google Scholar] [CrossRef] [Green Version]
- Cian, R.E.; Campos-Soldini, A.; Chel-Guerrero, L.; Drago, S.R.; Betancur-Ancona, D. Bioactive Phaseolus lunatuspeptides release from maltodextrin/gum arabic microcapsules obtained by spray drying after simulated gastrointestinal digestion. Int. J. Food Sci. Technol. 2018, 54, 2002–2009. [Google Scholar] [CrossRef] [Green Version]
- Zhang, C.; Chen, X.; Zhang, J.; Kilmartin, P.A.; Quek, S.Y. Exploring the effects of microencapsulation on odour retention of fermented noni juice. J. Food Eng. 2019, 273, 109892. [Google Scholar] [CrossRef]
- Mazumder, M.A.R.; Ranganathan, T.V. Encapsulation of isoflavone with milk, maltodextrin and gum acacia improves its stability. Curr. Res. Food Sci. 2020, 2, 77–83. [Google Scholar] [CrossRef]
- Tontul, I.; Topuz, A. Spray-drying of fruit and vegetable juices: Effect of drying conditions on the product yield and physical properties. Trends Food Sci. Technol. 2017, 63, 91–102. [Google Scholar] [CrossRef]
- Wandrey, C.; Bartkowiak, A.; Harding, S.E. Materials for encapsulation. In Encapsulation Technologies for Active Food Ingredients and Food Processing; Springer: New York, NY, USA, 2010; pp. 31–100. [Google Scholar]
- Rigon, R.T.; Norena, C.P.Z. Microencapsulation by spray-drying of bioactive compounds extracted from blackberry (rubus fruticosus). J. Food Sci. Technol. 2015, 53, 1515–1524. [Google Scholar] [CrossRef] [PubMed] [Green Version]
- Nadeem, H.; Torun, M.; Özdemir, F. Spray drying of the mountain tea (Sideritis stricta) water extract by using different hydrocolloid carriers. LWT—Food Sci. Technol. 2011, 44, 1626–1635. [Google Scholar] [CrossRef]
- Tonon, R.V.; Brabet, C.; Pallet, D.; Brat, P.; Hubinger, M.D. Physicochemical and morphological characterisation of açai (Euterpe oleraceae Mart.) powder produced with different carrier agents. Int. J. Food Sci. Technol. 2009, 44, 1950–1958. [Google Scholar] [CrossRef]
- Dantas, D.; Pasquali, M.A.; Cavalcanti-Mata, M.; Duarte, M.E.; Lisboa, H.M. Influence of spray drying conditions on the properties of avocado powder drink. Food Chem. 2018, 266, 284–291. [Google Scholar] [CrossRef] [PubMed]
- Quek, S.Y.; Chok, N.K.; Swedlund, P. The physicochemical properties of spray-dried watermelon powders. Chem. Eng. Process. Process. Intensif. 2007, 46, 386–392. [Google Scholar] [CrossRef]
- Bhandari, B.; Senoussi, A.; Dumoulin, E.; Lebert, A. Spray drying of concentrated fruit juices. Dry. Technol. 1993, 11, 1081–1092. [Google Scholar] [CrossRef]
- Tolun, A.; Altintas, Z.; Artik, N. Microencapsulation of grape polyphenols using maltodextrin and gum arabic as two alter-native coating materials: Development and characterization. J. Biotechnol. 2016, 239, 23–33. [Google Scholar] [CrossRef]
- Silva, F.; Torres, L.; Silva, L.; Figueiredo, R.; Garruti, D.; Araujo, T.; Duarte, A.; Brito, D.; Ricardo, N. Cashew gum and mal-trodextrin particles for green tea (Camellia sinensis var Assamica) extract encapsulation. Food Chem. 2018, 261, 169–175. [Google Scholar] [CrossRef] [PubMed]
- Suravanichnirachorn, W.; Haruthaithanasan, V.; Suwonsichon, S.; Sukatta, U.; Maneeboon, T.; Chantrapornchai, W. Effect of carrier type and concentration on the properties, anthocyanins and antioxidant activity of freeze-dried mao [Antidesma bunius (L.) Spreng] powders. Agric. Nat. Resour. 2018, 52, 354–360. [Google Scholar] [CrossRef]
- Sun, S.; Du, G.J.; Qi, L.W.; Williams, S.; Wang, C.Z.; Yuan, C.S. Hydrophobic constituents and their potential anticancer activities from Devil’s Club (Oplopanax horridus Miq.). J. Ethnopharmacol. 2010, 132, 280–285. [Google Scholar] [CrossRef] [Green Version]
- Kwapinska, M.; Zbicinski, I. Prediction of Final Product Properties after Cocurrent Spray Drying. Dry. Technol. 2005, 23, 1653–1665. [Google Scholar] [CrossRef]
- Solval, K.M.; Sundararajan, S.; Alfaro, L.; Sathivel, S. Development of cantaloupe (Cucumis melo) juice powders using spray drying technology. LWT—Food Sci. Technol. 2012, 46, 287–293. [Google Scholar] [CrossRef]
- Zhang, C.; Fu, N.; Quek, S.Y.; Zhang, J.; Chen, X.D. Exploring the drying behaviors of microencapsulated noni juice using reaction engineering approach (REA) mathematical modelling. J. Food Eng. 2019, 248, 53–61. [Google Scholar] [CrossRef]
- Idham, Z.; Muhamad, I.I.; Sarmidi, M.R. Degradation kinetics and color stability of spray-dried encapsulated anthocyanins from Hibiscus sabdariffa L. J. Food Process. Eng. 2011, 35, 522–542. [Google Scholar] [CrossRef]
- Tsali, A.; Goula, A.M. Valorization of grape pomace: Encapsulation and storage stability of its phenolic extract. Powder Technol. 2018, 340, 194–207. [Google Scholar] [CrossRef]
- Ferrari, C.C.; Germer, S.P.M.; Alvim, I.D.; De Aguirre, J.M. Storage Stability of Spray-Dried Blackberry Powder Produced with Maltodextrin or Gum Arabic. Dry. Technol. 2013, 31, 470–478. [Google Scholar] [CrossRef]
- Sólyom, K.; Solá, R.; Cocero, M.J.; Mato, R.B. Thermal degradation of grape marc polyphenols. Food Chem. 2014, 159, 361–366. [Google Scholar] [CrossRef] [PubMed]
- Kowalski, S. Changes of antioxidant activity and formation of 5-hydroxymethylfurfural in honey during thermal and mi-crowave processing. Food Chem. 2013, 141, 1378–1382. [Google Scholar] [CrossRef]
- White, B.L.; Howard, L.R.; Prior, R.L. Impact of Different Stages of Juice Processing on the Anthocyanin, Flavonol, and Procyanidin Contents of Cranberries. J. Agric. Food Chem. 2011, 59, 4692–4698. [Google Scholar] [CrossRef] [PubMed]
- van der Sluis, A.A.; Dekker, M.; van Boekel, M.A. Activity and concentration of polyphenolic antioxidants in apple juice. 3. Stability during storage. J. Agric. Food Chem. 2005, 53, 1073–1080. [Google Scholar] [CrossRef]
- Dawidowicz, A.L.; Typek, R. Thermal Stability of 5-o-Caffeoylquinic Acid in Aqueous Solutions at Different Heating Conditions. J. Agric. Food Chem. 2010, 58, 12578–12584. [Google Scholar] [CrossRef] [PubMed]

| No. | Core (Extract) | Sample Abbreviations | Wall Materials (%) a | |
|---|---|---|---|---|
| MD | GA | |||
| 1 | WE | WE-MD-1 | 100 | 0 |
| 2 | WE | WE-MD/GA-2 | 50 | 50 |
| 3 | WE | WE-MD/GA-3 | 75 | 25 |
| 4 | EE | EE-MD-1 | 100 | 0 |
| 5 | EE | EE-MD/GA-2 | 50 | 50 |
| 6 | EE | EE-MD/GA-3 | 75 | 25 |
| Properties | WE-MD-1 | WE-MD/GA-2 | WE-MD/GA-3 | EE-MD-1 | EE-MD/GA-2 | EE-MD/GA-3 |
|---|---|---|---|---|---|---|
| Moisture Content (%) | 4.09 ± 0.23 a | 4.45 ± 0.21 a | 4.73 ± 0.78 a | 4.63 ± 0.12 a | 5.95 ± 0.77 b | 6.64 ± 1.16 b |
| Water Activity | 0.14 ± 0.01 bc | 0.18 ± 0.00 d | 0.19 ± 0.02 d | 0.11 ± 0.00 a | 0.13 ± 0.02 b | 0.16 ± 0.01 c |
| Hygroscopicity (g moisture/100 g solids) | 3.14 ± 0.40 b | 3.00 ± 0.20 b | 3.70 ± 0.92 b | 2.07 ± 0.34 a | 2.07 ± 0.25 a | 2.16 ± 0.78 a |
| Solubility (%) | 99.12 ± 0.72 d | 94.65 ± 1.40 c | 92.04 ± 1.68 b | 88.81 ± 1.15 a | 89.85 ± 3.11 ab | 89.83 ± 1.42 ab |
| Bulk Density (g/mL) | 0.37 ± 0.01 c | 0.38 ± 0.01 d | 0.38 ± 0.02 cd | 0.32 ± 0.01 ab | 0.33 ± 0.01 b | 0.30 ± 0.00 a |
| Samples | Colour Attributes | Powder Appearance | ||
|---|---|---|---|---|
| L* | A* | B* | ||
| WE-MD-1 | 60.23 ± 0.84 a | 11.49 ± 0.15 a | 19.07 ± 0.45 d |  |
| WE-MD/GA-2 | 59.95 ± 1.53 a | 11.56 ± 0.15 a | 17.90 ± 0.52 c |  |
| WE-MD/GA-3 | 59.75 ± 1.14 a | 11.65 ± 0.07 a | 18.90 ± 0.39 d |  |
| EE-MD-1 | 59.23 ± 0.63 a | 13.25 ± 0.19 c | 17.12 ± 0.41 b | 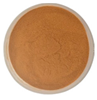 |
| EE-MD/GA-2 | 59.61 ± 0.94 a | 12.94 ± 0.39 b | 14.82 ± 0.94 a |  |
| EE-MD/GA-3 | 60.52 ± 0.62 a | 13.68 ± 0.13 d | 15.42 ± 0.26 a | 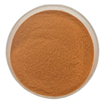 |
| Phenolic Compounds | Content (mg/g dw) | |||||||
|---|---|---|---|---|---|---|---|---|
| WE | EE | WE-MD-1 | WE-MD/GA-2 | WE-MD/GA-3 | EE-MD-1 | EE-MD/GA-2 | EE-MD/GA-3 | |
| quercetin-3-O-glucuronide | 4.13 ± 0.01 A | 4.88 ± 0.03 B | 5.73 ± 0.26 a | 6.26 ± 0.04 b | 5.75 ± 0.15 a | 5.98 ± 0.02 ab | 6.02 ± 0.03 ab | 6.05 ± 0.06 ab |
| R (%) | 134.06 ± 6.15 bc | 152.01 ± 0.84 d | 138.68 ± 3.72 c | 123.25 ± 0.38 a | 122.54 ± 0.56 a | 127.55 ± 1.22 ab | ||
| myricetin-3-O-galactoside | 1.24 ± 0.01 B | 0.96 ± 0.00 A | 1.68 ± 0.06 d | 1.84 ± 0.01 e | 1.44 ± 0.03 c | 1.47 ± 0.07 cd | 1.31 ± 0.03 ab | 1.24 ± 0.05 a |
| R (%) | 128.80 ± 4.62 ab | 149.87 ± 0.70 cd | 115.63 ± 2.37 a | 152.68 ± 6.82 d | 136.65 ± 2.66 bc | 136.92 ± 4.92 bc | ||
| 5-O-caffeoylquinic acid | 2.45 ± 0.01 A | 2.48 ± 0.00 A | 2.15 ± 0.02 bc | 2.30 ± 0.00 d | 2.17 ± 0.00 c | 2.09 ± 0.04 ab | 2.07 ± 0.01 a | 2.06 ± 0.02 a |
| R (%) | 86.10 ± 0.90 ab | 93.77 ± 0.09 c | 89.04 ± 0.11 bc | 83.86 ± 1.63 a | 83.44 ± 0.27 a | 86.20 ± 0.96 ab | ||
| chlorogenic acid | 21.96 ± 0.03 A | 23.52 ± 0.04 B | 17.38 ± 0.02 a | 18.55 ± 0.08 b | 16.93 ± 0.38 a | 17.16 ± 0.23 a | 17.14 ± 0.38 a | 16.94 ± 0.07 a |
| R (%) | 76.54 ± 0.08 ab | 84.56 ± 0.35 c | 77.00 ± 1.71 b | 72.80 ± 0.97 a | 73.01 ± 1.63 a | 75.23 ± 0.30 ab | ||
| quercetin-3-O-glucoside | 0.75 ± 0.01 A | 0.98 ± 0.01 B | 0.62 ± 0.03 b | 0.63 ± 0.02 bc | 0.53 ± 0.01 a | 0.80 ± 0.03 d | 0.66 ± 0.01 bc | 0.71 ± 0.03 c |
| R (%) | 78.94 ± 3.99 bc | 81.90 ± 3.11 c | 71.42 ± 1.18 ab | 82.06 ± 2.64 c | 66.44 ± 1.01 a | 73.14 ± 2.85 ab | ||
| 1,3-dicaffeoylquinic acid | 1.41 ± 0.05 A | 1.61 ± 0.00 A | 1.06 ± 0.01 a | 1.14 ± 0.01 b | 1.06 ± 0.01 a | 1.06 ± 0.02 a | 1.03 ± 0.01 a | 1.07 ± 0.02 a |
| R (%) | 69.78 ± 0.90 c | 78.15 ± 0.64 d | 78.36 ± 0.48 d | 66.16 ± 1.49 ab | 63.58 ± 0.51 a | 68.02 ± 1.33 bc | ||
| quercetin-3-O-rhamnoside | 3.91 ± 0.01 A | 4.81 ± 0.01 B | 2.76 ± 0.05 a | 3.00 ± 0.04 b | 2.74 ± 0.10 a | 2.99 ± 0.01 b | 3.03 ± 0.01 b | 3.02 ± 0.04 b |
| R (%) | 68.46 ± 1.33 c | 76.50 ± 0.94 d | 70.23 ± 2.64 c | 62.17 ± 0.15 a | 62.95 ± 0.26 a | 64.94 ± 0.77 ab | ||
| kaempferol-3-O-glucoside | 1.04 ± 0.01 A | 1.45 ± 0.02 B | 0.74 ± 0.00 a | 0.73 ± 0.00 a | 0.73 ± 0.02 a | 0.95 ± 0.03 c | 0.89 ± 0.02 b | 0.90 ± 0.01 bc |
| R (%) | 73.11 ± 0.30 b | 69.65 ± 0.39 b | 70.60 ± 1.43 b | 64.59 ± 1.78 a | 62.00 ± 1.55 a | 63.59 ± 0.97 a | ||
| 1,5-dicaffeoylquinic acid | 0.25 ± 0.01 A | 0.27 ± 0.00 A | 0.17 ± 0.00 b | 0.17 ± 0.00 b | 0.15 ± 0.01 a | 0.16 ± 0.01 ab | 0.14 ± 0.00 a | 0.15 ± 0.00 ab |
| R (%) | 59.07 ± 0.05 a | 68.18 ± 0.71 b | 57.83 ± 2.62 a | 60.75 ± 2.63 a | 54.18 ± 2.17 a | 58.43 ± 1.22 a | ||
| 3,4-dicaffeoylquinic acid | 0.24 ± 0.00 A | 0.33 ± 0.00 B | 0.16 ± 0.00 cd | 0.16 ± 0.00 d | 0.14 ± 0.01 abc | 0.15 ± 0.01 bcd | 0.13 ± 0.00 a | 0.14 ± 0.00 ab |
| R (%) | 55.58 ± 0.81 c | 67.49 ± 1.49 d | 59.33 ± 3.01 c | 46.54 ± 2.00 b | 39.55 ± 1.12 a | 43.32 ± 0.15 ab | ||
| kaempferol-3-O-rhamnoside | 1.31 ± 0.00 A | 1.89 ± 0.01 B | 0.71 ± 0.01 a | 0.71 ± 0.02 a | 0.70 ± 0.05 a | 1.00 ± 0.03 b | 1.06 ± 0.01 b | 0.98 ± 0.00 b |
| R (%) | 53.56 ± 0.68 a | 54.42 ± 1.29 a | 53.52 ± 3.90 a | 53.37 ± 1.69 a | 55.94 ± 0.33 a | 52.29 ± 0.03 a | ||
| quercetin-3-O-galactoside | 0.52 ± 0.02 A | 0.69 ± 0.01 B | 0.21 ± 0.01 a | 0.28 ± 0.01 b | 0.21 ± 0.00 a | 0.32 ± 0.01 c | 0.28 ± 0.01 b | 0.29 ± 0.01 bc |
| R (%) | 40.68 ± 1.62 a | 52.80 ± 0.90 c | 42.55 ± 0.27 ab | 46.08 ± 0.96 b | 39.87 ± 1.46 a | 42.45 ± 0.91 ab | ||
| caffeic acid | 0.35 ± 0.01 A | 0.34 ± 0.00 A | 0.15 ± 0.00 cd | 0.16 ± 0.00 d | 0.14 ± 0.00 c | 0.12 ± 0.01 ab | 0.11 ± 0.00 a | 0.12 ± 0.01 b |
| R (%) | 41.92 ± 0.52 cd | 44.54 ± 0.73 d | 38.91 ± 0.51 bc | 34.79 ± 2.07 ab | 32.80 ± 0.34 a | 39.74 ± 1.84 bc | ||
| 4,5-dicaffeoylquinic acid | 0.96 ± 0.00 A | 1.40 ± 0.02 B | 0.38 ± 0.02 a | 0.39 ± 0.00 a | 0.36 ± 0.01 a | 0.51 ± 0.01 b | 0.50 ± 0.01 b | 0.50 ± 0.01 b |
| R (%) | 36.22 ± 1.46 a | 40.60 ± 0.00 b | 37.78 ± 0.59 a | 36.84 ±0.60 a | 35.54 ± 0.48 a | 36.03 ± 0.58 a | ||
Publisher’s Note: MDPI stays neutral with regard to jurisdictional claims in published maps and institutional affiliations. |
© 2021 by the authors. Licensee MDPI, Basel, Switzerland. This article is an open access article distributed under the terms and conditions of the Creative Commons Attribution (CC BY) license (https://creativecommons.org/licenses/by/4.0/).
Share and Cite
Chen, X.; Chhun, S.; Xiang, J.; Tangjaidee, P.; Peng, Y.; Quek, S.Y. Microencapsulation of Cyclocarya paliurus (Batal.) Iljinskaja Extracts: A Promising Technique to Protect Phenolic Compounds and Antioxidant Capacities. Foods 2021, 10, 2910. https://doi.org/10.3390/foods10122910
Chen X, Chhun S, Xiang J, Tangjaidee P, Peng Y, Quek SY. Microencapsulation of Cyclocarya paliurus (Batal.) Iljinskaja Extracts: A Promising Technique to Protect Phenolic Compounds and Antioxidant Capacities. Foods. 2021; 10(12):2910. https://doi.org/10.3390/foods10122910
Chicago/Turabian StyleChen, Xiao, Senghak Chhun, Jiqian Xiang, Pipat Tangjaidee, Yaoyao Peng, and Siew Young Quek. 2021. "Microencapsulation of Cyclocarya paliurus (Batal.) Iljinskaja Extracts: A Promising Technique to Protect Phenolic Compounds and Antioxidant Capacities" Foods 10, no. 12: 2910. https://doi.org/10.3390/foods10122910