
Simultaneous Rapid Detection of Aflatoxin B1 and Ochratoxin A in Spices Using Lateral Flow Immuno-Chromatographic Assay


Abstract
:
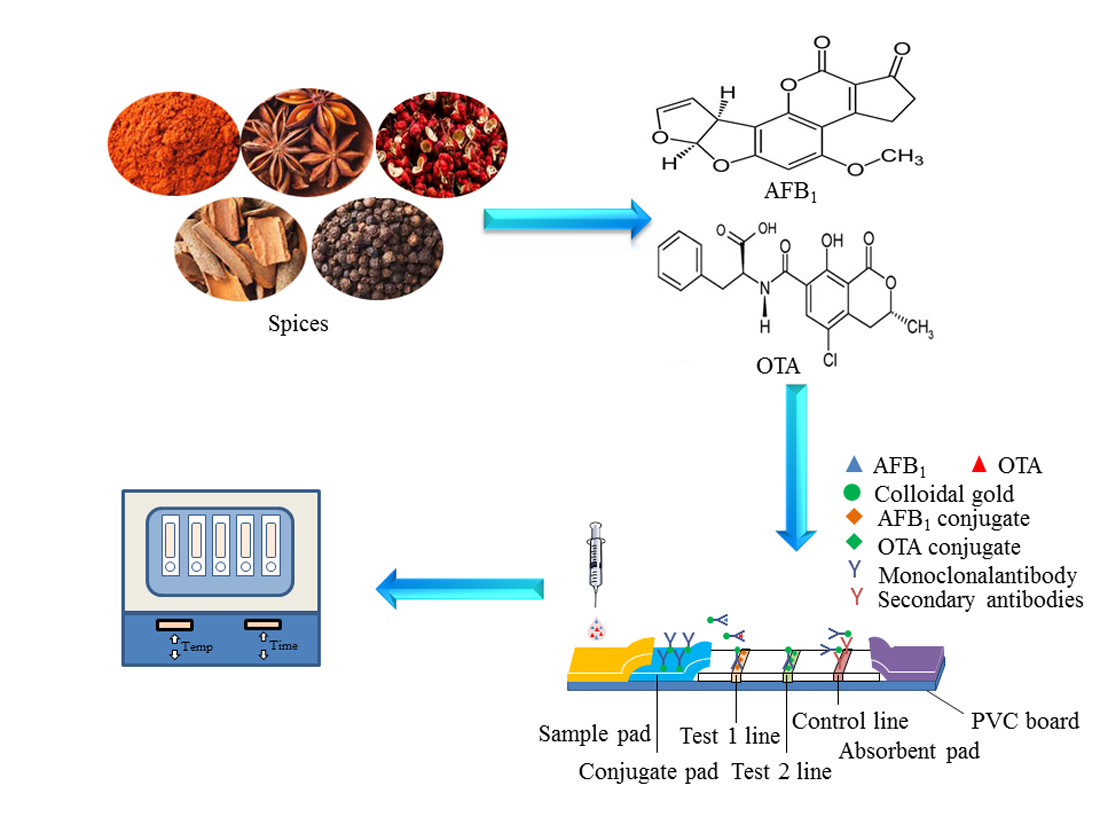
1. Introduction
2. Materials and Methods
2.1. Reagents and Solutions
2.2. Sample Collection
2.3. Gold-Labeled Antibody Preparation
2.4. Sample Pad and Gold Label Pad Processing
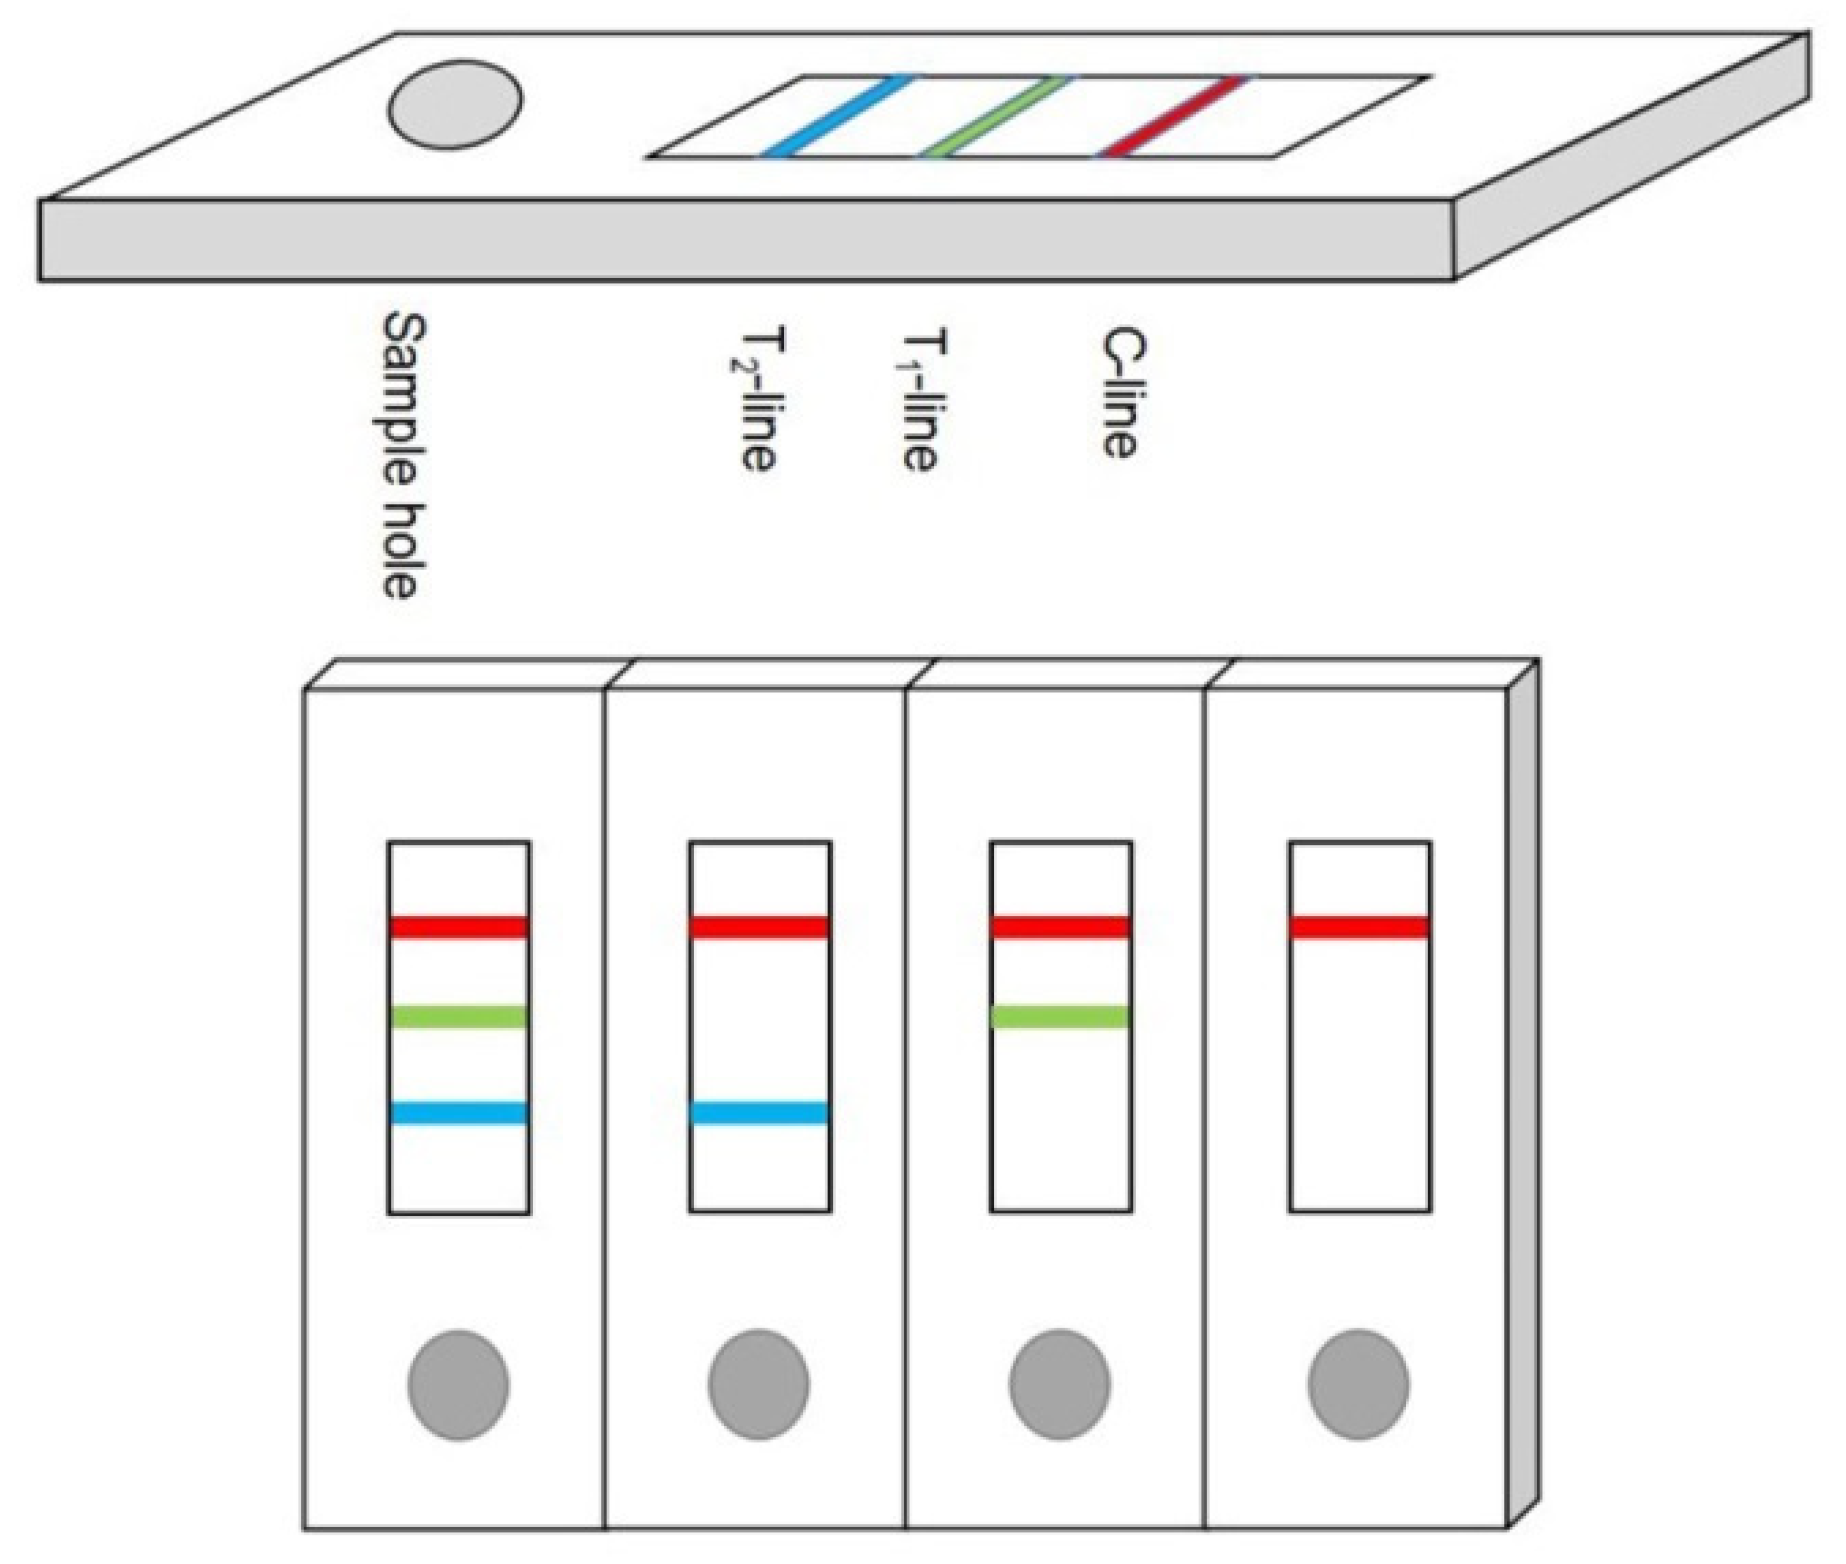
2.5. Test Strip Assembly
2.6. Test Strip Performance Appraisal
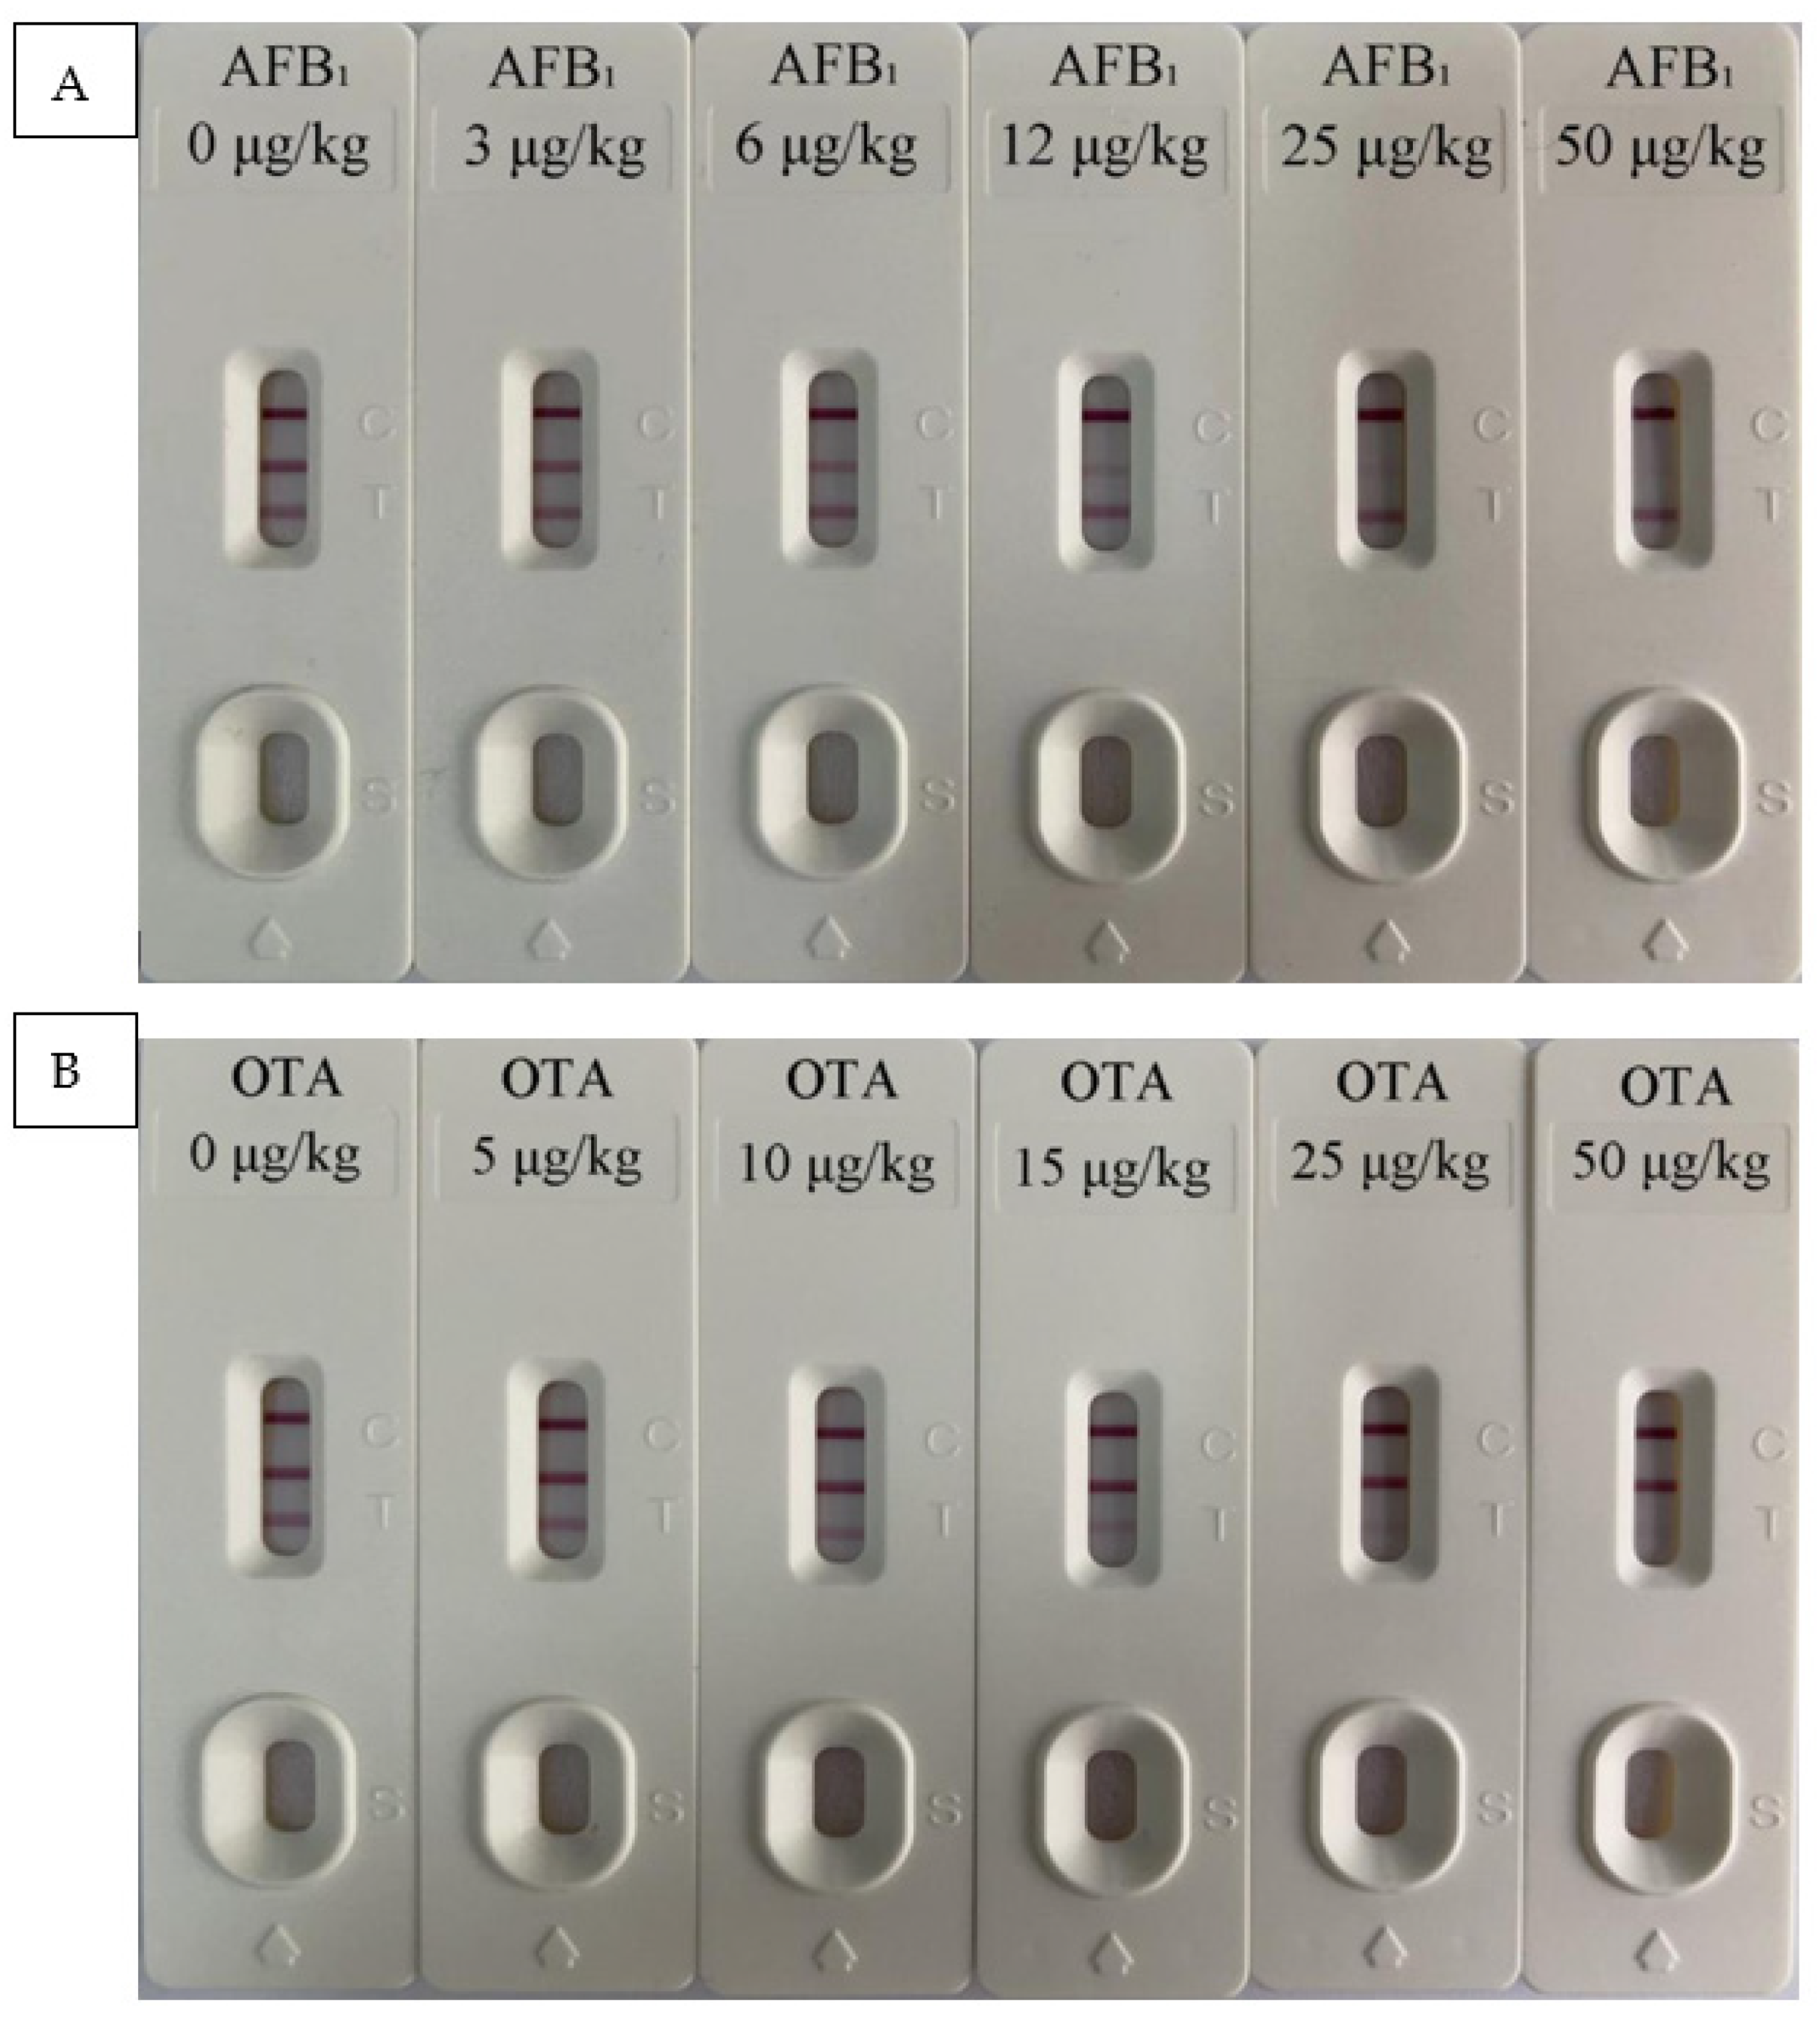
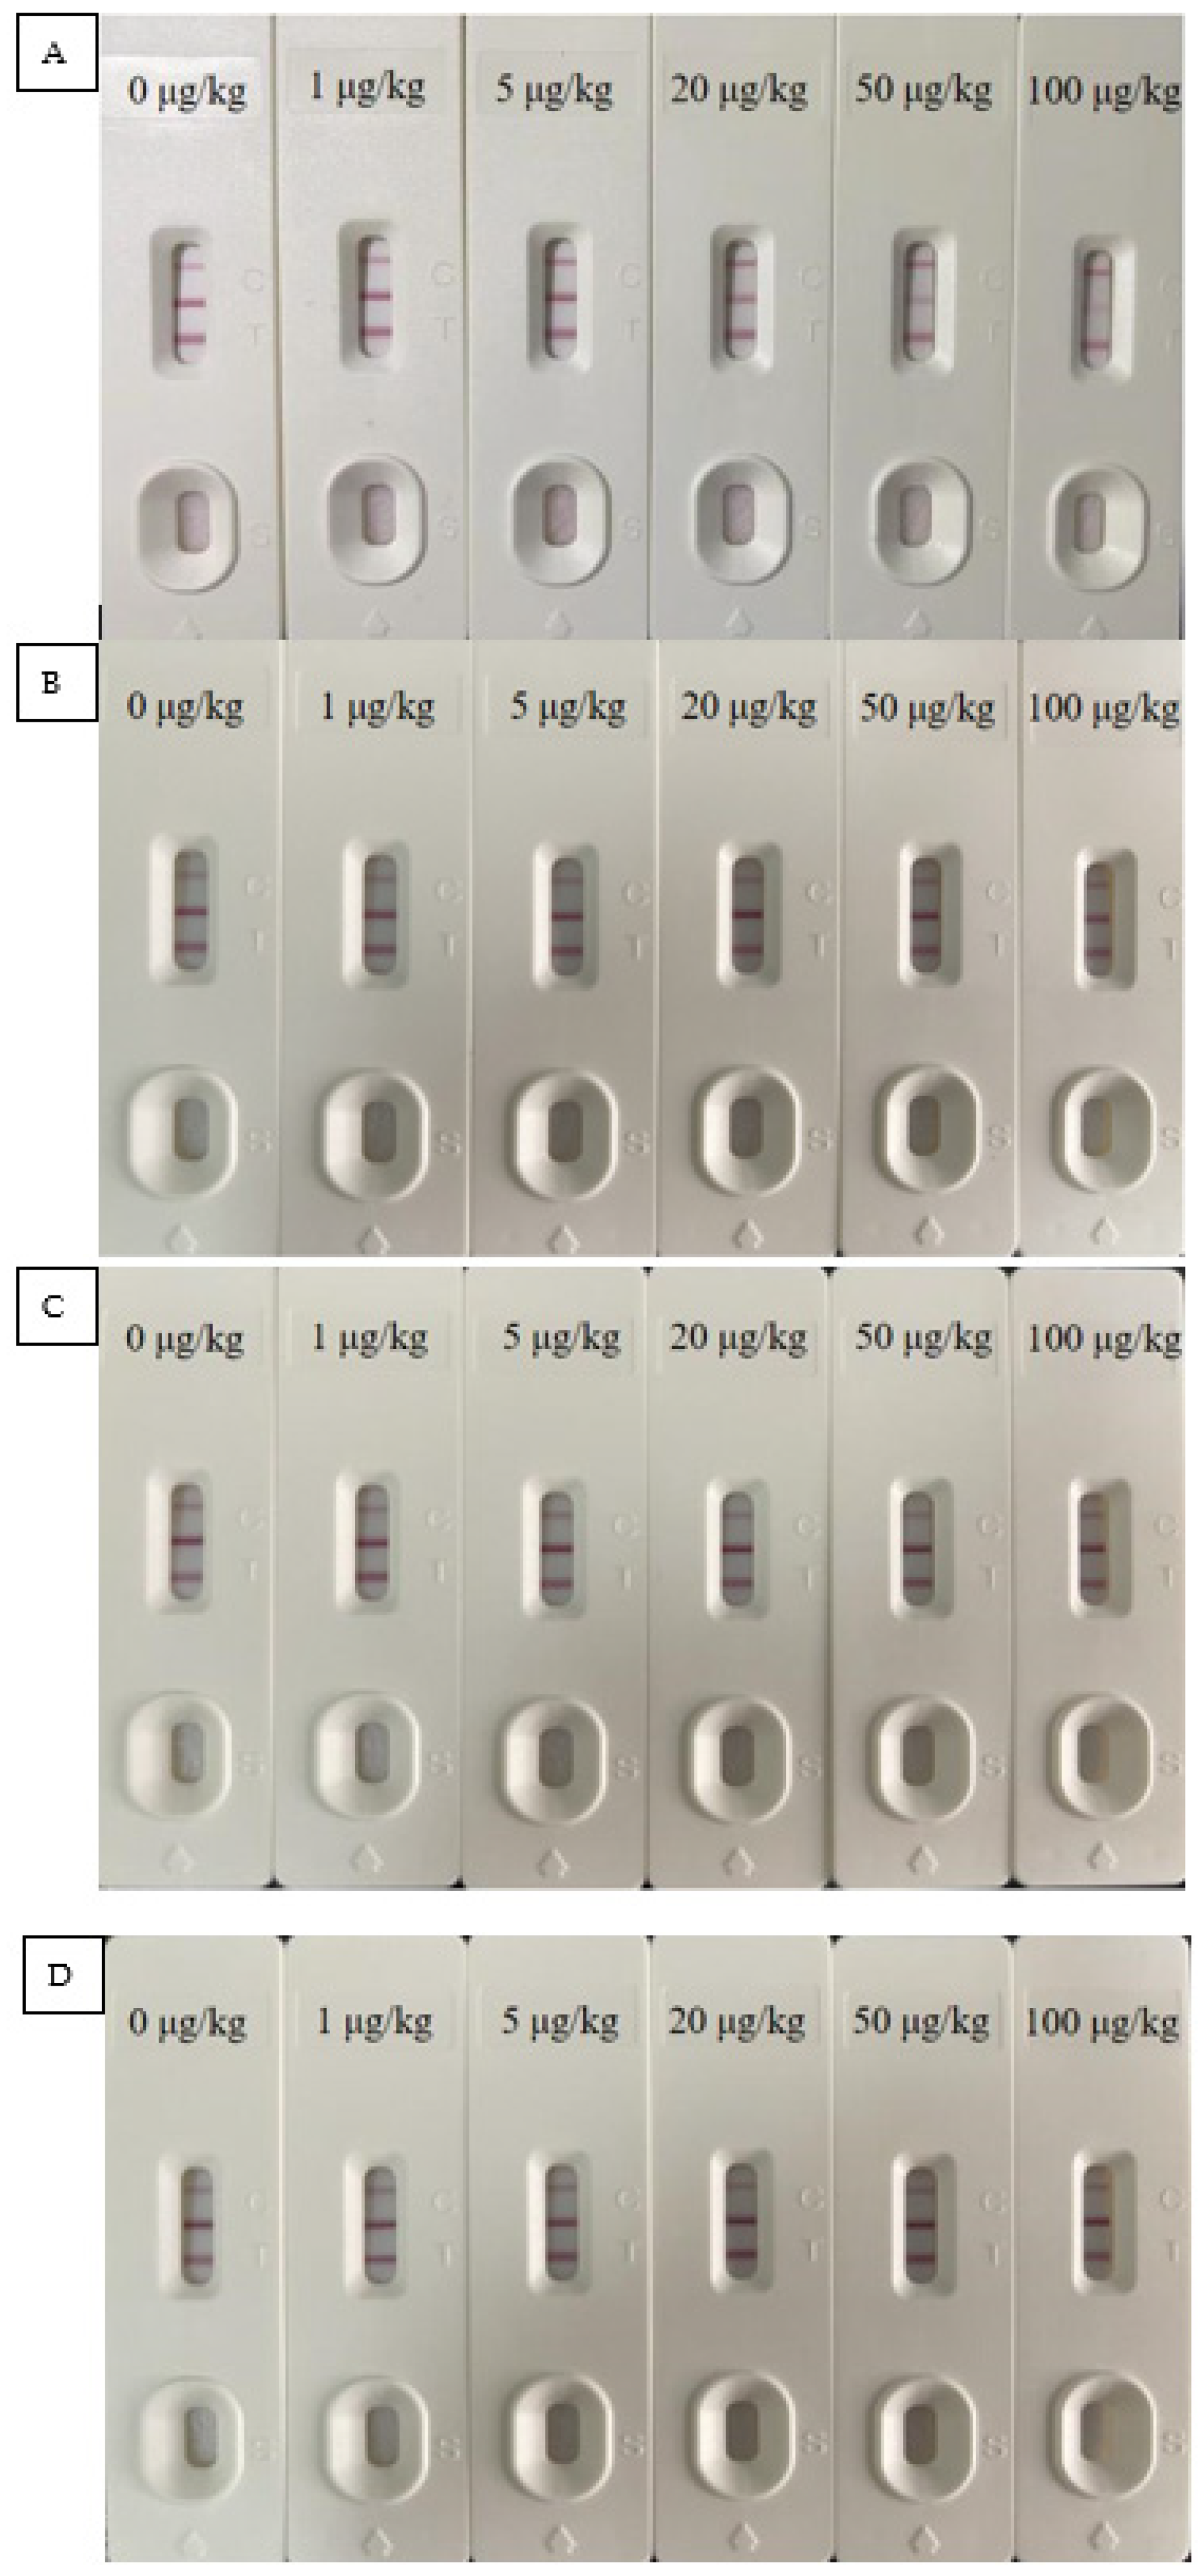
2.6.1. Test Strip Detection Limit Test
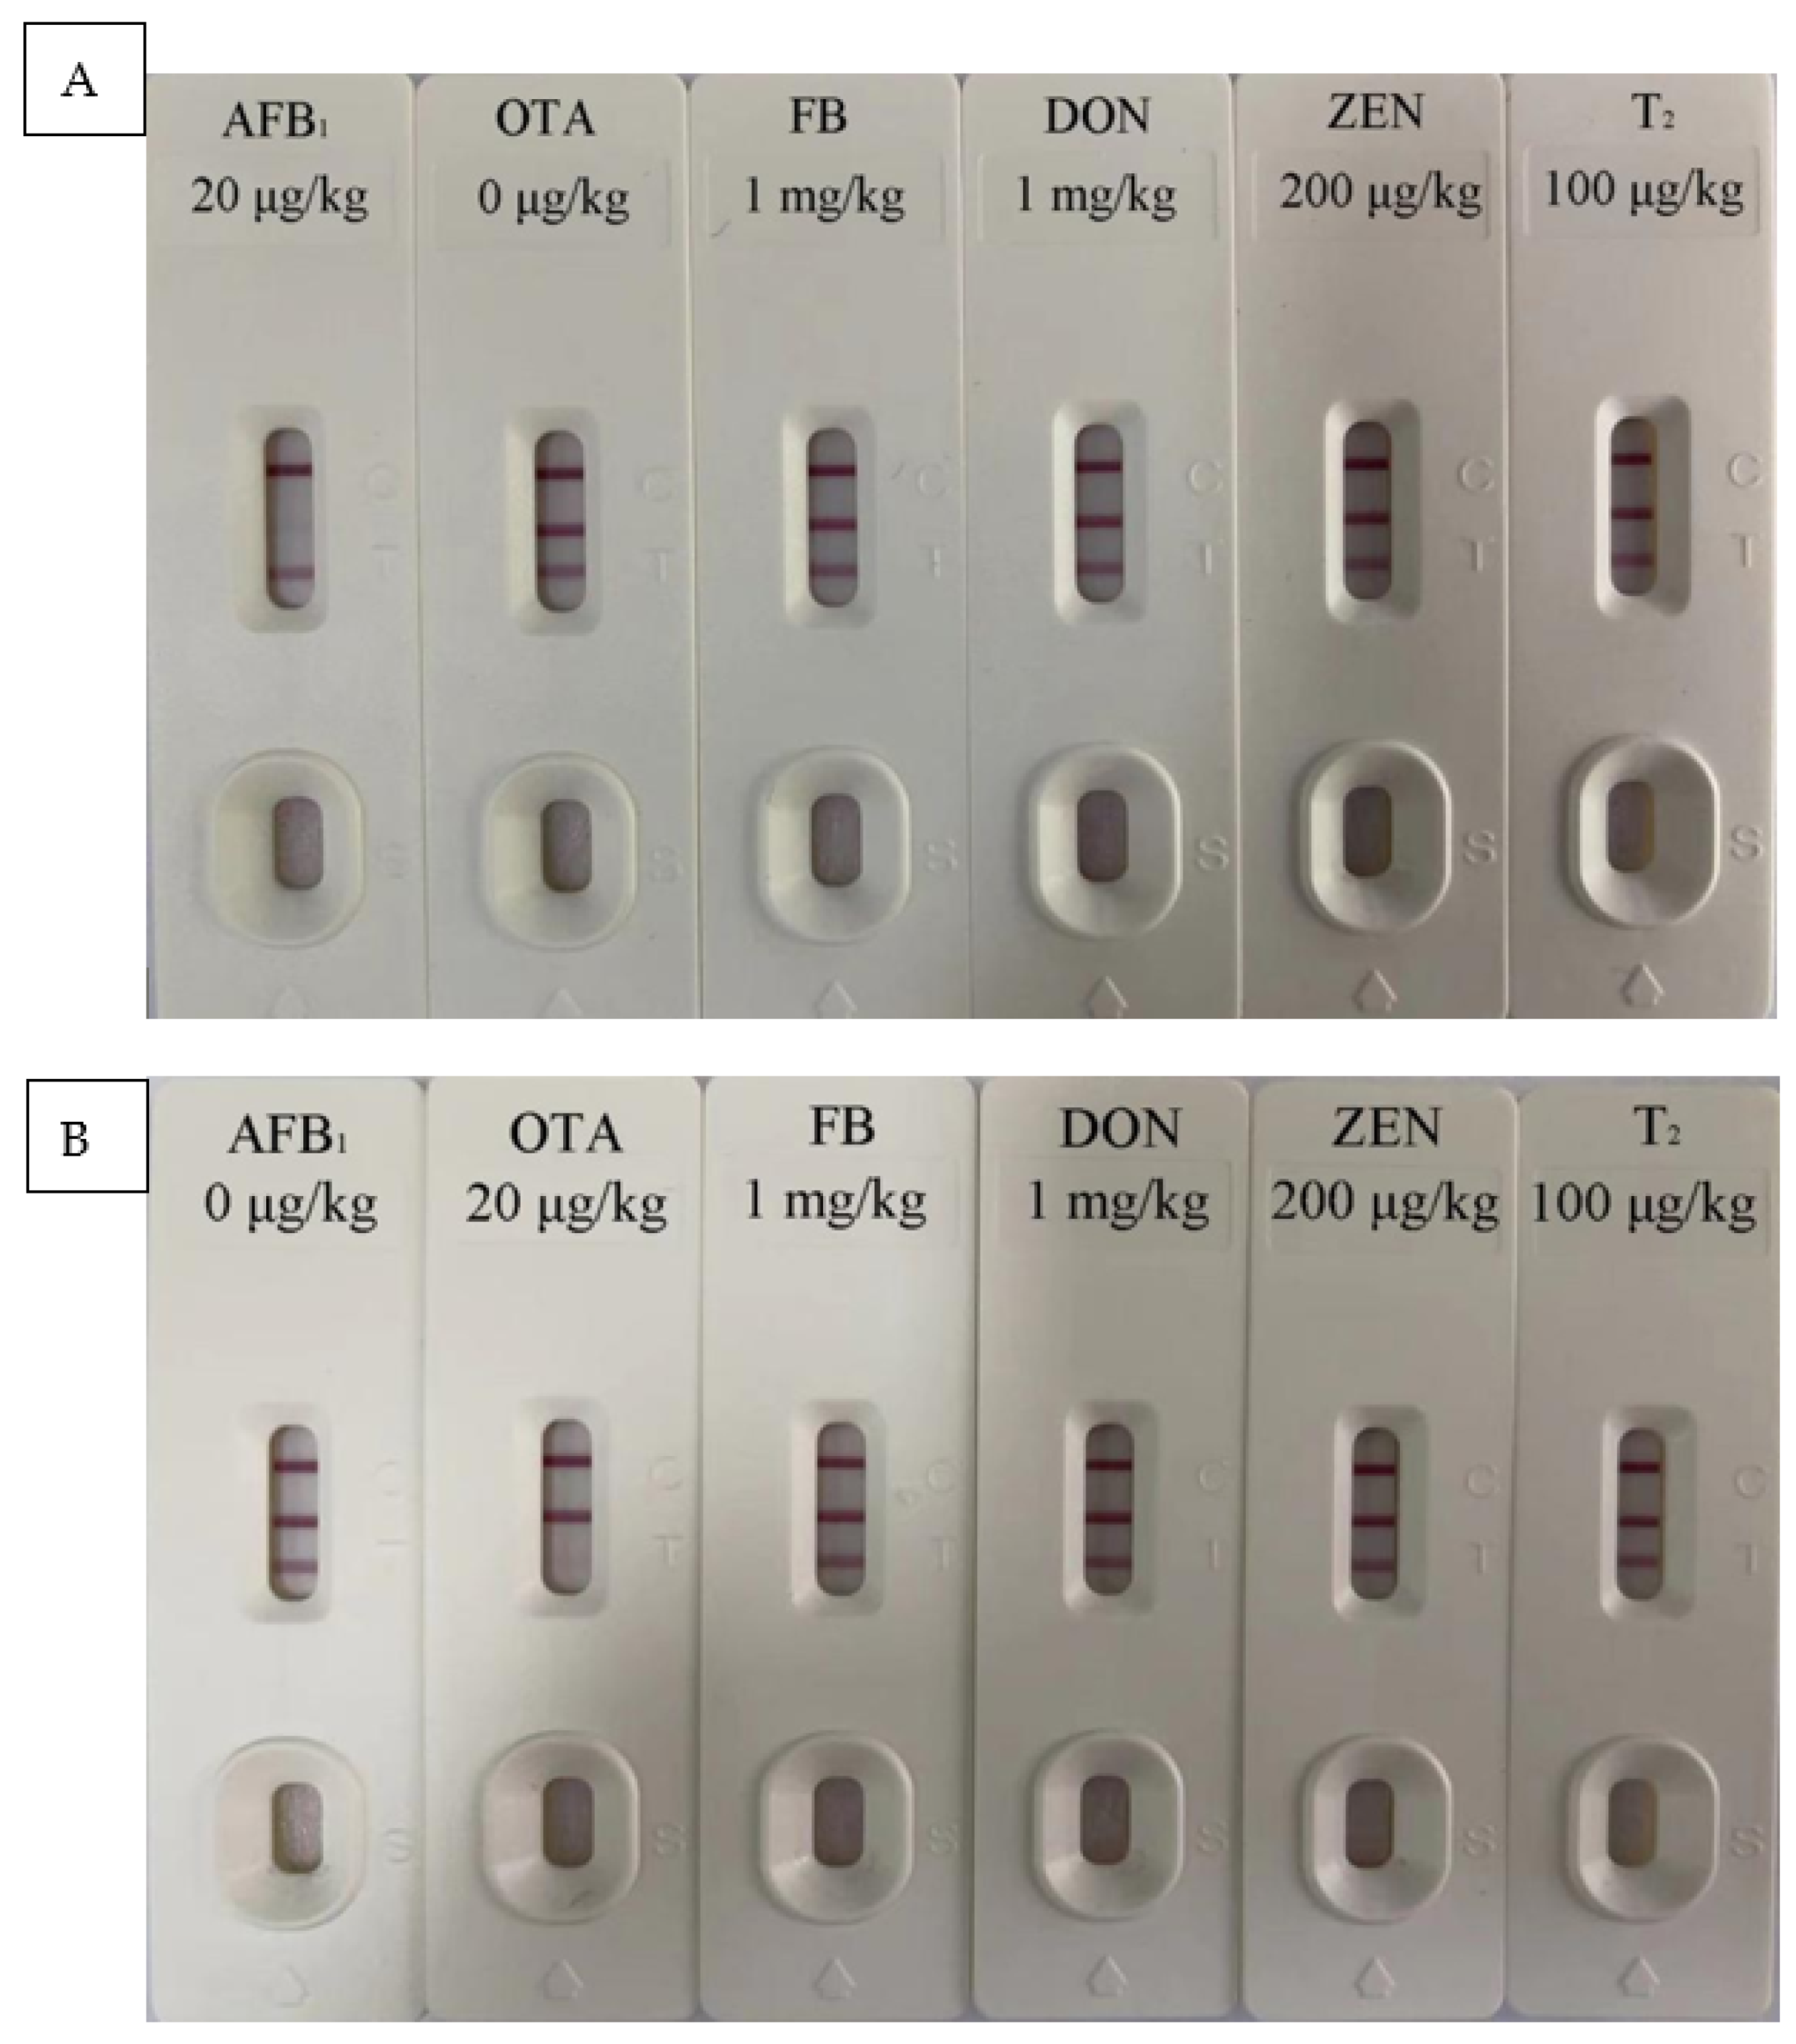
2.6.2. Test Strip Specific Test
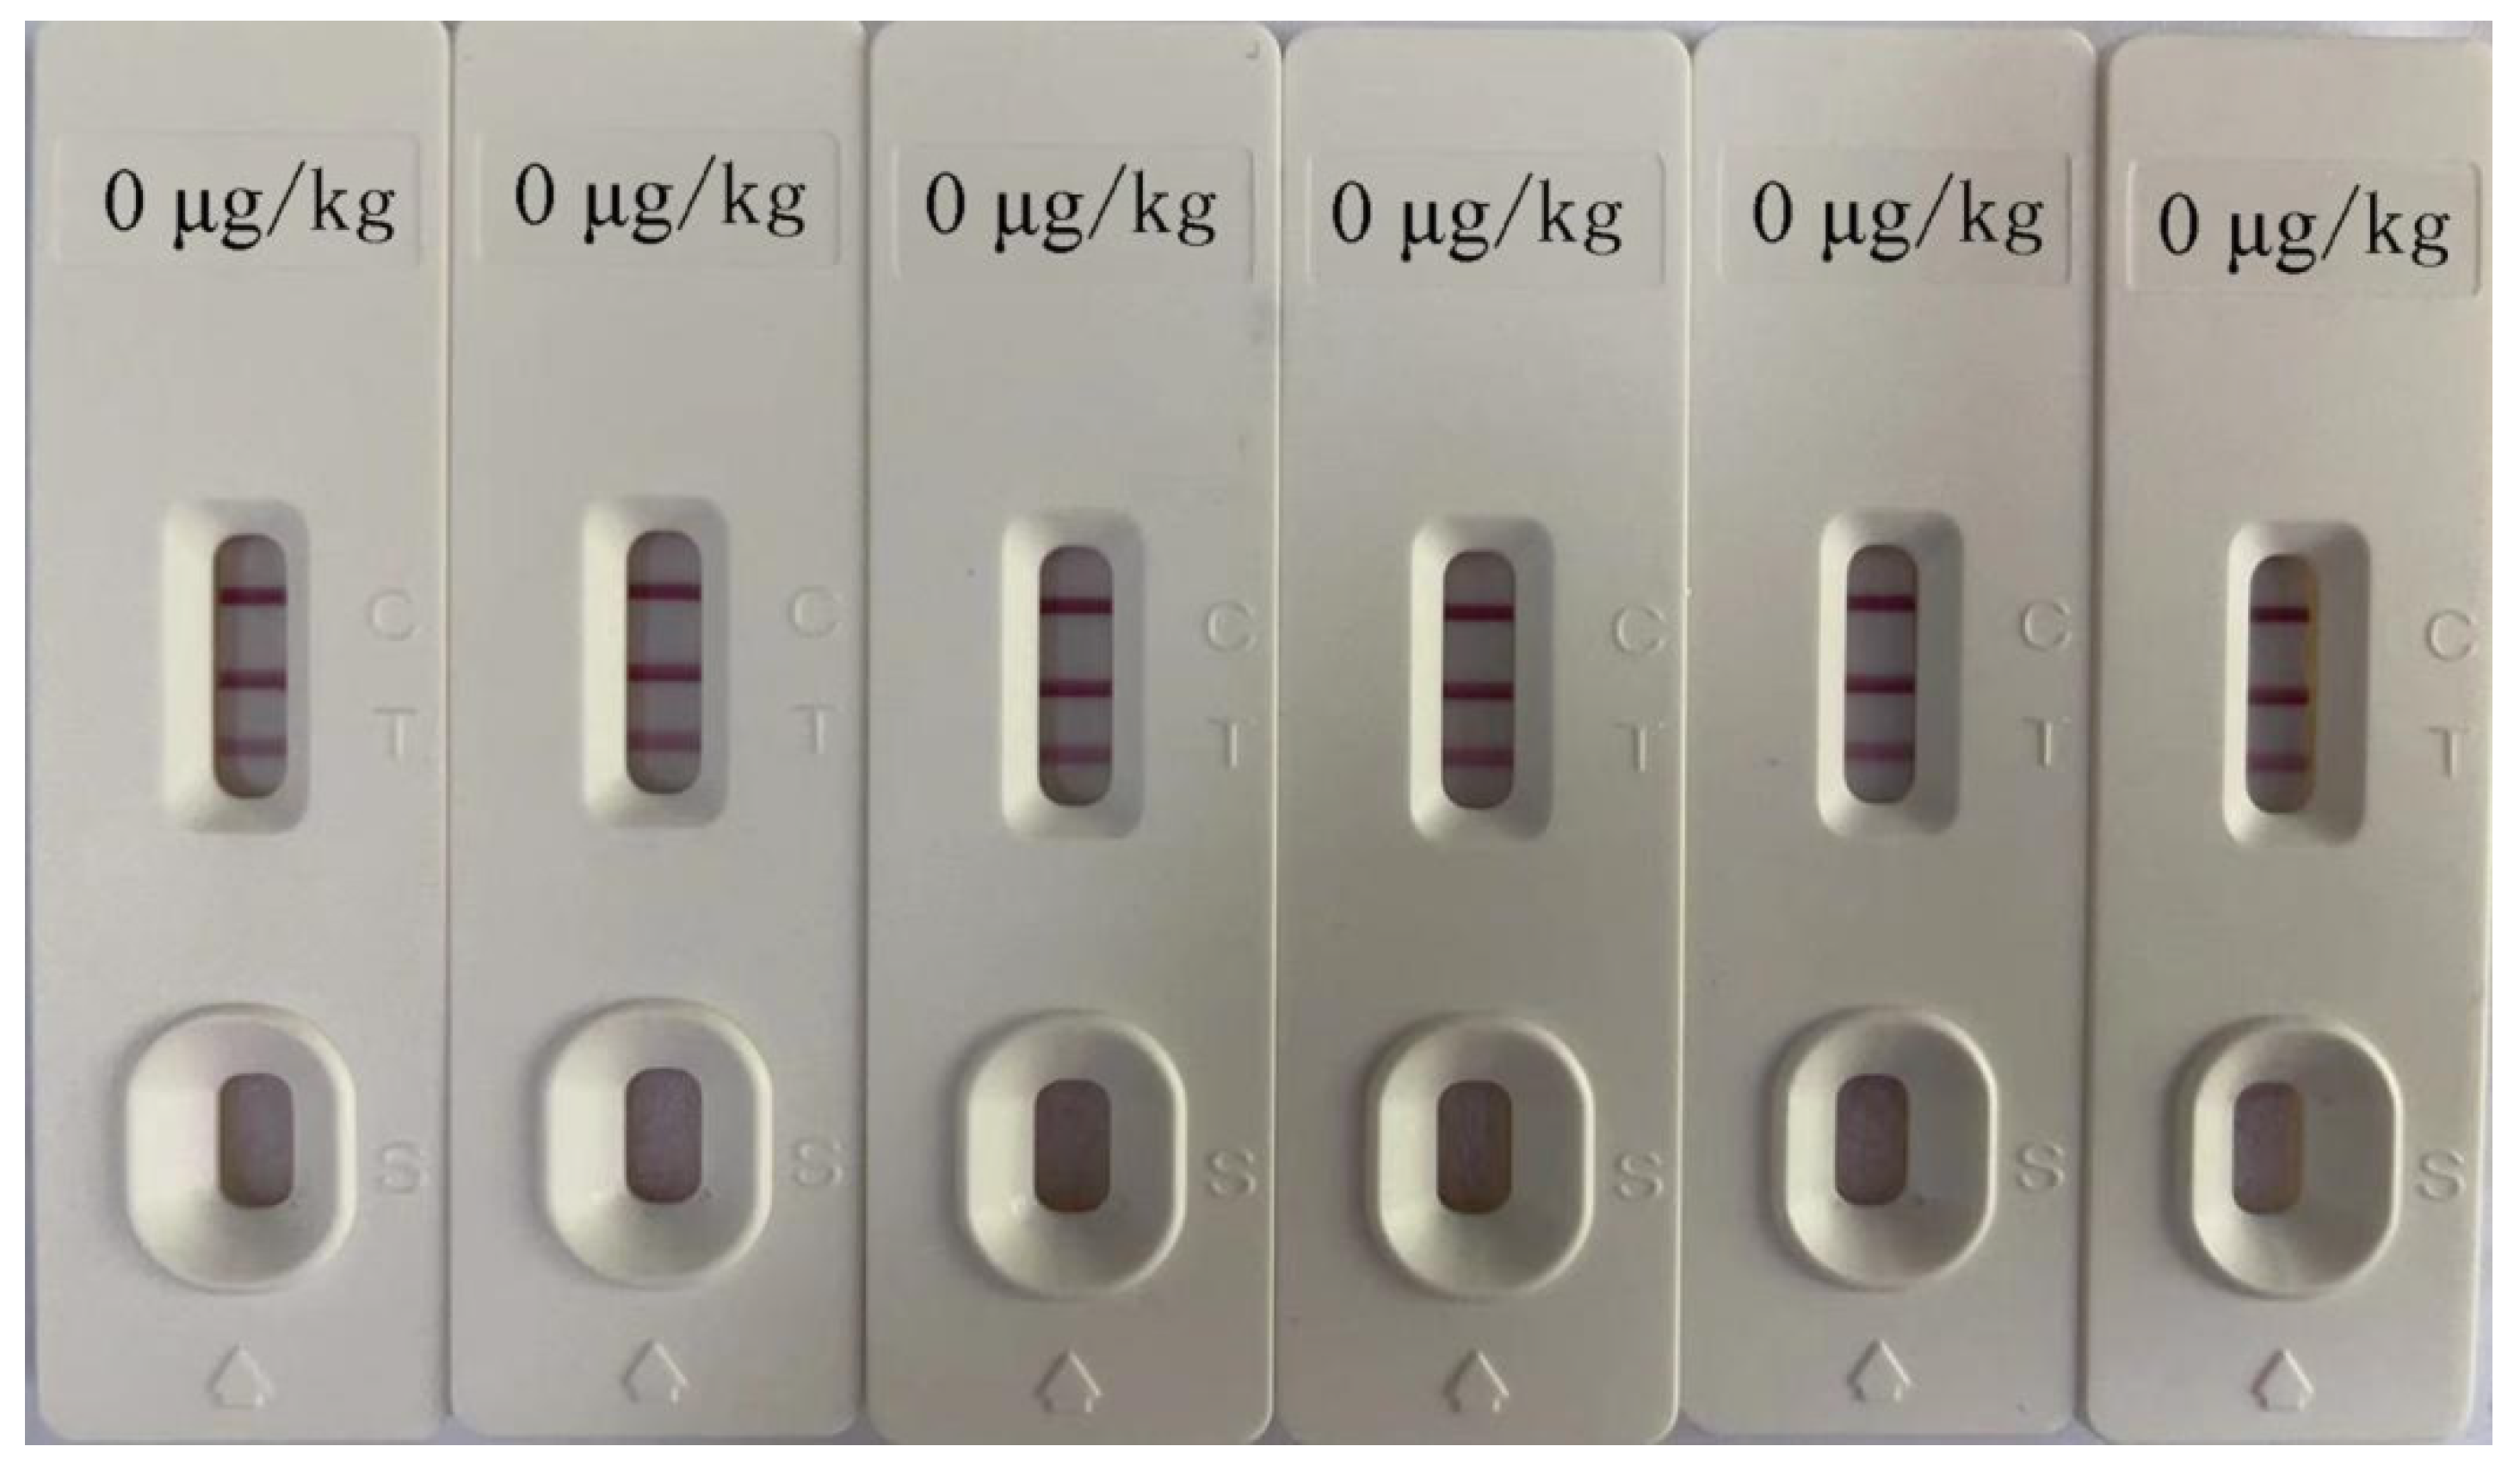
2.6.3. Test Strip Precision Test
2.6.4. Test Strip Repeatability Test
2.6.5. Test Strip Stability Test
2.6.6. Test Strips to Detect Spice Samples
2.7. HPLC Determination
2.7.1. Sample Extraction and Purification
2.7.2. HPLC Conditions
2.7.3. HPLC Linear Range and Detection Limit
2.7.4. HPLC Recovery Test and Precision
3. Results and Discussion
3.1. Test Strip Performance
3.1.1. Detection Limit and Specificity of Test Strips
3.1.2. Precision of Test Strips
3.1.3. Repeatability and Stability of Test Strips
3.2. Immuno-Chromatographic Standard Curve
3.3. HPLC Verification
4. Conclusions
Supplementary Materials
Author Contributions
Funding
Institutional Review Board Statement
Informed Consent Statement
Data Availability Statement
Conflicts of Interest
Abbreviations
| (AFs) | aflatoxins |
| (AFB1) | aflatoxin B1 |
| (OTA) | ochratoxin A |
| (AFB1–OVA) | AFB1–ovalbumin |
| (OTA–OVA) | OTA–ovalbumin |
| (RSD) | relative standard deviation |
| (ELISA) | enzyme-linked immunosorbent assay |
| (HPLC) | high performance liquid chromatography |
| (HPLC–MS) | HPLC–mass spectrometry |
| (GICA) | colloidal gold immuno-chromatography assay |
| (ICA) | immuno-chromatographic analysis |
| (ZEN) | zearalenone |
| (T2) | trichothecenes |
| (DON) | deoxynivalenol |
| (FB) standard solutions | fumonisins |
| IgG | goat anti-mouse |
| BSA | bovine serum albumin |
References
- Martins, M.L.; Martins, H.M.; Bernardo, F. Aflatoxins in spices marketed in Portugal. Food Addit. Contam. 2001, 18, 315–319. [Google Scholar] [CrossRef]
- Kong, W.; Wei, R.; Logrieco, A.F.; Wei, J.; Wen, J.; Xiao, X.; Yang, M. Occurrence of toxigenic fungi and determination of mycotoxins by HPLC-FLD in functional foods and spices in China markets. Food Chem. 2014, 146, 320–326. [Google Scholar] [CrossRef] [PubMed]
- Ismail, A.; Gonçalves, B.L.; de Neeff, D.V.; Ponzilacqua, B.; Coppa, C.C.; Hintzsche, H.; Sajid, M.; da Cruz, A.G.; Corassin, C.H.; Oliveira, C.A. Aflatoxin in foodstuffs: Occurrence and recent advances in decontamination. Food Res. Int. 2018, 113, 74–85. [Google Scholar] [CrossRef]
- Motloung, L.; De Saeger, S.; De Boevre, M.; Detavernier, C.; Audenaert, K.; Adebo, O.; Njobeh, P. Study on mycotoxin contamination in South African food spices. World Mycotoxin J. 2018, 11, 401–409. [Google Scholar] [CrossRef]
- Garcia, M.V.; Mallmann, C.A.; Copetti, M.V. Aflatoxigenic and ochratoxigenic fungi and their mycotoxins in spices marketed in Brazil. Food Res. Int. 2018, 106, 136–140. [Google Scholar] [CrossRef]
- Kabak, B.; Dobson, A.D.W. Mycotoxins in spices and herbs—An update. Crit. Rev. Food Sci. Nutr. 2015, 57, 18–34. [Google Scholar] [CrossRef] [PubMed]
- Reinholds, I.; Pugajeva, I.; Bavrins, K.; Kuckovska, G.; Bartkevics, V. Mycotoxins, pesticides and toxic metals in commercial spices and herbs. Food Addit. Contam. Part B 2017, 10, 5–14. [Google Scholar] [CrossRef]
- IARC. Monographs on the Evaluation of Carcinogenic Risks to Humans in Some Naturally Occurring Substances: Food Items and Constituents, Heterocyclic Aromatic Amines, and Mycotoxins; International Agency for Research on Cancer: Lyon, France, 1993; Volume 56. [Google Scholar]
- Akhtar, S.; Riaz, M.; Naeem, I.; Gong, Y.Y.; Ismail, A.; Hussain, M.; Akram, K. Risk assessment of aflatoxins and selected heavy metals through intake of branded and non-branded spices collected from the markets of Multan city of Pakistan. Food Control 2020, 112, 107132. [Google Scholar] [CrossRef]
- European Commission. Commission Regulation (EC) no 1881/2006 setting maximum levels for certain contaminants in foodstuffs. Off. J. Eur. Union. 2006, L364, 5–24. [Google Scholar]
- European Commission. Commission Regulation (EU). Off. J. Eur. Union 594/2012 amending Regulation (EC) 1881/2006 as regard the maximum levels of the contaminants ochratoxin A, non dioxin-like PCBs and melamine in foodstuffs. Off. J. Eur. Union 2012, L176, 43–45. [Google Scholar]
- FAO. Discussion Paper on the Establishment Maximum Levels for Mycotoxins in Spices. 2017. Available online: http://www.fao.org/fao-who-codexalimentarius/sh-proxy/es/?lnk=1&url=https%253A%252F%252Fworkspace.fao.org%252Fsites%252Fcodex%252FMeetings%252FCX-735-11%252FWD%252Fcf11_11e.pdf (accessed on 12 July 2017).
- Alsharif, A.M.A.; Choo, Y.-M.; Tan, G.-H. Detection of Five Mycotoxins in Different Food Matrices in the Malaysian Market by Using Validated Liquid Chromatography Electrospray Ionization Triple Quadrupole Mass Spectrometry. Toxins 2019, 11, 196. [Google Scholar] [CrossRef] [PubMed] [Green Version]
- Kim, S.; Lee, S.; Nam, T.G.; Seo, D.; Yoo, M. Comparison of a Newly Developed Liquid Chromatography with Tandem Mass Spectrometry Method and Enzyme-Linked Immunosorbent Assay for Detection of Multiple Mycotoxins in Red Pepper Powder. J. Food Prot. 2017, 80, 1347–1354. [Google Scholar] [CrossRef] [PubMed]
- Manda, P.; Adanou, K.M.; Ardjouma, D.; Adepo, A.J.B.; Dano, D.S. Occurrence of ochratoxin A in spices commercialized in Abidjan (Côte d’Ivoire). Mycotoxin Res. 2016, 32, 137–143. [Google Scholar] [CrossRef] [PubMed]
- Ling, S.; Chen, Q.-A.; Zhang, Y.; Wang, R.; Jin, N.; Pang, J.; Wang, S. Development of ELISA and colloidal gold immunoassay for tetrodotoxin detetcion based on monoclonal antibody. Biosens. Bioelectron. 2015, 71, 256–260. [Google Scholar] [CrossRef]
- Chen, F.; Luan, C.; Wang, L.; Wang, S.; Shao, L. Simultaneous determination of six mycotoxins in peanut by high-performance liquid chromatography with a fluorescence detector. J. Sci. Food Agric. 2017, 97, 1805–1810. [Google Scholar] [CrossRef]
- Ling, S.; Li, X.; Zhang, D.; Wang, K.; Zhao, W.; Zhao, Q.; Wang, R.; Yuan, J.; Xin, S.; Wang, S. Detection of okadaic acid (OA) and tetrodotoxin (TTX) simultaneously in seafood samples using colloidal gold immunoassay. Toxicon 2019, 165, 103–109. [Google Scholar] [CrossRef] [PubMed]
- Li, X.; Li, P.; Zhang, Q.; Li, R.; Zhang, W.; Zhang, Z.; Ding, X.; Tang, X. Multi-component immunochromatographic assay for simultaneous detection of aflatoxin B1, ochratoxin A and zearalenone in agro-food. Biosens. Bioelectron. 2013, 49, 426–432. [Google Scholar] [CrossRef]
- Duan, H.; Li, Y.; Shao, Y.; Huang, X.; Xiong, Y. Multicolor quantum dot nanobeads for simultaneous multiplex immunochromatographic detection of mycotoxins in maize. Sens. Actuators B Chem. 2019, 291, 411–417. [Google Scholar] [CrossRef]
- Sun, Y.; Xing, G.; Yang, J.; Wang, F.; Deng, R.; Zhang, G.; Hu, X.; Zhang, Y. Development of an immunochromatographic test strip for simultaneous qualitative and quantitative detection of ochratoxin A and zearalenone in cereal. J. Sci. Food Agric. 2015, 96, 3673–3678. [Google Scholar] [CrossRef]
- Yao, J.; Sun, Y.; Li, Q.; Wang, F.; Teng, M.; Yang, Y.; Deng, R.; Hu, X. Colloidal gold-McAb probe-based rapid immunoassay strip for simultaneous detection of fumonisins in maize. J. Sci. Food Agric. 2016, 97, 2223–2229. [Google Scholar] [CrossRef]
- Man, Y.; Liang, G.; Jia, F.; Li, A.; Fu, H.; Wang, M.; Pan, L. Development of an Immunochromatographic Strip Test for the Rapid Detection of Alternariol Monomethyl Ether in Fruit. Toxins 2017, 9, 152. [Google Scholar] [CrossRef] [PubMed]
- Zhao, X.; Schaffner, D.W.; Yue, T. Quantification of aflatoxin risk associated with Chinese spices: Point and probability risk assessments for aflatoxin B1. Food Control 2013, 33, 366–377. [Google Scholar] [CrossRef]
- Zhao, X.; Yuan, Y.; Zhang, X.; Yue, T. Identification of ochratoxin A in Chinese spices using HPLC fluorescent detectors with immunoaffinity column cleanup. Food Control 2014, 46, 332–337. [Google Scholar] [CrossRef]
- Liang, G.; Zhai, H.; Huang, L.; Tan, X.; Zhou, Q.; Yu, X.; Lin, H. Synthesis of carbon quantum dots-doped dummy molecularly imprinted polymer monolithic column for selective enrichment and analysis of aflatoxin B1 in peanut. J. Pharm. Biomed. Anal. 2018, 149, 258–264. [Google Scholar] [CrossRef] [PubMed]
- Zhang, G. Immunochromatographic Test Paper Rapid Detection Technology, 1st ed.; Henan Science and Technology Press: Zhengzhou, China, 2015. [Google Scholar]
- Bircan, C. The determination of aflatoxins in spices by immunoaffinity column extraction using HPLC. Int. J. Food Sci. Technol. 2005, 40, 929–934. [Google Scholar] [CrossRef]
- Fazekas, B.; Tar, A.; Kovács, M. Aflatoxin and ochratoxin A content of spices in Hungary. Food Addit. Contam. 2005, 22, 856–863. [Google Scholar] [CrossRef]
- Riordan, M.J.O.; Wilkinson, M.G. A survey of the incidence and level of aflatoxin contamination in a range of imported spice preparations on the Irish retail market. Food Chem. 2008, 107, 1429–1435. [Google Scholar] [CrossRef]


| Spices | AFB1 Pretreatment | OTA Pretreatment | ||
|---|---|---|---|---|
| Chinese Prickly Ash, Pepper, Chili, Cinnamon, Aniseed | Chinese Prickly Ash, Pepper, Chili | Cinnamon | Aniseed | |
| Extraction solution | Acetonitrile–water (80:20, v/v) | Methanol–1% NaHCO3 (70:30, v/v) | Methanol | Methanol–1% NaHCO3 (70:30, v/v) |
| Dilute solution | Tween–PBS (5:95, v/v) | Tween–PBS (1:99, v/v) | ||
| Rinse solution | Water | PBS | ||
| Spices | Mass Concentration of AFB1 Standard Solution (μg/kg) | Mass Concentration of OTA Standard Solution (μg/kg) | ||||||||||
|---|---|---|---|---|---|---|---|---|---|---|---|---|
| 0 | 3 | 6 | 12 | 25 | 50 | 0 | 5 | 10 | 15 | 25 | 25 | |
| Chinese prickly ash | − | + | + | + | + | + | − | + | + | + | + | + |
| Pepper | − | + | + | + | + | + | − | + | + | + | + | + |
| Chili | − | + | + | + | + | + | − | + | + | + | + | + |
| Cinnamon | − | + | + | + | + | + | − | + | + | + | + | + |
| Aniseed | − | + | + | + | + | + | − | + | + | + | + | + |
| Mycotoxins | Add Level (µg/kg) | Chinese Prickly Ash | Pepper | Chili | Cinnamon | Aniseed | |||||
|---|---|---|---|---|---|---|---|---|---|---|---|
| Recovery Rate (%) | RSD (%) | Recovery Rate (%) | RSD (%) | Recovery Rate (%) | RSD (%) | Recovery Rate (%) | RSD (%) | Recovery Rate (%) | RSD (%) | ||
| AFB1 | 5.0 | 83.2 ± 2.8 | 2.6 | 81.2 ± 6.6 | 6.1 | 105.3 ± 2.9 | 3.6 | 100.4 ± 2.8 | 3.3 | 111.0 ± 5.6 | 5.9 |
| 20.0 | 102.8 ± 3.9 | 4.3 | 110.0 ± 2.7 | 3.5 | 110.2 ± 9.3 | 9.2 | 103.4 ± 5.2 | 5.9 | 83.6 ± 6.8 | 6.2 | |
| 50.0 | 93.2 ± 6.3 | 7.5 | 99.1 ± 2.0 | 2.8 | 113.7 ± 3.7 | 4.1 | 92.9 ± 6.9 | 6.3 | 110.4 ± 2.4 | 2.6 | |
| OTA | 5.0 | 101.2 ± 4.6 | 3.8 | 95.8 ± 4.8 | 4.2 | 109.4 ± 5.8 | 6.5 | 82.2 ± 7.4 | 8.7 | 118.6 ± 2.7 | 3.5 |
| 20.0 | 113.0 ± 5.1 | 5.3 | 109.3 ± 2.6 | 1.1 | 100.7 ± 2.9 | 3.0 | 103.0 ± 2.1 | 3.1 | 86.8 ± 4.6 | 5.1 | |
| 50.0 | 107.6 ± 2.9 | 4.6 | 92.1 ± 4.5 | 4.8 | 99.3 ± 6.4 | 7.5 | 91.7 ± 3.2 | 4.8 | 91.4 ± 3.4 | 4.9 | |
| Spices | AFB1 | OTA | ||
|---|---|---|---|---|
| Regression Equation | R2 | Regression Equation | R2 | |
| Chinese prickly ash | y = 0.5635x − 0.3801 | 0.9982 | y = 0.6090x − 0.3714 | 0.9912 |
| Pepper | y = 0.5569x − 0.3638 | 0.9627 | y = 0.5797x − 0.4222 | 0.9621 |
| Chili | y = 0.6120x − 0.3332 | 0.9695 | y = 0.6574x − 0.4537 | 0.9887 |
| Cinnamon | y = 0.4551x − 0.3148 | 0.9729 | y = 0.6127x − 0.4276 | 0.9638 |
| Aniseed | y = 0.6169x − 0.4767 | 0.9657 | y = 0.6445x − 0.4689 | 0.9763 |
| Mycotoxins | Regression Equation | R2 | Linearity Range (µg/kg) |
|---|---|---|---|
| AFB1 | y = 75,941x + 40,497 | 0.9998 | 1.0–200.0 |
| OTA | y = 20,810x − 2861.3 | 0.9998 | 1.0–200.0 |
| Mycotoxins | Intraday Precision | Daytime Precision | ||
|---|---|---|---|---|
| Recovery Rate (%) | RSD (%) | Recovery Rate (%) | RSD (%) | |
| AFB1 | 105.7 ± 1.7 | 1.6 | 98.2 ± 1.4 | 1.4 |
| OTA | 100.5 ± 1.5 | 1.5 | 108.1 ± 1.9 | 1.8 |
| Mycotoxins | Add Level (µg/kg) | Chinese Prickly Ash | Pepper | Chili | Cinnamon | Aniseed | |||||
|---|---|---|---|---|---|---|---|---|---|---|---|
| Recovery Rate (%) | RSD (%) | Recovery Rate (%) | RSD (%) | Recovery Rate (%) | RSD (%) | Recovery Rate (%) | RSD (%) | Recovery Rate (%) | RSD (%) | ||
| AFB1 | 2.0 | 117.0 ± 6.8 | 5.8 | 111.4 ± 9.3 | 8.3 | 96.7 ± 8.4 | 8.7 | 116.3 ± 9.2 | 7.9 | 102.4 ± 4.8 | 4.7 |
| 4.0 | 112.8 ± 5.1 | 4.5 | 85.7 ± 4.0 | 4.9 | 84.2 ± 5.7 | 6.8 | 105.3 ± 6.7 | 6.4 | 107.6 ± 5.3 | 4.9 | |
| 20.0 | 108.2 ± 3.2 | 3.0 | 82.6 ± 3.1 | 3.7 | 113.9 ± 3.2 | 2.8 | 84.5 ± 3.7 | 4.4 | 98.4 ± 7.2 | 7.3 | |
| OTA | 2.0 | 102.1 ± 5.3 | 5.2 | 93.5 ± 4.7 | 5.0 | 94.8 ± 3.6 | 3.8 | 102.6 ± 4.2 | 4.1 | 96.3 ± 5.8 | 6.0 |
| 4.0 | 97.7 ± 2.4 | 2.5 | 104.3 ± 2.9 | 2.8 | 99.1 ± 5.7 | 5.8 | 92.7 ± 6.3 | 6.8 | 104.4 ± 6.1 | 5.8 | |
| 20.0 | 105.8 ± 4.9 | 4.6 | 109.2 ± 6.1 | 5.6 | 112.7 ± 4.3 | 3.8 | 102.3 ± 5.8 | 5.7 | 93.7 ± 3.7 | 3.9 | |
| Mycotoxins | Serial Number | GICA (μg/kg) | HPLC (μg/kg) | Mycotoxins | Serial Number | GICA (μg/kg) | HPLC (μg/kg) |
|---|---|---|---|---|---|---|---|
| AFB1 | 19-1 | 3.2 ± 0.2 | 3.1 ± 0.3 | OTA | 19-3 | 3.8 ± 0.6 | 3.9 ± 0.4 |
| 22-1 | 2.9 ± 0.5 | 2.8 ± 0.2 | 20-3 | 5.7 ± 0.3 | 5.4 ± 0.7 | ||
| 25-2 | 14.4 ± 0.4 | 14.1 ± 0.5 | 22-3 | 3.1 ± 0.5 | 3.5 ± 0.2 | ||
| 2-3 | 5.0 ± 0.3 | 4.8 ± 0.7 | 26-3 | 28.6 ± 2.7 | 26.1 ± 1.3 | ||
| 28-3 | 4.1 ± 0.2 | 4.3 ± 0.4 | 28-3 | 3.8 ± 0.4 | 4.2 ± 0.7 | ||
| OTA | 23-1 | 3.6 ± 0.5 | 3.2 ± 0.6 | 30-3 | 6.5 ± 0.2 | 6.6 ± 0.6 | |
| 8-2 | 4.4 ± 0.3 | 4.7 ± 0.8 | 2-5 | 7.4 ± 1.0 | 7.2 ± 0.9 | ||
| 4-3 | 81.9 ± 3.6 | 84.3 ± 1.5 | 4-5 | 5.7 ± 0.3 | 6.1 ± 0.1 | ||
| 12-3 | 3.5 ± 0.4 | 3.4 ± 0.2 | 16-5 | 12.9 ± 0.8 | 13.5 ± 0.8 |
Publisher’s Note: MDPI stays neutral with regard to jurisdictional claims in published maps and institutional affiliations. |
© 2021 by the authors. Licensee MDPI, Basel, Switzerland. This article is an open access article distributed under the terms and conditions of the Creative Commons Attribution (CC BY) license (https://creativecommons.org/licenses/by/4.0/).
Share and Cite
Zhao, X.; Jin, X.; Lin, Z.; Guo, Q.; Liu, B.; Yuan, Y.; Yue, T.; Zhao, X. Simultaneous Rapid Detection of Aflatoxin B1 and Ochratoxin A in Spices Using Lateral Flow Immuno-Chromatographic Assay. Foods 2021, 10, 2738. https://doi.org/10.3390/foods10112738
Zhao X, Jin X, Lin Z, Guo Q, Liu B, Yuan Y, Yue T, Zhao X. Simultaneous Rapid Detection of Aflatoxin B1 and Ochratoxin A in Spices Using Lateral Flow Immuno-Chromatographic Assay. Foods. 2021; 10(11):2738. https://doi.org/10.3390/foods10112738
Chicago/Turabian StyleZhao, Xue, Xindi Jin, Zhang Lin, Qi Guo, Bin Liu, Yahong Yuan, Tianli Yue, and Xubo Zhao. 2021. "Simultaneous Rapid Detection of Aflatoxin B1 and Ochratoxin A in Spices Using Lateral Flow Immuno-Chromatographic Assay" Foods 10, no. 11: 2738. https://doi.org/10.3390/foods10112738
APA StyleZhao, X., Jin, X., Lin, Z., Guo, Q., Liu, B., Yuan, Y., Yue, T., & Zhao, X. (2021). Simultaneous Rapid Detection of Aflatoxin B1 and Ochratoxin A in Spices Using Lateral Flow Immuno-Chromatographic Assay. Foods, 10(11), 2738. https://doi.org/10.3390/foods10112738