
High-Protein Bar as a Meal Replacement in Elite Sports Nutrition: A Pilot Study


 , , and
Abstract
:1. Introduction
2. Materials and Methods
2.1. Materials
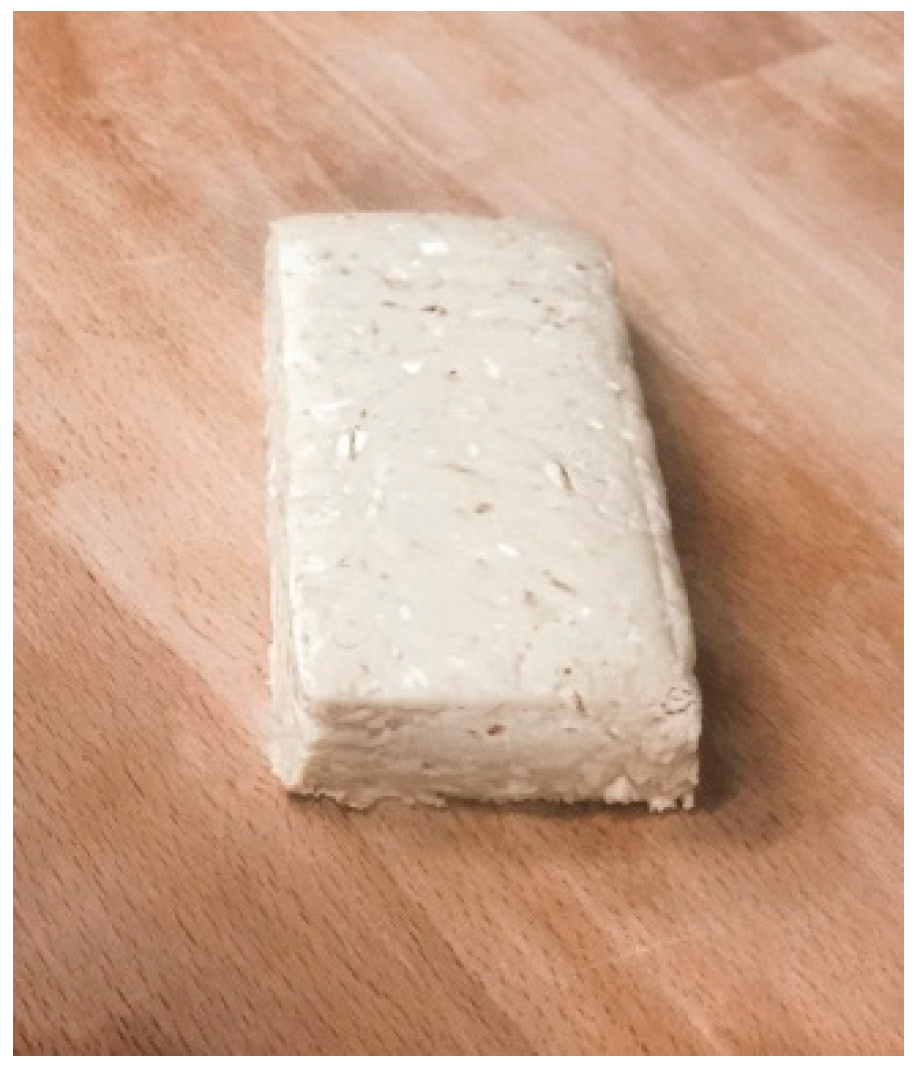
2.2. Preparation of High-Protein Bar
2.3. Proximate Composition and Mineral Content
2.4. Textural Analysis
2.5. Colour Measurements
2.6. Sensory Evaluation
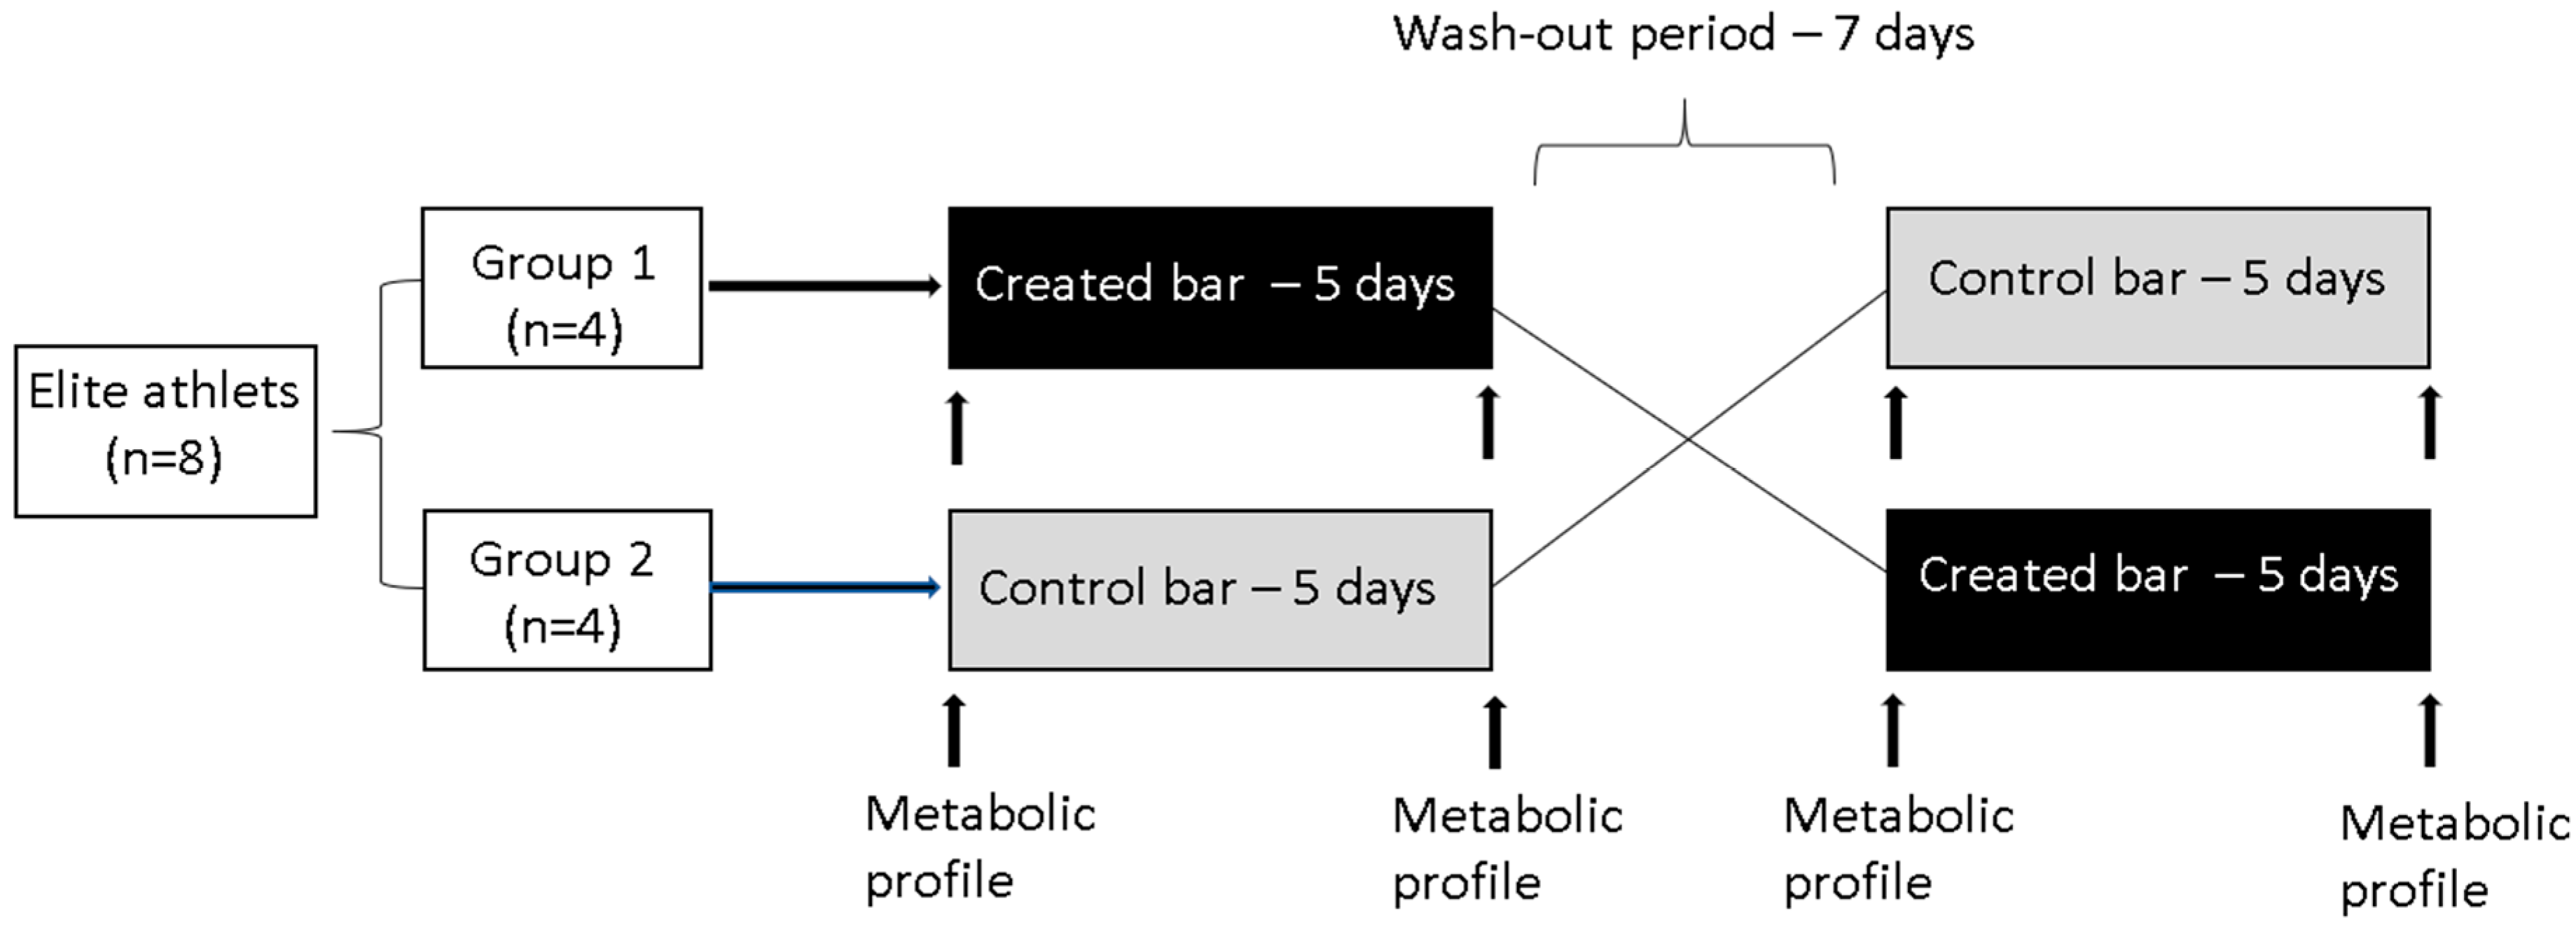
2.7. Study Participants
2.8. Dietary Intervention (Pilot) Study
2.9. Metabolic Assessment
2.10. Statistical Analysis
3. Results and Discussion
3.1. Bar Characterisation
- -
- Meal replacement (if the bar package of 100 g is consumed);
- -
- Low energy diet (reduced fat content), especially suitable for people on a weight loss diet/people interested in body weight control;
- -
- Meal with no added sugar;
- -
- Source of dietary fibre;
- -
- Provide a daily need for creatine; and
- -
- Provide the necessary amounts of various vitamins and minerals that should meet the necessary daily intake per meal.
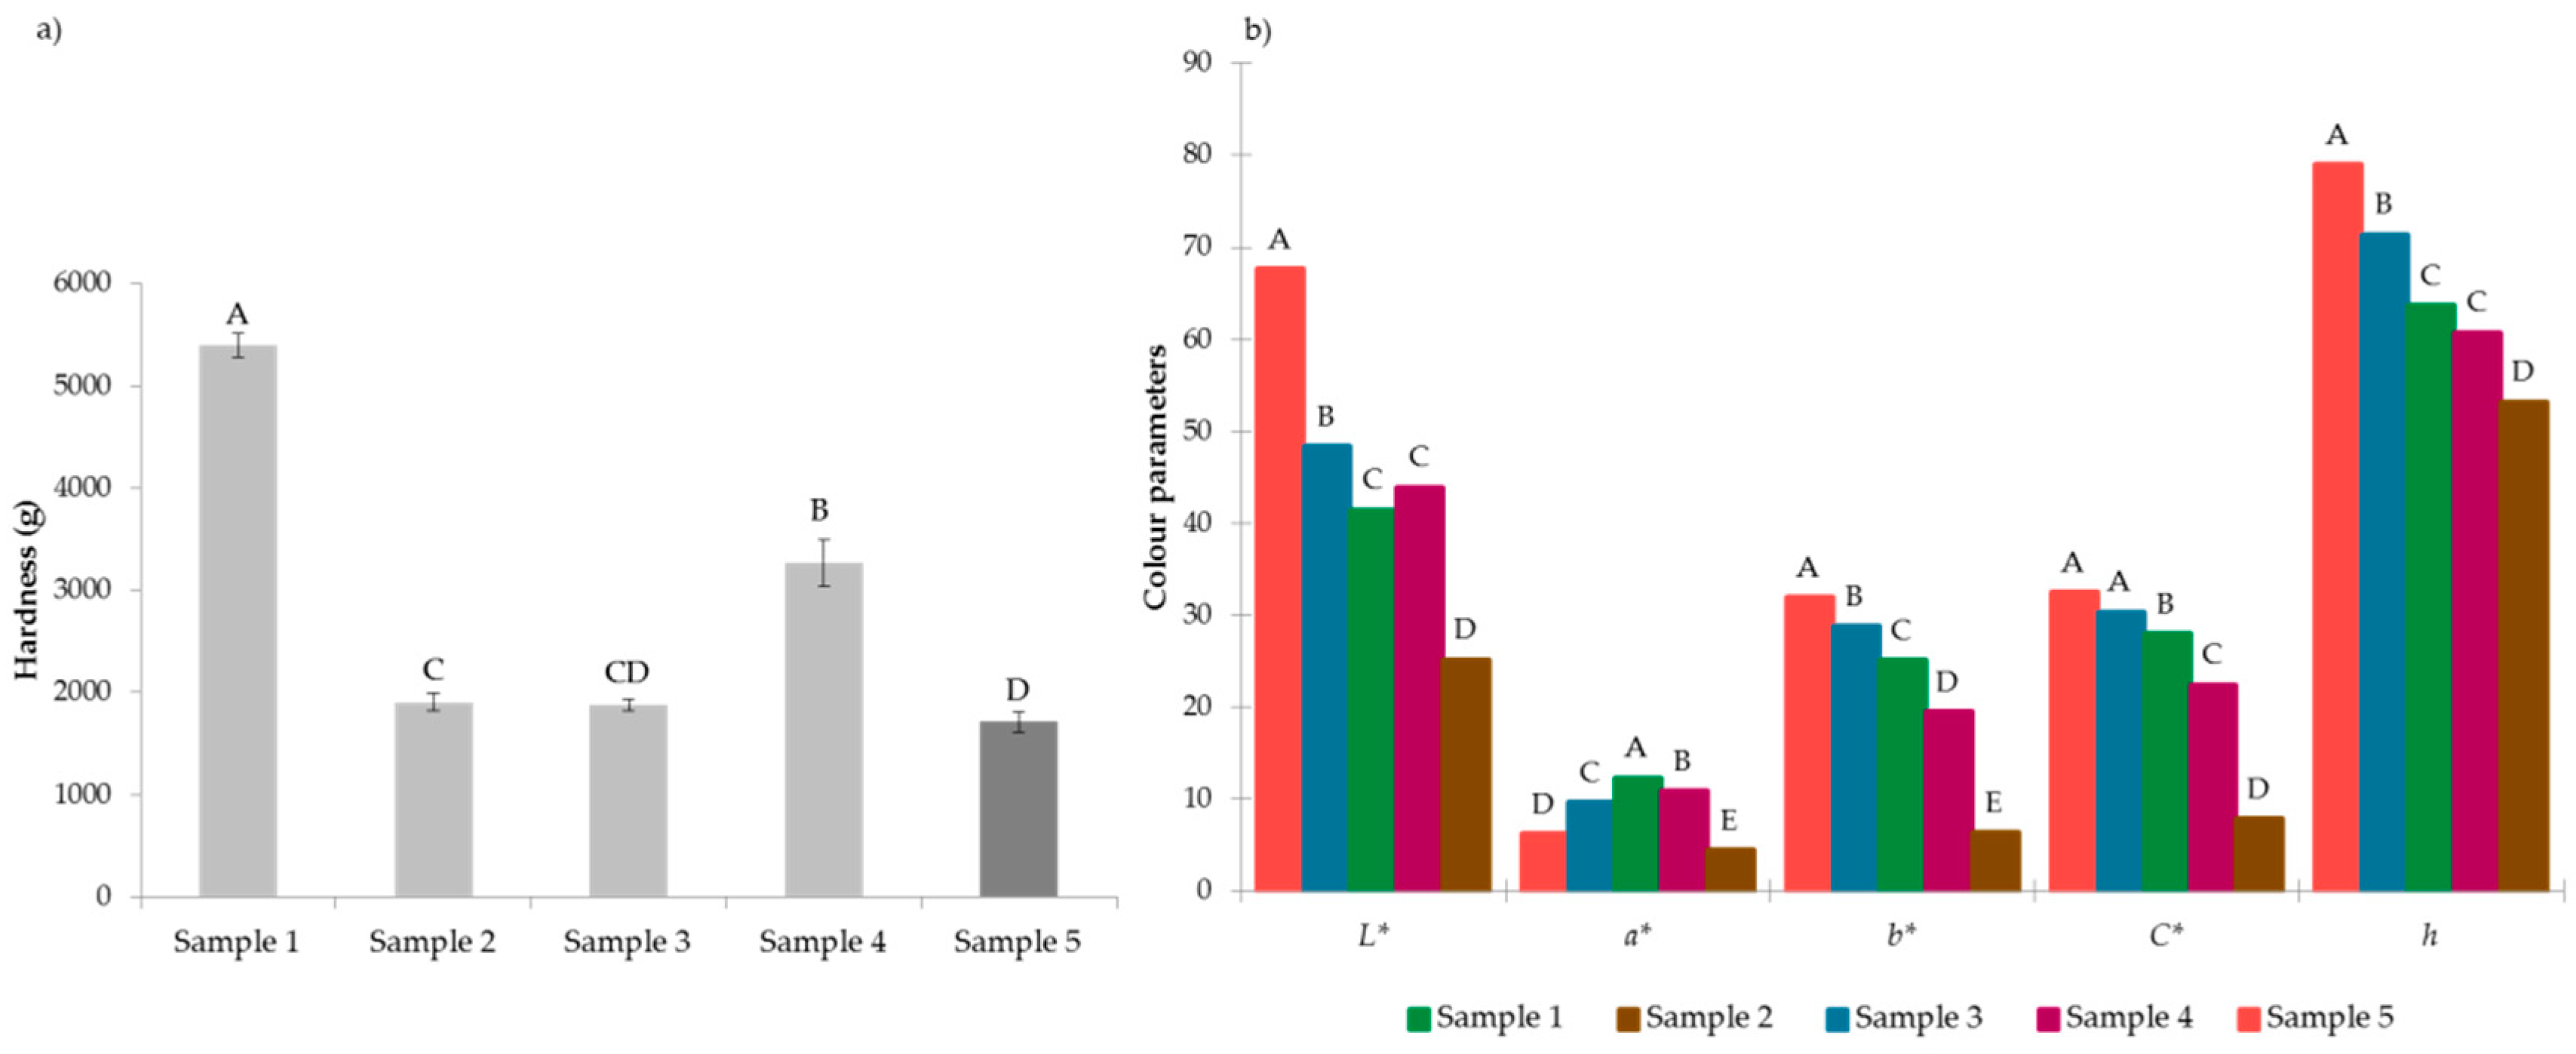
3.2. Textural Analysis
3.3. Colour Measurements
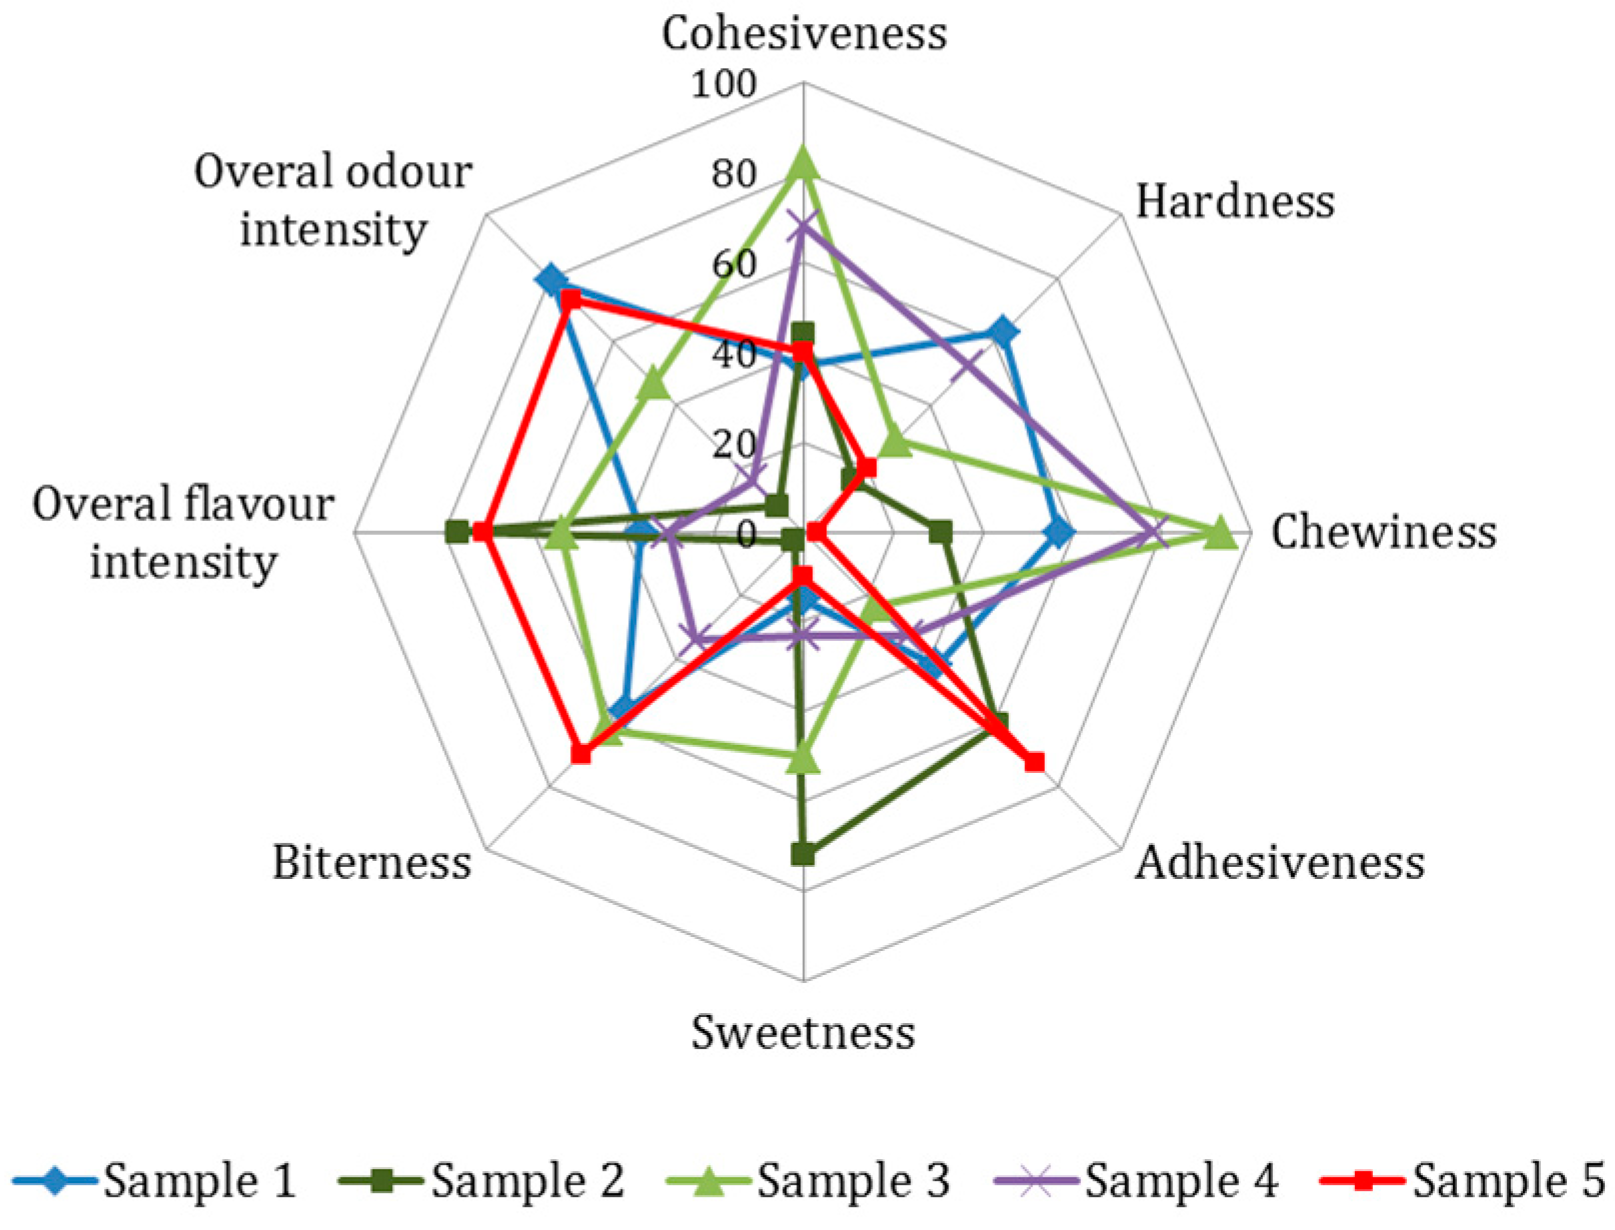
3.4. Sensory Analysis
3.5. Study Population
3.6. Effects of Experimental and Control Bar Consumption on Metabolic Profile
4. Conclusions
Author Contributions
Funding
Institutional Review Board Statement
Informed Consent Statement
Conflicts of Interest
References
- Mestdag, I. Disappearance of the traditional meal: Temporal, social and spatial destructuration. Appetite 2005, 45, 62–74. [Google Scholar] [CrossRef] [PubMed]
- Dantas de Lucas, R.; Caputo, F.; Mendes de Souza, K.; Sigwalt, A.R.; Ghisoni, K.; Lock Silveira, P.C.; Remor, A.P.; da Luz Scheffer, D.; Antonacci Guglielmo, L.G.; Latini, A. Increased platelet oxidative metabolism, blood oxidative stress and neopterin levels after ultra-endurance exercise. J. Sports Sci. 2014, 32, 22–30. [Google Scholar] [CrossRef]
- Galhardi, F.; Mesquita, K.; Monserrat, J.M.; Barros, D.M. Effect of silymarin on biochemical parameters of oxidative stress in aged and young rat brain. Food Chem. Toxicol. 2009, 47, 2655–2660. [Google Scholar] [CrossRef]
- Sloan, A.E. Top 10 functional food trends. Food Technol. 2012, 4, 24–41. [Google Scholar]
- Kerasioti, E.; Kiskini, A.; Veskoukis, A.; Jamurtas, A.; Tsitsimpikou, C.; Tsatsakis, A.M.; Koutedakis, Y.; Stagos, D.; Kouretas, D.; Karathanos, V. Effect of a special carbohydrate-protein cake on oxidative stress markers after exhaustive cycling in humans. Food Chem. Toxicol. 2012, 50, 2805–2810. [Google Scholar] [CrossRef]
- Imtiaz, S.R.; Kuhn-Sherlock, B.; Campbell, M. Effect of dairy protein blends on texture of high protein bars. J. Texture Stud. 2012, 43, 275–286. [Google Scholar] [CrossRef]
- Loveday, S.M.; Hindmarsh, J.P.; Creamer, L.K.; Singh, H. Physicochemical changes in a model protein bar during storage. Food Res. Int. 2009, 42, 798–806. [Google Scholar] [CrossRef]
- Loveday, S.M.; Hindmarsh, J.P.; Creamer, L.K.; Singh, H. Physicochemical changes in intermediate-moisture protein bars made with whey protein or calcium caseinate. Food Res. Int. 2010, 43, 1321–1328. [Google Scholar] [CrossRef]
- Abd El-Salam, M.H.; El-Shibiny, S. Hardness of high protein nutrition bars on milk protein concentrates: A review. Biointerface Res. Appl. Chem. 2020, 10, 4914–4921. [Google Scholar] [CrossRef]
- Zhou, P.; Liu, X.; Labuza, T.P. Effects of moisture-induced whey protein aggregation on protein conformation, the state of water molecules, and the microstructure and texture of high-protein-containing matrix. J. Agric. Food Chem. 2008, 56, 4534–4540. [Google Scholar] [CrossRef]
- Gray, J.; Armstrong, G.; Farley, H. Opportunities and constraints in the functional food market. Nutr. Food Sci. 2003, 33, 213–218. [Google Scholar] [CrossRef]
- Corrochano, A.R.; Sariçay, Y.; Arranz, E.; Kelly, P.M.; Buckin, V.; Giblin, L. Comparison of antioxidant activities of bovine whey proteins before and after simulated gastrointestinal digestion. Int. J. Dairy Sci. 2019, 102, 54–67. [Google Scholar] [CrossRef] [Green Version]
- Power-Grant, O.; Bruen, C.; Brennan, L.; Giblin, L.; Jakeman, P.; Fitzgerald, R.J. In vitro bioactive properties of intact and enzymatically hydrolyzed whey protein: Targeting the enteroinsular axis. Food Funct. 2015, 6, 972–980. [Google Scholar] [CrossRef] [PubMed]
- Oliveira, C.; Sousa, M. The effects of L-carnitine supplementation in athletic performance. Sci. Sports 2019, 34, 63–72. [Google Scholar] [CrossRef]
- Kaviani, M.; Izadi, A.; Heshmati, J. Would creatine supplementation augment exercise performance during a low carbohydrate high fat diet? Med. Hypotheses 2021, 146, 1103696. [Google Scholar] [CrossRef]
- Patel, S. Cereal bran fortified-functional foods for obesity and diabetes management: Triumphs, hurdles and possibilities. J. Funct. Foods 2015, 14, 255–269. [Google Scholar] [CrossRef]
- Vitaglione, P.; Napolitano, A.; Fogliano, V. Cereal dietary fibre: A natural functional ingredient to deliver phenolic compounds into the gut. Trends Food Sci. Technol. 2008, 19, 451–463. [Google Scholar] [CrossRef]
- Shoaib, M.; Shehzad, A.; Omar, M.; Rakha, A.; Raza, H.; Sharif, H.R.; Niazi, S. Inulin: Properties, health benefits and food applications. Carbohydr. Polym. 2016, 147, 444–454. [Google Scholar] [CrossRef]
- Association of Official Analytical Chemists. Official Methods of Analysis of the AOAC, 17th ed.; Association of Official Analytical Chemists: Gaithersburg, MD, USA, 2000. [Google Scholar]
- Institute for Standardization of Serbia. Determination of Sodium Chloride—Volumetric Method; Institute for Standardization of Serbia: Belgade, Serbia, 1994; SRPS E.Z8.012. [Google Scholar]
- Determination of Starch Content by Hydrochloric Acid Dissolution; International Association for Cereal Science and Technology: Vienna, Austria, 1994; ICC Standard No. 123/1.
- Meng, X.; Ji, J.; Qi, X.; Nie, X. Effect of anticaking agents on hardening and Maillard-induced protein aggregation in high-protein nutrition bars formulated with whey protein concentrate. LWT-Food Sci. Technol. 2019, 108, 261–267. [Google Scholar] [CrossRef]
- Heiniö, R.-L.; Noort, M.W.J.; Katina, K.; Alam, S.A.; Sözer, N.; de Kock, H.L.; Poutanen, K. Sensory characteristics of wholegrain and bran-rich cereal foods: A review. Trends Food Sci. Technol. 2016, 47, 25–38. [Google Scholar] [CrossRef] [Green Version]
- Lee, K.D.; Warthesen, J.J. Preparative methods of isolating bitter peptides from cheddar cheese. J. Agric. Food Chem. 1996, 44, 1058–1063. [Google Scholar] [CrossRef]
- Lemieux, L.; Simard, R. Bitter flavour in dairy products. II. A review of bitter peptides from casein: Their formation, isolation and identification, structure masking and inhibition. Le Lait 1992, 72, 335–385. [Google Scholar] [CrossRef]
- Gaudette, N.J.; Pickering, G.J. Modifying bitterness in functional food systems. Crit. Rev. Food Sci. Nutr. 2013, 53, 464–481. [Google Scholar] [CrossRef] [PubMed]
- Pinto, V.R.A.; de Oliveira Freitas, T.B.; de Souza Dantas, M.I.; Della Lucia, S.M.; Melo, L.F.; Minim, V.P.R.; Bressan, J. Influence of package and health-related claims on perception and sensory acceptability of snack bars. Food Res. Int. 2017, 101, 103–113. [Google Scholar] [CrossRef] [PubMed]
- Cintineo, H.P.; Arent, M.A.; Antonio, J.; Arent, S.M. Effects of protein supplementation on performance and recovery in resistance and endurance training. Front. Nutr. 2018, 5, 83. [Google Scholar] [CrossRef] [PubMed]
- Pettersson, J.; Hindorf, U.; Persson, P.; Bengtsson, T.; Malmqvist, U.; Werkström, V.; Ekelund, M. Muscular exercise can cause highly pathological liver function tests in healthy men. Br. J. Clin. Pharmacol. 2008, 65, 253–259. [Google Scholar] [CrossRef] [Green Version]
- Chen, W.C.; Huang, W.C.; Chiu, C.C.; Chang, Y.K.; Huang, C.C. Whey protein improves exercise performance and biochemical profiles in trained mice. Med. Sci. Sports Exerc. 2014, 46, 1517–1524. [Google Scholar] [CrossRef] [Green Version]
- Huang, W.C.; Chang, Y.C.; Chen, Y.M.; Hsu, Y.J.; Huang, C.C.; Kan, N.W.; Chen, S.S. Whey protein improves marathon-induced injury and exercise performance in elite track runners. Int. J. Med. Sci. 2017, 14, 648–654. [Google Scholar] [CrossRef] [Green Version]
- Lockwood, C.M.; Roberts, M.D.; Dalbo, V.J.; Smith-Ryan, A.E.; Kendall, K.L.; Moon, J.R.; Stout, J.R. Effects of hydrolyzed whey versus other whey protein supplements on the physiological response to 8 weeks of resistance exercise in college-aged males. J. Am. Coll. Nutr. 2017, 36, 16–27. [Google Scholar] [CrossRef] [PubMed]
- Hansen, M.; Bangsbo, J.; Jensen, J.; Bibby, B.M.; Madsen, K. Effect of whey protein hydrolysate on performance and recovery of top-class orienteering runners. Int. J. Sport. Nutr. Exerc. Metab. 2015, 25, 97–109. [Google Scholar] [CrossRef]
- Goh, Q.; Boop, C.A.; Luden, N.D.; Smith, A.G.; Womack, C.J.; Saunders, M.J. Recovery from cycling exercise: Effects of carbohydrate and protein beverages. Nutrients 2012, 4, 568–574. [Google Scholar] [CrossRef] [PubMed]
- Isenmann, E.; Blume, F.; Bizjak, D.A.; Hundsdörfer, V.; Pagano, S.; Schibrowski, S.; Diel, P. Comparison of pro-regenerative effects of carbohydrates and protein administrated by shake and non-macro-nutrient matched food items on the skeletal muscle after acute endurance exercise. Nutrients 2019, 11, 744. [Google Scholar] [CrossRef] [PubMed] [Green Version]
- Kunutsor, S.K.; Bakker, S.J.; Gansevoort, R.T.; Chowdhury, R.; Dullaart, R.P. Circulating total bilirubin and risk of incident cardiovascular disease in the general population. Arterioscler. Thromb. Vasc. Biol. 2015, 35, 716–724. [Google Scholar] [CrossRef] [Green Version]
- Boon, A.C.; Lam, A.K.; Gopalan, V.; Benzie, I.F.; Briskey, D.; Coombes, J.S.; Bulmer, A.C. Endogenously elevated bilirubin modulates kidney function and protects from circulating oxidative stress in a rat model of adenine-induced kidney failure. Sci. Rep. 2015, 5, 15482. [Google Scholar] [CrossRef] [PubMed] [Green Version]
- Thakkar, M.; Edelenbos, J.; Doré, S. Bilirubin and ischemic stroke: Rendering the current paradigm to better understand the protective effects of bilirubin. Mol. Neurobiol. 2019, 56, 5483–5496. [Google Scholar] [CrossRef]
- Witek, K.; Ścisłowska, J.; Turowski, D.; Lerczak, K.; Lewandowska-Pachecka, S.; Pokrywka, A. Total bilirubin in athletes, determination of reference range. Biol. Sport 2017, 34, 45–48. [Google Scholar] [CrossRef]
- Hiel, S.; Bindels, L.B.; Pachikian, B.D.; Kalala, G.; Broers, V.; Zamariola, G.; Delzenne, N.M. Effects of a diet based on inulin-rich vegetables on gut health and nutritional behavior in healthy humans. Am. J. Clin. Nutr. 2019, 109, 1683–1695. [Google Scholar] [CrossRef] [PubMed]
- Pham, V.T.; Seifert, N.; Richard, N.; Raederstorff, D.; Steinert, R.E.; Prudence, K.; Mohajeri, M.H. The effects of fermentation products of prebiotic fibres on gut barrier and immune functions in vitro. PeerJ 2018, 6, e5288. [Google Scholar] [CrossRef]


| Parameter | 100 g |
|---|---|
| Energy | 1215 kJ/288 kcal |
| Moisture (g) | 6.08 ± 0.05 |
| Fat (g)of which saturated | 6.01 ± 0.133.12 ± 0.08 |
| Carbohydrate (g)of which sugars | 23.0 ± 0.161.50 ± 0.19 |
| Starch (g) | 21.5 ± 0.11 |
| Fibre (g) | 3.10 ± 0.17 |
| Protein (g) | 34.1 ± 0.20 |
| NaCl (g) | 0.51 ± 0.07 |
| Active ingredients | 100 g |
| Creatine-monohydrate (mg) | 5000 |
| Vitamin A (µg RE *) | 210 (26% **) |
| Vitamin D (µg) | 1.5 (30% **) |
| Vitamin E (mg-α-TE ***) | 3 (25% **) |
| Vitamin C (mg) | 13.5 (17% **) |
| Thiamin (mg) | 0.33 (30% **) |
| Riboflavin (mg) | 0.48 (34% **) |
| Niacin (NE) | 5.4 (34% **) |
| Vitamin B6 (mg) | 0.45 (32% **) |
| Folate (µg) | 60 (30% **) |
| Vitamin B12 (µg) | 0.42 (17% **) |
| Biotin (µg) | 7.5 (15% **) |
| Pantothenic acid (mg) | 0.9 (15% **) |
| Calcium (mg) | 210 (26% **) |
| Phosphorus (mg) | 165 (24% **) |
| Potassium (mg) | 930 (46% **) |
| Iron (mg) | 2.10 (15% **) |
| Zinc (mg) | 2.85 (28% **) |
| Copper (mg) | 0.33 (33% **) |
| Iodine (µg) | 42.9 (29% **) |
| Selenium (µg) | 18.2 (33% **) |
| Sodium (mg) | 173 |
| Magnesium (mg) | 56.35 (15% **) |
| Manganese (mg) | 0.31 (15% **) |
| Variable | Mean ± SD |
|---|---|
| Age (years) | 22.7 ± 2.1 |
| BMI (kg/m2) | 25.3 ± 1.4 |
| Fat mass (kg) | 14.6 ± 3.7 |
| Muscle mass (kg) | 73.8 ± 7.1 |
| Lean mass (kg) | 77.5 ± 7.5 |
| Fat (%) | 14.6 ± 3.6 |
| Visceral fat rating | 2.8 ± 1.5 |
| Energy intake (kcal/day) | 2710 ± 611 |
| Proteins (g/day) | 123 ± 58 |
| Carbohydrates (g/day) | 298 ± 99 |
| Total fat (g/day)High intensity physical activity (h/day/MET-h/day) | 105 ± 17 3/11 |
| Created Bar Intake | Control Bar Intake | ||||||||
|---|---|---|---|---|---|---|---|---|---|
| Before | After | pa t-test | pb model | Before | After | pa t-test | pb model | pc-index. | |
| Biochemical Parameters | |||||||||
| CK (U/L) | 327.6 ± 197.1 | 352.6 ± 351.5 | 0.732 | 0.325 | 446.5 ± 271.1 | 348.8 ± 183.0 | 0.207 | 0.075 | 0.242 |
| HOL (mmol/L) | 3.70 ± 0.56 | 3.62 ± 0.68 | 0.385 | 0.337 | 3.72 ± 0.44 | 3.72 ± 0.57 | 0.987 | 0.475 | 0.705 |
| LDL (mmol/L) | 2.33 ± 0.70 | 2.27 ± 0.70 | 0.289 | 0.359 | 2.18 ± 0.47 | 2.20 ± 0.70 | 0.799 | 0.578 | 0.500 |
| HDL (mmol/L) | 1.28 ± 0.46 | 1.21 ± 0.31 | 0.373 | 0.238 | 1.44 ± 0.62 | 1.46 ± 0.47 | 0.787 | 0.747 | 0.452 |
| TAG (mmol/L) | 1.12 ± 0.43 | 1.18 ± 0.28 | 0.601 | 0.084 | 1.10 ± 0.47 | 1.18 ± 0.53 | 0.767 | 0.772 | 0.925 |
| Glucose (mmol/L) | 4.90 ± 0.26 | 4.97 ± 0.44 | 0.682 | 0.515 | 4.98 ± 0.40 | 5.26 ± 0.60 | 0.06 | 0.212 | 0.306 |
| CRP (mg/L) | 0.30 ± 0.32 | 0.36 ± 0.33 | 0.992 | 0.184 | 0.51 ± 0.53 | 0.56 ± 0.62 | 0.858 | 0.229 | 0.305 |
| Bilirubin (µmol/L) | 12.7 ± 7.4 | 13.96 ± 4.30 | 0.416 | 0.017 | 11.0 ± 4.5 | 11.5 ± 7.7 | 0.813 | 0.811 | 0.784 |
| Bilirubin/d (µmol/L) | 2.58 ± 1.22 | 2.80 ± 0.76 | 0.410 | 0.049 | 2.45 ± 0.89 | 2.5 ± 1.3 | 0.904 | 0.834 | 0.705 |
| AST (U/L) | 30.0 ±10.1 | 28.2 ± 10.1 | 0.656 | 0.016 | 31.2 ± 9.2 | 28.0 ± 4.5 | 0.135 | 0.068 | 0.815 |
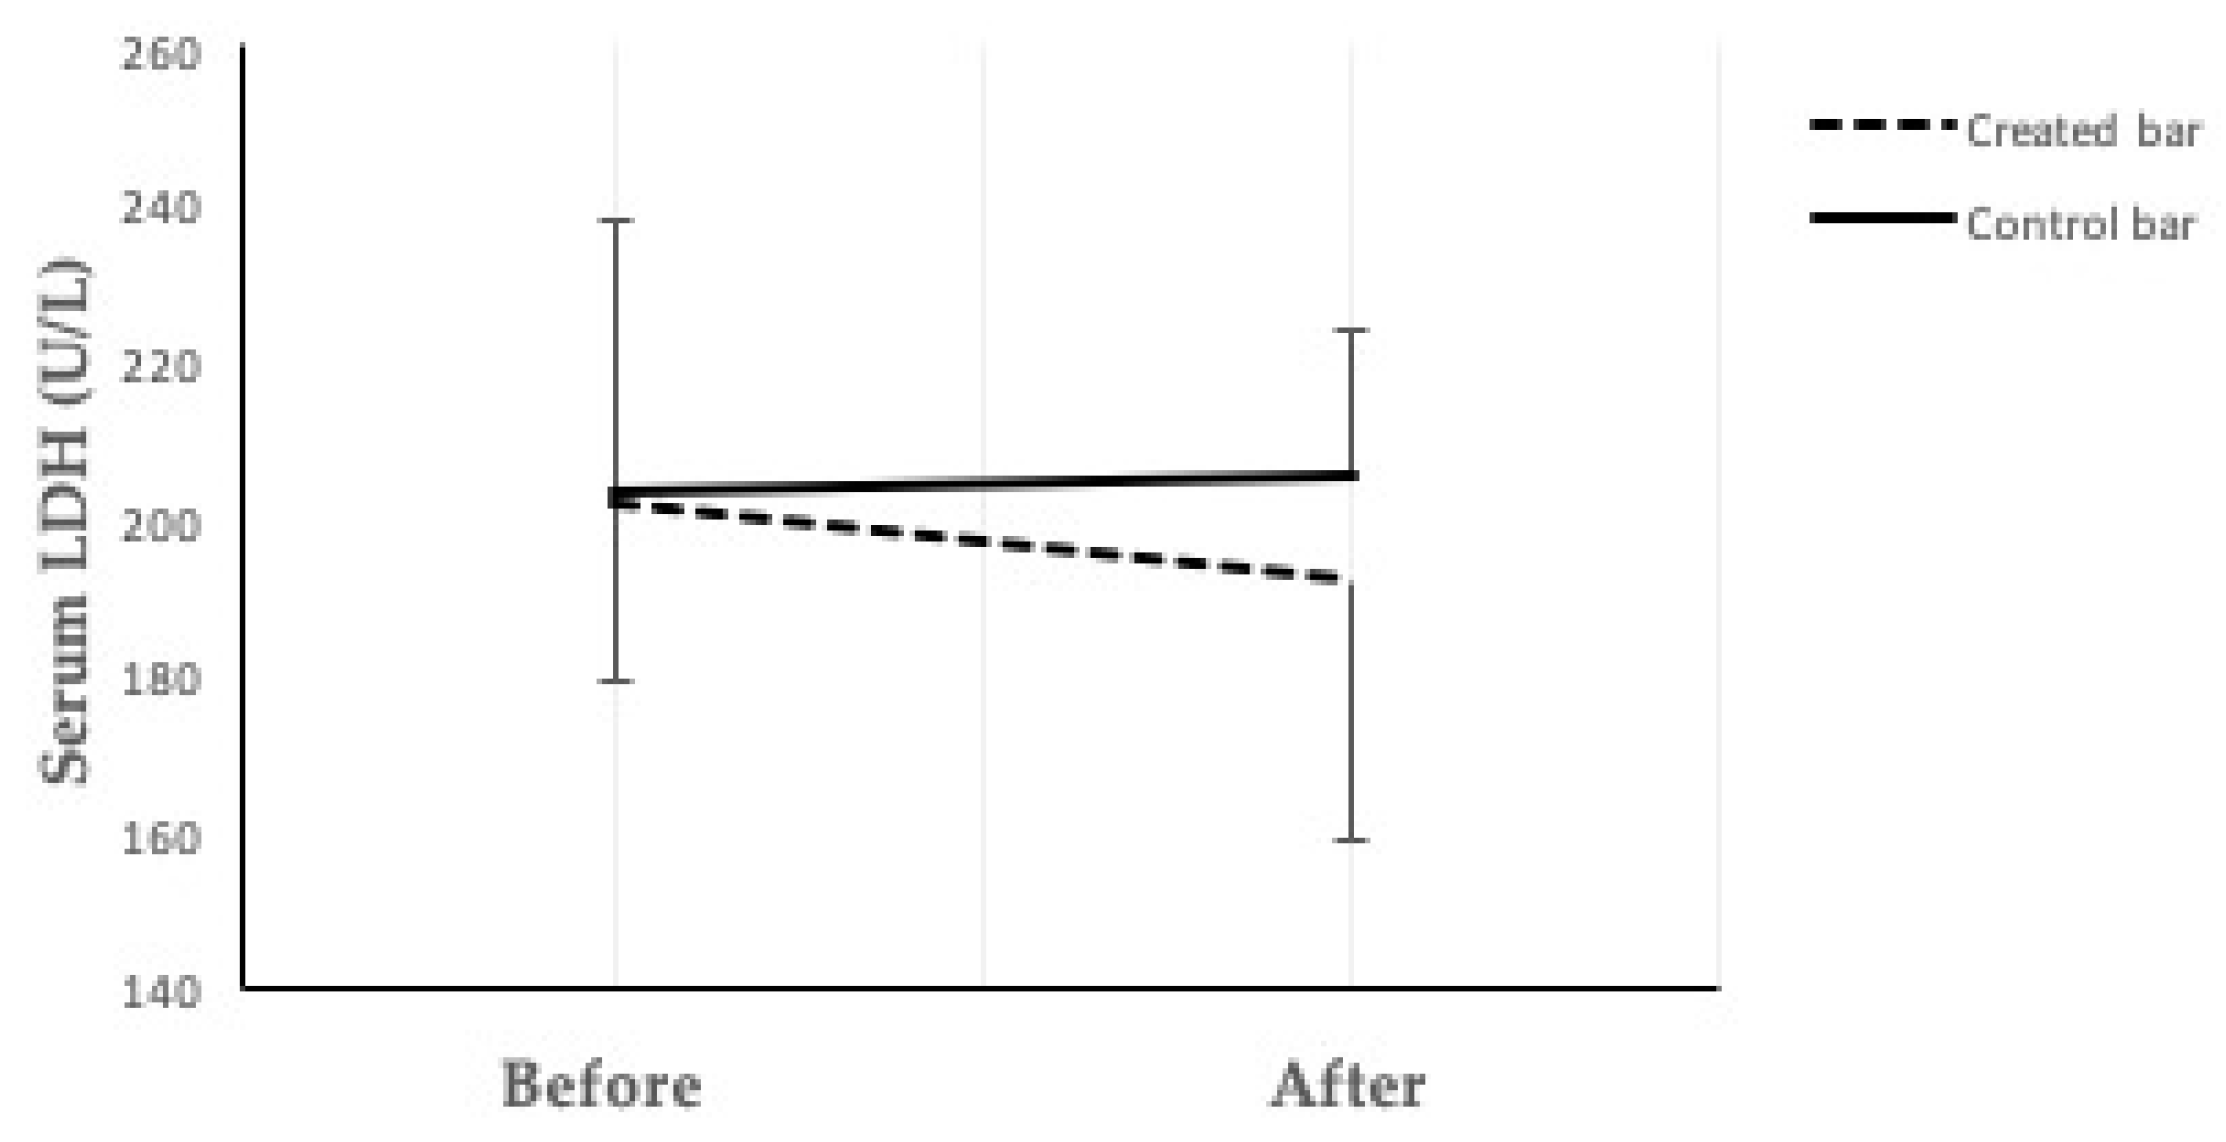
| LDH (U/L) | 202 ± 23 | 192 ± 33 | 0.277 | 0.044 | 203 ± 35 | 205 ± 19 | 0.846 | 0.438 | 0.349 |
Publisher’s Note: MDPI stays neutral with regard to jurisdictional claims in published maps and institutional affiliations. |
© 2021 by the authors. Licensee MDPI, Basel, Switzerland. This article is an open access article distributed under the terms and conditions of the Creative Commons Attribution (CC BY) license (https://creativecommons.org/licenses/by/4.0/).
Share and Cite
Jovanov, P.; Sakač, M.; Jurdana, M.; Pražnikar, Z.J.; Kenig, S.; Hadnađev, M.; Jakus, T.; Petelin, A.; Škrobot, D.; Marić, A. High-Protein Bar as a Meal Replacement in Elite Sports Nutrition: A Pilot Study. Foods 2021, 10, 2628. https://doi.org/10.3390/foods10112628
Jovanov P, Sakač M, Jurdana M, Pražnikar ZJ, Kenig S, Hadnađev M, Jakus T, Petelin A, Škrobot D, Marić A. High-Protein Bar as a Meal Replacement in Elite Sports Nutrition: A Pilot Study. Foods. 2021; 10(11):2628. https://doi.org/10.3390/foods10112628
Chicago/Turabian StyleJovanov, Pavle, Marijana Sakač, Mihaela Jurdana, Zala Jenko Pražnikar, Saša Kenig, Miroslav Hadnađev, Tadeja Jakus, Ana Petelin, Dubravka Škrobot, and Aleksandar Marić. 2021. "High-Protein Bar as a Meal Replacement in Elite Sports Nutrition: A Pilot Study" Foods 10, no. 11: 2628. https://doi.org/10.3390/foods10112628
APA StyleJovanov, P., Sakač, M., Jurdana, M., Pražnikar, Z. J., Kenig, S., Hadnađev, M., Jakus, T., Petelin, A., Škrobot, D., & Marić, A. (2021). High-Protein Bar as a Meal Replacement in Elite Sports Nutrition: A Pilot Study. Foods, 10(11), 2628. https://doi.org/10.3390/foods10112628