Street Food in Maputo, Mozambique: The Coexistence of Minimally Processed and Ultra-Processed Foods in a Country under Nutrition Transition

 ,
,  ,
,  and
and
Abstract
:1. Introduction
2. Methods
2.1. Street Food Vending Sites Selection
2.2. Sampling Procedure
2.3. Data Collection
2.4. Nutritional Composition Estimation
2.5. Processing Extent Classification
2.6. Statistical Analysis
3. Results
4. Discussion
5. Conclusions
Author Contributions
Funding
Institutional Review Board Statement
Informed Consent Statement
Data Availability Statement
Acknowledgments
Conflicts of Interest
References
- Popkin, B.M. Global nutrition dynamics: The world is shifting rapidly toward a diet linked with noncommunicable diseases. Am. J. Clin. Nutr. 2006, 84, 289–298. [Google Scholar] [CrossRef]
- Baker, P.; Friel, S. Processed foods and the nutrition transition: Evidence from Asia. Obes. Rev. 2014, 15, 564–577. [Google Scholar] [CrossRef] [Green Version]
- Nnyepi, M.S.; Gwisai, N.; Lekgoa, M.; Seru, T. Evidence of nutrition transition in Southern Africa. Proc. Nutr. Soc. 2015, 74, 478–486. [Google Scholar] [CrossRef] [Green Version]
- Popkin, B.M. Contemporary nutritional transition: Determinants of diet and its impact on body composition. Proc. Nutr. Soc. 2011, 70, 82–91. [Google Scholar] [CrossRef] [Green Version]
- Vorster, H.H.; Kruger, A.; Margetts, B.M. The nutrition transition in Africa: Can it be steered into a more positive direction? Nutrients 2011, 3, 429–441. [Google Scholar] [CrossRef] [PubMed] [Green Version]
- Hawkes, C. Uneven dietary development: Linking the policies and processes of globalization with the nutrition transition, obesity and diet-related chronic diseases. Glob. Health 2006, 2, 4. [Google Scholar] [CrossRef] [PubMed] [Green Version]
- Padrao, P.; Laszczynska, O.; Silva-Matos, C.; Damasceno, A.; Lunet, N. Low fruit and vegetable consumption in Mozambique: Results from a WHO STEPwise approach to chronic disease risk factor surveillance. Br. J. Nutr. 2012, 107, 428–435. [Google Scholar] [CrossRef] [PubMed] [Green Version]
- Silva, V.; Santos, S.; Novela, C.; Padrão, P.; Moreira, P.; Lunet, N. Some observations on food consumption and culinary practices in Maputo, Mozambique. In Proceedings of the Culinary Arts and Sciences VIII: Global, Local, and National Perspectives, Porto, Portugal, 19–21 June 2013; pp. 93–98. [Google Scholar]
- Smart, J.C.; Tschirley, D.; Smart, F. Diet Quality and Urbanization in Mozambique. Food Nutr. Bull. 2020, 41, 298–317. [Google Scholar] [CrossRef]
- Institute for Health Metrics and Evaluation. Institute for Health Metrics and Evaluation. Global Burden of Diseases (GBD) Compare. Available online: http://vizhub.healthdata.org/gbd-compare/ (accessed on 30 March 2021).
- Fontes, F.; Damasceno, A.; Jessen, N.; Prista, A.; Silva-Matos, C.; Padrão, P.; Lunet, N. Prevalence of overweight and obesity in Mozambique in 2005 and 2015. Public Health Nutr. 2019, 22, 3118–3126. [Google Scholar] [CrossRef] [PubMed]
- Global Nutrition Report. Country Nutrition Profiles: Mozambique. Available online: https://globalnutritionreport.org/resources/nutrition-profiles/africa/eastern-africa/mozambique/ (accessed on 14 October 2021).
- Food and Agriculture Organization. Nutrition Country Profile—Republic of Mozambique; Nutrition and Consumer Protection Division, Food and Agriculture Organization: Rome, Italy, 2011. [Google Scholar]
- Popkin, B.M. Urbanization, Lifestyle Changes and the Nutrition Transition. World Dev. 1999, 27, 1905–1916. [Google Scholar] [CrossRef]
- Winarno, F.; Allain, A. Street Foods in Developing Countries: Lessons from Asia; Food and Agriculture Organization of the United Nations: Rome, Italy, 1991; pp. 11–18. [Google Scholar]
- Fellows, P.; Hilmi, M. Selling Street and Snack Foods; Rural Infrastructure and Agro-Industries Division of the Food and Agriculture Organization of the United Nations: Rome, Italy, 2012. [Google Scholar]
- Liu, Z.; Zhang, G.; Zhang, X. Urban street foods in Shijiazhuang city, China: Current status, safety practices and risk mitigating strategies. Food Control 2014, 41, 212–218. [Google Scholar] [CrossRef]
- Steyn, N.P.; McHiza, Z.; Hill, J.; Davids, Y.D.; Venter, I.; Hinrichsen, E.; Opperman, M.; Rumbelow, J.; Jacobs, P. Nutritional contribution of street foods to the diet of people in developing countries: A systematic review. Public Health Nutr. 2014, 17, 1363–1374. [Google Scholar] [CrossRef] [Green Version]
- World Health Organization. FEEDcities Project: The Food Environment Description in Cities in Eastern Europe and Central Asia—Tajikistan; World Health Organization Regional Office for Europe: Copenhagen, Denmark, 2017. [Google Scholar]
- Raimundo, I.; Crush, J.; Pendleton, W. The State of Food Insecurity in Maputo, Mozambique; African Food Security Urban Network: Cape Town, South Africa, 2014. [Google Scholar]
- Salamandane, A.; Silva, A.C.; Brito, L.; Malfeito-Ferreira, M. Microbiological assessment of street foods at the point of sale in Maputo (Mozambique). Food Qual. Saf. 2021, 5, 1–9. [Google Scholar] [CrossRef]
- Sousa, S.; Gelormini, M.; Damasceno, A.; Lopes, S.A.; Malo, S.; Chongole, C.; Muholove, P.; Casal, S.; Pinho, O.; Moreira, P.; et al. Street food in Maputo, Mozambique: Availability and nutritional value of homemade foods. Nutr. Health 2019, 25, 37–46. [Google Scholar] [CrossRef] [PubMed]
- Fardet, A.; Rock, E.; Bassama, J.; Bohuon, P.; Prabhasankar, P.; Monteiro, C.; Moubarac, J.C.; Achir, N. Current food classifications in epidemiological studies do not enable solid nutritional recommendations for preventing diet-related chronic diseases: The impact of food processing. Adv. Nutr. 2015, 6, 629–638. [Google Scholar] [CrossRef] [PubMed]
- Monteiro, C.A.; Cannon, G.; Levy, R.B.; Moubarac, J.C.; Jaime, P.; Martins, A.P.; Canella, D.; Louzada, M.; Parra, D.; Ricardo, C.; et al. Food classification. Public health: NOVA. The star shines bright. J. World Public Health Nutr. Assoc. 2016, 7, 3. [Google Scholar]
- Gelormini, M.; Damasceno, A.; Lopes, S.A.; Malo, S.; Chongole, C.; Muholove, P.; Casal, S.; Pinho, O.; Moreira, P.; Padrao, P.; et al. Street Food Environment in Maputo (STOOD Map): A Cross-Sectional Study in Mozambique. JMIR Res. Protoc. 2015, 4, e98. [Google Scholar] [CrossRef] [Green Version]
- Food and Agriculture Organization. Food and Nutrition Paper No. 46: Street Foods; Food and Agriculture Organization: Rome, Italy, 1989. [Google Scholar]
- World Health Organization. Food Safety Team. Essential Safety Requirements for Street-Vended Foods; World Health Organization: Geneva, Switzerland, 1996. [Google Scholar]
- AURECON. Comprehensive Urban Transport Master Plan for the Greater Maputo Region—Survey Package A. Maputo: Inventory Surveys. Final Report; Government of Mozambique: Maputo, Mozambique, 2012. [Google Scholar]
- Conselho Municipal de Maputo. Perfil Estatístico do Município de Maputo; Conselho Municipal de Maputo: Maputo, Mozambique, 2010. [Google Scholar]
- Direcção Nacional de Saúde. Tabela de Composição de Alimentos; Direcção Nacional de Saúde, Secção de Nutrição, Ministério da Saúde de Moçambique: Maputo, Mozambique, 1991. [Google Scholar]
- Núcleo de Estudos e Pesquisas em Alimentação. Tabela Brasileira de Composição de Alimentos; Universidade Estadual de Campinas: São Paulo, Brazil, 2011. [Google Scholar]
- SAFOODS. South African Food Data System. Available online: http://safoods-apps.mrc.ac.za/foodcomposition/ (accessed on 29 May 2018).
- Sousa, S.; Damasceno, A.; Gelormini, M.; Jessen, N.; Lunet, N.; Padrao, P. Powdered chicken stock may be an important source of dietary sodium intake in Maputo, Mozambique. J. Public Health 2017, 40, 1–2. [Google Scholar] [CrossRef]
- Albuquerque, G.; Gelormini, M.; de Morais, I.L.; Sousa, S.; Casal, S.; Pinho, O.; Moreira, P.; Breda, J.; Lunet, N.; Padrão, P. Street food in Eastern Europe: A perspective from an urban environment in Moldova. Br. J. Nutr. 2020, 124, 1093–1101. [Google Scholar] [CrossRef]
- Albuquerque, G.; Lança de Morais, I.; Gelormini, M.; Sousa, S.; Casal, S.; Pinho, O.; Moreira, P.; Breda, J.; Lunet, N.; Padrão, P. Macronutrient composition of street food in Central Asia: Bishkek, Kyrgyzstan. Food Sci. Nutr. 2020, 8, 5309–5320. [Google Scholar] [CrossRef]
- Albuquerque, G.; Morais, I.; Gelormini, M.; Casal, S.; Damasceno, A.; Pinho, O.; Moreira, P.; Jewell, J.; Breda, J.; Lunet, N.; et al. Street food in Dushanbe, Tajikistan: Availability and nutritional value. Br. J. Nutr. 2019, 122, 1052–1061. [Google Scholar] [CrossRef] [Green Version]
- World Health Organization. FEEDcities Project: Food Environment Description in Cities—Eastern Europe and Central Asia. Banja Luka. The Republika Srpska. Bosnia and Herzegovina; World Health Organization Regional Office for Europe: Copenhagen, Denmark, 2019. [Google Scholar]
- World Health Organization. FEEDcities Project: Food Environment Description in Cities—Eastern Europe and Central Asia. Sarajevo. The Federation of Bosnia and Herzegovina. Bosnia and Herzegovina; World Health Organization Regional Office for Europe: Copenhagen, Denmark, 2019. [Google Scholar]
- Monteiro, C.A.; Levy, R.B.; Claro, R.M.; de Castro, I.R.; Cannon, G. Increasing consumption of ultra-processed foods and likely impact on human health: Evidence from Brazil. Public Health Nutr. 2011, 14, 5–13. [Google Scholar] [CrossRef]
- Moubarac, J.C.; Martins, A.P.; Claro, R.M.; Levy, R.B.; Cannon, G.; Monteiro, C.A. Consumption of ultra-processed foods and likely impact on human health. Evidence from Canada. Public Health Nutr. 2013, 16, 2240–2248. [Google Scholar] [CrossRef] [PubMed] [Green Version]
- Louzada, M.L.; Baraldi, L.G.; Steele, E.M.; Martins, A.P.; Canella, D.S.; Moubarac, J.C.; Levy, R.B.; Cannon, G.; Afshin, A.; Imamura, F.; et al. Consumption of ultra-processed foods and obesity in Brazilian adolescents and adults. Prev. Med. 2015, 81, 9–15. [Google Scholar] [CrossRef] [PubMed] [Green Version]
- Nago, E.S.; Lachat, C.K.; Huybregts, L.; Roberfroid, D.; Dossa, R.A.; Kolsteren, P.W. Food, energy and macronutrient contribution of out-of-home foods in school-going adolescents in Cotonou, Benin. Br. J. Nutr. 2010, 103, 281–288. [Google Scholar] [CrossRef] [Green Version]
- Namugumya, B.S.; Muyanja, C. Contribution of street foods to the dietary needs of street food vendors in Kampala, Jinja and Masaka districts, Uganda. Public Health Nutr. 2012, 15, 1503–1511. [Google Scholar] [CrossRef] [PubMed] [Green Version]
- Gupta, V.; Downs, S.M.; Ghosh-Jerath, S.; Lock, K.; Singh, A. Unhealthy Fat in Street and Snack Foods in Low-Socioeconomic Settings in India: A Case Study of the Food Environments of Rural Villages and an Urban Slum. J. Nutr. Educ. Behav. 2016, 48, 269–279. [Google Scholar] [CrossRef] [Green Version]
- European Union. Workshop: Trans Fats; European Union: Brussels, Belgium, 2014. [Google Scholar]
- Gulati, S.; Misra, A. Sugar intake, obesity, and diabetes in India. Nutrients 2014, 6, 5955–5974. [Google Scholar] [CrossRef]
- Remig, V.; Franklin, B.; Margolis, S.; Kostas, G.; Nece, T.; Street, J.C. Trans fats in America: A review of their use, consumption, health implications, and regulation. J. Am. Diet. Assoc. 2010, 110, 585–592. [Google Scholar] [CrossRef] [Green Version]
- World Health Organization. Information Note about Intake of Sugars Recommended in the WHO Guideline for Adults and Children; World Health Organization: Geneva, Swizerland, 2015. [Google Scholar]
- Draper, A. Street foods in developing countries: The potential for micronutrient fortification. London School of Hygiene and Tropical Medicine: London, UK, 1996. [Google Scholar]
- World Health Organization. Diet, Nutrition and the Prevention of Chronic Diseases. Report of a Joint WHO/FAO Expert Consultation. WHO Technical Report Series No. 916; World Health Organization: Geneva, Switzerland, 2003. [Google Scholar]
- Monteiro, C.A.; Moubarac, J.C.; Cannon, G.; Ng, S.W.; Popkin, B. Ultra-processed products are becoming dominant in the global food system. Obesity Rev. 2013, 14 (Suppl. 2), 21–28. [Google Scholar] [CrossRef]

| N a | Total n = 810 | Mobile SF Vending Sites n = 187 | Stationary SF Vending Sites n = 623 | |
|---|---|---|---|---|
| n (%) | n (%) | n (%) | ||
| Unprocessed or minimally processed foods (including culinary preparations using them as base) b | 73 | 571 (70.5) | 161 (86.1) | 410 (65.8) |
| Rice Corn c Wheat d Beef e Pork e Poultry e Goat e Liver e Fish/seafood f Eggs e Milk g Beans h Nuts i Cassava j Vegetables (except leaves) k Leaves l Potatoes Fruit Water and tea | 1 4 5 2 2 4 1 1 5 2 3 2 4 2 2 4 2 25 2 | 47 (8.2) 52 (9.1) 75 (13.1) 46 (8.0) 15 (2.6) 56 (9.8) 9 (1.6) 2 (0.3) 69 (12.0) 88 (15.4) 17 (3.0) 102 (17.8) 62 (10.8) 7 (1.2) 25 (4.4) 16 (2.8) 63 (11.0) 204 (35.7) 172 (30.0) | 0 (0.0) 0 (0.0) 25 (15.5) 0 (0.0) 0 (0.0) 0 (0.0) 0 (0.0) 0 (0.0) 3 (1.9) 34 (21.1) 0 (0.0) 24 (14.9) 4 (2.5) 5 (3.1) 0 (0.0) 0 (0.0) 2 (1.2) 70 (43.5) 1 (0.6) | 47 (11.5) 52 (12.7) 50 (12.2) 46 (11.2) 15 (3.7) 56 (13.7) 9 (2.2) 2 (0.5) 66 (16.1) 54 (13.2) 17 (4.1) 78 (19.0) 58 (14.1) 2 (0.5) 25 (6.1) 16 (3.9) 61 (14.9) 134 (32.7) 171 (41.7) |
| Processed foods b | 8 | 119 (14.7) | 16 (8.6) | 103 (16.5) |
| Sandwiches Bread Canned fish Ham Cheese Fermented alcoholic beverages | 1 2 1 1 1 2 | 58 (48.7) 81 (68.1) 3 (2.5) 1 (0.8) 11 (9.2) 28 (23.5) | 11 (68.8) 16 (100.0) 0 (0.0) 0 (0.0) 0 (0.0) 0 (0.0) | 47 (45.6) 65 (63.1) 3 (2.9) 1 (1.0) 11 (10.7) 28 (27.2) |
| Ultra-processed foods b | 27 | 478 (59.0) | 32 (17.1) | 446 (71.6) |
| Bun Fast food dishes m Cakes and cookies Fried snacks n Confectionery o Industrial popcorn Sausages Soft drinks Sugar-free soft drinks Distilled alcoholic beverages Milk products p | 1 4 3 2 4 1 2 4 2 2 2 | 4 (0.8) 30 (6.3) 302 (63.0) 198 (41.3) 274 (57.2) 3 (0.6) 48 (10.0) 252 (52.6) 11 (2.3) 14 (2.9) 21 (4.4) | 2 (6.3) 0 (0.0) 3 (9.4) 5 (15.6) 10 (31.3) 1 (3.1) 12 (37.5) 2 (6.3) 0 (0.0) 0 (0.0) 1 (3.1) | 2 (0.4) 30 (6.7) 299 (66.9) 193 (43.2) 264 (59.1) 2 (0.4) 36 (8.1) 250 (55.9) 11 (2.5) 14 (3.1) 20 (4.5) |
| n a | Serving Size (g) | Energy (kcal) | Contribution to TEV (%) | ||||
|---|---|---|---|---|---|---|---|
| /Serving | /100 g | Carbohydrates | Protein | Fats | |||
| Mean (Min–Max) | Mean (Min–Max) | Mean (Min–Max) | Mean (Min–Max) | Mean (Min–Max) | Mean (Min–Max) | ||
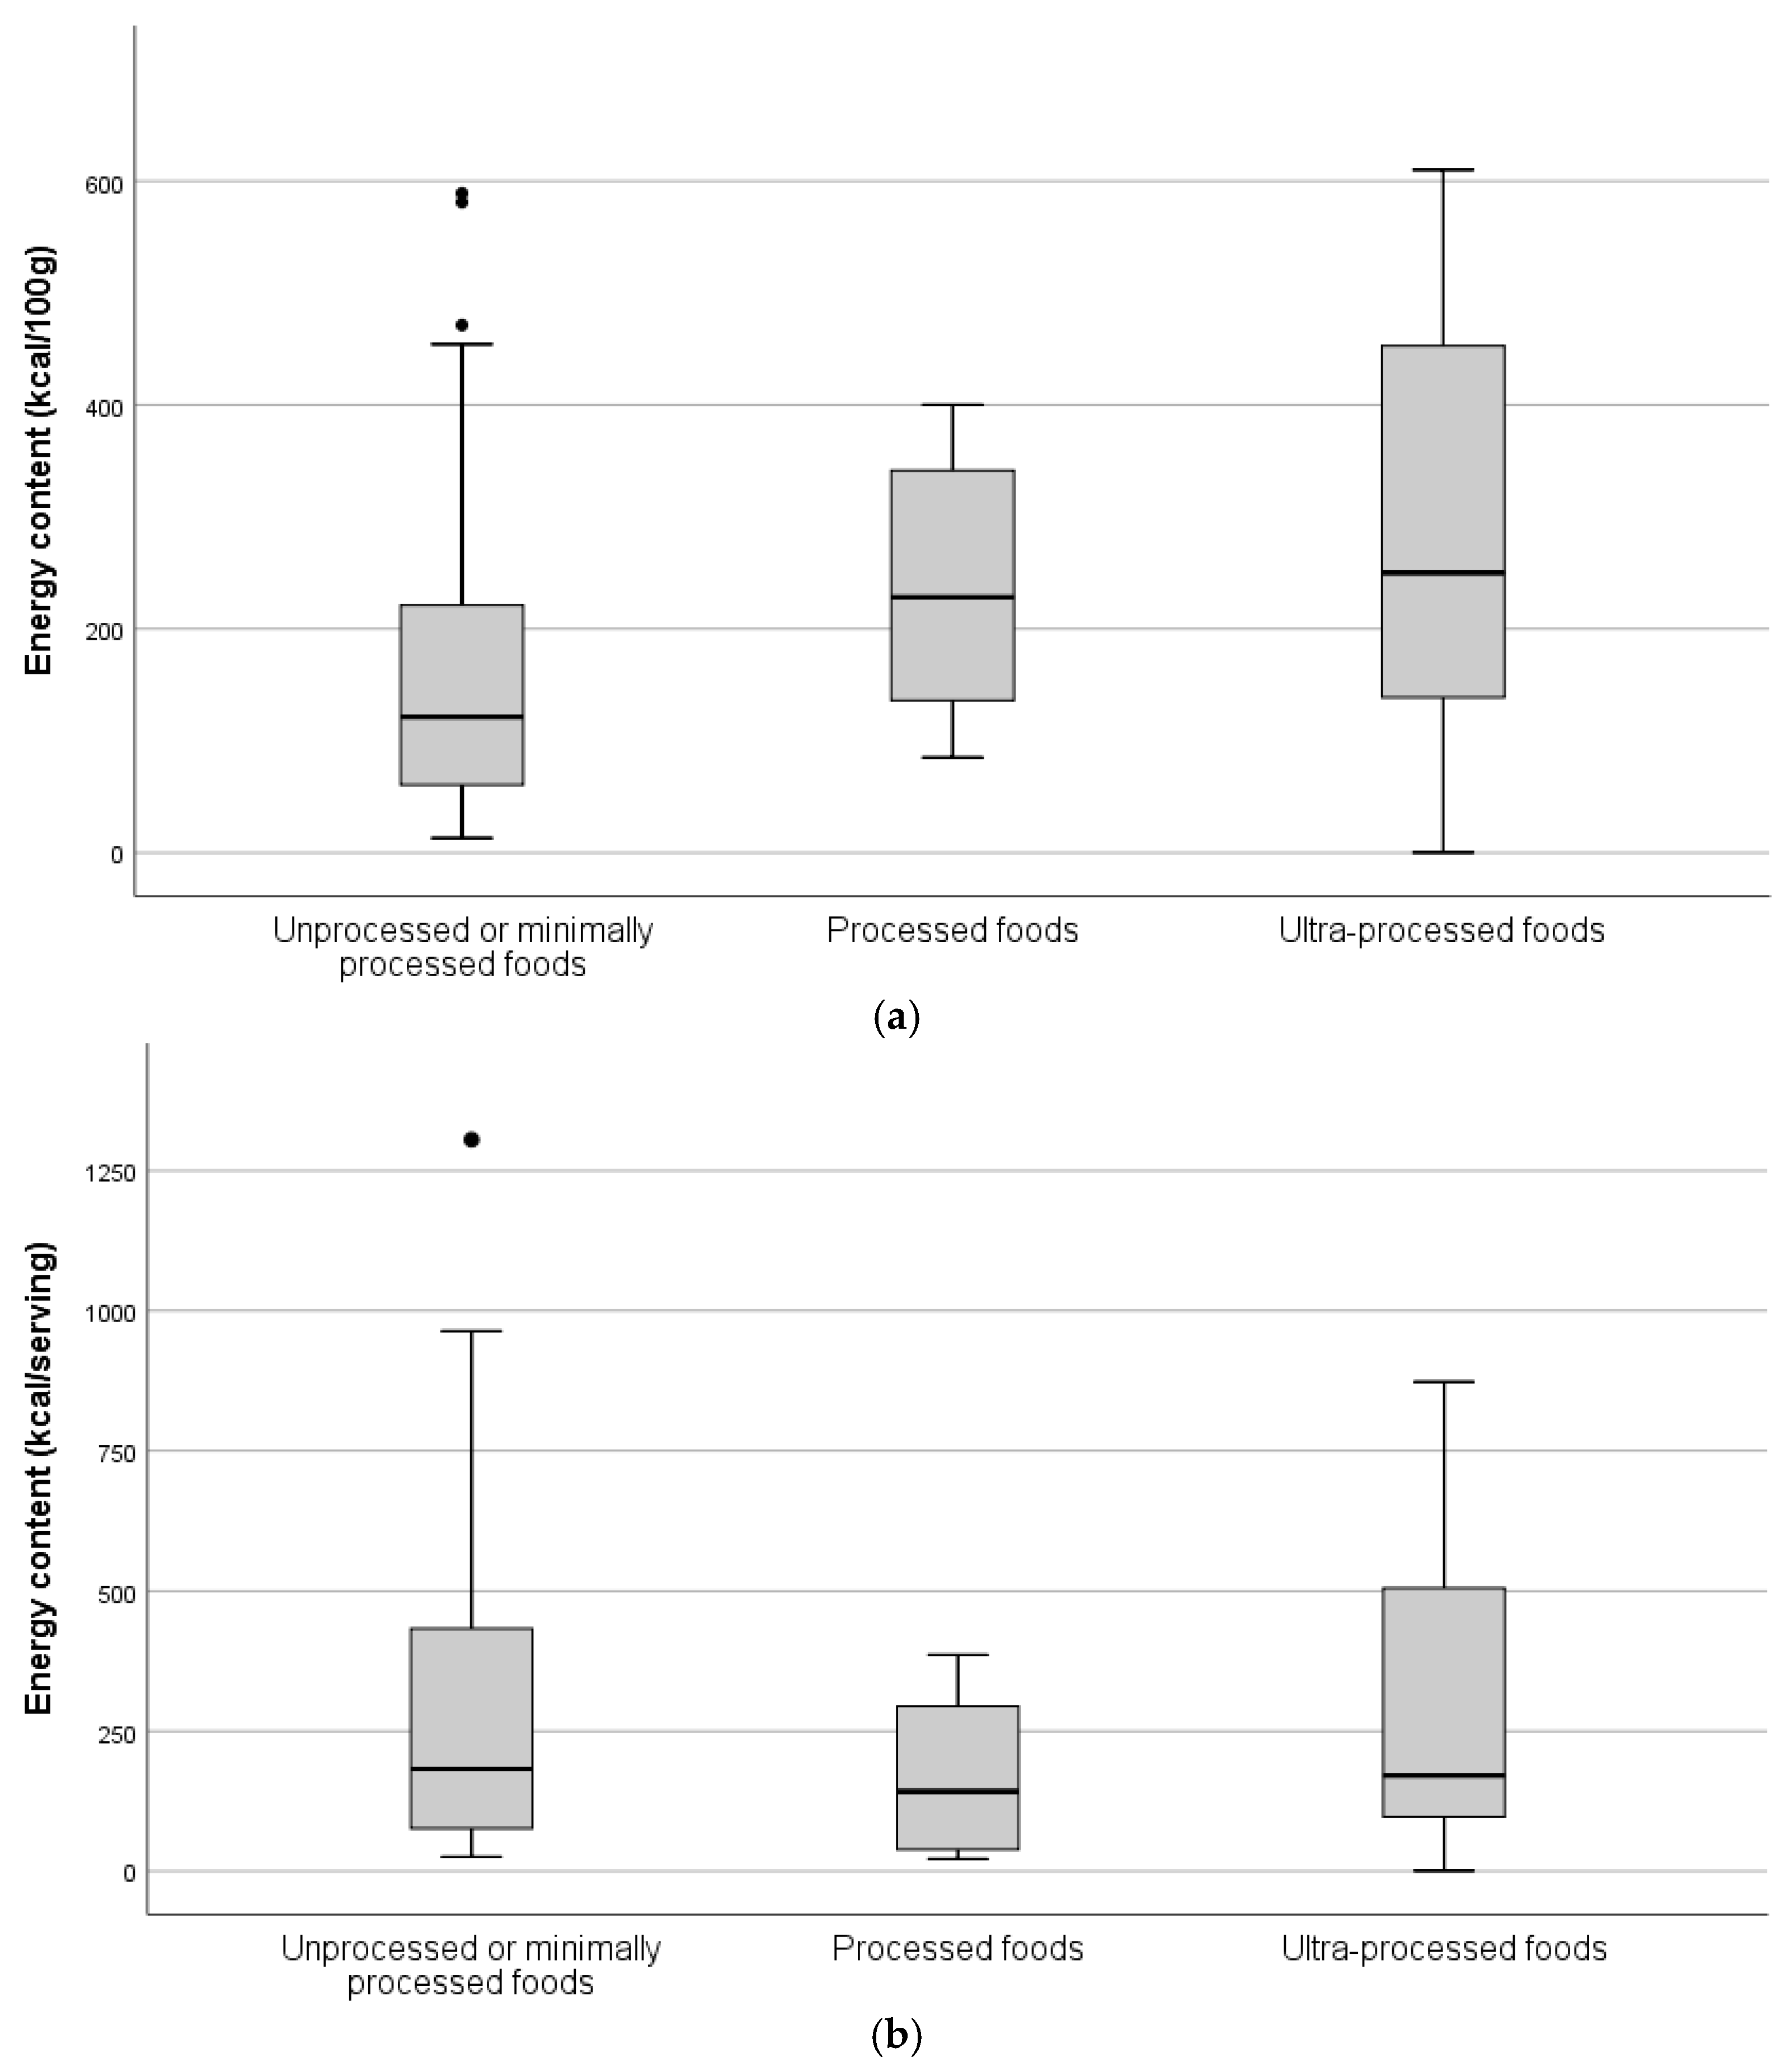
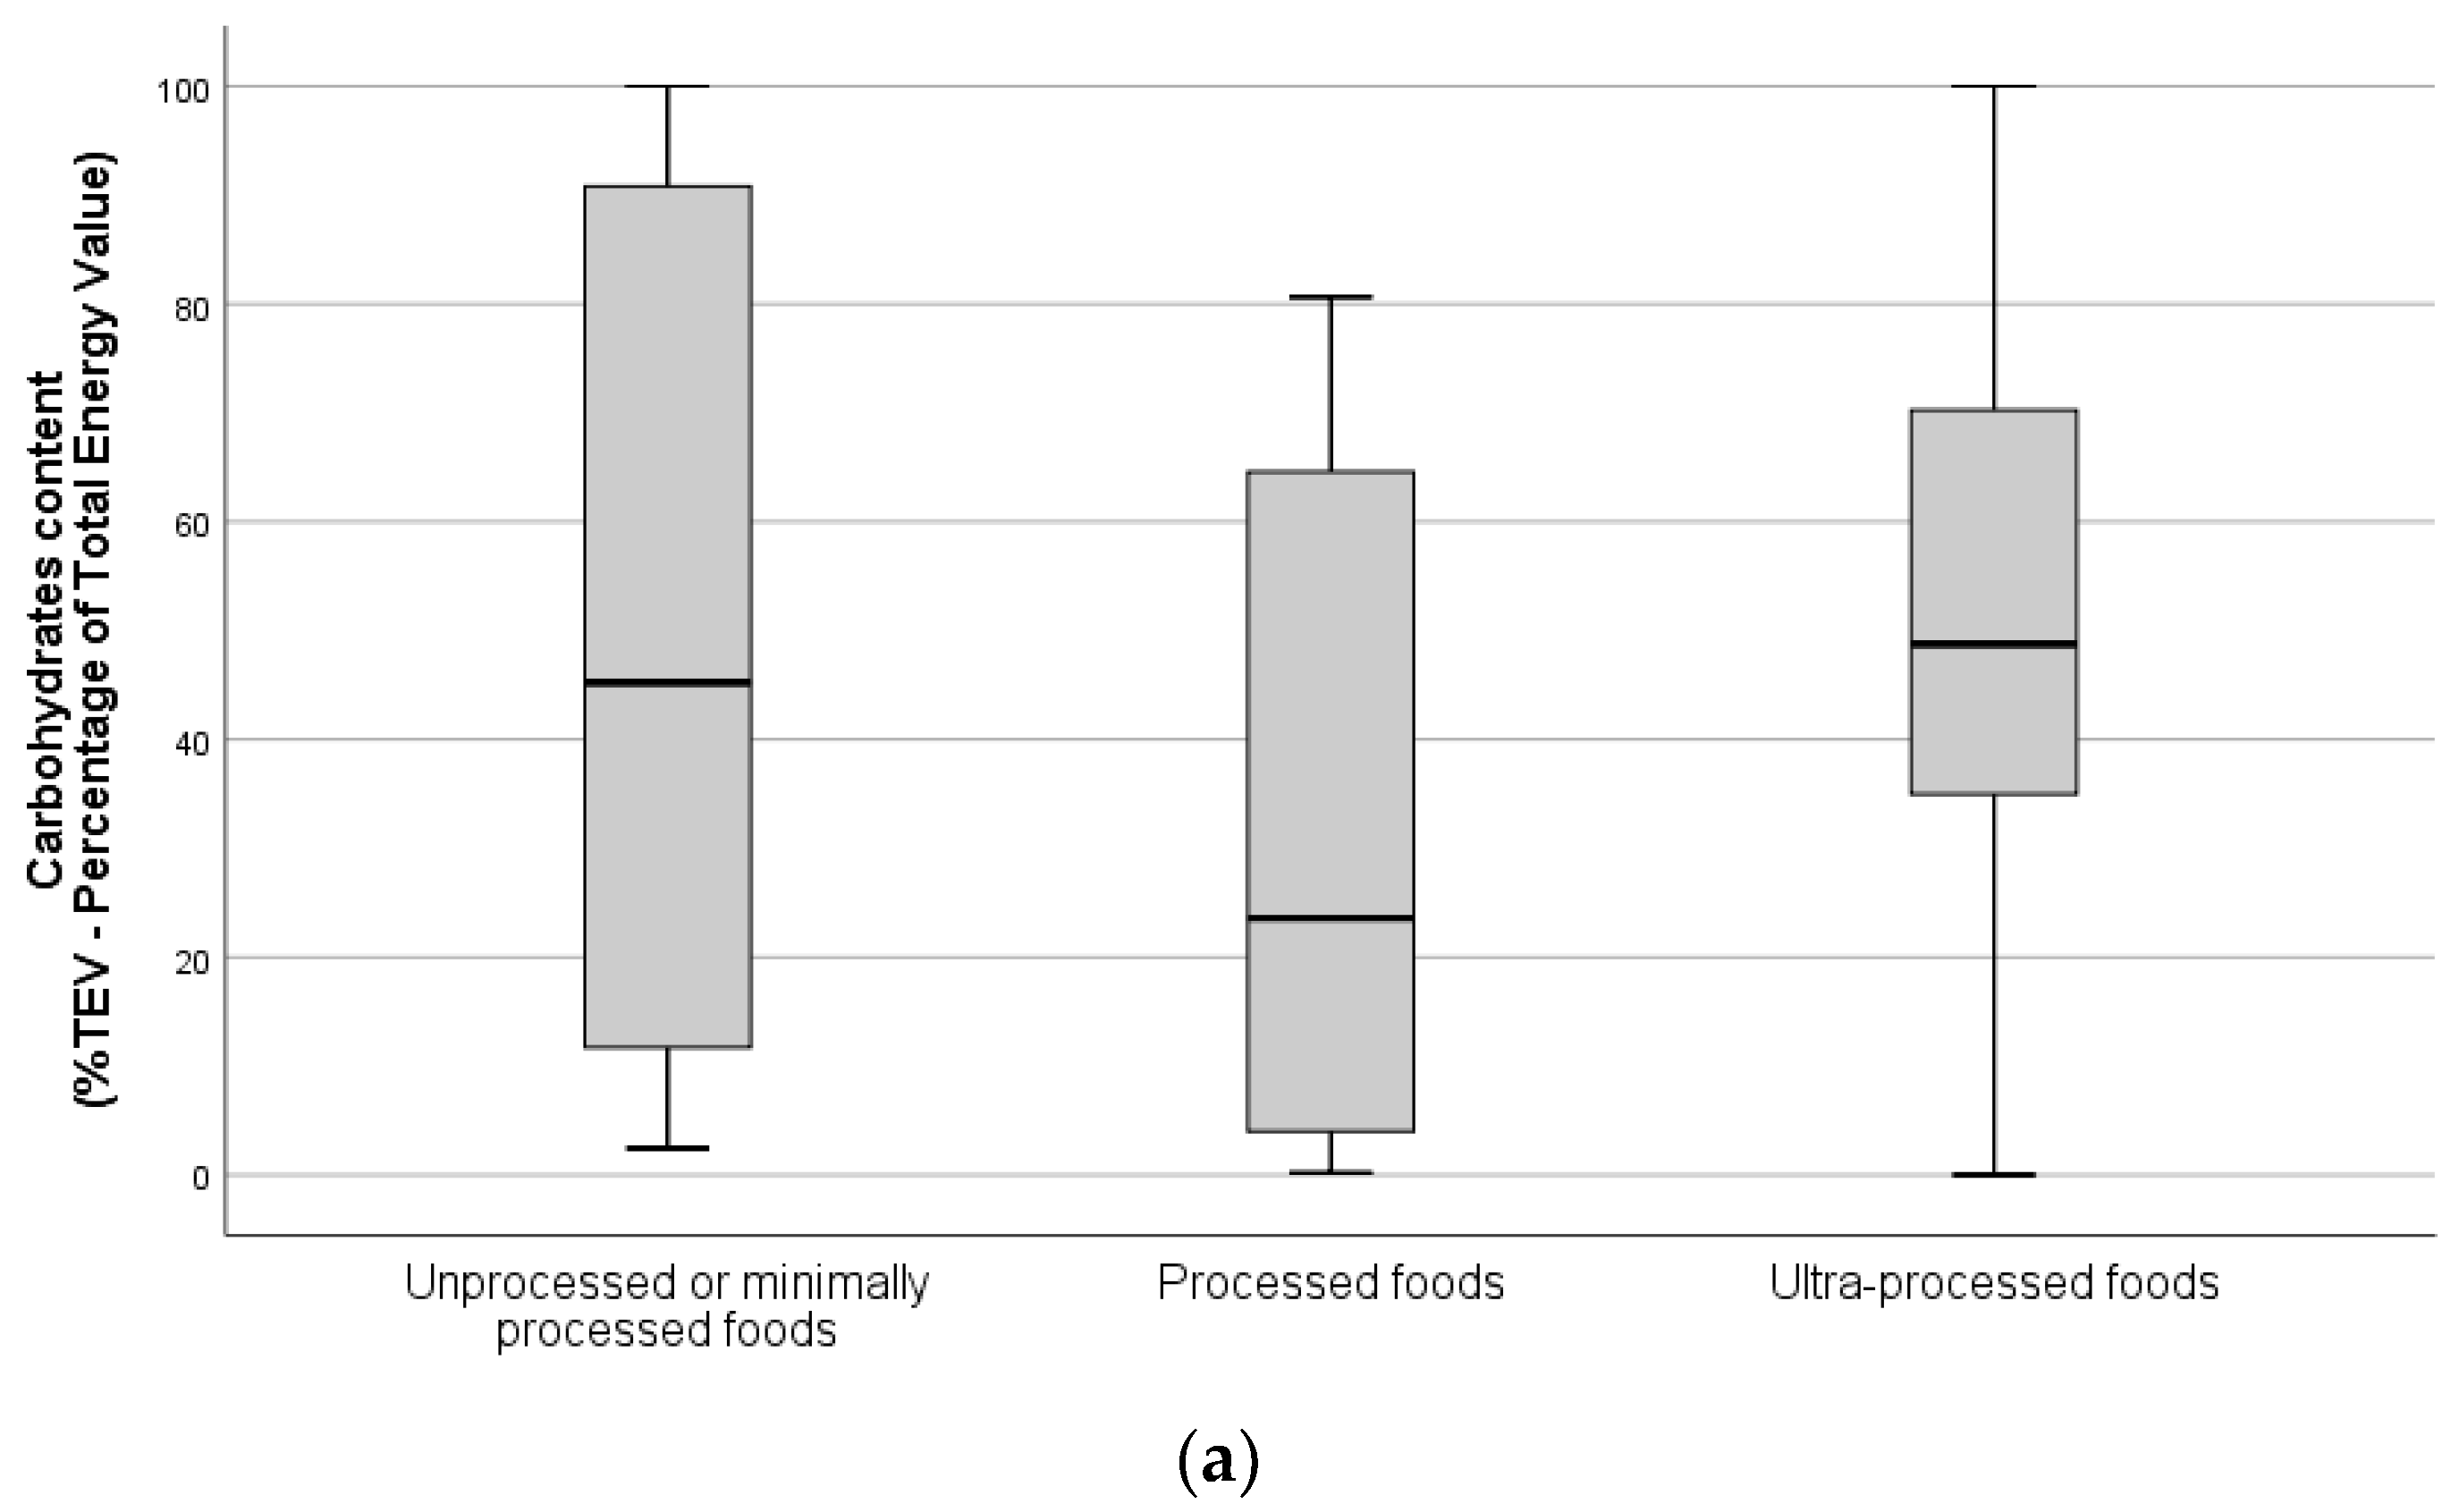
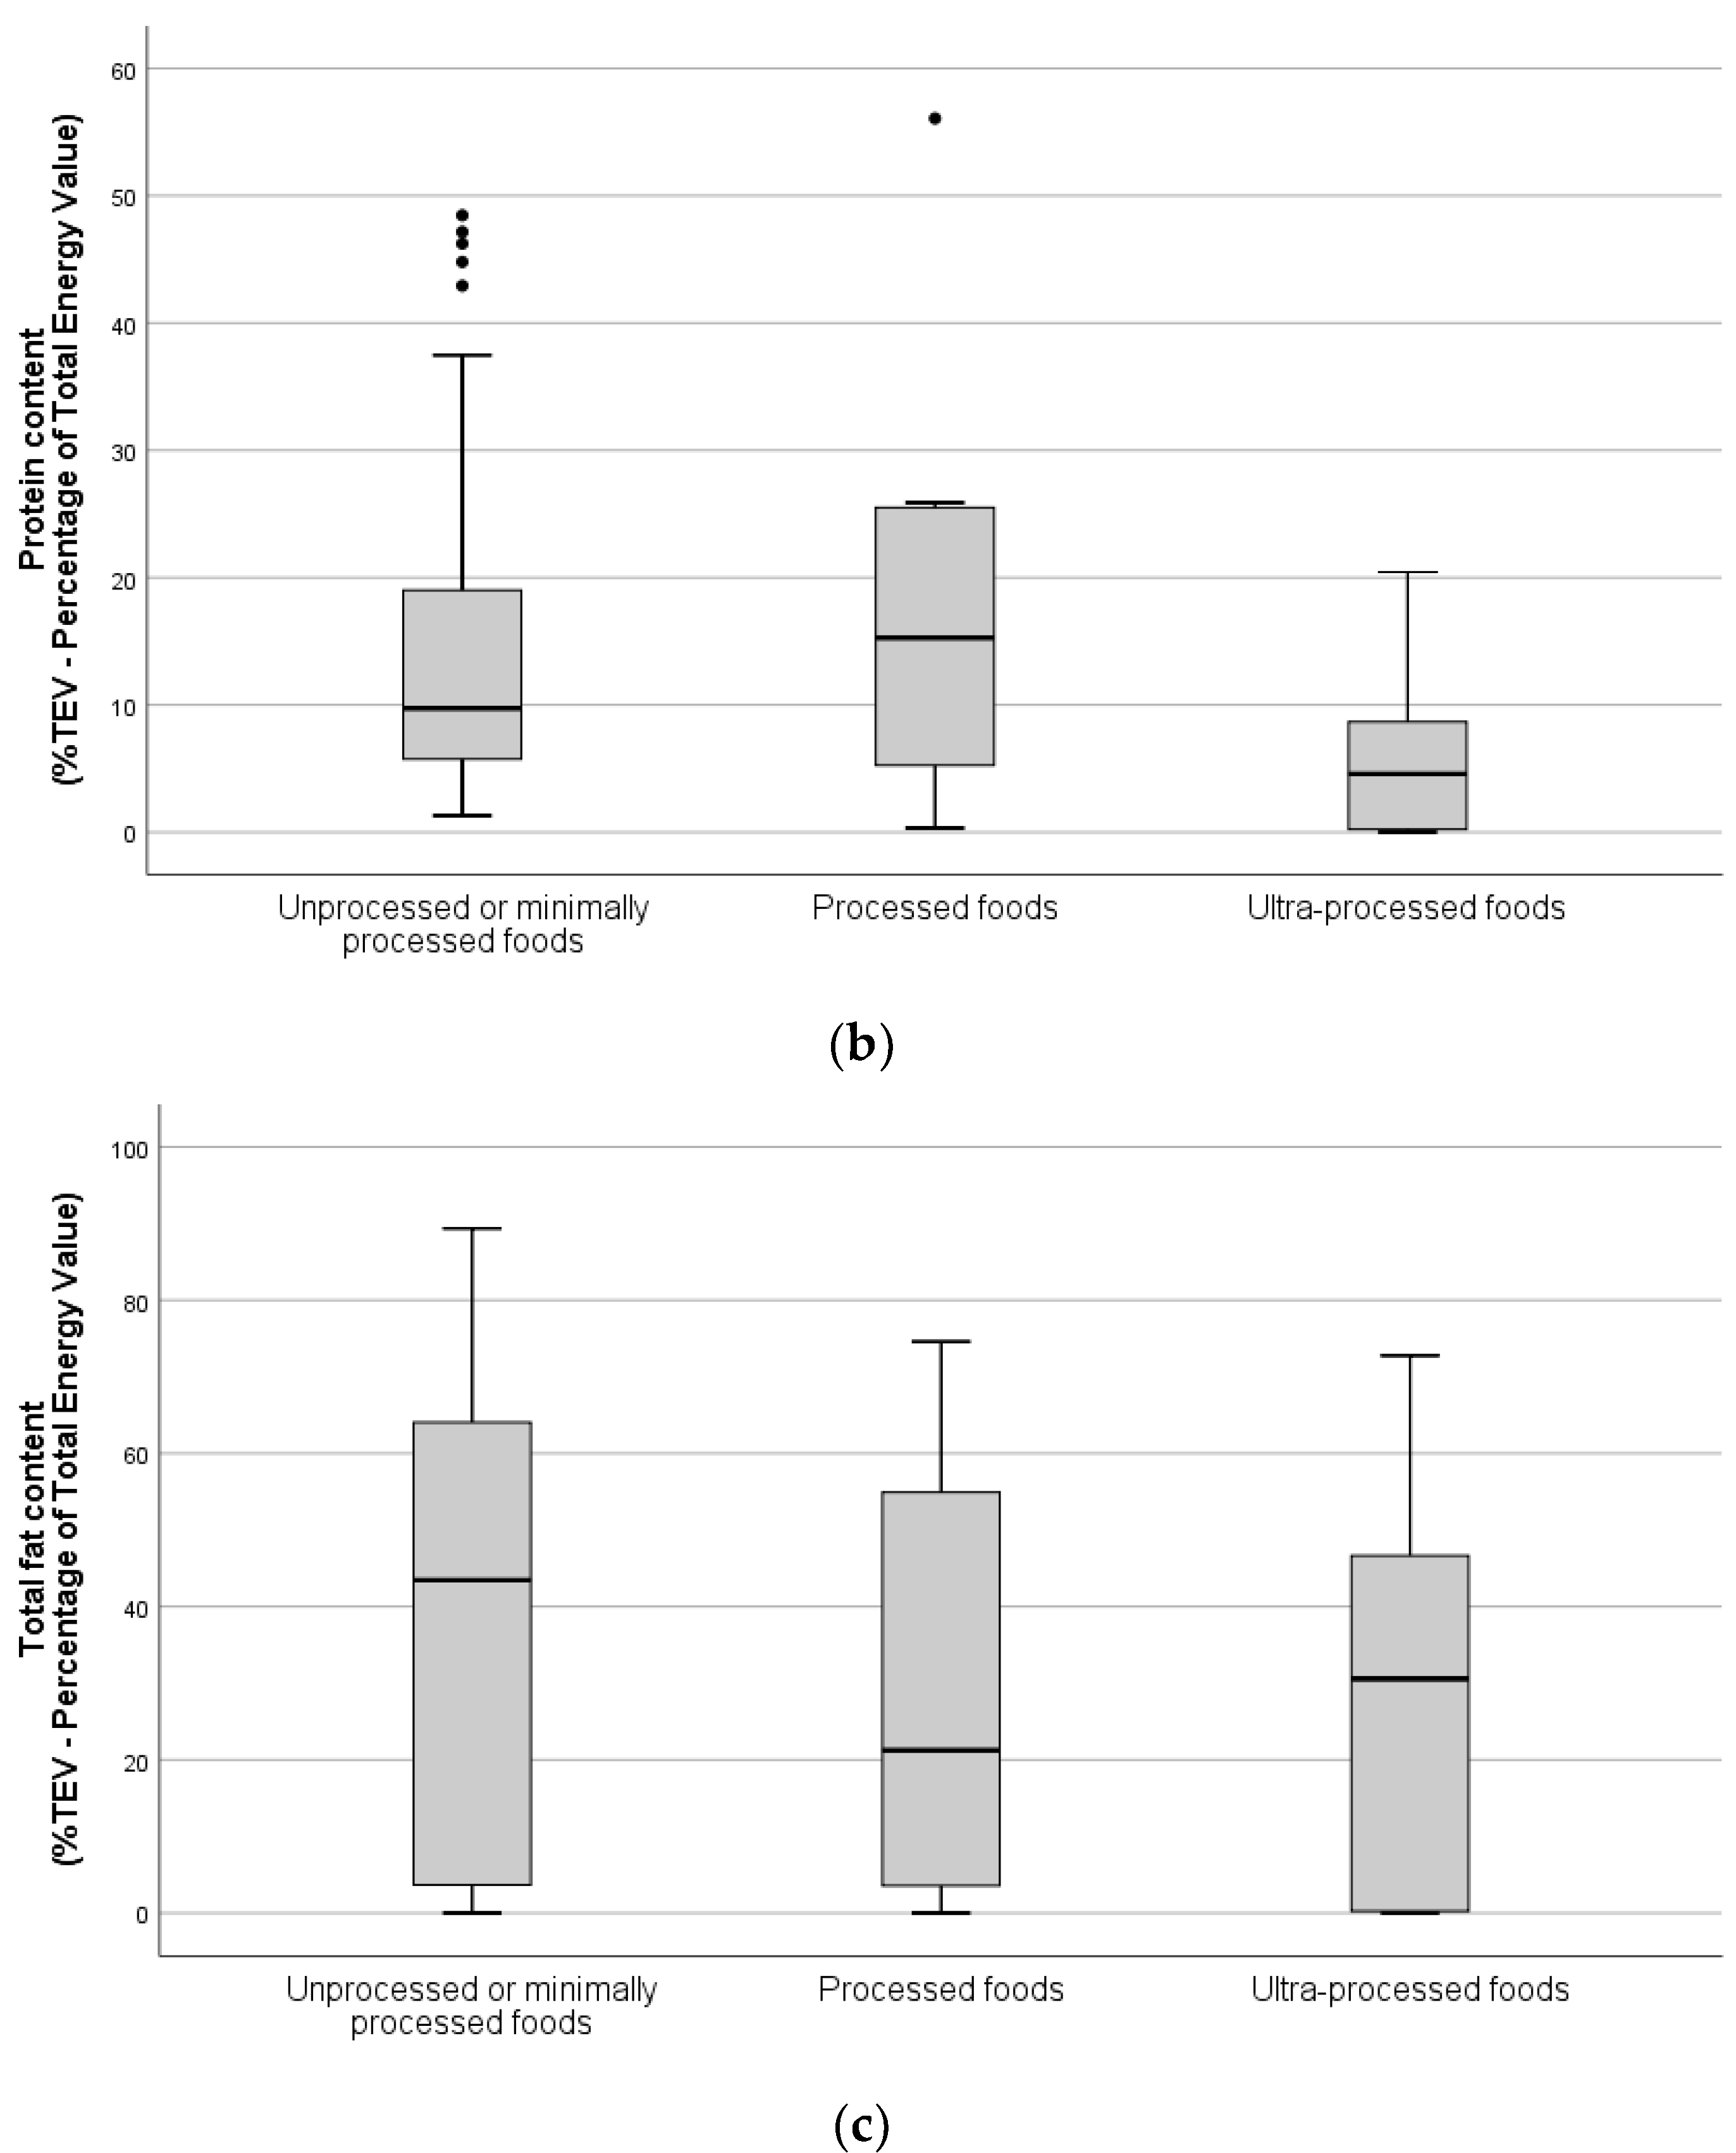
| Unprocessed or minimally processed foods (including culinary preparations using them as base) b | 73 | 212 (11–679) | 278 (0–1305) | 156 (0–589) | 49.5 (2.5–100) | 14.3 (1.3–48.5) | 36.0 (0.0–89.4) |
| Rice | 1 | 141 | 476 | 338 | 74.2 | 5.7 | 18.3 |
| Corn c | 4 | 248 (75–530) | 243 (111–341) | 176 (61–454) | 79.0 (64.5–90.7) | 7.5 (3.5–13.0) | 12.1 (2.6–31.4) |
| Wheat d | 5 | 108 (11–262) | 251 (49–427) | 319 (163–438) | 51.3 (38.7–69.8) | 8.1 (4.2–11.6) | 38.9 (18.3–55.7) |
| Beef e | 2 | 220 (169–271) | 394 (341–446) | 184 (165–203) | 5.7 (4.1–7.3) | 27.1 (24.8–29.4) | 66.8 (66.4–67.3) |
| Pork e | 2 | 226 (182–271) | 408 (360–455) | 183 (168–198) | 3.3 (2.5–4.1) | 32.0 (28.5–35.6) | 65.2 (62.7–67.8) |
| Poultry e | 4 | 429 (273–679) | 479 (438–511) | 127 (75–187) | 8.0 (2.6–12.8) | 39.3 (29.6–47.2) | 52.1 (38.7–65.6) |
| Goat e | 1 | 291 | 303 | 104 | 6.8 | 46.2 | 46.3 |
| Liver e | 1 | 217 | 359 | 165 | 7.5 | 33.2 | 58.7 |
| Fish/seafood f | 5 | 219 (59–528) | 251 (129–444) | 164 (78–265) | 14.8 (7.4–25.0) | 30.7 (11.6–48.5) | 53.6 (43.4–66.0) |
| Eggs e | 2 | 220 (56–383) | 279 (93–465) | 143 (121–164) | 7.2 (2.9–11.5) | 24.7 (19.4–30.0) | 67.9 (67.7–68.2) |
| Milk g | 3 | 228 (200–283) | 119 (62–170) | 51 (31–62) | 35.9 (30.3–46.9) | 19.1 (16.1–20.7) | 45.1 (36.6–49.4) |
| Beans h | 2 | 129 (29–229) | 238 (80–395) | 226 (173–280) | 17.9 (7.3–28.5) | 12.9 (2.3–23.5) | 67.5 (45.7–89.4) |
| Nuts i | 4 | 224 (38–657) | 556 (127–926) | 411 (141–589) | 20.1 (6.1–44.9) | 14.5 (9.4–18.6) | 64.5 (44.2–75.3) |
| Cassava j | 2 | 100 | 312 (153–471) | 312 (153–471) | 71.0 (45.3–96.7) | 5.8 (1.8–9.7) | 22.4 (1.2–43.5) |
| Vegetables (except leaves) k | 2 | 382 (124–641) | 111 (64–158) | 38 (25–51) | 40.3 (26.3–54.2) | 10.3 (8.4–12.2) | 45.6 (30.0–61.2) |
| Leaves l | 4 | 371 (300–438) | 977 (838–1306) | 263 (235–298) | 10.9 (8.5–12.4) | 13.3 (12.5–14.9) | 72.7 (69.9–76.1) |
| Potatoes | 2 | 289 (280–299) | 305 (218–392) | 105 (78–131) | 65.0 (49–81) | 7.2 (4.6–9.7) | 22.3 (1.2–43.4) |
| Fruit | 25 | 155 (60–500) | 128 (25–964) | 78 (13–375) | 83.8 (11.7–100.0) | 5.7 (1.3–12.0) | 12.4 (0.0–84.0) |
| Water and tea | 2 | 200 | 0 | 0 | - | - | - |
| Processed foods b | 8 | 85 (10–165) | 170 (21–386) | 237 (85–400) | 33.1 (0.2–80.6) | 18.6 (0.3–56.1) | 29.3 (0.0–74.6) |
| Sandwiches | 1 | 165 | 336 | 204 | 59.2 | 18.4 | 20.0 |
| Bread | 2 | 55 (10–100) | 147 (40–253) | 327 (253–400) | 75.3 (70.0–80.6) | 11.1 (10.0–12.1) | 14.8 (7.1–22.5) |
| Canned fish | 1 | 125 | 386 | 309 | 1.3 | 25.9 | 72.8 |
| Ham | 1 | 20 | 21 | 107 | 6.7 | 56.1 | 37.0 |
| Cheese | 1 | 10 | 37 | 374 | 0.2 | 25.1 | 74.6 |
| Fermented alcoholic beverages | 2 | 125 (100–150) | 142 (124–160) | 125 (85–165) | 23.6 (13.0–34.2) | 0.4 (0.3–0.5) | 0.0 (0.0) |
| Ultra-processed foods b | 27 | 151 (15–375) | 292 (1–873) | 281 (0–610) | 51.2 (0.0–100.0) | 6.8 (0.0–22.2) | 29.7 (0.0–72.8) |
| Bun | 1 | 50 | 171 | 341 | 63.3 | 11.7 | 23.8 |
| Fast food dishes m | 4 | 239 (158–375) | 546 (282–784) | 234 (179–298) | 33.6 (22.4–42.0) | 17.1 (14.0–19.9) | 47.2 (36.2–57.1) |
| Cakes and cookies | 3 | 110 (40–189) | 513 (177–873) | 466 (442–491) | 53.0 (46.9–62.5) | 5.3 (4.6–5.9) | 40.8 (30.6–47.9) |
| Fried snacks n | 2 | 100 (40–160) | 454 (72–836) | 351 (180–521) | 50.9 (40.6–61.1) | 3.9 (3.3–4.6) | 43.3 (32.5–54.1) |
| Confectionery o | 4 | 77 (43–100) | 326 (160–520) | 419 (236–527) | 57.4 (44.3–86.6) | 3.6 (1.2–5.5) | 38.8 (12.2–49.9) |
| Industrial popcorn | 1 | 100 | 522 | 522 | 48.3 | 4.3 | 44.8 |
| Sausages | 2 | 28 (15–40) | 93 (92–94) | 423 (235–610) | 7.1 (6.8–7.3) | 21.3 (20.4–22.2) | 68.1 (63.4–72.8) |
| Soft drinks | 4 | 245 (200–330) | 140 (113–198) | 61 (41–99) | 98.1 (94.5–100.0) | 0.1 (0.0–0.5) | 0.1 (0.0–0.5) |
| Sugar-free soft drinks | 2 | 290 (250–330) | 5 (1–10) | 2 (0–4) | 100.0 | 0.0 | 0.0 |
| Milk products p | 2 | 225 (200–250) | 151 (65–238) | 64 (33–95) | 70.3 (68.9–71.6) | 8.7 (8.5–8.8) | 21.0 (20.0–22.2) |
| Distilled alcoholic beverages | 2 | 40 | 103 (100–105) | 257 (250–263) | 0.1 (0.0–0.2) | 0.0 | 0.0 |
Publisher’s Note: MDPI stays neutral with regard to jurisdictional claims in published maps and institutional affiliations. |
© 2021 by the authors. Licensee MDPI, Basel, Switzerland. This article is an open access article distributed under the terms and conditions of the Creative Commons Attribution (CC BY) license (https://creativecommons.org/licenses/by/4.0/).
Share and Cite
Sousa, S.; Gelormini, M.; Damasceno, A.; Lopes, S.A.; Maló, S.; Chongole, C.; Muholove, P.; Moreira, P.; Lunet, N.; Padrão, P. Street Food in Maputo, Mozambique: The Coexistence of Minimally Processed and Ultra-Processed Foods in a Country under Nutrition Transition. Foods 2021, 10, 2561. https://doi.org/10.3390/foods10112561
Sousa S, Gelormini M, Damasceno A, Lopes SA, Maló S, Chongole C, Muholove P, Moreira P, Lunet N, Padrão P. Street Food in Maputo, Mozambique: The Coexistence of Minimally Processed and Ultra-Processed Foods in a Country under Nutrition Transition. Foods. 2021; 10(11):2561. https://doi.org/10.3390/foods10112561
Chicago/Turabian StyleSousa, Sofia, Marcello Gelormini, Albertino Damasceno, Simão A. Lopes, Sérgio Maló, Célia Chongole, Paulino Muholove, Pedro Moreira, Nuno Lunet, and Patrícia Padrão. 2021. "Street Food in Maputo, Mozambique: The Coexistence of Minimally Processed and Ultra-Processed Foods in a Country under Nutrition Transition" Foods 10, no. 11: 2561. https://doi.org/10.3390/foods10112561
APA StyleSousa, S., Gelormini, M., Damasceno, A., Lopes, S. A., Maló, S., Chongole, C., Muholove, P., Moreira, P., Lunet, N., & Padrão, P. (2021). Street Food in Maputo, Mozambique: The Coexistence of Minimally Processed and Ultra-Processed Foods in a Country under Nutrition Transition. Foods, 10(11), 2561. https://doi.org/10.3390/foods10112561