Article

Tracing the Geographical Origin of Thai Hom Mali Rice in Three Contiguous Provinces of Thailand Using Stable Isotopic and Elemental Markers Combined with Multivariate Analysis

by
Supalak Kongsri
1,
Phitchan Sricharoen
1,
Nunticha Limchoowong
2 and
Chunyapuk Kukusamude
1,*
1
Nuclear Technology Research and Development Center (NTRDC), Thailand Institute of Nuclear Technology (Public Organization), 9/9 Moo 7, Saimoon, Ongkharak, Nakhon Nayok 26120, Thailand
2
Department of Chemistry, Faculty of Science, Srinakharinwirot University, Sukhumvit 23, Wattana, Bangkok 10110, Thailand
*
Author to whom correspondence should be addressed.
Foods 2021, 10(10), 2349; https://doi.org/10.3390/foods10102349
Submission received: 6 August 2021 / Revised: 16 September 2021 / Accepted: 26 September 2021 / Published: 1 October 2021
(This article belongs to the Special Issue Food Origin Analysis with Isotope Fingerprints)

Abstract

:
Rice is a staple food for more than half of the world’s population. The discrimination of geographical origin of rice has emerged as an important issue to prevent mislabeling and adulteration problems and ensure food quality. Here, the discrimination of Thai Hom Mali rice (THMR), registered as a European Protected Geographical Indication (PGI), was demonstrated. Elemental compositions (Mn, Rb, Co, and Mo) and stable isotope (δ18O) in the rice were analyzed using inductively coupled plasma mass spectrometry (ICP-MS) and elemental analyzer isotope ratio mass spectrometry (EA-IRMS), respectively. The recoveries and precisions of all elements were greater than 98% and lower than 9%, respectively. The analytical precision (±standard deviation) was below ±0.2‰ for δ18O measurement. Mean of Mn, Rb, Co, Mo, and δ18O levels was 14.0 mg kg−1, 5.39 mg kg−1, 0.049 mg kg−1, 0.47 mg kg−1, and 25.22‰, respectively. Only five valuable markers combined with radar plots and multivariate analysis, linear discriminant analysis (LDA) could distinguish THMR cultivated from three contiguous provinces with correct classification and cross-validation of 96.4% and 92.9%, respectively. These results offer valuable insight for the sustainable management and regulation of improper labeling regarding geographical origin of rice in Thailand and other countries.

1. Introduction

Rice is a major component of calories [1] and carbohydrates [2] for human beings. It is also a main source of vitamins and minerals [3]. Therefore, rice is an important staple food for more than 50% of the world’s population [2,3,4] especially American, European, and Asian [5]. About 90% of rice is produced in Asia. The top six largest rice-producing countries are China, India, Indonesia, Bangladesh, Vietnam, and Thailand [6]. Thailand exported 5.72 million tonnes of rice in 2020 with an export value of 115.9 billion baht (3.7 billion US dollars).
Thai Hom Mali rice (THMR) is also known worldwide and was recorded under the European Protected Geographical Indication (PGI) scheme in 2013 [7]. THMR cultivated in the center of Northeastern Thailand is annually grown and can be harvested only once a year during the months of October to November [8]. The climate condition combined with minerals in soil cause tension to the rice making it produce an aromatic substance, 2-acetyl-1-pyrroline [9]. It has a long grain with moist, silky smooth, soft texture, and sweet-scented aroma after cooking. THMR cultivated in the Thung Kula Rong-Hai area is recognized as premium quality rice. Therefore, THMR has been adulterated with lower-grade rice from other areas in order to increase profits. Furthermore, mislabeled rice is at higher risk of food safety issues such as harmful unspecified rice additives and contaminants. Food fraud has become enlarged to a global scale because of increasing demand in food [10]. Thus, it is important to protect rice consumers from commercial fraud. These concerns directly impact global consumers, exporters, and countries. In this regard, authenticity and traceability measurements have become important issues in food testing.
Genetic and environmental factors (weather), crop management, season, and soil composition affect the elemental and isotopic characteristics in rice [11,12]. Moreover, the oxygen isotope in rice originates from local groundwater, meltwater, and precipitation [13]. Enriched δ18O in rice is expected in growing regions with relatively low humidity and a high transpiration rate [12]. However, the topography and climate conditions must be considered. Contaminated soil and water in rice manufacturing are the main elemental sources that can be taken up by plant roots. Therefore, rice has unique elemental profiles reflecting the geochemistry of the soil origin [14]. The determination of rice’s geographical origin can be performed using a combination of chemometric approaches with several reliable analytical techniques such as instrumental neutron activation analysis (INAA) [2,15,16], isotope ratio mass spectrometry (IRMS) [13,17,18,19,20], inductively coupled plasma optical emission spectrometry (ICP-OES) [21,22,23,24,25], inductively coupled plasma mass spectrometry (ICP-MS) [1,23,24,26,27,28,29], LA-ICP-MS [30], and high resolution inductively coupled plasma mass spectrometry (HR-ICP-MS) [5,25,31]. However, the combination of multi-elemental and isotopic techniques with chemometric approaches has been developed for tracing the geographical origin of foodstuffs [32]. The applications of isotopic and elemental approaches have been also reported for the discrimination of the geographical origin of rice [2,12,13,33,34,35]. Nine variables (δ13C, δ18O, B, Mg, Se, Rb, Gd, Ho, and W) combined with canonical discriminant analysis were used to determine the geographical origin of rice from India, Pakistan, Europe (France, Italy, and Spain), and USA [12]. Stable isotope compositions δ13C, δ15N, δ18O, C, and N with radar plots were used to discriminate the polished rice from Australia, Japan, and USA [13]. Geographical authentication for rice collected from six Asian countries was discriminated by δ13C, δ15N, δ18O, and δ34S and 25 elements (Mg, K, Ca, B, Mn, Fe, Cu, Zn, Mo, Be, Na, Al, Ti, V, Cr, Co, Ni, As, Se, Sr, Ag, Cd, Ba, Tl, and Pb) combined with principal component analysis (PCA) and orthogonal projection to latent structure-discriminant analysis [33]. Seven stable isotope ratios (δ13C, δ15N, δ2H, δ18O, 87/86Sr, 207/206Pb, and 208/207Pb) and 25 elements (Li, Be, V, Cr, Co, Ni, Cu, Rb, Sr, Mo, Ag, Cd, Sn, Pb, Al, Ti, Mn, Fe, Zn, Sb, Ba, Bi, Na, Mg, and Ca) combined with PCA and linear discriminant analysis (LDA) were established to differentiate polished rice from different growing regions in China with rice imported from Southeast Asia (Thailand and Malaysia) [35].
Thus, the objective of the study was to investigate the isotopic and elemental markers for tracing the geographical origins of THMR cultivated in three contiguous provinces in Thailand. The three provinces include Yasothon province (YP), Roi Et province (RP), and Surin province (SP). Isotopic and elemental markers in THMR were analyzed using ICP-MS and EA-IRMS. In this study, the obtained results from ICP-MS and EA-IRMS were analyzed by radar plots and multivariate analysis, LDA. Discrimination power for candidate markers was also evaluated. The work hereafter demonstrates the feasibility study of using elemental and isotopic compositions to determine the geographical origins of THMR cultivated in three contiguous provinces in Thailand, which is one of the most predominant rice consumption, exporter, and production country. Hence, these results could be potentially used for sustainable management and regulation of proper labeling in the geographical origin of rice in Thailand and other countries.

2. Materials and Methods

2.1. Sample Preparation of THMR

Twenty-eight THMR samples were cultivated from three provinces including YP (n = 7), RP (n = 16), and SP (n = 5). A map of the sampling provinces is shown in Figure 1. Before the polished rice samples were pulverized by Perten Laboratory mill 3100 (Perten Instruments, Huddinge, Sweden), all rice samples were air-dried. The fine powder of the rice sample was then further dried in oven at 60 °C until dry. All analytical techniques were performed at Thailand Institute of Nuclear Technology (Public Organization).

2.2. Chemicals and Reference Materials

Ultrapur HNO3 and suprapur H2O2 were obtained from Merck (Darmstadt, Germany). Calibration standards were diluted in 2% (v/v) HNO3. Calibration standard, internal standard solution, tuning solution (Agilent Technologies, Santa Monica, CA, USA) and rice flour SRM 1568b (NIST, Gaithersburg, MD, USA) were used for ICP-MS analysis. EA-IRMS measurement was performed using international reference materials including USGS35 (USGS, Reston, VA, USA), IAEA-CO-8, IAEA-601, and IAEA-602 (IAEA, Vienna, Austria) with δ18O values of +57.5 ± 0.3‰, −22.7 ± 0.2‰, +23.14 ± 0.19‰, and +71.28 ± 0.36‰, respectively.

2.3. ICP-MS

THMR was digested by microwave digestion prior to Agilent 7900 ICP-MS analysis. Fine powder of rice (800 mg) was weighted into a vessel. Concentrated HNO3 (9 mL) and H2O2 (1 mL) were added. Then, the closed vessel was digested using MARS 6 (CEM). Microwave digestion was set at 160 °C and held for half an hour. Afterward, the solution was dried and redissolved in 2% (v/v) HNO3 (10 mL). Conditions of ICP-MS are described in Supplementary Table S1.

2.4. Stable Oxygen (O) Isotope by EA-IRMS in Pyrolyzer Mode

The stable O isotope in THMR was determined using an Elementar Vario PYRO cube elemental analyzer interfaced to an Isoprime 100 IRMS system (EA-IRMS, Isoprime Ltd., Manchester, UK). The stable isotope of O was determined in terms of isotope ratios (δ18O). The powdered rice samples kept in the desiccator were accurately weighed into 4 × 4 × 11 mm silver boats (0.3 mg). The samples in the enclosed capsules were thermally decomposed to CO gas in a glassy carbon reactor filled with glassy carbon granules, carbon black, and graphite felt at 1450 °C. The carrier gas flow transfers the gaseous pyrolysis products into the adsorption tube where acid and alkaline pyrolysis products were absorbed chemically. The CO gas was isolated from natural gaseous component (N2 gas) by an adsorption column and then the CO gas was subjected to the IRMS system. The values (‰) were denoted in delta against the international reference standard (Vienna Standard Mean Ocean Water, VSMOW) for δ18O, according to the following general Equation (1) [2,33]:
δ 18 O   ( ) = ( ( R s a m p l e R s t a n d a r d ) / R s t a n d a r d ) × 1000
where Rsample and Rstandard are the stable isotope ratio (18O/16O) of the sample and the international reference standard (VSMOW), respectively. Two-point linearity correction was performed for the measurement. In this study, the analytical precision (±standard deviation) for δ18O measurements was below ±0.2‰ on the basis of the reference materials.

2.5. Multivariate Analysis

The multivariate analysis of the results obtained by ICP-MS and EA-IRMS was analyzed using IBM SPSS statistics version 23. Significance was detected at the level of p-value less than 0.05 using ANOVA and Kruskal–Wallis test. Normally distributed data were treated with ANOVA using Tukey HSD and Games–Howell post hoc test, while Kruskal–Wallis was used for non-normal distribution with Dun–Bonferroni post hoc.
To determine the factors for differentiating the geographical origins of THMR, LDA was conducted in this study. The transformed data were subsequently subjected to LDA. LDA was combined with elemental compositions (Mn, Rb, Co, and Mo) and stable isotope (δ18O) obtained from 3 contiguous provinces.

3. Results and Discussion

3.1. Stable Isotope and Selected Elemental Analyses in THMR

3.1.1. δ18O Analysis

The 18O value was used as an effective marker for the determination of geographical origin because of different physical, biological, and chemical processes from different environments leading to isotopic fractionation. The δ18O values in agricultural products are correlated to geological structures, irrigation, geography and climate, distance from coast, precipitation, etc. [12,33]. The δ18O values were determined using EA-IRMS set in pyrolyzer mode. The mean δ18O value (25.22‰) in the studied THMR samples was slightly lower than that in Indica rice (+25.8‰) [4], while it was 1.14-fold higher than that in Indica rice (+22.15‰) [33]. However, the mean δ18O value was similar to those in polished rice and jasmine rice in the previous studies [2,20]. The order of δ18O values of rice in several countries was Spain (+28.4‰) > USA (+26.3‰) [12] > Thailand, in this study (+25.22‰) > France (+25.1‰) > Italy (+24.5‰) [12] ≥ Vietnam (+24.5‰) [20] > Pakistan (+23.3‰) [12] > USA (+22.9‰) [13] > India (+22.1‰) [12] > Japan (+21.3‰) [20] > Australia (+20.3‰) [13] > Japan (+19.7‰) [13]. In this study, the geographical δ18O variations in THMR in YP, RP, and SP are summarized in Table 1. δ18O in THMR grown in YP, RP, and SP was in the ranges of +24.69‰ to +26.00‰, +24.32‰ to +26.67‰, and +23.65‰ to +24.71‰, respectively, with relative standard deviation (RSD) of 0.018, 0.03, and 0.018%, correspondingly.
Figure 2 shows the variations of δ18O values in THMR of interest according to the geographical origins. Mean δ18O values in THMR cultivated in YP, RP, and SP were +25.48‰, +25.42‰, and +24.20‰, respectively. The mean δ18O values in THMR varied significantly with the province of origin (p = 0.001). The result of the Tukey HSD post-hoc test was explained in Table 1. Different letters (a, b) show significant differences in the mean of δ18O values of each province examined in this study based on a Tukey HSD test at 0.05 probability. The mean δ18O values in THMR between SP and YP and SP and RP were significantly different with a p-value of 0.003 and 0.002, respectively, probably due to different rainfall, precipitation, and temperature over each region. This indicates that δ18O was a good indicator for identification of geographical origin of THMR cultivated from SP. However, using only one parameter, δ18O showed weak discriminatory power for identification of geographical origins of THMR (data not shown). Therefore, some elements were studied in order to increase discriminatory power to discriminate of geographical origin of THMR grown in three contiguous provinces.

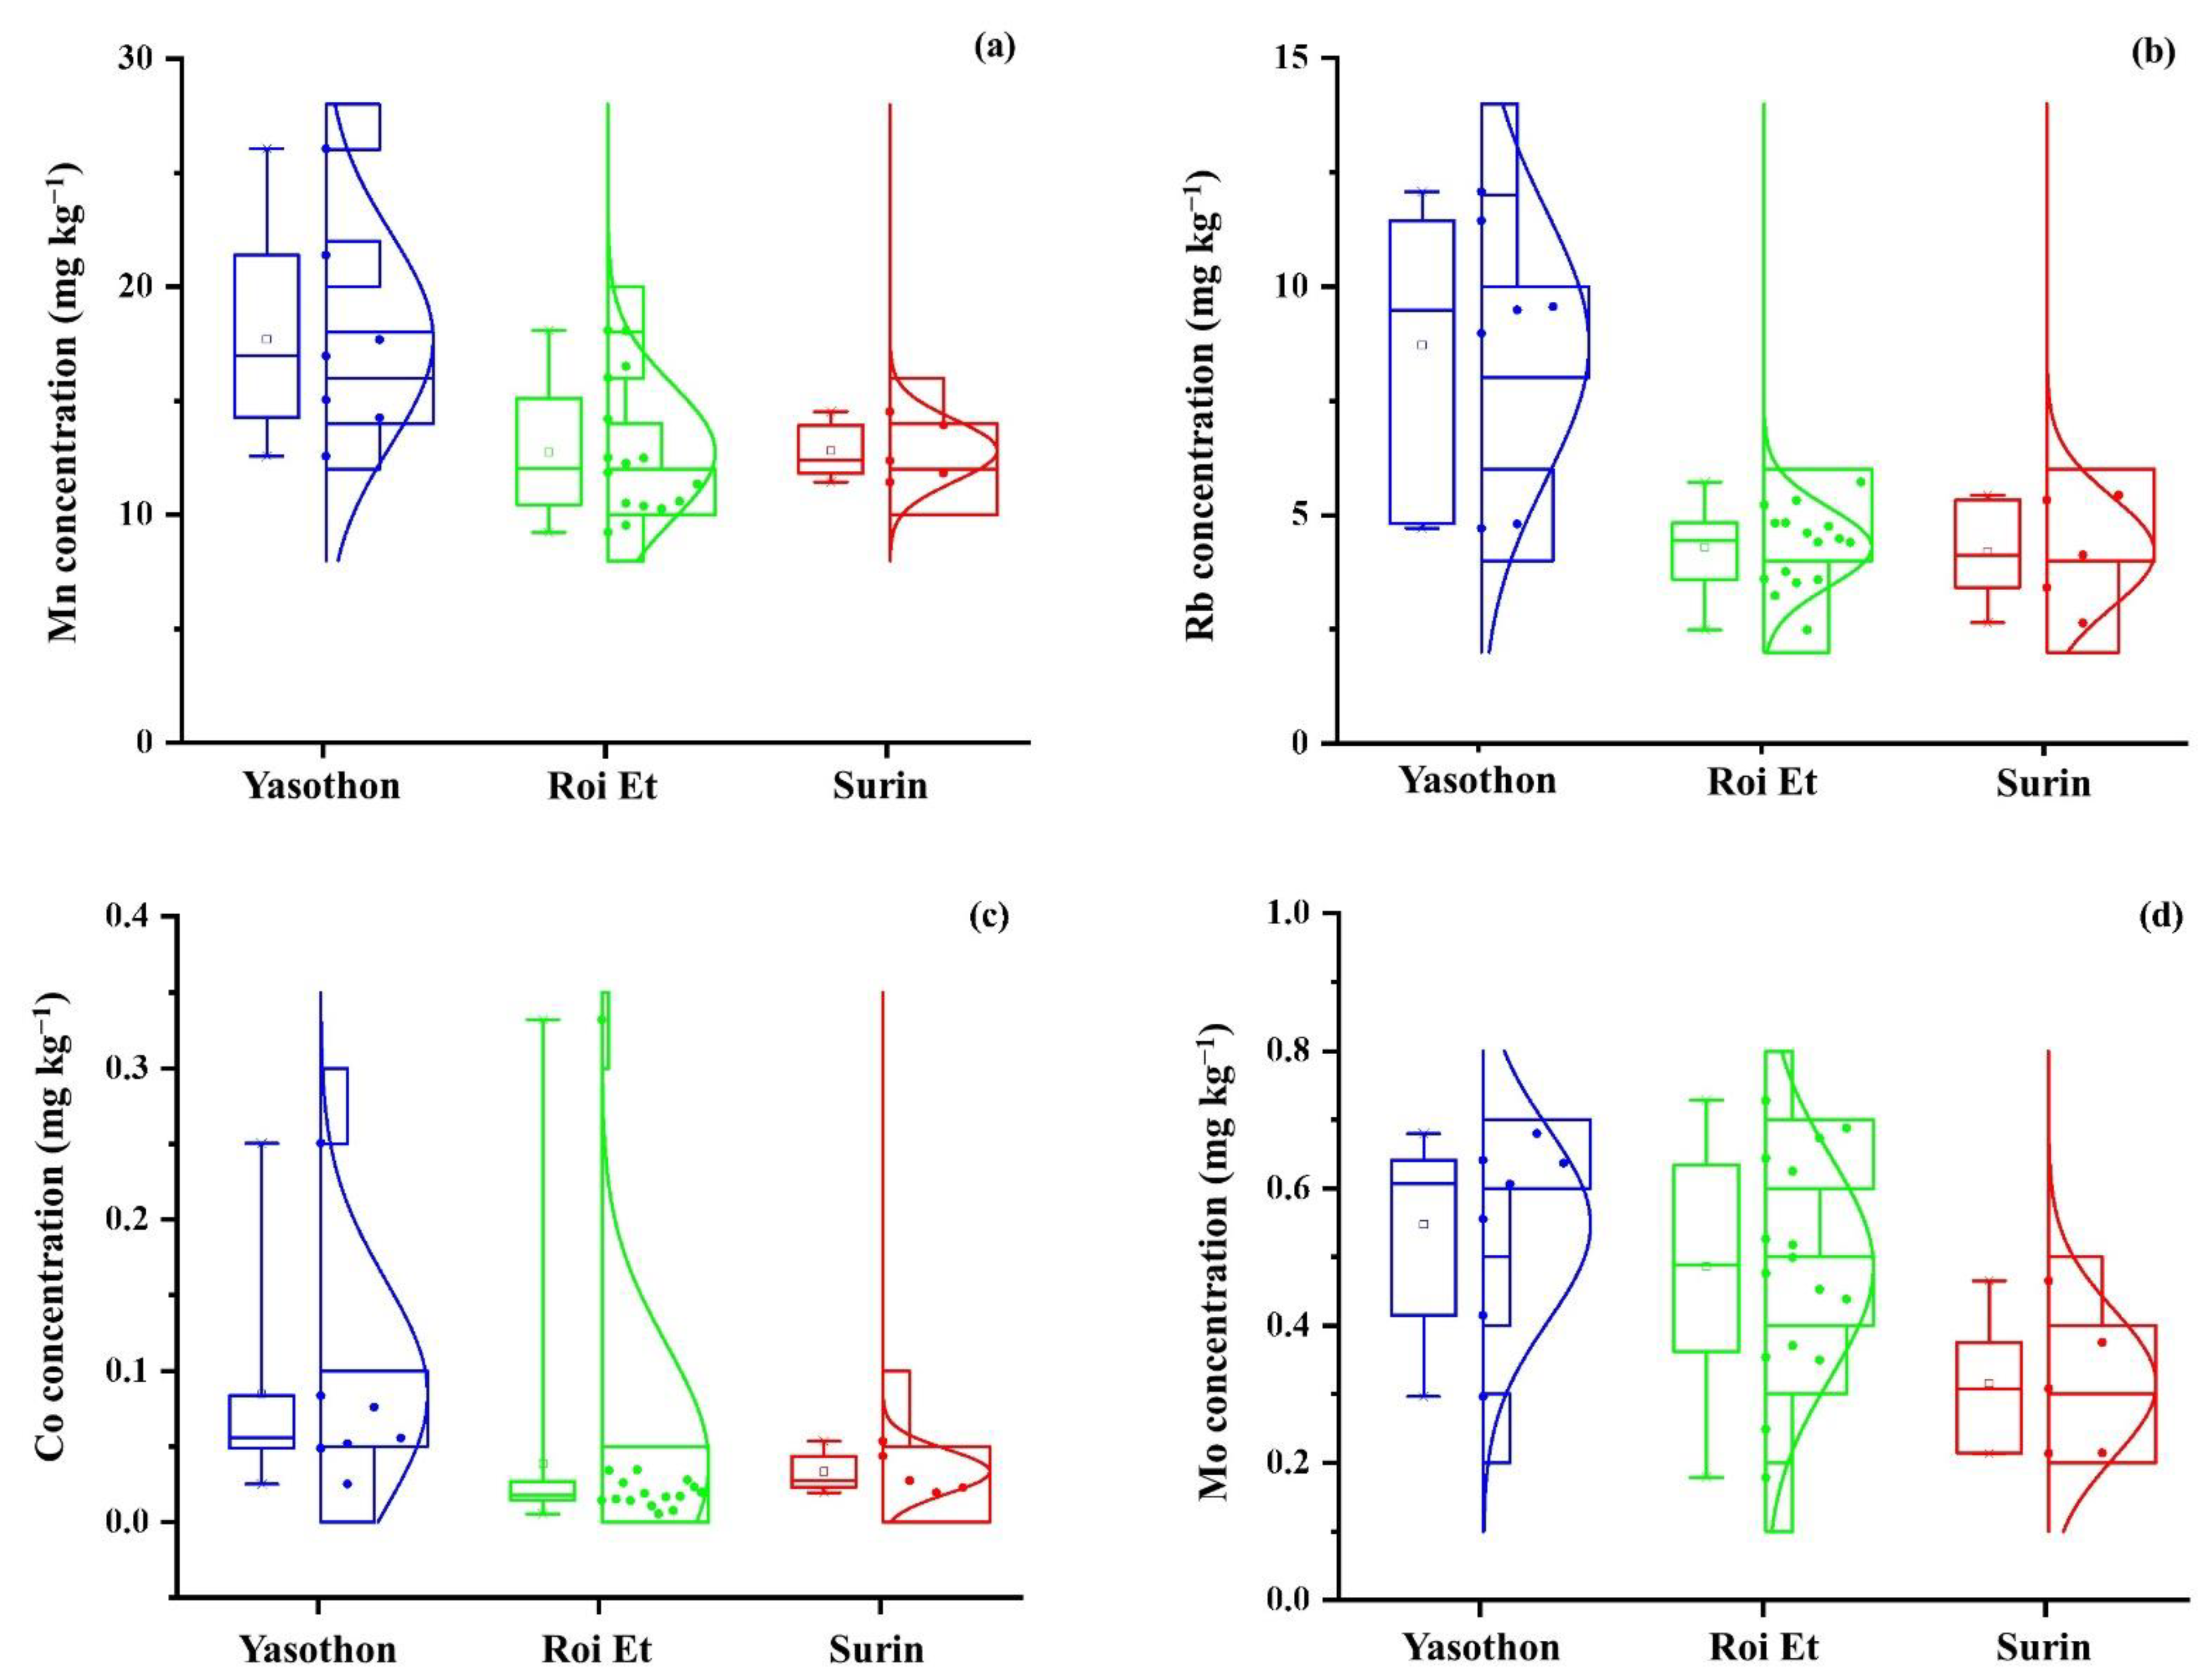
3.1.2. Elemental Analysis

Validation of the method followed the Eurachem Guide [36]. Method validation for the analysis of Mn, Co, Rb, and Mo in Thai Hom Mali rice by ICP-MS are illustrated in Supplementary Table S2. The evaluation of linearity was done using four to six levels of standard solution. Good linearity for the selected metals was greater than 0.9990. Limits of quantification (LOQs) and limits of detection (LODs) ranged from 0.83 to 12.4 μg kg−1 and 0.29 to 11.8 μg kg−1, respectively. Accuracy of the method was assessed by evaluating the matrix-matched certified reference material (SRM 1568b). The recovery of the elements was higher than 98%. Precisions were <9%.
The use of multi-element analysis for the determination of the geographical origin of rice has been studied [2,12,23,25,37]. Regarding the authentication of geographical origin of rice, mineral or elemental profiling has been used. The mineral occurrence in food correlates with the soil type and environmental growing conditions.
In this study, metals including Mn, Rb, Co, and Mo in 28 samples of THMR collected in three different provinces were determined using ICP-MS. Concentrations of four elements in THMR by ICP-MS are illustrated by box-and-whisker plots in Figure 3. Mn (Figure 3a), Rb (Figure 3b), Co (Figure 3c), and Mo (Figure 3d) concentrations in THMR were found in the ranges of 9.23–26.05, 2.49–12.07, 0.006–0.33, and 0.18–0.73 mg kg−1, respectively. Mean ± S.D. of Mn, Rb, Co, and Mo concentrations in THMR samples was 14.00 ± 3.8, 5.39 ± 2.5, 0.049 ± 0.07, and 0.47 ± 0.2 mg kg−1, correspondingly. The mean Mn level in this study was about 1.6–4 folds higher than those in Thai Indica rice, Thai jasmine white rice, and white rice samples from northern Thailand published in the previous studies [5,30,33]. The mean concentration of Rb was around 1.2–1.8 times higher than those in Thai jasmine white rice and white rice samples in the previous studies [5,30]. In this study, the mean Co level in THMR was 1.3–1.7 times higher than those levels, while the mean Mo level was almost similar to those levels in the previous studies [5,30]. The order of Mn levels in rice from several countries was Brazil (60 mg kg−1) [22] > Philippines (23.83 mg kg−1) > Cambodia (18.07 mg kg−1) [33] > Malaysia (16.61 mg kg−1) [16] > China (16.55 mg kg−1) [33] > Thailand, in this study (14.00 mg kg−1) ≥ Japan (14 mg kg−1) > Spain (13 mg kg−1) > India (11 mg kg−1) [22] > Korea (10.70 mg kg−1) [33] > Pakistan (9.10 mg kg−1) > Italy (7.75 mg kg−1) > India (6.99 mg kg−1) > Japan (6.71 mg kg−1) > France (5.41 mg kg−1). Rb levels in rice from several countries were in the order of Malaysia (13.06 mg kg−1) [16] > Thailand, in this study (5.39 mg kg−1) > France (3.12 mg kg−1) > Pakistan (2.46 mg kg−1) > USA (1.99 mg kg−1) > India (1.80 mg kg−1) [12] > India (1.67 mg kg−1) > Pakistan (1.23 mg kg−1) [5] > Italy (1.22 mg kg−1) > Spain (0.92 mg kg−1) [12] > France (0.67 mg kg−1) > Italy (0.41 mg kg−1) > Japan (0.18 mg kg−1) [5]. The order of Co levels in rice from several countries was Thailand, in this study (0.049 mg kg−1) > Cambodia (0.037 mg kg−1) > Philippines (0.032 mg kg−1) [33] > India (0.007 mg kg−1) > Italy (0.006 mg kg−1) ≥ Pakistan (0.006 mg kg−1) [5] ≥ Japan (0.006 mg kg−1) [33] > USA (0.0044 mg kg−1) [31] > Japan (0.004 mg kg−1) [5] ≥ China (0.004 mg kg−1) > Korea (0.003 mg kg−1) [33] > France (0.002 mg kg−1) [5]. Mo levels in rice from several countries were in the order of India (1.38 mg kg−1) > Pakistan (1.22 mg kg−1) > Italy (0.98 mg kg−1) > Japan (0.79 mg kg−1) [5] > India (0.7 mg kg−1) [22] > Japan (0.632 mg kg−1) > Philippines (0.594 mg kg−1) [33] > France (0.5 mg kg−1) [5] > Thailand, in this study (0.47 mg kg−1) > Brazil (0.4 mg kg−1) [22] > China (0.3 mg kg−1) > Cambodia (0.27 mg kg−1) > Korea (0.232 mg kg−1) [33] > Japan (0.2 mg kg−1) [22].
Mn concentrations in THMR cultivated in YP, RP, and SP were in ranges of 12.57–26.05 mg kg−1, 9.23–18.08 mg kg−1, and 11.43–14.53 mg kg−1, respectively. The mean Mn concentrations were 17.71, 12.74, and 12.82 mg kg−1 in THMR cultivated in YP, RP, and SP, respectively, as summarized in Table 1. Significant differences in Mn concentrations in THMR cultivated in three different provinces using Kruskal–Wallis test were obtained with the p-value of 0.017. Based on the Dun–Bonferroni, there were statistically significant differences in Mn concentrations in THMR cultivated in YP and RP. There was no significant difference in Mn concentration found in THMR between YP and SP (p = 0.157) and between RP and SP (p = 1.000).
Rb concentrations in THMR cultivated in YP, RP, and SP were in ranges of 4.71–12.07 mg kg−1, 2.49–5.72 mg kg−1, and 2.64–5.44 mg kg−1, respectively. In Table 1, mean Rb concentrations were 8.72, 4.30, 4.19 mg kg−1 in THMR cultivated in YP, RP, and SP, respectively. Significant differences (p < 0.001) in Rb concentrations in THMR cultivated in three different provinces were observed using ANOVA. The Games–Howell post-hoc test showed that mean Rb concentrations in THMR cultivated from YP were significantly different from other origins (RP and SP). There was no significant difference in Rb concentration obtained in THMR between RP and SP at 95% confidence interval.
As summarized in Table 1, the mean concentrations of Co in THMR cultivated in YP, RP, and SP were 0.085, 0.039, and 0.033 mg kg−1, respectively. Co concentrations in THMR cultivated in YP, RP, and SP were in ranges of 0.025–0.25 mg kg−1, 0.0055–0.33 mg kg−1, and 0.020–0.054 mg kg−1, respectively. Significant differences in Co concentrations in THMR cultivated from 3 different provinces using Kruskal–Wallis test were obtained with the p-value of 0.004. Based on the Dun–Bonferroni, there were statistically significant differences in Co concentrations in THMR cultivated in YP and RP. There was no significant difference in Co concentration in THMR between YP and SP (p = 0.529) and between RP and SP (p = 0.501).
Concentrations of Mo in THMR cultivated in YP, RP, and SP were in ranges of 0.30–0.68 mg kg−1, 0.18–0.73 mg kg−1, and 0.21–0.47 mg kg−1, respectively. As summarized in Table 1, mean Mo concentrations were 0.55, 0.49, 0.32 mg kg−1 in THMR cultivated in YP, RP, and SP, respectively. Significant differences in Mo concentrations in THMR cultivated in three different provinces were obtained with the p-value of 0.038 using ANOVA. Based on the Tukey HSD, there were significant differences in Mo concentrations in THMR cultivated in YP and SP with p-value of 0.034. There was no significant difference in Mo concentration in THMR between YP and RP (p = 0.636) and between RP and SP (p = 0.084) at 95% confidence interval.

3.2. Radar Plot Analysis

A simple and rapid way to distinguish the geographical origin of rice samples based on elemental and isotopic composition has been used [2,5,13]. To simplify the comparison and discrimination according the geographical variation, the significant difference parameters (Mn, Rb, Co, Mo, and δ18O) were used for radar plot. The radar plots of Mn, Rb, Co, Mo, and δ18O variables summarized as relative concentration of five variables are shown in Figure 4.
Figure 4 shows the isotopic and elemental distribution patterns of THMR in 3 different provinces of the geographical origins including YP (Figure 4a), RP (Figure 4b), and SP (Figure 4c). Figure 4 shows the unique patterns of THMR cultivated in three contiguous provinces of the geographical origins. This revealed the possibility to identify the geographical origins of THMR. In order to ensure the geographical origin of THMR, LDA was further studied.

3.3. LDA

Isotopic and elemental compositions (δ18O, Mn, Rb, Co, and Mo) in THMR cultivated from 3 geographical origins were performed using ICP-MS and EA-IRMS. LDA is a statistical approach that maximizes between-group variance and minimizes within-group variance [38]. Discrimination analysis was applied to classify groups and also assign the samples to the groups. LDA of THMR from three provinces was undertaken to classify province of origin. Using only elemental compositions (four metal variables), an LDA model was initially built, but it’s not enough to discriminate the origins. THMR cultivated from SP could be distinguished from other provinces with a discrimination accuracy of 100%. However, for other provinces (YP and RP), the discrimination accuracy was 85.7 and 75%, respectively. Overall, the geographical discrimination accuracy was 82.1% using only the elemental compositions (Table 2).
Finally, using combining stable isotope and elemental composition data (five variables), most provinces were well classified as 85.7% (YP), 100.0% (RP), and 100.0% (SP), correspondingly. The overall discrimination accuracy increased to 96.4%.
The isotopic (δ18O) and elemental composition (Mn, Rb, Co, and Mo) data combined with LDA were assigned to the groups of origins as YP (group 1), RP (group 2), and SP (group 3), respectively. Distribution patterns and group centroids of THMR in accordance with three contiguous provinces are also shown in Figure 5. The discriminant function 1 and function 2 were created from the markers. The canonical correlations were 0.883 (function 1), 0.754 (function 2), respectively. The first discriminant function explained 72.8% of total variance while the second discriminant function described 27.2% of the total variance. Function 1 was mainly correlated to Mn, Co, Rb, and Mo with standardized canonical discriminant function coefficients of 0.86, 0.51, −0.87, and 0.63, respectively. Function 2 was correlated to δ18O with a standardized canonical discriminant function coefficient of 0.84. LDA plotting by function 1 and function 2 is illustrated in Figure 5.
The LDA plot in Figure 5 illustrates the discrimination of THMR origins in three contiguous provinces. The origin of THMR in RP was successfully separated from other origins (YP and SP) using function 1. Function 2 discriminated clearly the origins of THMR cultivated between SP and other origins (YP and RP) which was not completely separated by function 1.
The cross-validation was also evaluated. An LDA model built with five variables (four elements and one stable isotope) provided 96.4% correct classification of the THMR in three origins and 92.9% of cross-validation as illustrated in Table 3. The combination of isotopic and elemental compositions with multivariate analysis was potentially effective in the origin traceability of THMR. These results implied that Mn, Rb, Co, Mo, and δ18O could be used as valuable markers for the discrimination of THMR cultivated from three contiguous provinces.

4. Conclusions

The isotopic and elemental analysis combined with powerful multivariate analysis is an alternative analytical tool in order to solve important problems regarding geographical origin traceability in worldwide agricultural products. Hence, this could be a promising method for classification of THMR. According to the THMR origins, registered as the European PGI, the discrimination of THMR using only five chemical markers was successfully accomplished with correct classification and cross-validation of 96.4% and 92.9%, respectively. Based on LDA, Mn, Rb, Co, Mo, and δ18O were valuable chemical markers to classify the geographical origins of THMR cultivated in three contiguous provinces in Thailand (p < 0.05). These results show that effective elemental/isotopic markers may provide insight for sustainable management and regulation of improper labeling regarding geographical origins of rice amongst Thailand and other countries. The database or the established system is also applicable to other countries and commodities.

Supplementary Materials

The following are available online at https://www.mdpi.com/article/10.3390/foods10102349/s1, Table S1: Operating conditions of Agilent 7900 ICP-MS, Table S2: Method validation for the analysis of elemental composition in Thai Hom Mali rice using ICP-MS.

Author Contributions

Conceptualization, S.K., P.S., N.L. and C.K.; methodology, S.K. and C.K.; investigation, S.K. and C.K.; data curation, S.K.; writing—original draft preparation, S.K.; writing—review and editing, C.K.; supervision, C.K.; project administration, S.K.; funding acquisition, C.K. and S.K. All authors have read and agreed to the published version of the manuscript.

Funding

This research received no external funding.

Institutional Review Board Statement

Not applicable.

Informed Consent Statement

Not applicable.

Data Availability Statement

Not applicable.

Acknowledgments

This work was financially supported by Thailand Institute of Nuclear Technology (Public Organization). The authors would like to acknowledge Agricultural Extension Office, Thailand for assistance in contacting farmers. We thank all farmers for supporting rice samples. We also would like to thank Pongpich Yodying, Civil engineering professional level, Royal Irrigation Department, Thailand.

Conflicts of Interest

The authors declare no conflict of interest.

References

  1. Shen, S.; Xia, L.; Xiong, N.; Liu, Z.; Sun, H. Determination of the geographic origin of rice by element fingerprints and correlation analyses with the soil of origin. Anal. Methods 2013, 5, 6177–6185. [Google Scholar] [CrossRef]
  2. Kukusamude, C.; Kongsri, S. Elemental and isotopic profiling of Thai jasmine rice (Khao Dawk Mali 105) for discrimination of geographical origins in Thung Kula Rong Hai area. Thailand. Food Control 2018, 91, 357–364. [Google Scholar] [CrossRef]
  3. Kukusamude, C.; Sricharoen, P.; Limchoowong, N.; Kongsri, S. Heavy metals and probabilistic risk assessment via rice consumption in Thailand. Food Chem. 2021, 334, 127402. [Google Scholar] [CrossRef] [PubMed]
  4. Wang, J.; Chen, T.; Zhang, W.; Zhao, Y.; Yang, S.; Chen, A. Tracing the geographical origin of rice by stable isotopic analyses combined with chemometrics. Food Chem. 2020, 313, 126093. [Google Scholar] [CrossRef] [PubMed]
  5. Cheajesadagul, P.; Arnaudguilhem, C.; Shiowatana, J.; Siripinyanond, A.; Szpunar, J. Discrimination of geographical origin of rice based on multi-element fingerprinting by high resolution inductively coupled plasma mass spectrometry. Food Chem. 2013, 141, 3504–3509. [Google Scholar] [CrossRef]
  6. Cotecna. World Rice Production & Trade in Brief. 2020. Available online: https://www.cotecna.com/en/media/articles/world-rice-trade-in-brief (accessed on 15 April 2021).
  7. EU. Commission Implementing Regulation (EU) No 120/2013 of 11 February 2013 entering a name in the register of protected designations of origin and protected geographical indications ((Khao Hom Mali Thung Kula Rong-Hai) (PGI)). Off. J. Eur. Union 2013, 56, 3–8. [Google Scholar]
  8. Asean-gidatabase. Khao HomMali Thung Kula Rong-Hai. 2007. Available online: http://www.asean-gidatabase.org/gidatabase/sites/default/files/gidocs/THGI0000049100020-en.pdf (accessed on 15 April 2021).
  9. DIP (Department of Intellectual Property). One Province One Geographical Indication, GI Thailand. 2013. Available online: https://ipthailand.go.th/images/gibook/GI_Thailand_1.pdf (accessed on 15 April 2021).
  10. Pérez-Rodríguez, M.; Dirchwolf, P.M.; Rodríguez-Negrín, Z.; Pellerano, R.G. Assessing mineral profiles for rice flour fraud detection by principal component analysis based data fusion. Food Chem. 2021, 339, 128125. [Google Scholar] [CrossRef] [PubMed]
  11. Lange, C.N.; Monteiro, L.R.; Freire, B.M.; Franco, D.F.; de Souza, R.O.; dos Reis Ferreira, C.E.S.; da Silva, J.J.C.; Batista, B.L. Mineral profile exploratory analysis for rice grains traceability. Food Chem. 2019, 300, 125145. [Google Scholar] [CrossRef]
  12. Kelly, S.; Baxter, M.; Chapman, S.; Rhodes, C.; Dennis, J.; Brereton, P. The application of isotopic and elemental analysis to determine the geographical origin of premium long grain rice. Euro. Food Res. Technol. 2002, 214, 72–78. [Google Scholar] [CrossRef]
  13. Suzuki, Y.; Chikaraishi, Y.; Ogawa, N.O.; Ohkouchi, N.; Korenaga, T. Geographical origin of polished rice based on multiple element and stable isotope analyses. Food Chem. 2008, 109, 470–475. [Google Scholar] [CrossRef]
  14. Maione, C.; Barbosa, R.M. Recent applications of multivariate data analysis methods in the authentication of rice and the most analyzed parameters: A review. Crit. Rev. Food Sci. Nutr. 2019, 59, 1868–1879. [Google Scholar] [CrossRef]
  15. Kato, L.S.; De Nadai Fernandes, E.A.; Bacchi, M.A.; Sarriés, G.A. Elemental composition of Brazilian rice grains from different cultivars and origins. J. Radioanal. Nucl. Chem. 2018, 318, 745–751. [Google Scholar] [CrossRef]
  16. Salim, N.A.A.; Mostapa, R.; Othman, Z.; Daud, N.M.; Harun, A.R.; Mohamed, F. Geographical identification of Oryza sativa “MR 220CL” from Peninsular Malaysia using elemental and isotopic profiling. Food Control 2020, 110, 106967. [Google Scholar] [CrossRef]
  17. Chen, T.; Zhao, Y.; Zhang, W.; Yang, S.; Ye, Z.; Zhang, G. Variation of the light stable isotopes in the superior and inferior grains of rice (Oryza sativa L.) with different geographical origins. Food Chem. 2016, 209, 95–98. [Google Scholar] [CrossRef]
  18. Chung, I.M.; Kim, J.K.; Prabakaran, M.; Yang, J.H.; Kim, S.H. Authenticity of rice (Oryza sativa L.) geographical origin based on analysis of C, N, O and S stable isotope ratios: A preliminary case report in Korea, China and Philippine. J. Sci. Food Agric. 2016, 96, 2433–2439. [Google Scholar] [CrossRef] [PubMed]
  19. Chung, I.M.; Park, S.K.; Lee, K.J.; An, M.J.; Lee, J.H.; Oh, Y.T.; Kim, S.H. Authenticity testing of environment-friendly Korean rice (Oryza sativa L.) using carbon and nitrogen stable isotope ratio analysis. Food Chem. 2017, 234, 425–430. [Google Scholar] [CrossRef] [PubMed]
  20. Korenaga, T.; Musashi, M.; Nakashita, R.; Suzuki, Y. Statistical analysis of rice samples for compositions of multiple light elements (H, C, N, and O) and their stable isotopes. Anal. Sci. 2010, 26, 873–878. [Google Scholar] [CrossRef] [PubMed] [Green Version]
  21. Chung, I.M.; Kim, J.K.; Lee, J.K.; Kim, S.H. Discrimination of geographical origin of rice (Oryza sativa L.) by multielement analysis using inductively coupled plasma atomic emission spectroscopy and multivariate analysis. J. Cereal Sci. 2015, 65, 252–259. [Google Scholar] [CrossRef]
  22. Gonzálvez, A.; Armenta, S.; de la Guardia, M. Geographical traceability of “Arròs de Valencia” rice grain based on mineral element composition. Food Chem. 2011, 126, 1254–1260. [Google Scholar] [CrossRef]
  23. Kokot, S.; Phuong, T.D. Elemental content of Vietnamese rice. Part 2. Multivariate data analysis. Analyst 1999, 124, 561–569. [Google Scholar] [CrossRef]
  24. Li, G.; Nunes, L.; Wang, Y.; Williams, P.N.; Zheng, M.; Zhang, Q.; Zhu, Y. Profiling the ionome of rice and its use in discriminating geographical origins at the regional scale, China. J. Environ. Sci. 2012, 25, 144–154. [Google Scholar] [CrossRef]
  25. Yasui, A.; Shindoh, K. Analytical Chemistry for Environmental and Human Health. Determination of the geographic origin of brown-rice with trace-element composition. Bunseki Kagaku 2000, 49, 405–410. [Google Scholar] [CrossRef] [Green Version]
  26. Barbosa, R.M.; de Paula, E.S.; Paulelli, A.C.; Moore, A.F. Souza, J.M.O.; Batista, B.L.; Campiglia, A.D.; Barbosa, F., Jr. Recognition of organic rice samples based on trace elements and support vector machines. J. Food Compos. Anal. 2016, 45, 95–100. [Google Scholar] [CrossRef]
  27. Lagad, R.A.; Singh, S.K.; Rai, V.K. Rare earth elements and 87Sr/86Sr isotopic characterization of Indian Basmati rice as potential tool for its geographical authenticity. Food Chem. 2017, 217, 254–265. [Google Scholar] [CrossRef]
  28. Du, M.; Fang, Y.; Shen, F.; Mao, B.; Zou, Y.; Li, P.; Pei, F.; Hu, Q. Multiangle discrimination of geographical origin of rice based on analysis of mineral elements and characteristic volatile components. Int. J. Food Sci. Technol. 2018, 53, 2088–2096. [Google Scholar] [CrossRef]
  29. Qian, L.; Zuo, F.; Liu, H.; Zhang, C.; Chi, X.; Zhang, D. Determination of Geographical Origin of Wuchang Rice with the Geographical Indicator by Multielement Analysis. J. Food Qual. 2019, 2019, 1–7. [Google Scholar] [CrossRef]
  30. Promchan, J.; Günther, D.; Siripinyanond, A.; Shiowatana, J. Elemental imaging and classifying rice grains by using laser ablation inductively coupled plasma mass spectrometry and linear discriminant analysis. J. Cereal Sci. 2016, 71, 198–203. [Google Scholar] [CrossRef]
  31. Ariyama, K.; Shinozaki, M.; Kawasaki, A. Determination of the Geographic Origin of Rice by Chemometrics with Strontium and Lead Isotope Ratios and Multielement Concentrations. J. Agric. Food Chem. 2012, 60, 1628–1634. [Google Scholar] [CrossRef] [PubMed]
  32. Kelly, S.; Heaton, K.; Hoogewerff, J. Tracing the geographical origin of food: The application of multi-element and multi-isotope analysis. Trends Food Sci. Technol. 2005, 16, 555–567. [Google Scholar] [CrossRef]
  33. Chung, I.M.; Kim, J.K.; Lee, K.J.; Park, S.K.; Lee, J.H.; Son, N.Y.; Jin, Y.I.; Kim, S.H. Geographic authentication of Asian rice (Oryza sativa L.) using multi-elemental and stable isotopic data combined with multivariate analysis. Food Chem. 2018, 240, 840–849. [Google Scholar] [CrossRef]
  34. Li, C.; Dong, H.; Luo, D.; Xian, Y.; Fu, X. Recent Developments in Application of Stable Isotope and Multi-element Analysis on Geographical Origin Traceability of Cereal Grains. Food Anal. Methods 2016, 9, 1512–1519. [Google Scholar] [CrossRef]
  35. Liu, Z.; Zhang, W.; Zhang, Y.; Chen, T.; Shao, S.; Zhou, L.; Yuan, Y.; Xie, T.; Rogers, K.M. Assuring food safety and traceability of polished rice from different production regions in China and Southeast Asia using chemometric models. Food Control 2019, 99, 1–10. [Google Scholar] [CrossRef]
  36. Magnusson, B.; Ornemark, U. (Eds.) Eurachem Guide: The Fitness for Purpose of Analytical Methods—A Laboratory Guide to Method Validation and Related Topics, 2nd ed.; Eurachem: London, UK, 2014; pp. 1–70. [Google Scholar]
  37. Melini, V.; Melini, F. Asian grain-based food products and the European scheme for food protected designations of origin: A critical analysis. Trends Food Sci. Technol. 2019, 91, 83–94. [Google Scholar] [CrossRef]
  38. Ni, K.; Wang, J.; Zhang, Q.; Yi, X.; Ma, L.; Shi, Y.; Ruan, J. Multi-element composition and isotopic signatures for the geographical origin discrimination of green tea in China: A case study of Xihu Longjing. J. Food Compos. Anal. 2018, 67, 104–109. [Google Scholar] [CrossRef]
Figure 1. Sampling areas of three contiguous provinces in Thailand for Thai Hom Mali rice (THMR) samples. The right figure is the enlargement of Yasothon province (YP), Roi Et province (RP), and Surin province (SP).
Foods 10 02349 g001
Figure 2. Box-and-whisker plots showing the variation of stable isotope, δ18O values in THMR collected from three contiguous provinces in Thailand covering YP (n = 7), RP (n = 16), and SP (n = 5), respectively.
Foods 10 02349 g002
Figure 3. Box-and-whisker plots showing the variation of (a) Mn, (b) Rb, (c) Co, and (d) Mo concentrations in THMR collected in three contiguous provinces in Thailand covering YP (n = 7), RP (n = 16), and SP (n = 5), respectively.
Foods 10 02349 g003
Figure 4. Radar plots summarizing the difference as relative concentration of the studied variables (Mn, Co, Rb, Mo, and δ18O) in THMR from (a) YP, (b) RP, and (c) SP.
Foods 10 02349 g004
Figure 5. LDA of isotopic and elemental compositions using five markers for determining the geographical origins of THMR cultivated in three contiguous provinces in Thailand covering YP, RP, and SP. Empty squares, circles, and stars symbols refer to (1) YP, (2) RP, and (3) SP, respectively. Filled squares represent the group centroid of each province.
Foods 10 02349 g005
Table 1. Stable isotope and elements in THMR samples cultivated in three contiguous provinces.
Stable Isotope (‰)/Element (mg kg−1)Province of Thai Hom Mali Rice Origin 1
YP (n =7)RP (n = 16)SP (n = 5)
AverageRSD 2AverageRSDAverageRSD
δ18O25.48 a0.01825.42 a0.0324.20 b0.018
Mn17.71 c0.2612.74 d0.2312.82 cd0.10
Co0.085 e0.890.039 f2.030.033 ef0.45
Rb8.72 g0.344.30 h0.224.19 h0.28
Mo0.55 i0.250.49 ij0.320.32 j0.34
1 The different letters indicate significant differences (p < 0.05) amongst different provinces. 2 Relative standard deviation.
Table 2. Classification of THMR according to the provinces of origins using linear discriminant analysis (LDA) based on each composition.
ClassificationYPRPSPOverall
LDA (%)Elemental composition only
85.775.0100.082.1
Cross-validated71.475.080.075.0
LDA (%)Combination of elemental and stable isotope compositions
85.7100.0100.096.4
Cross-validated71.4100.0100.092.9
Table 3. LDA with correct classification and cross-validation of THMR in three contiguous provinces of origins using elemental and isotopic markers.
Origin Prediction in 3 Provincial Origins
YPRPSPTotal
ClassificationcountYP6107
RP016016
SP0055
%YP85.714.30.0100.0
RP0.0100.00.0100.0
SP0.00.0100.0100.0
Cross-validatedcountYP5117
RP016016
SP0055
%YP71.414.314.3100.0
RP0.0100.00.0100.0
SP0.00.0100.0100.0
Publisher’s Note: MDPI stays neutral with regard to jurisdictional claims in published maps and institutional affiliations.

