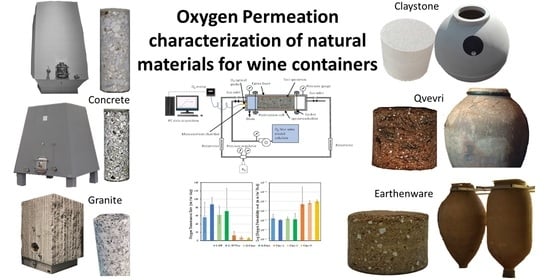
Characterization of the Oxygen Transmission Rate of New-Ancient Natural Materials for Wine Maturation Containers


Abstract
1. Introduction
2. Materials and Methods
2.1. Materials
2.1.1. Earthenware
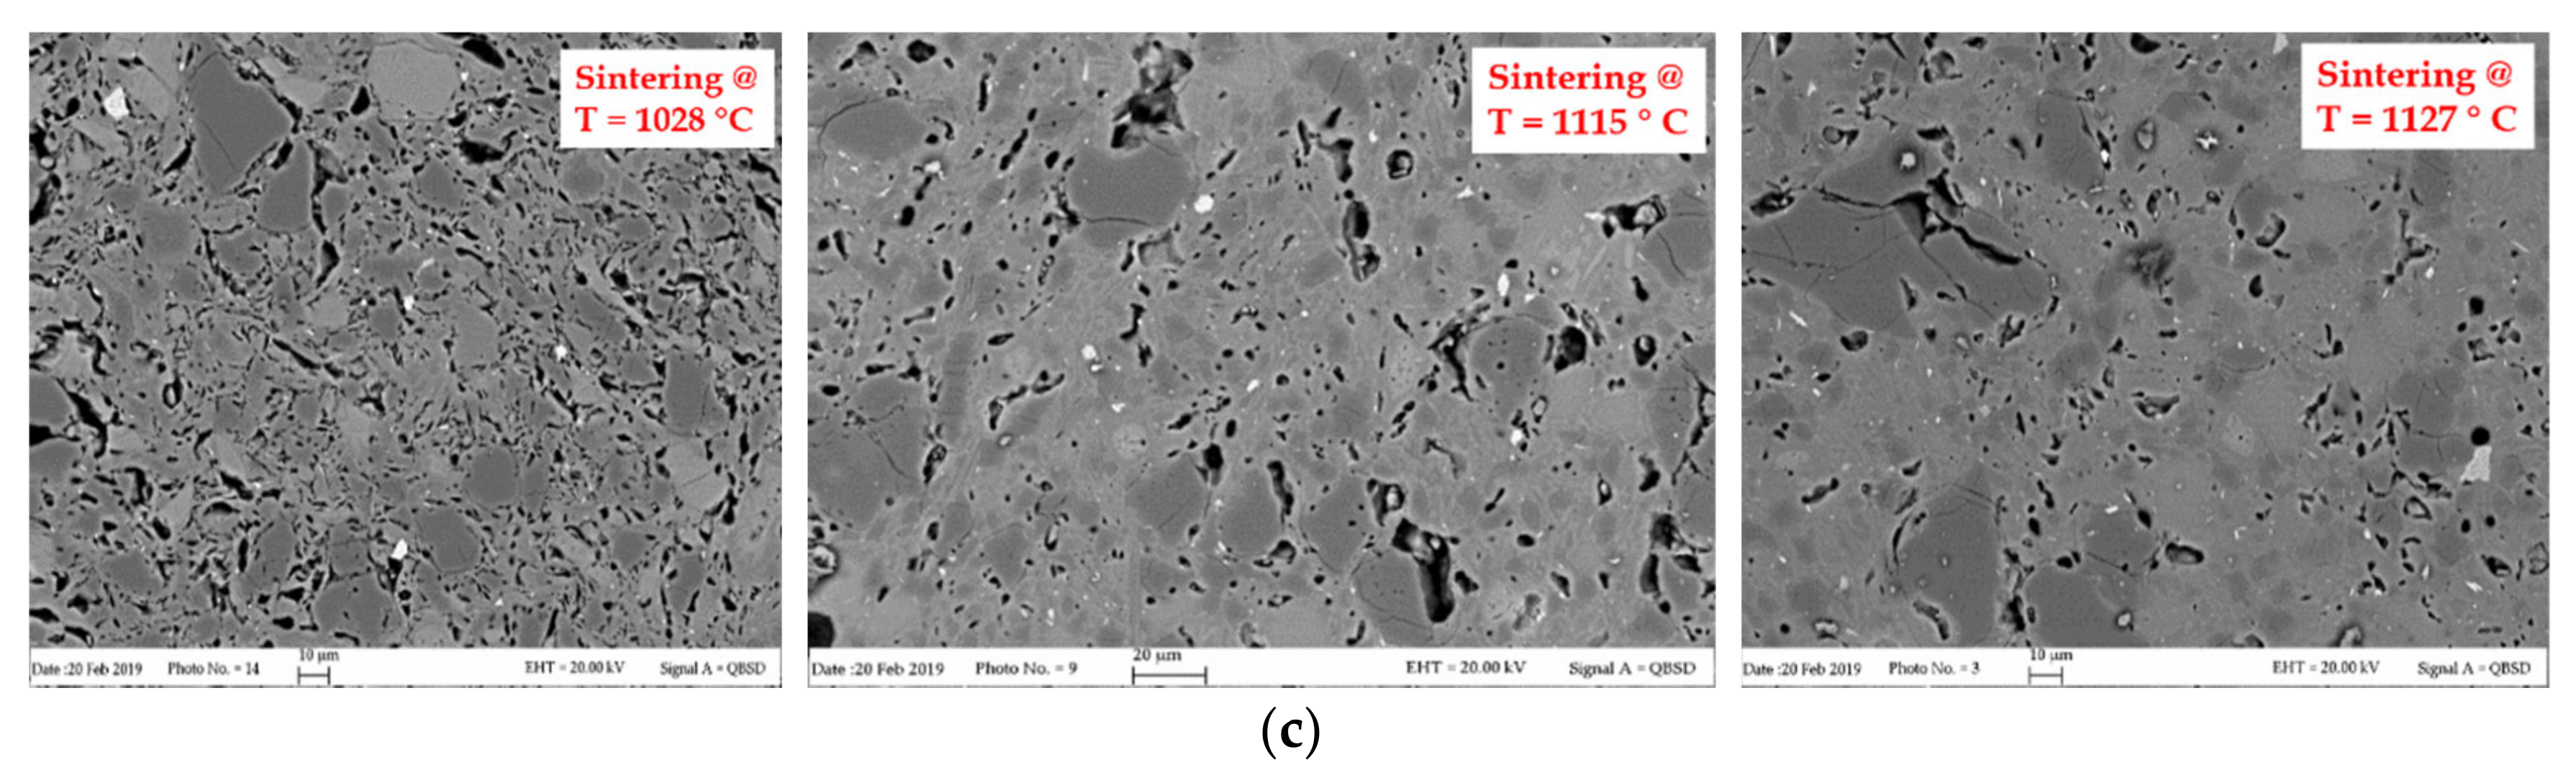
2.1.2. Claystone
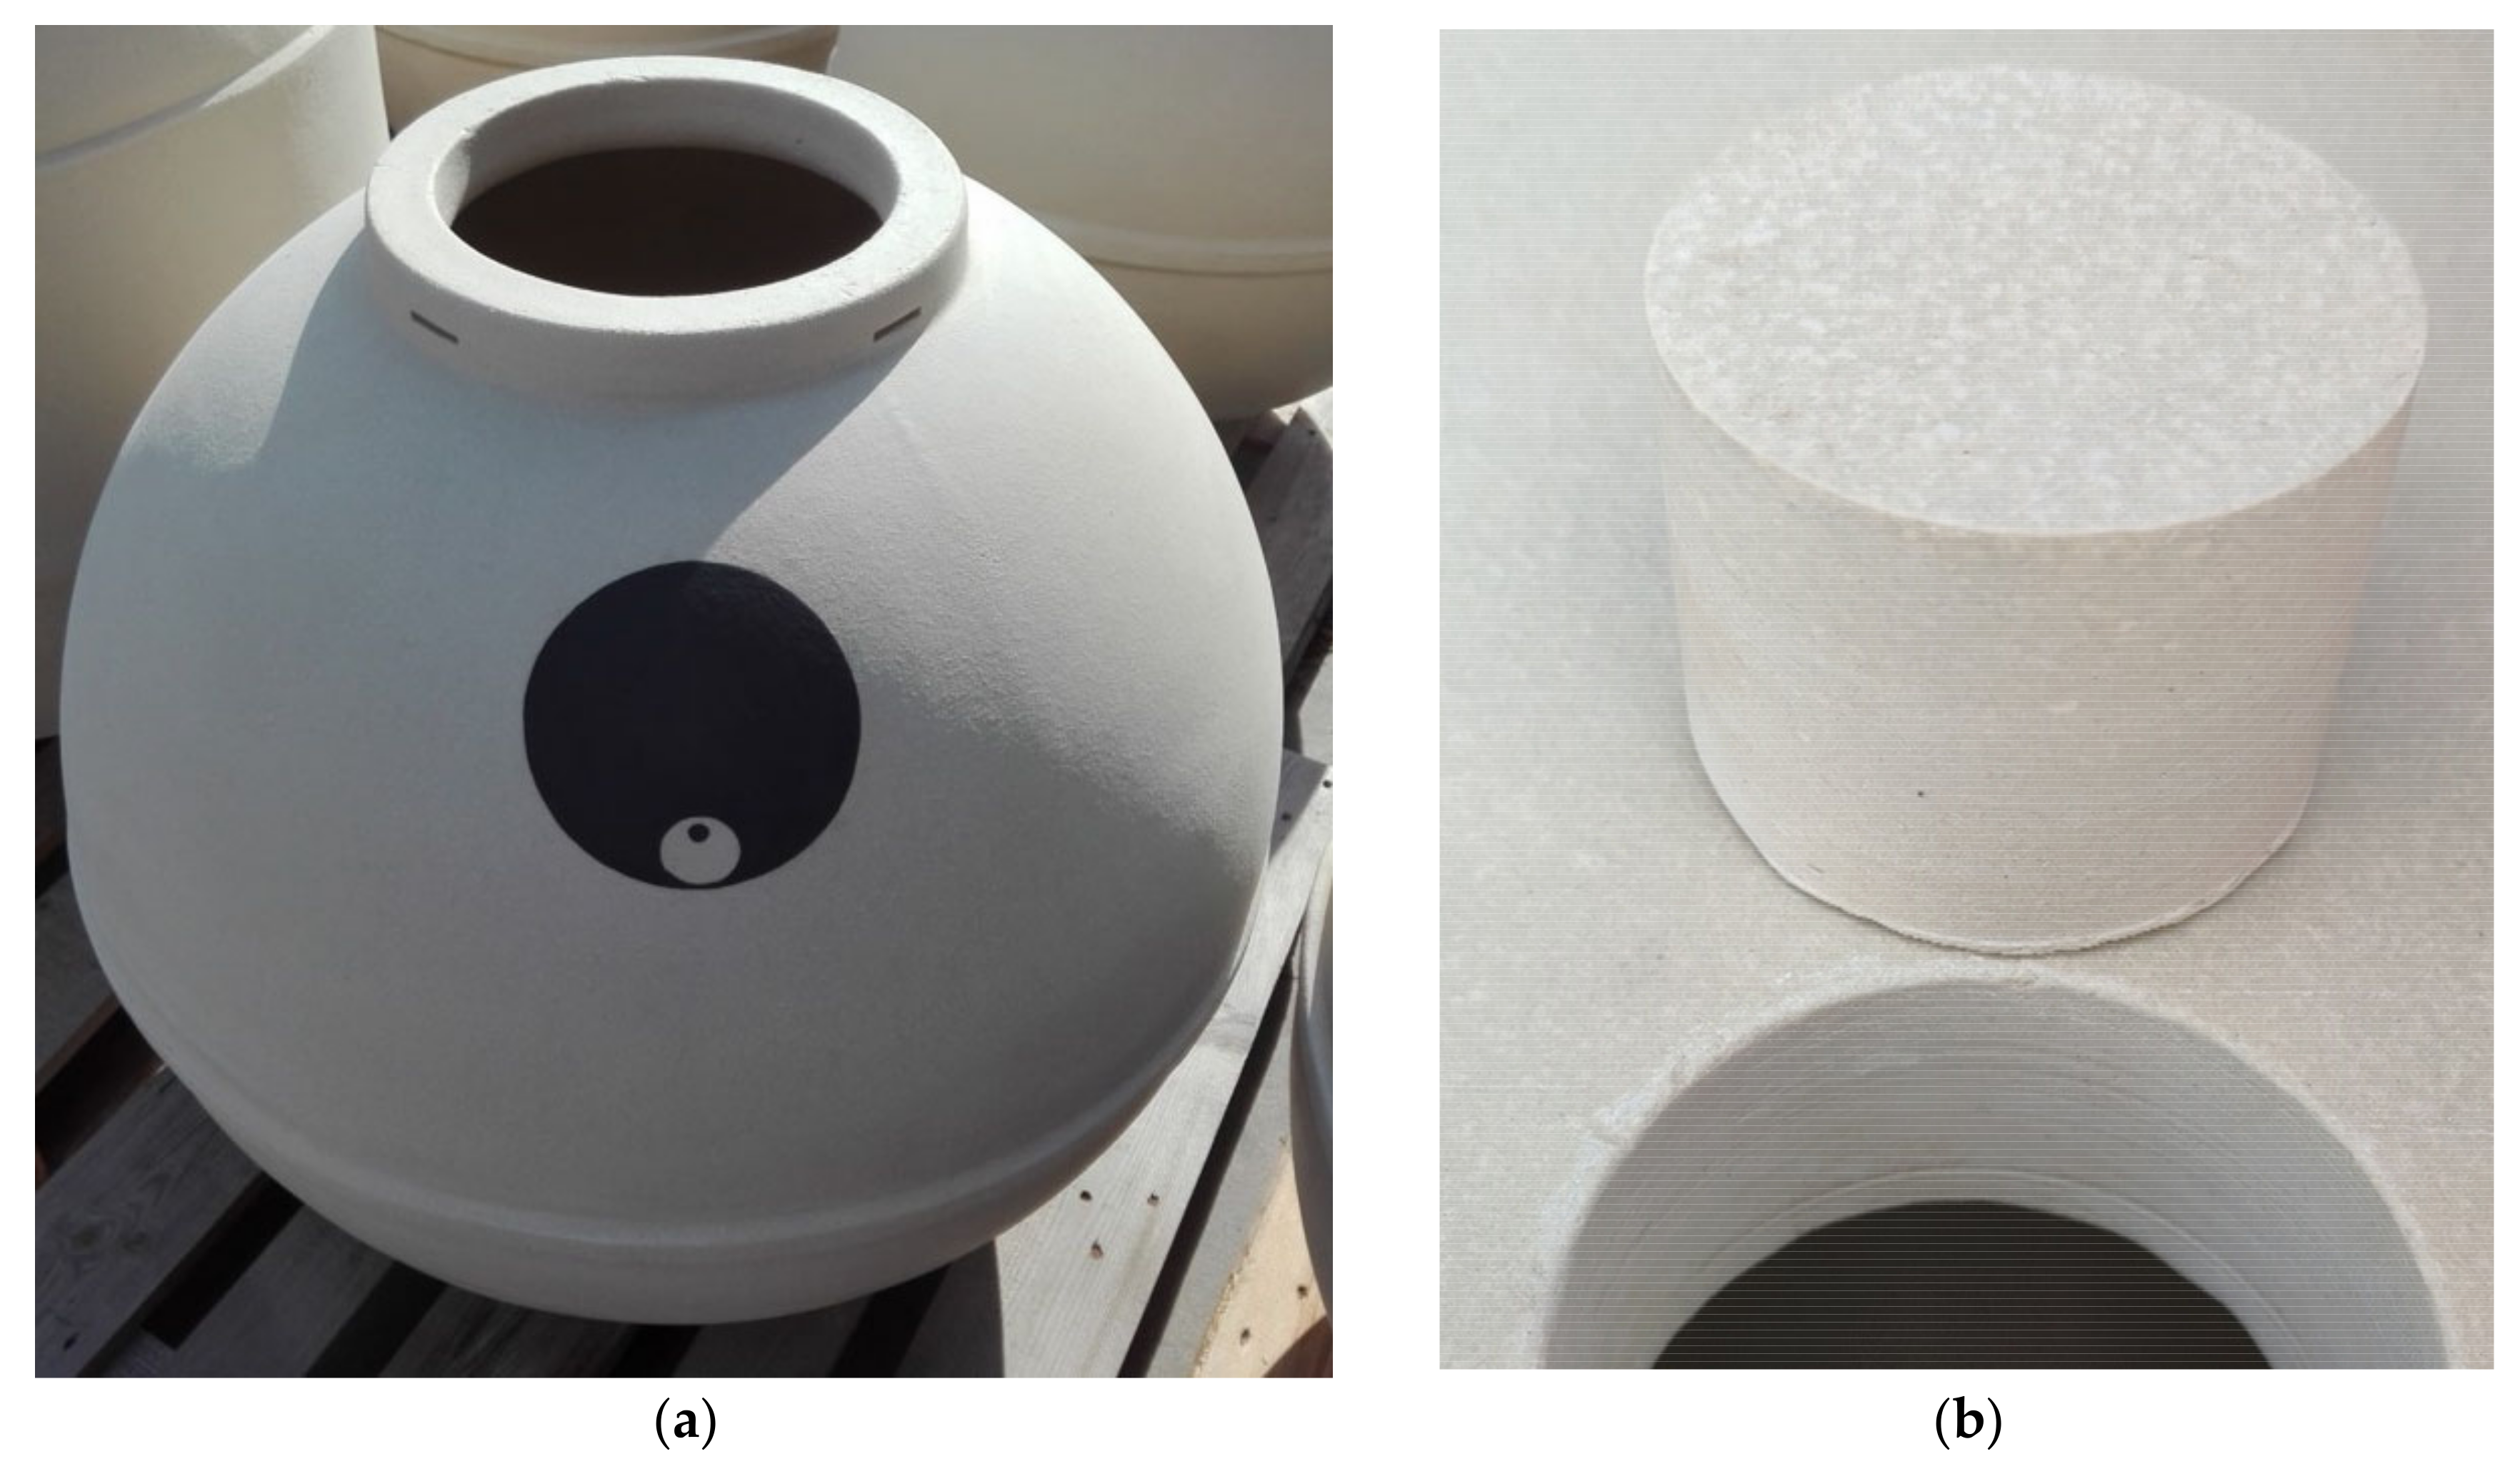
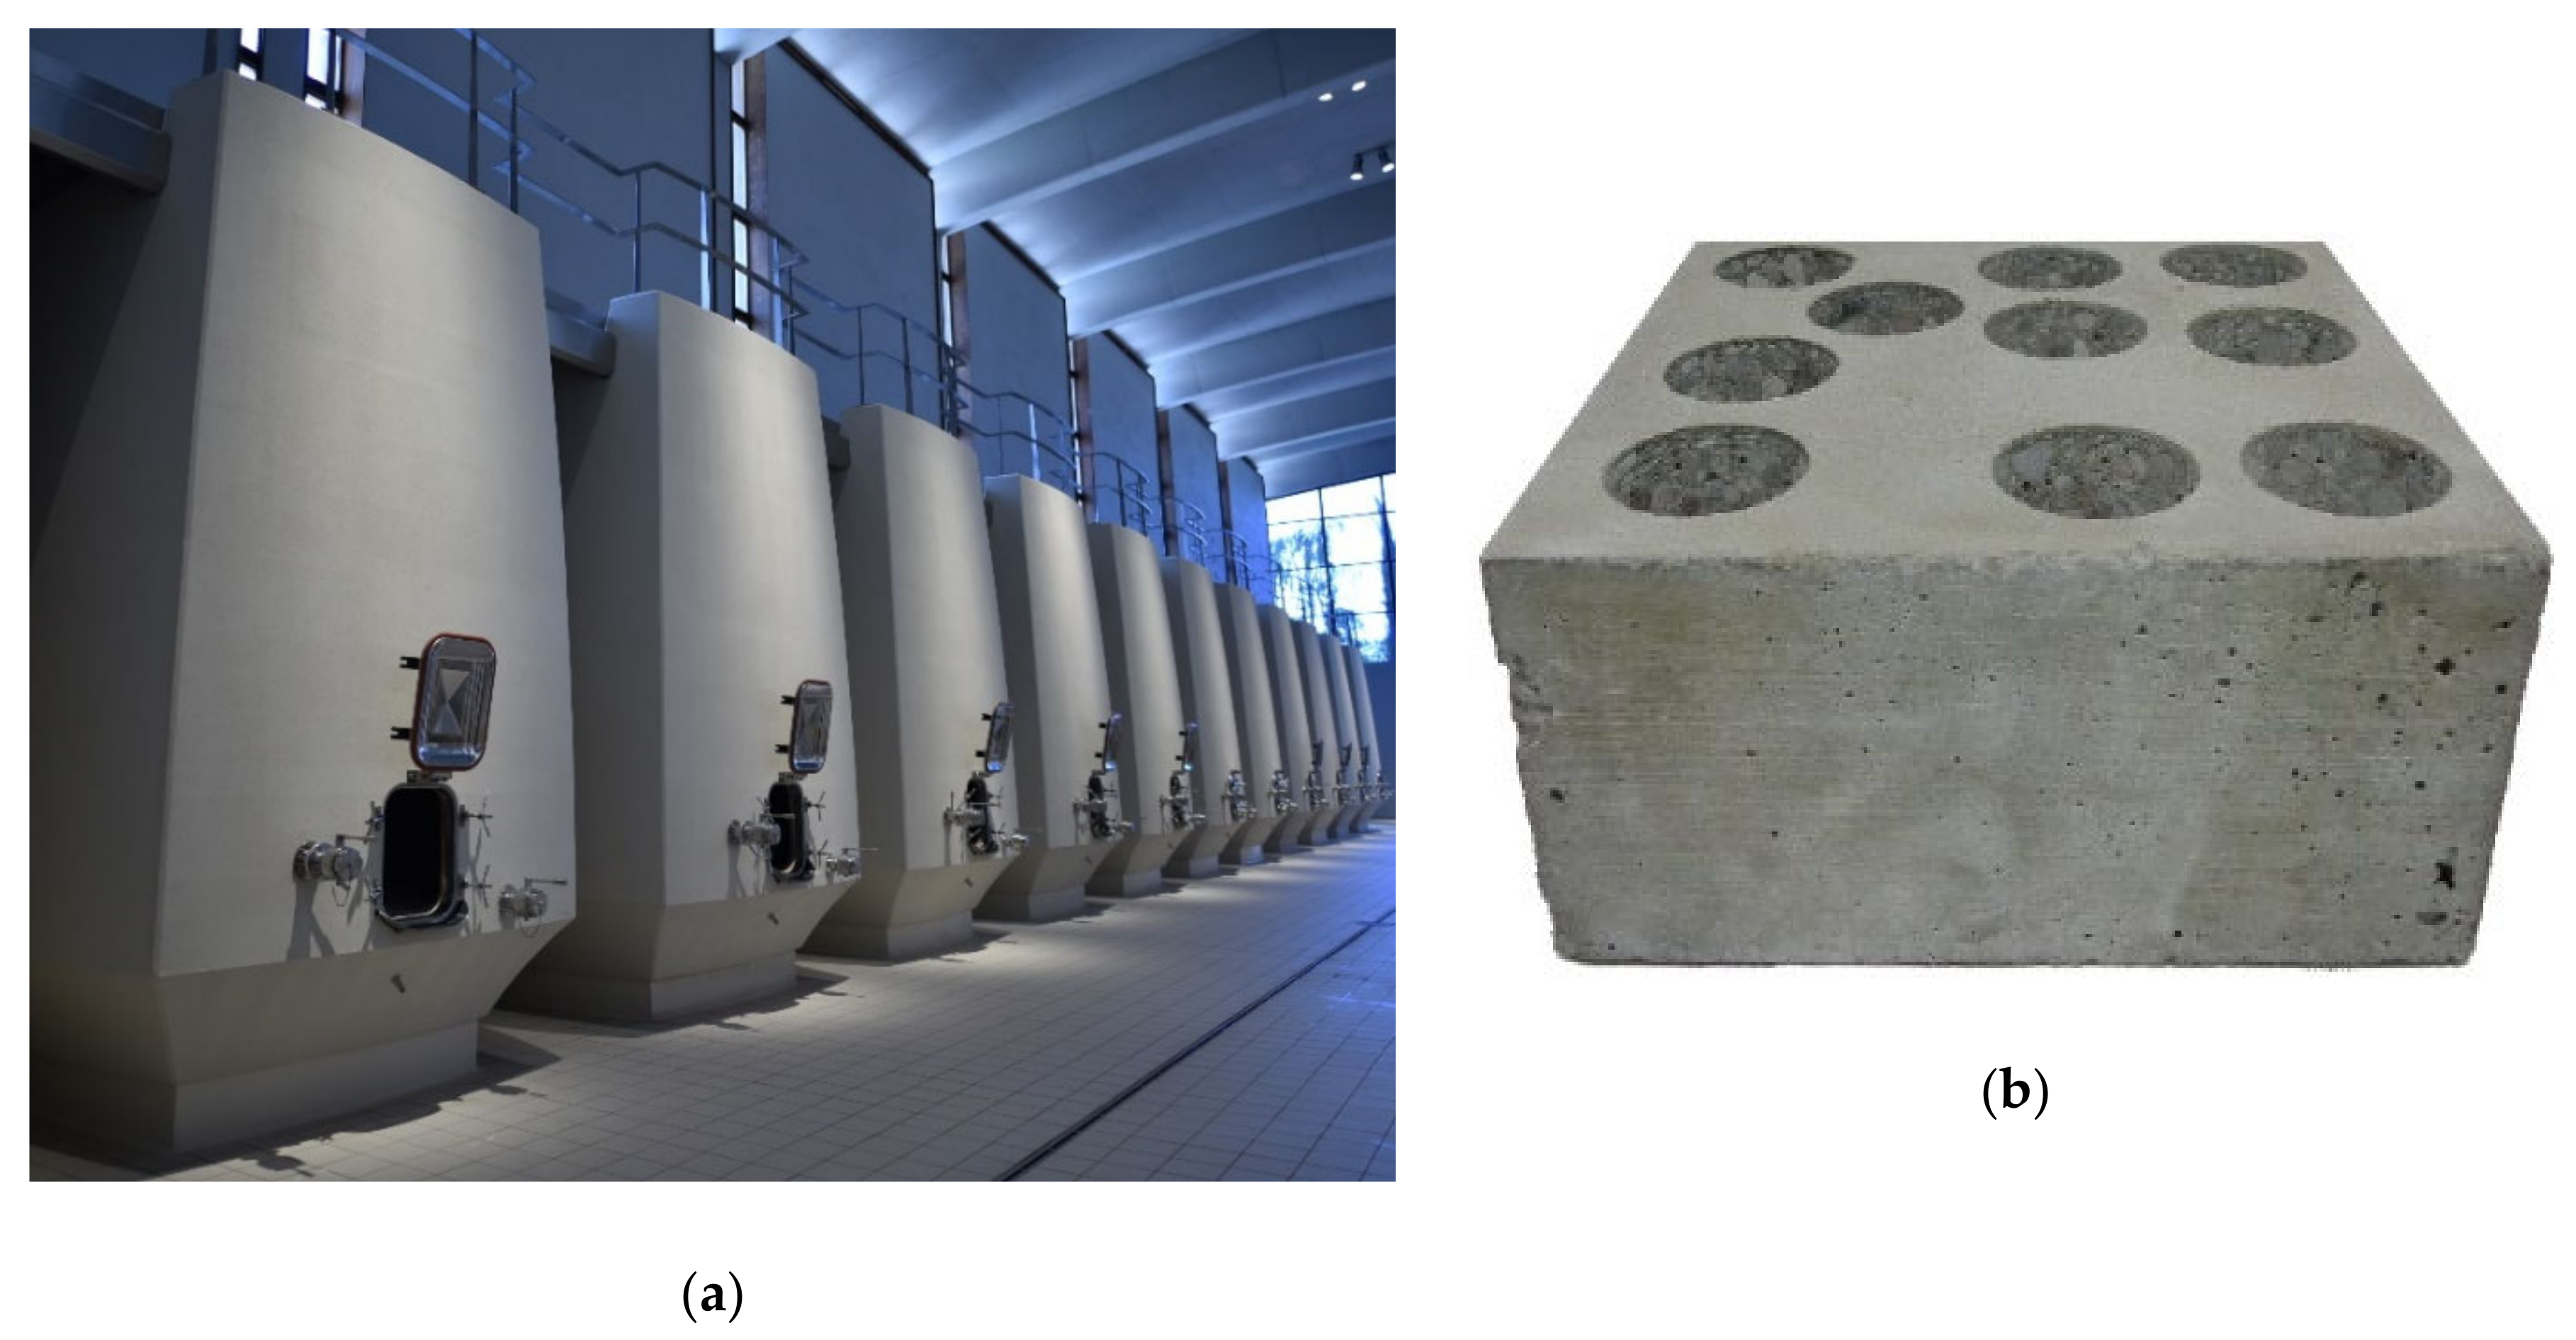
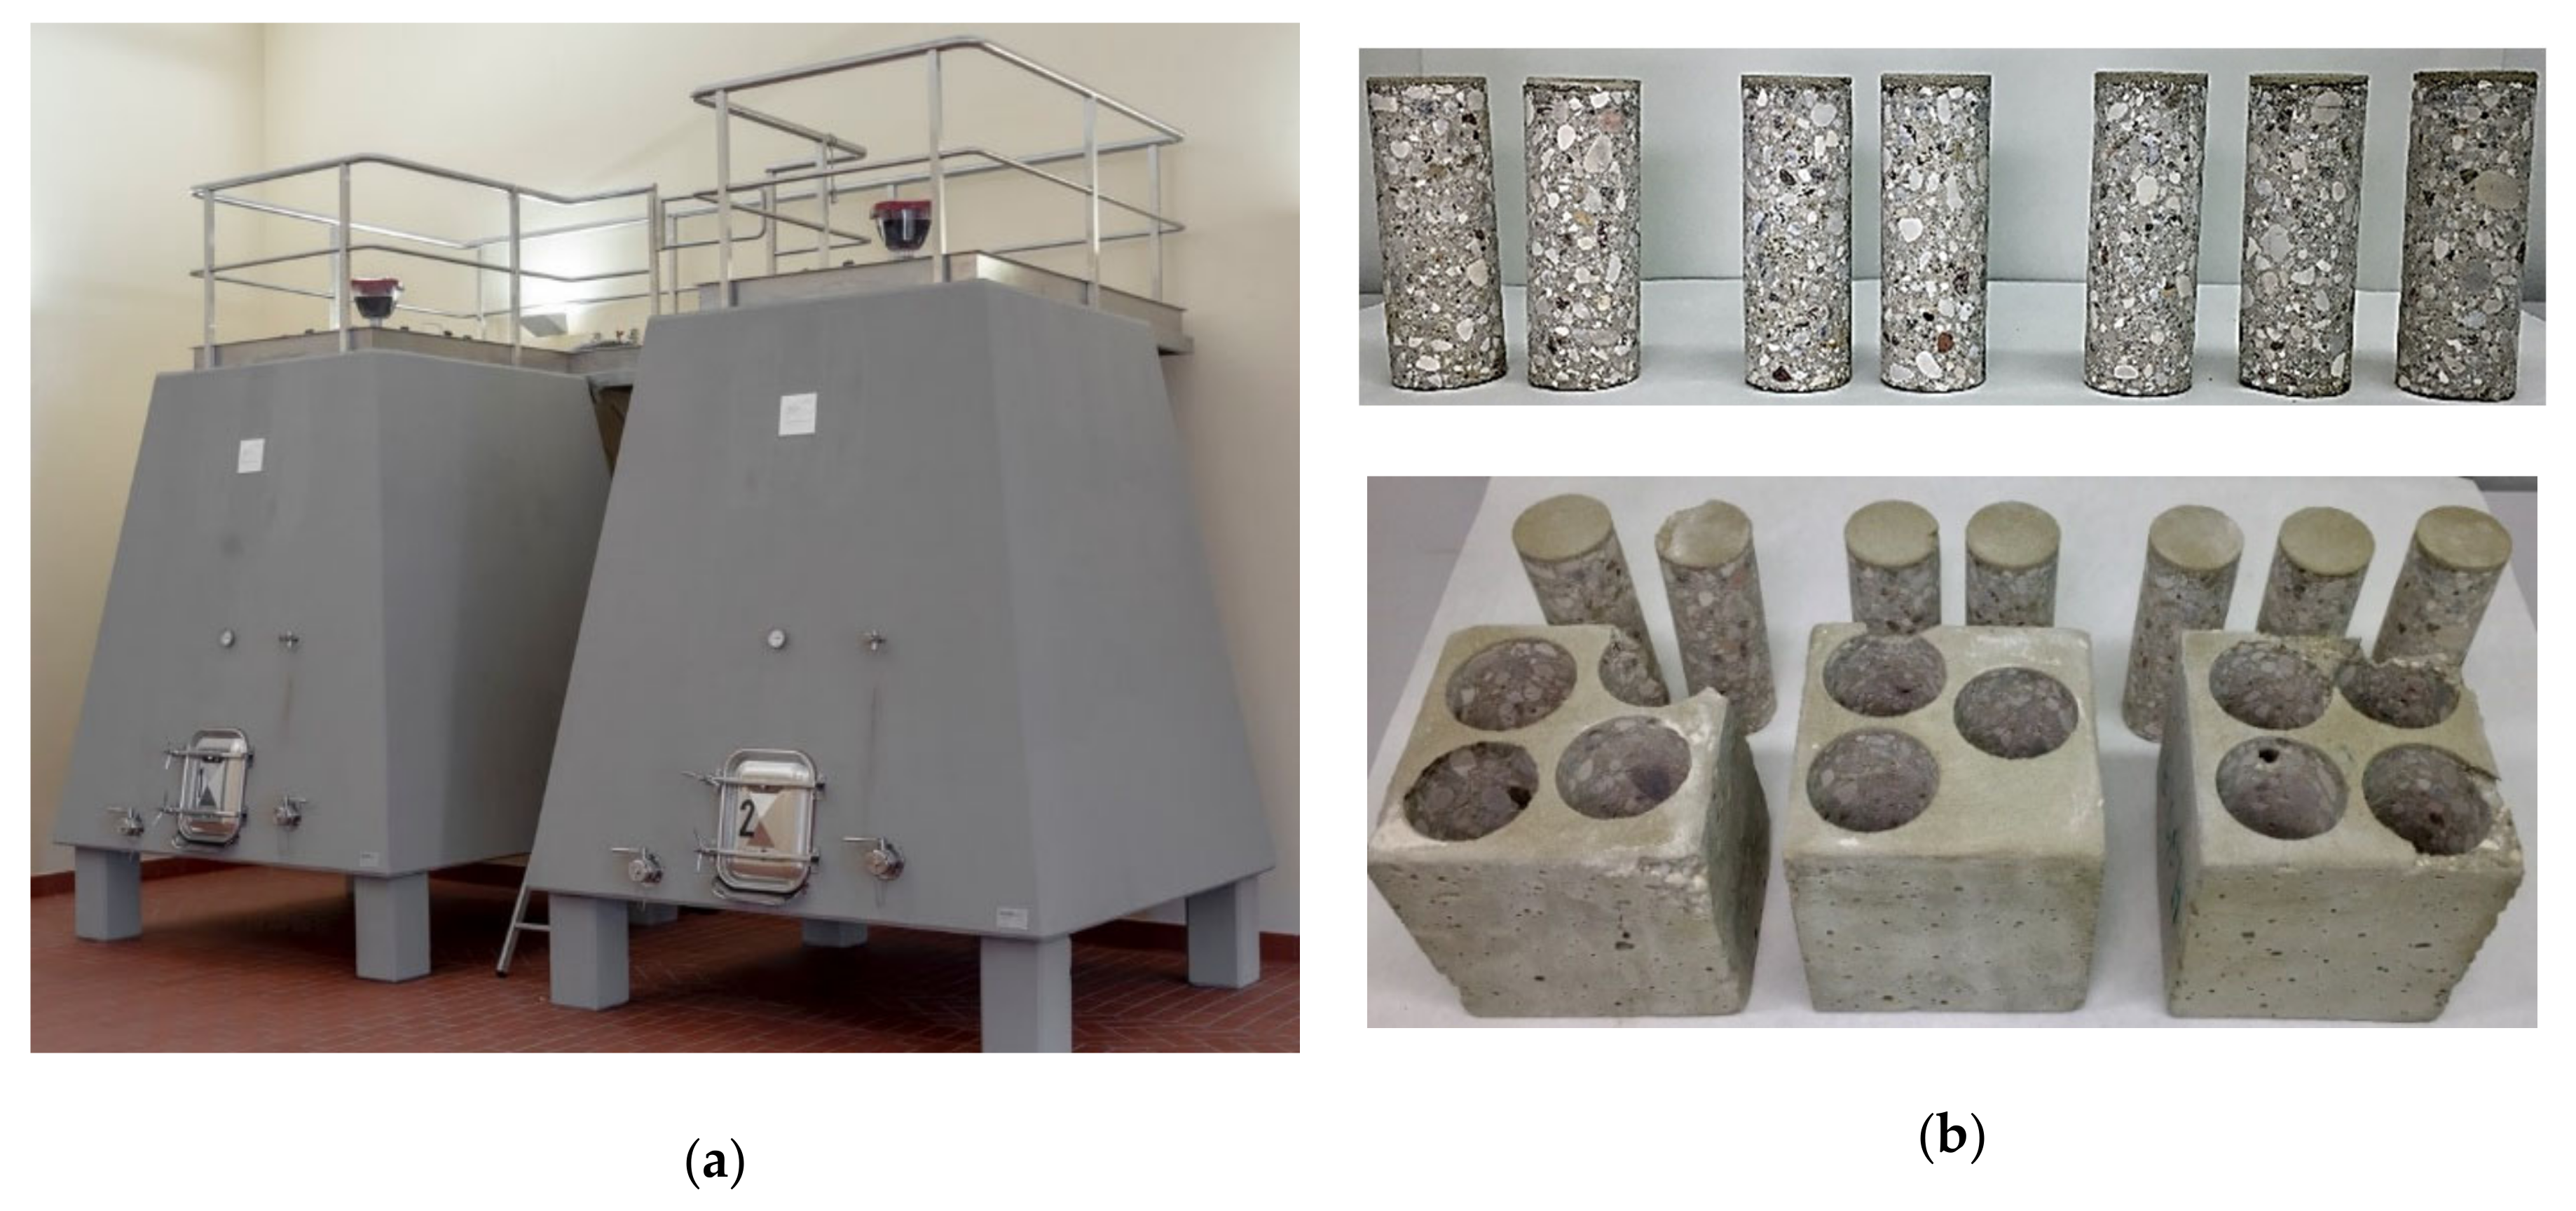
2.1.3. Concrete
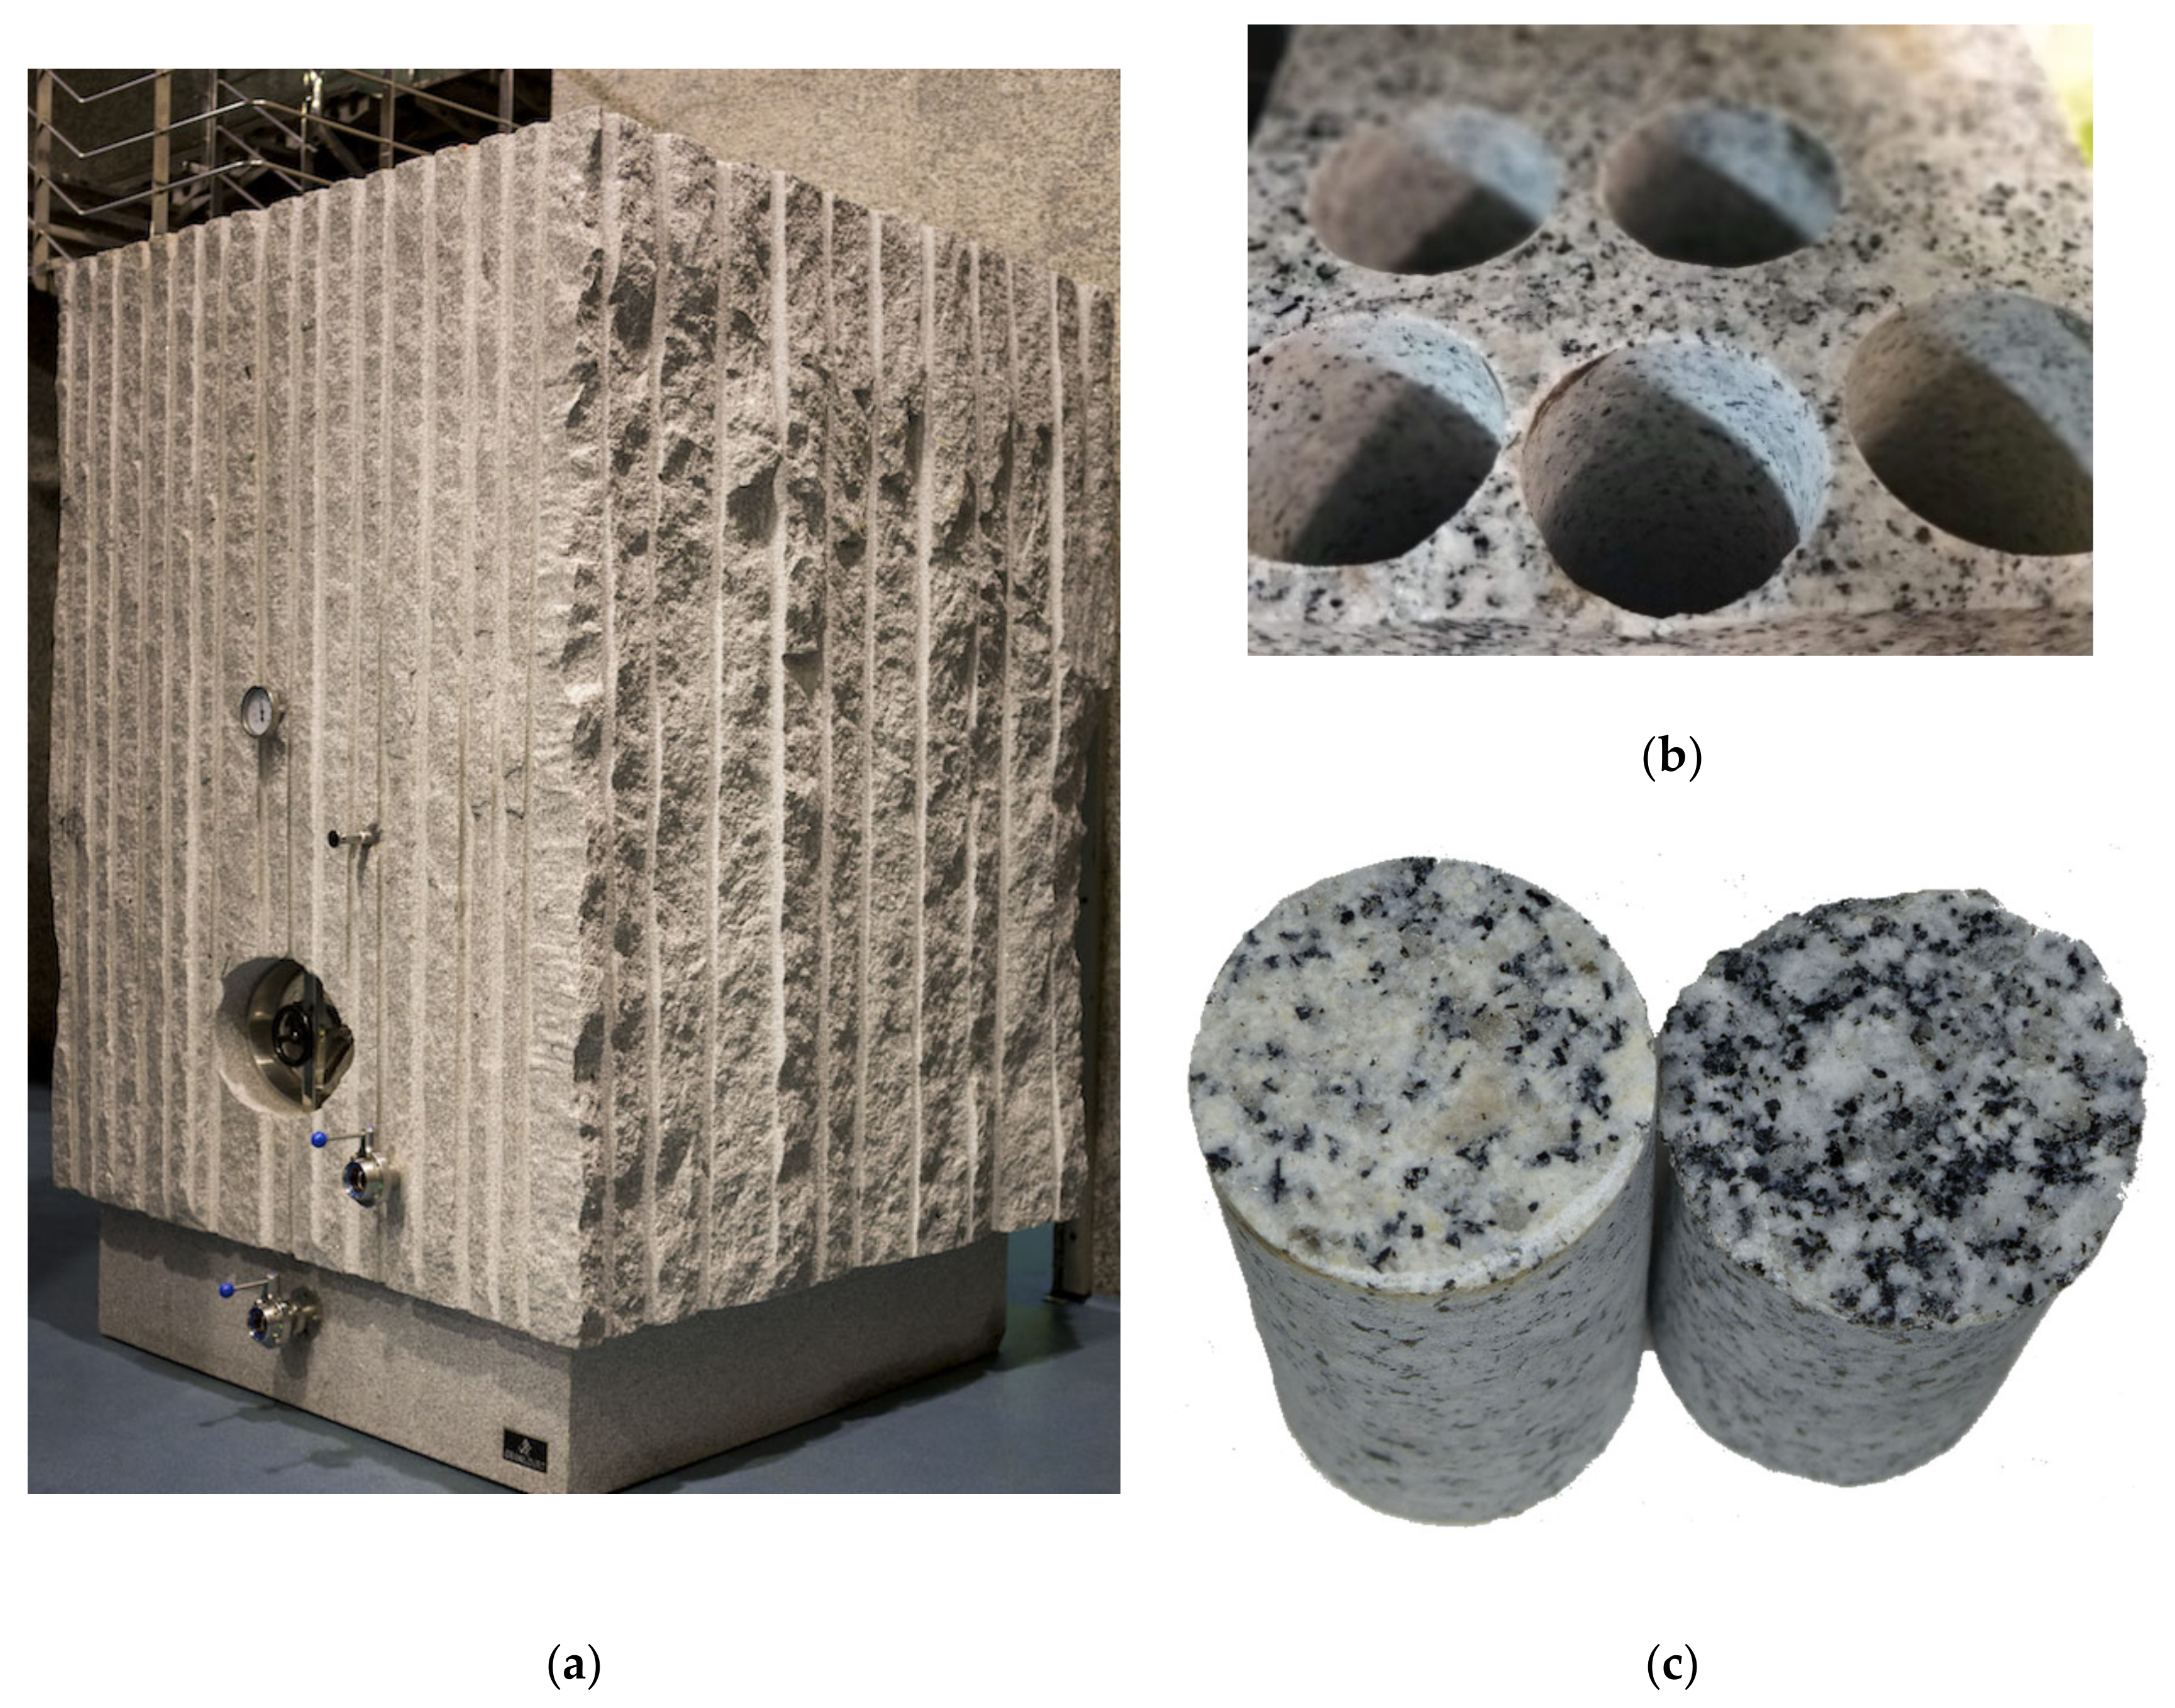
2.1.4. Granite
2.2. Specimen Manufacture and Preparation
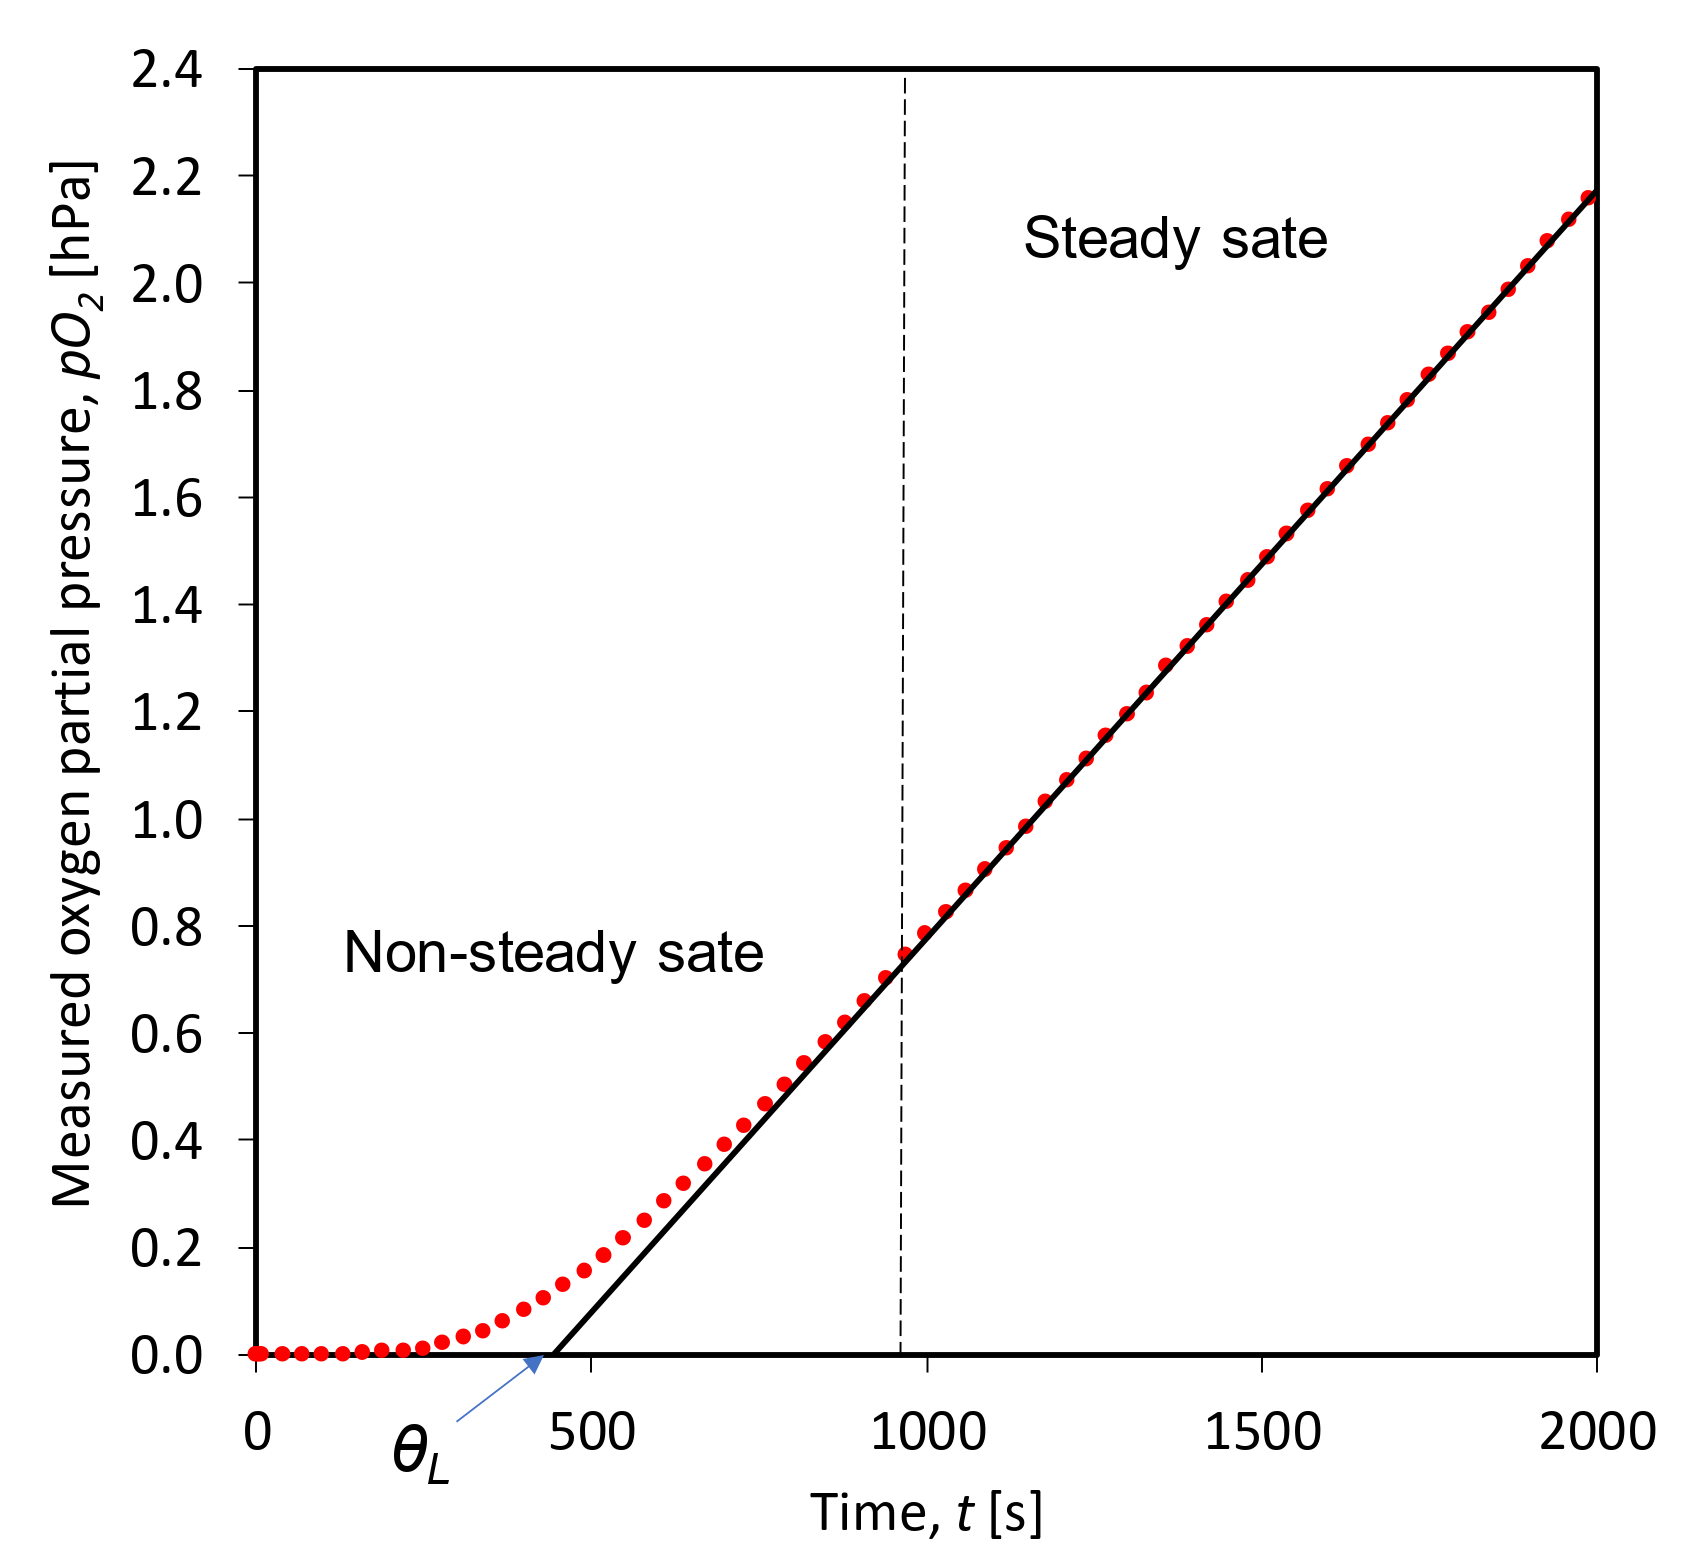
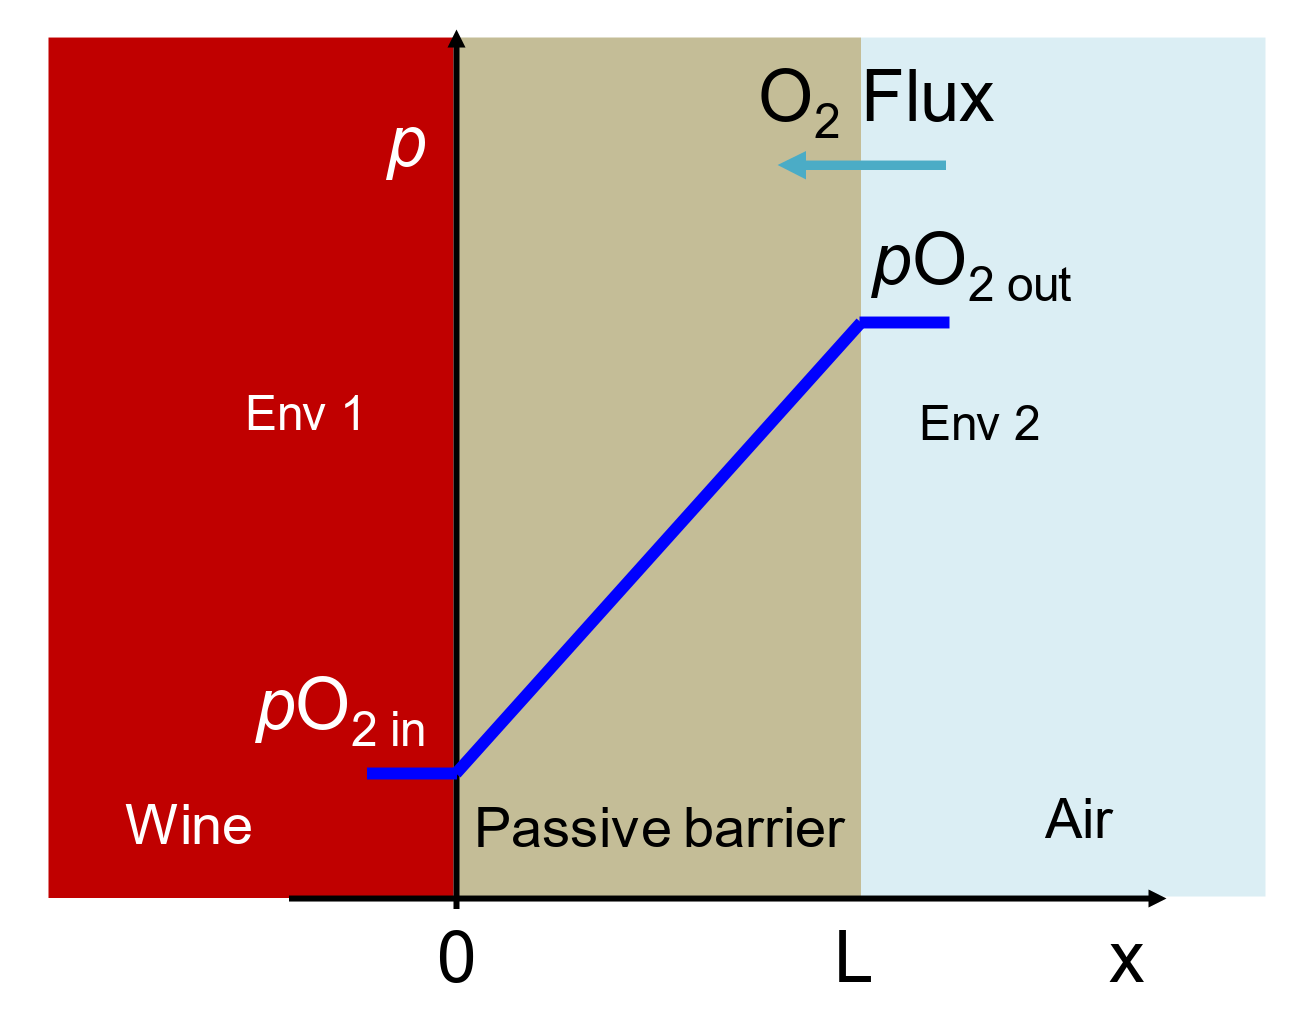
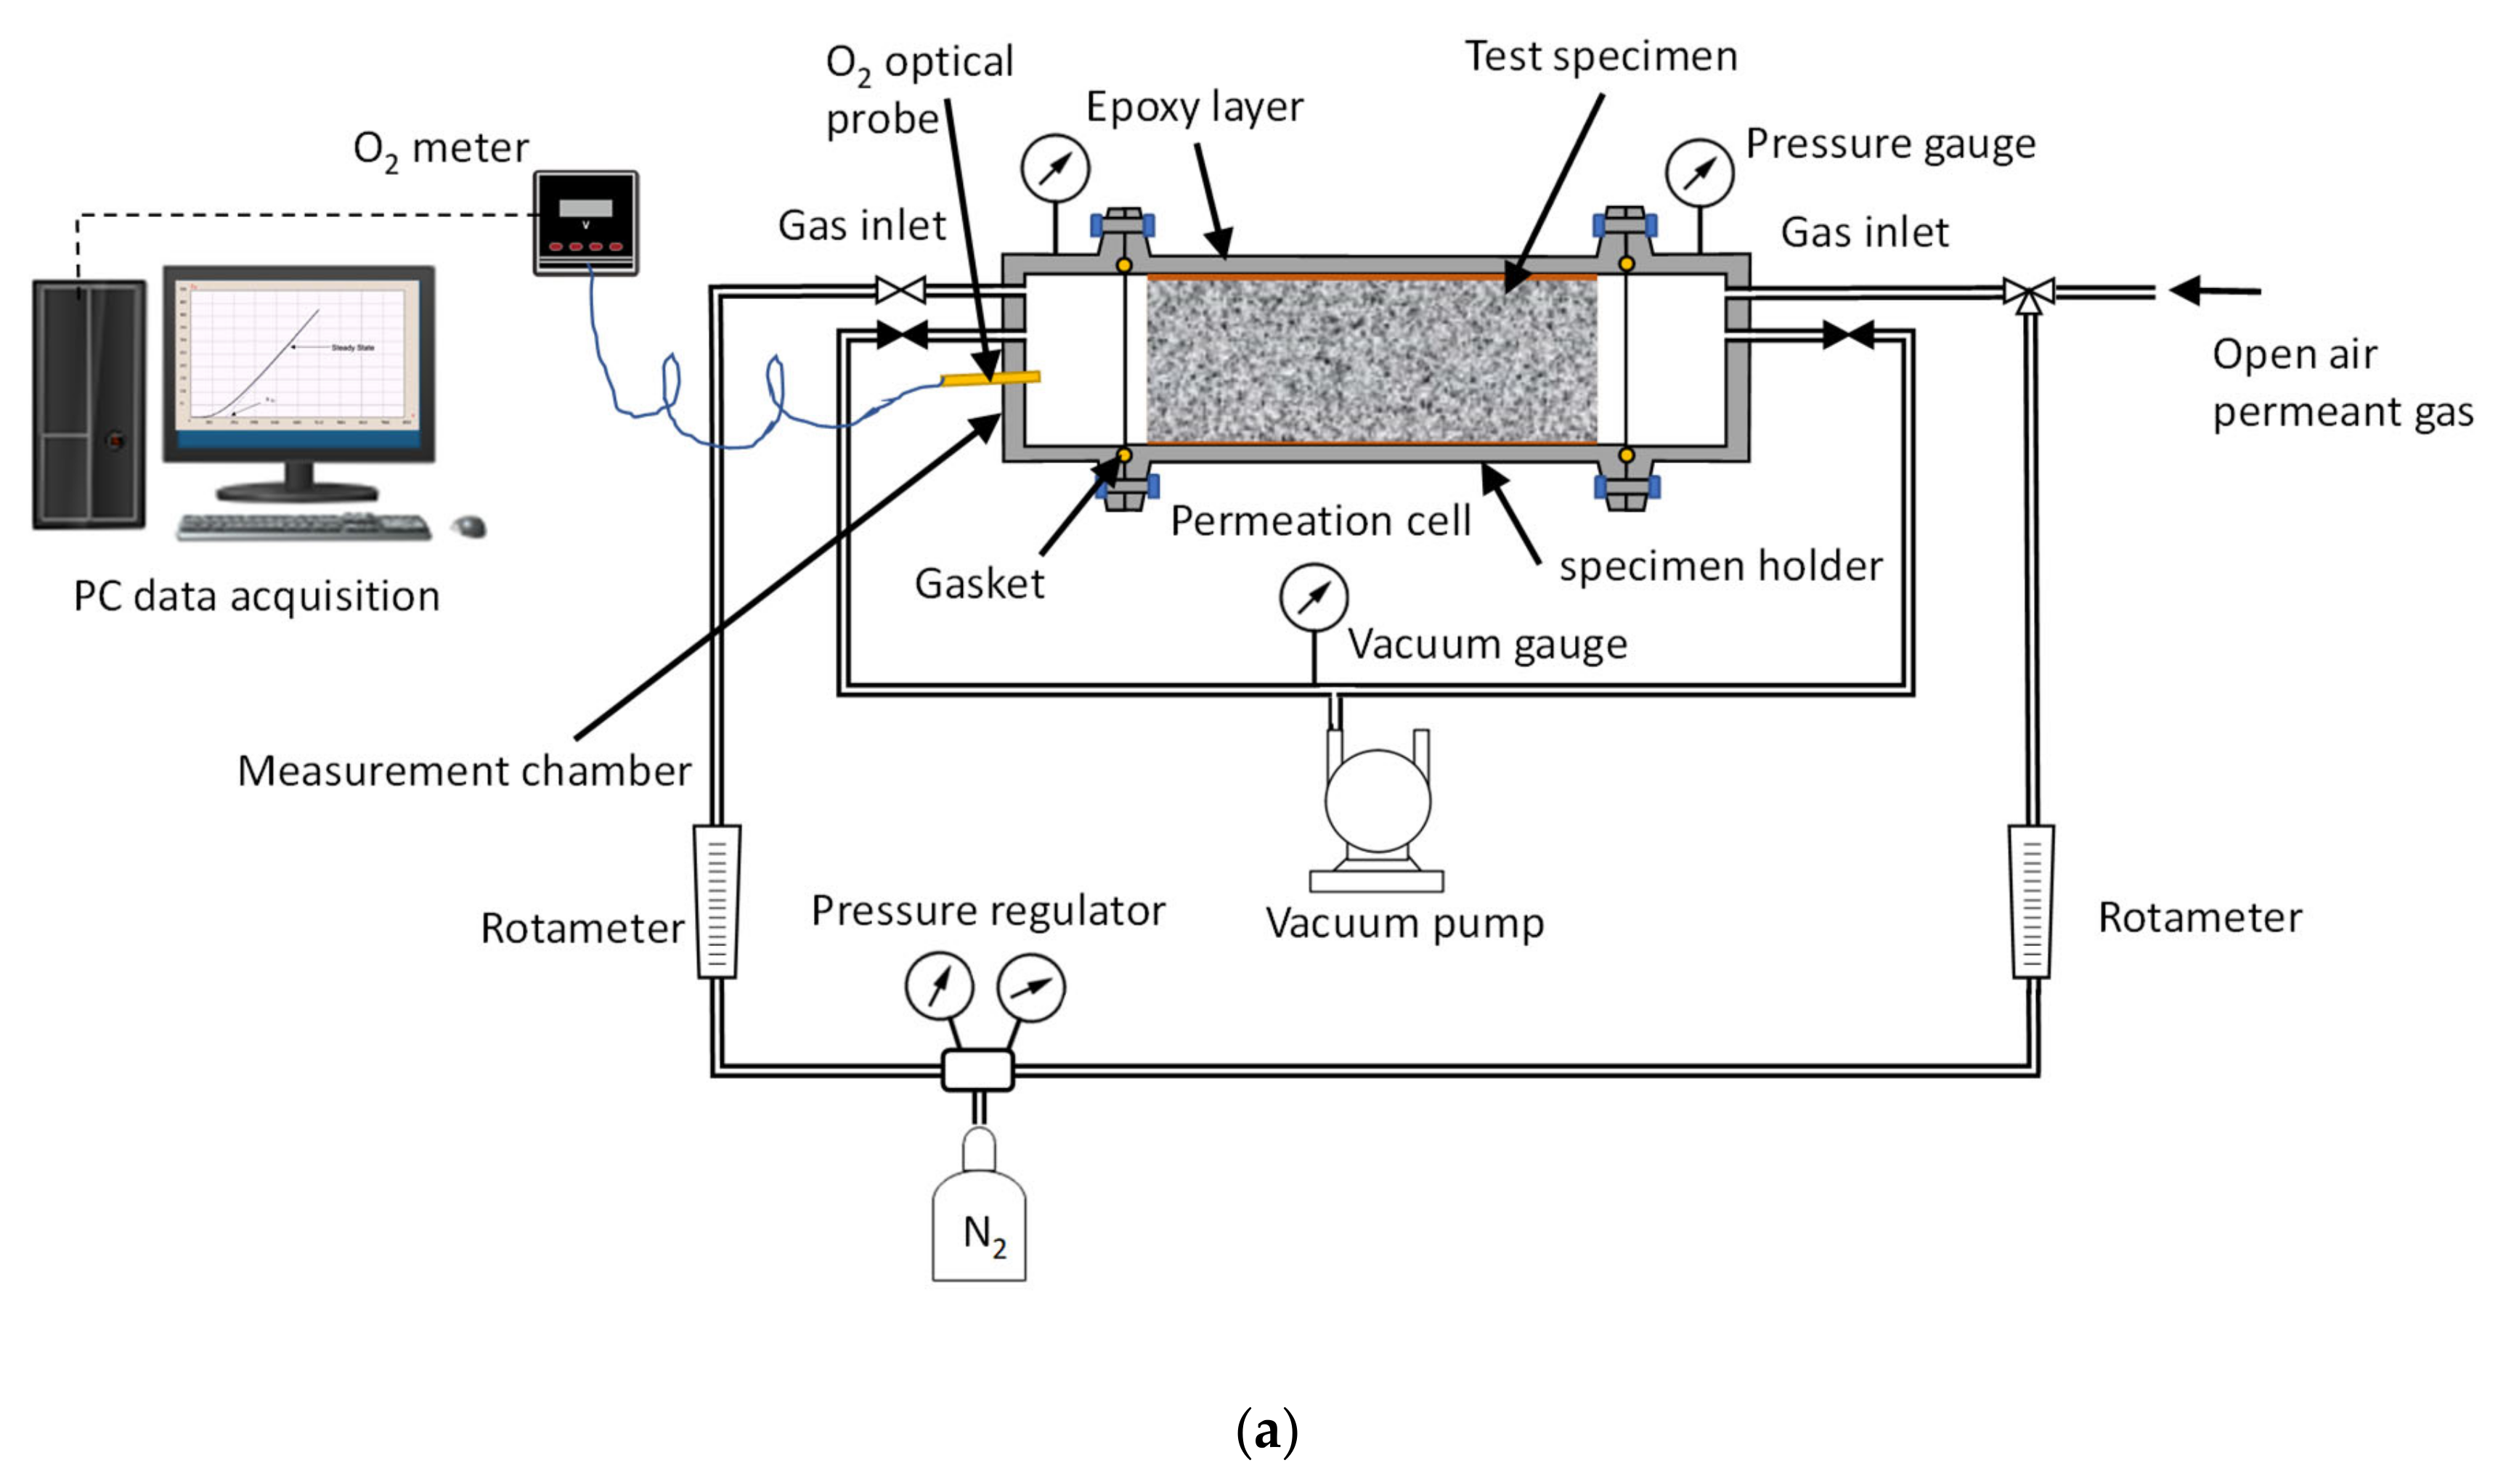
2.3. Time Lag Test Setup and Procedure
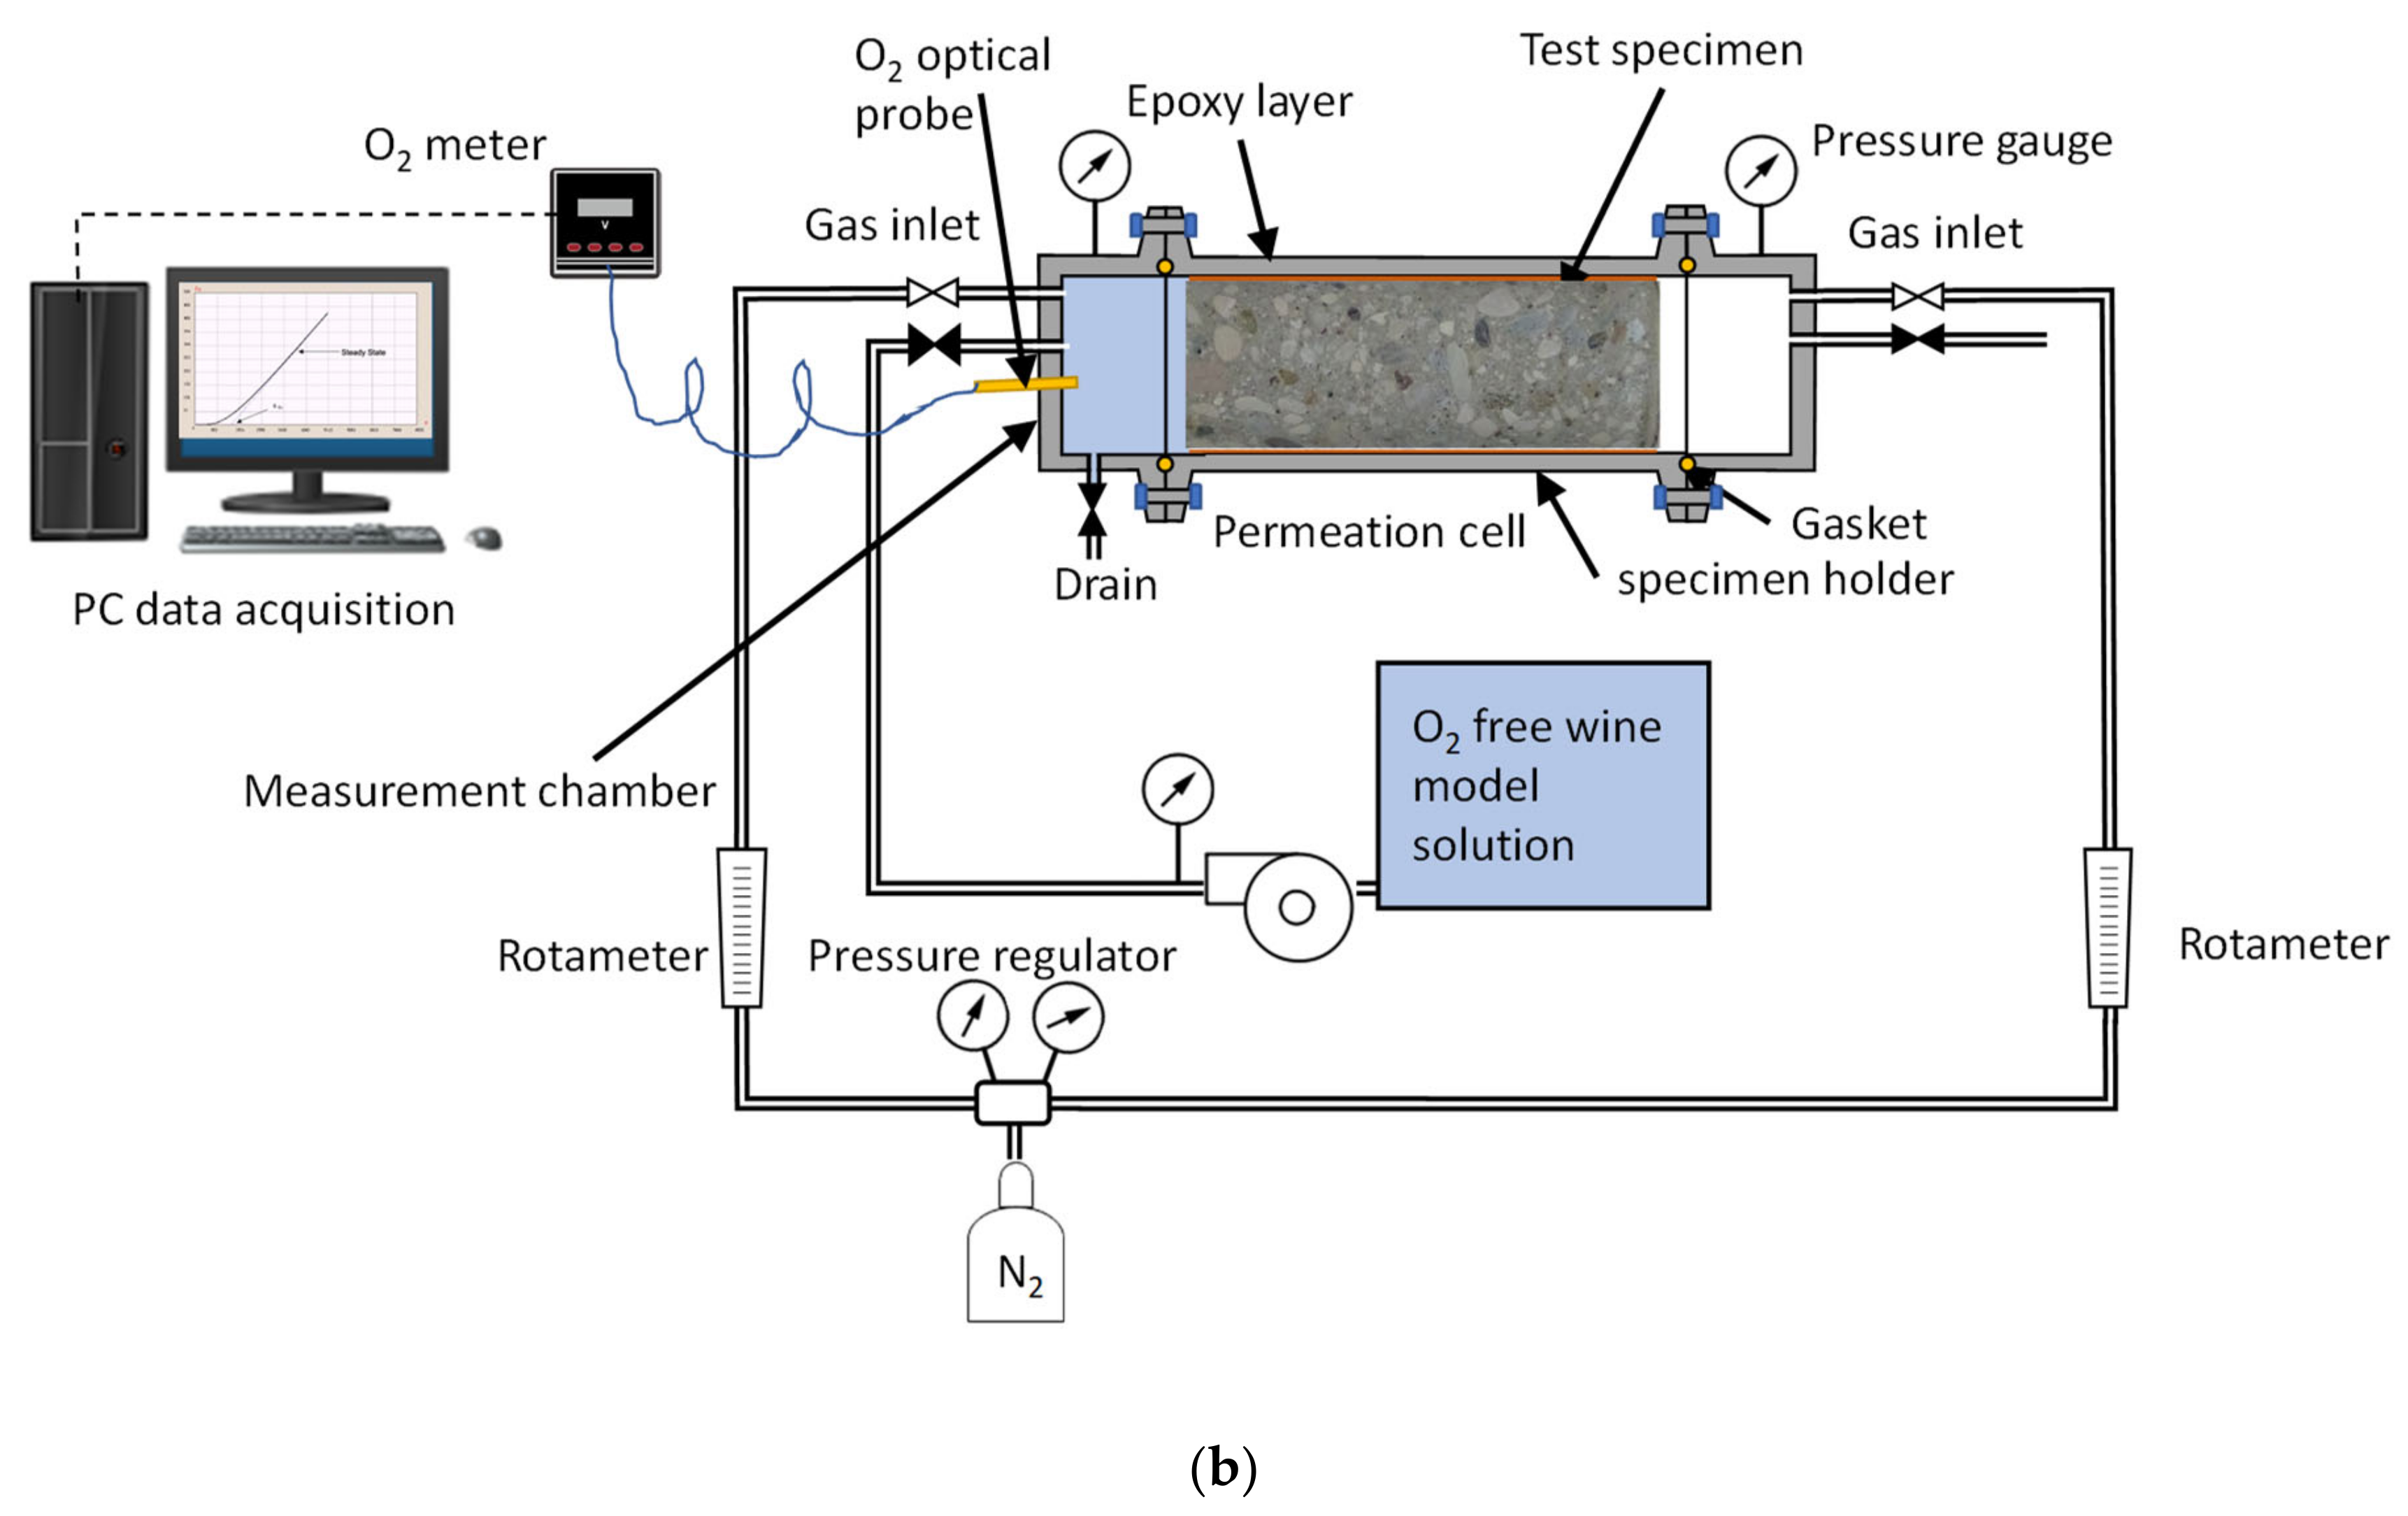
2.4. Permeation Test in Fluid, Dry Mode, Wet Mode, and Liquid Contact Mode
3. Results
3.1. Clay or Earthenware
3.1.1. Earthenware from Spanish Amphorae
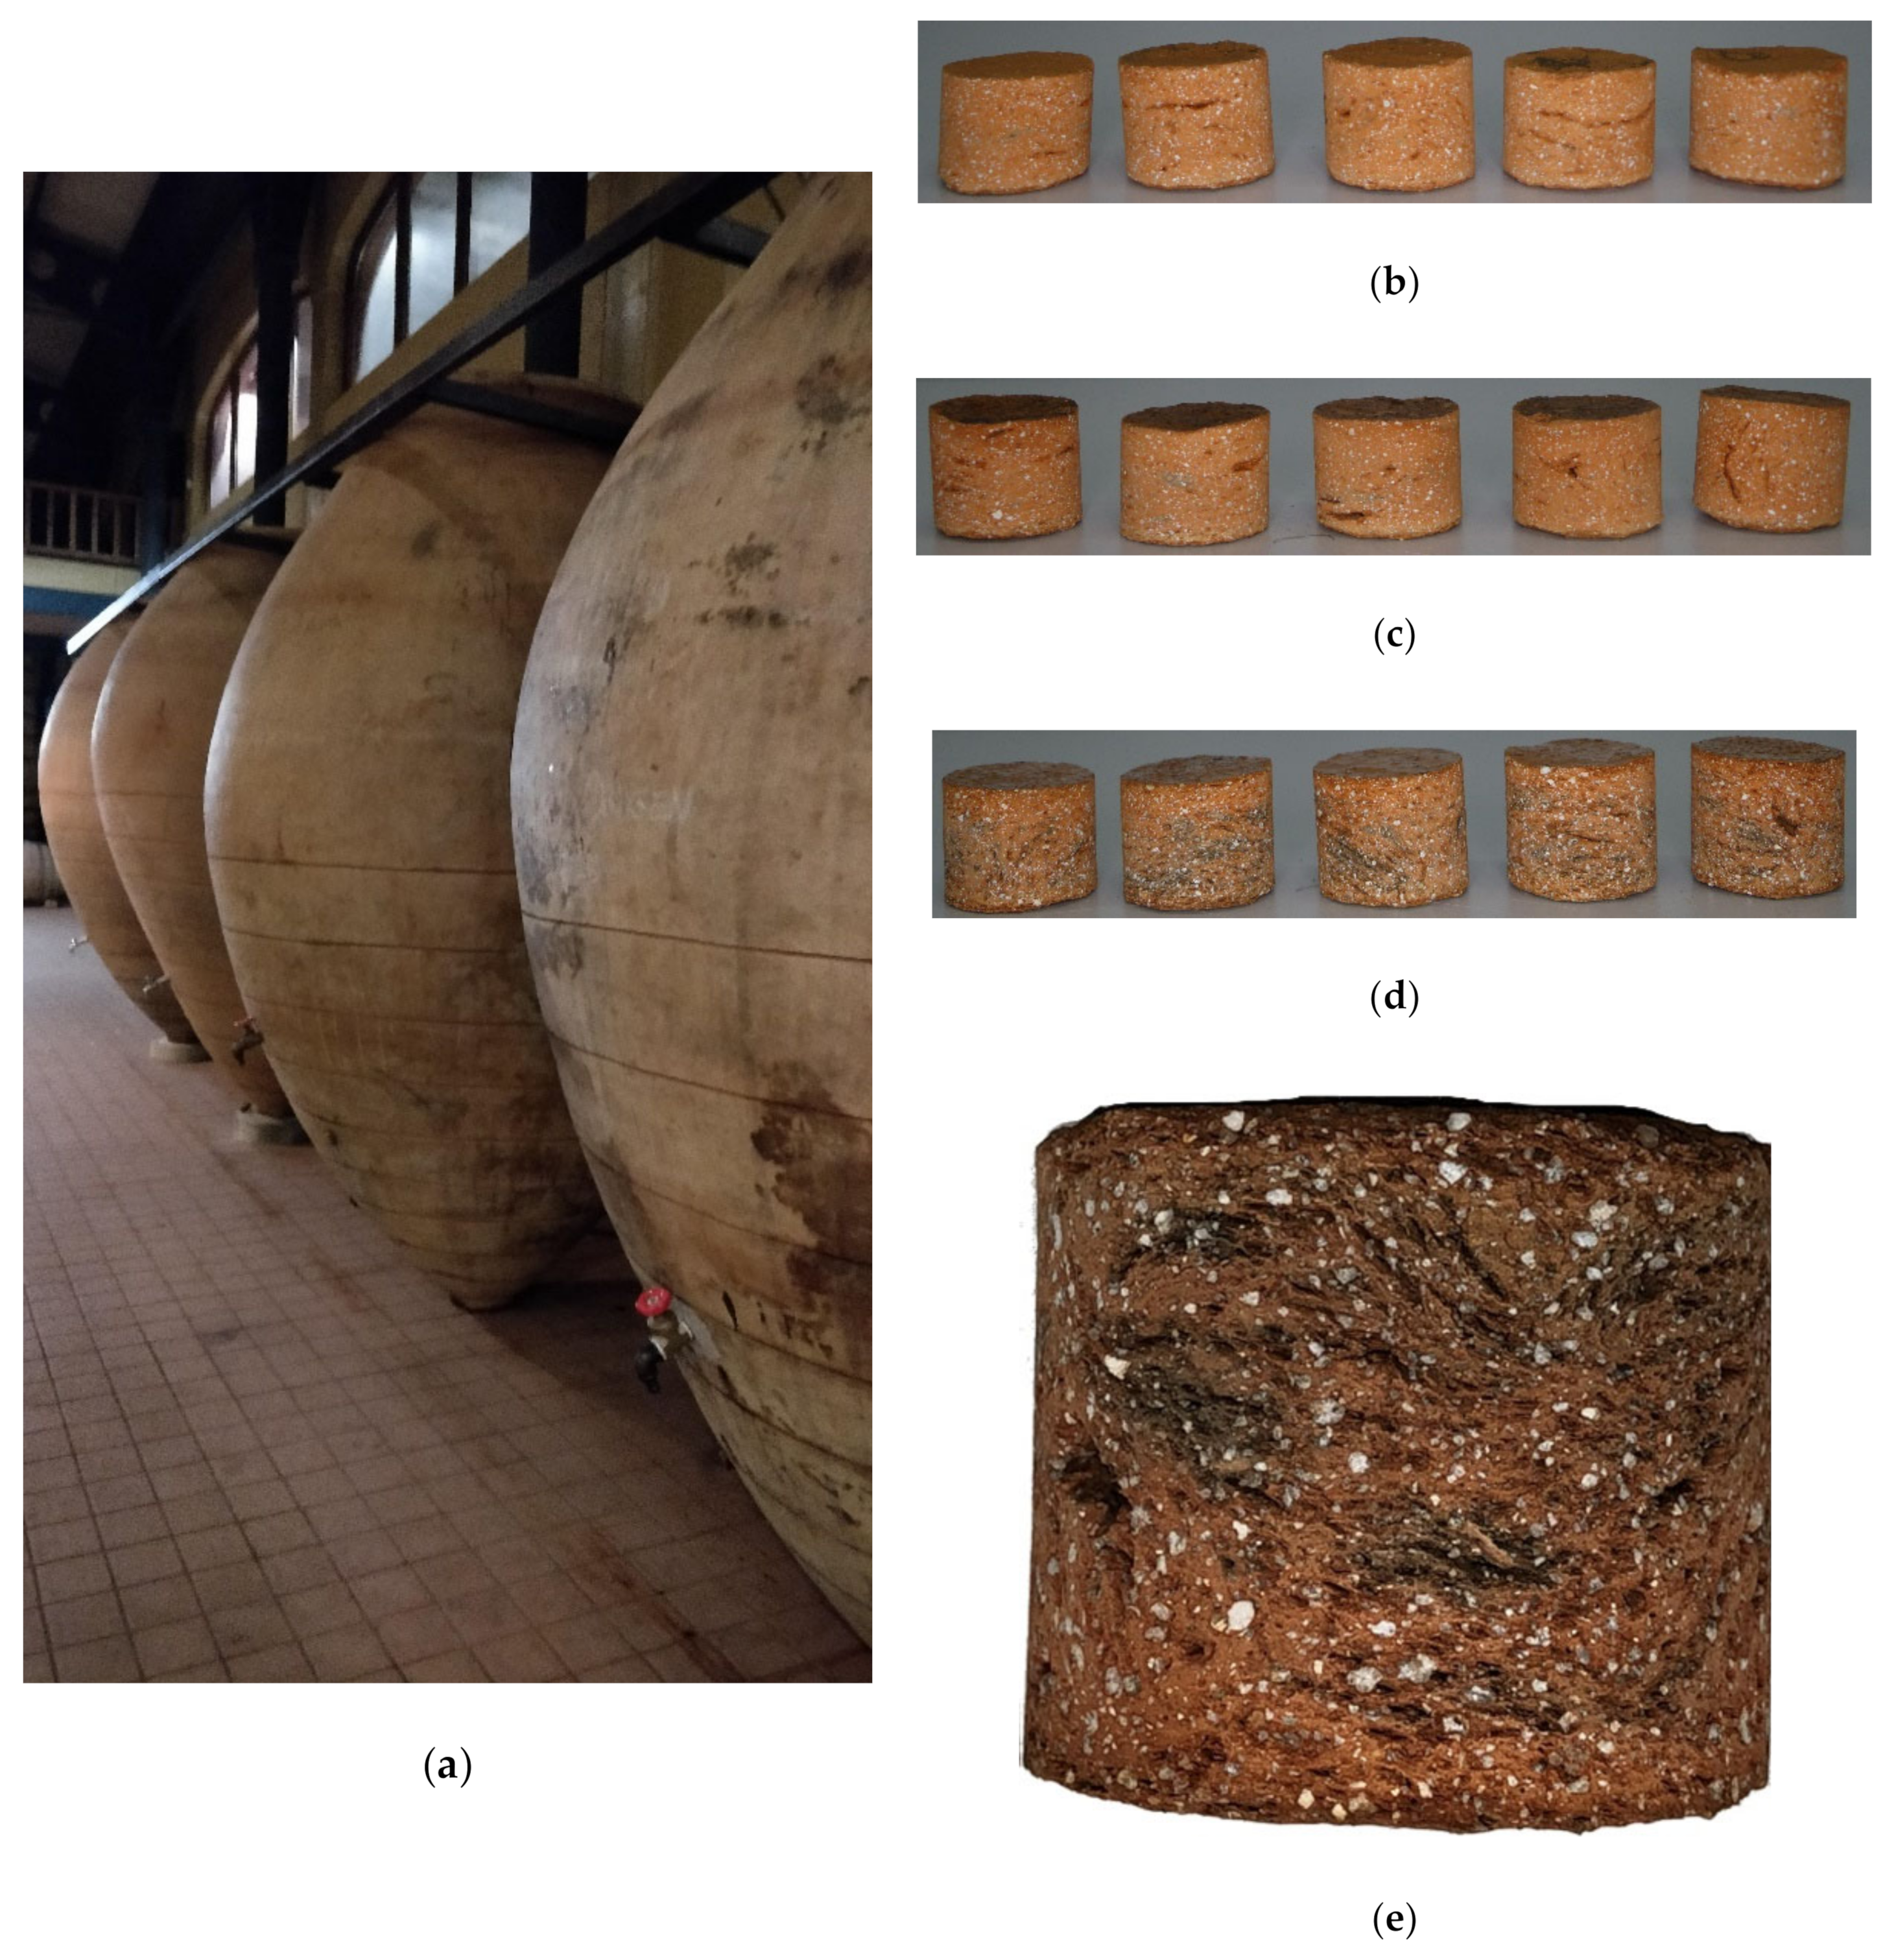
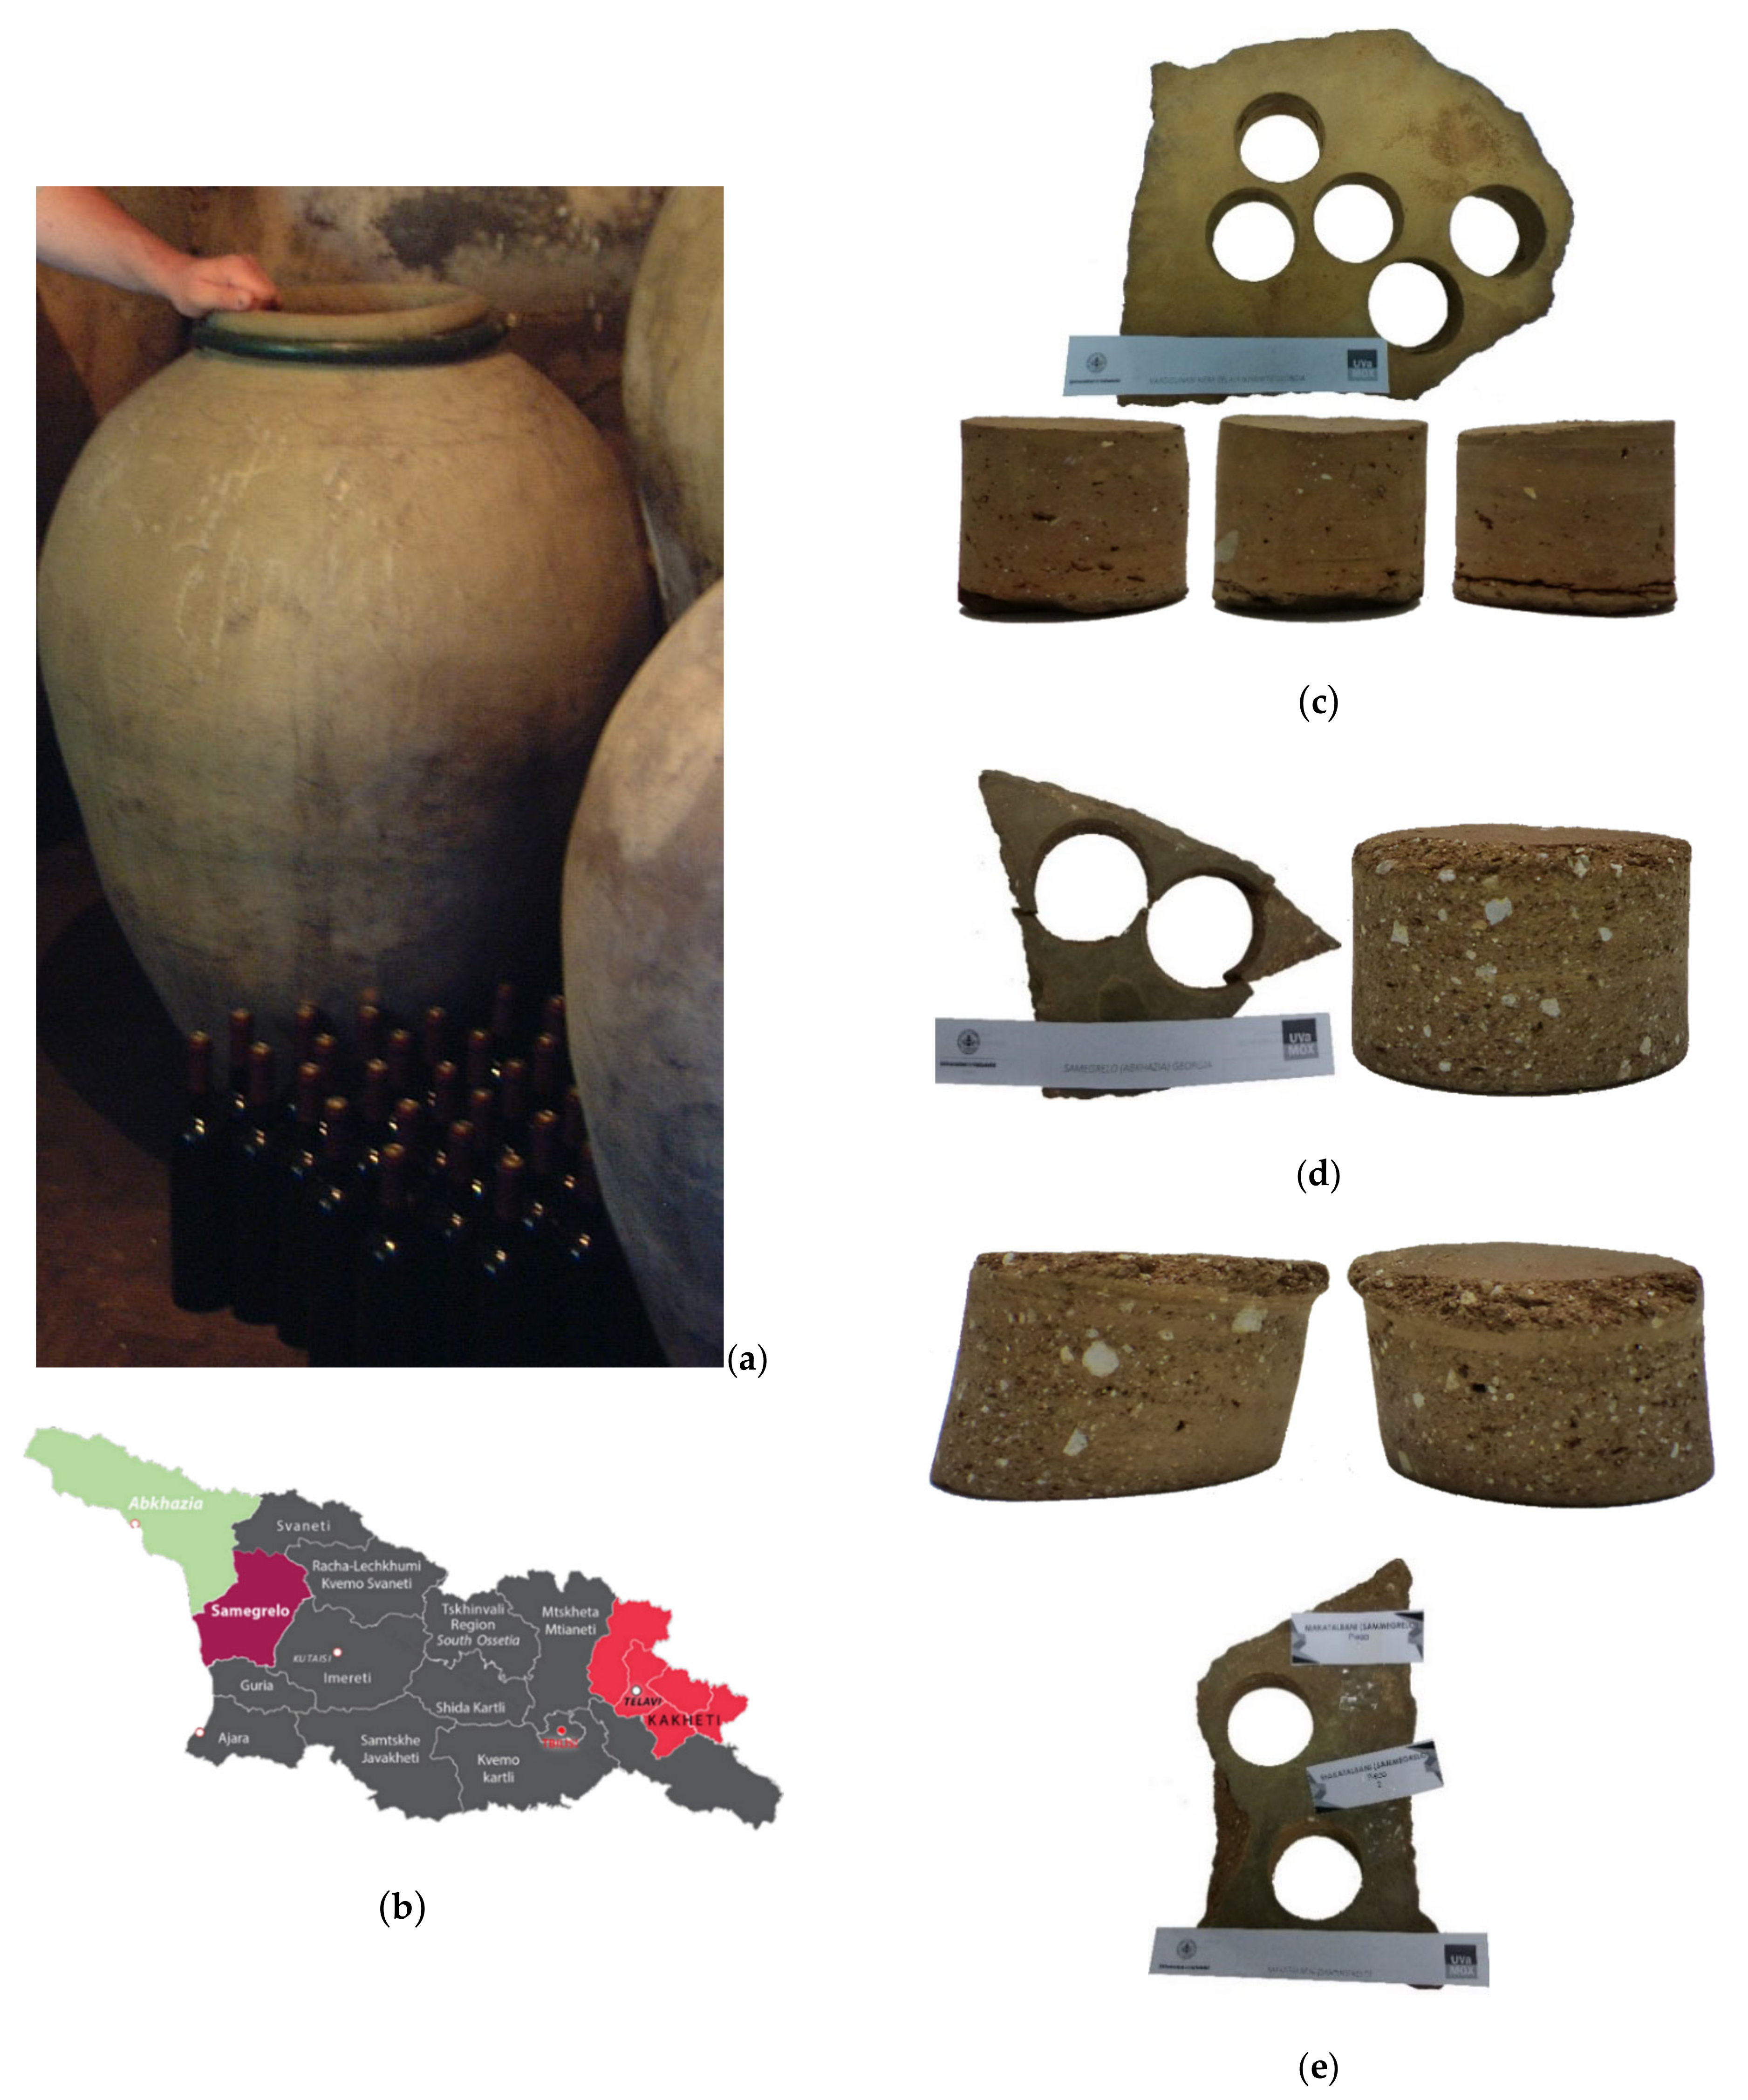
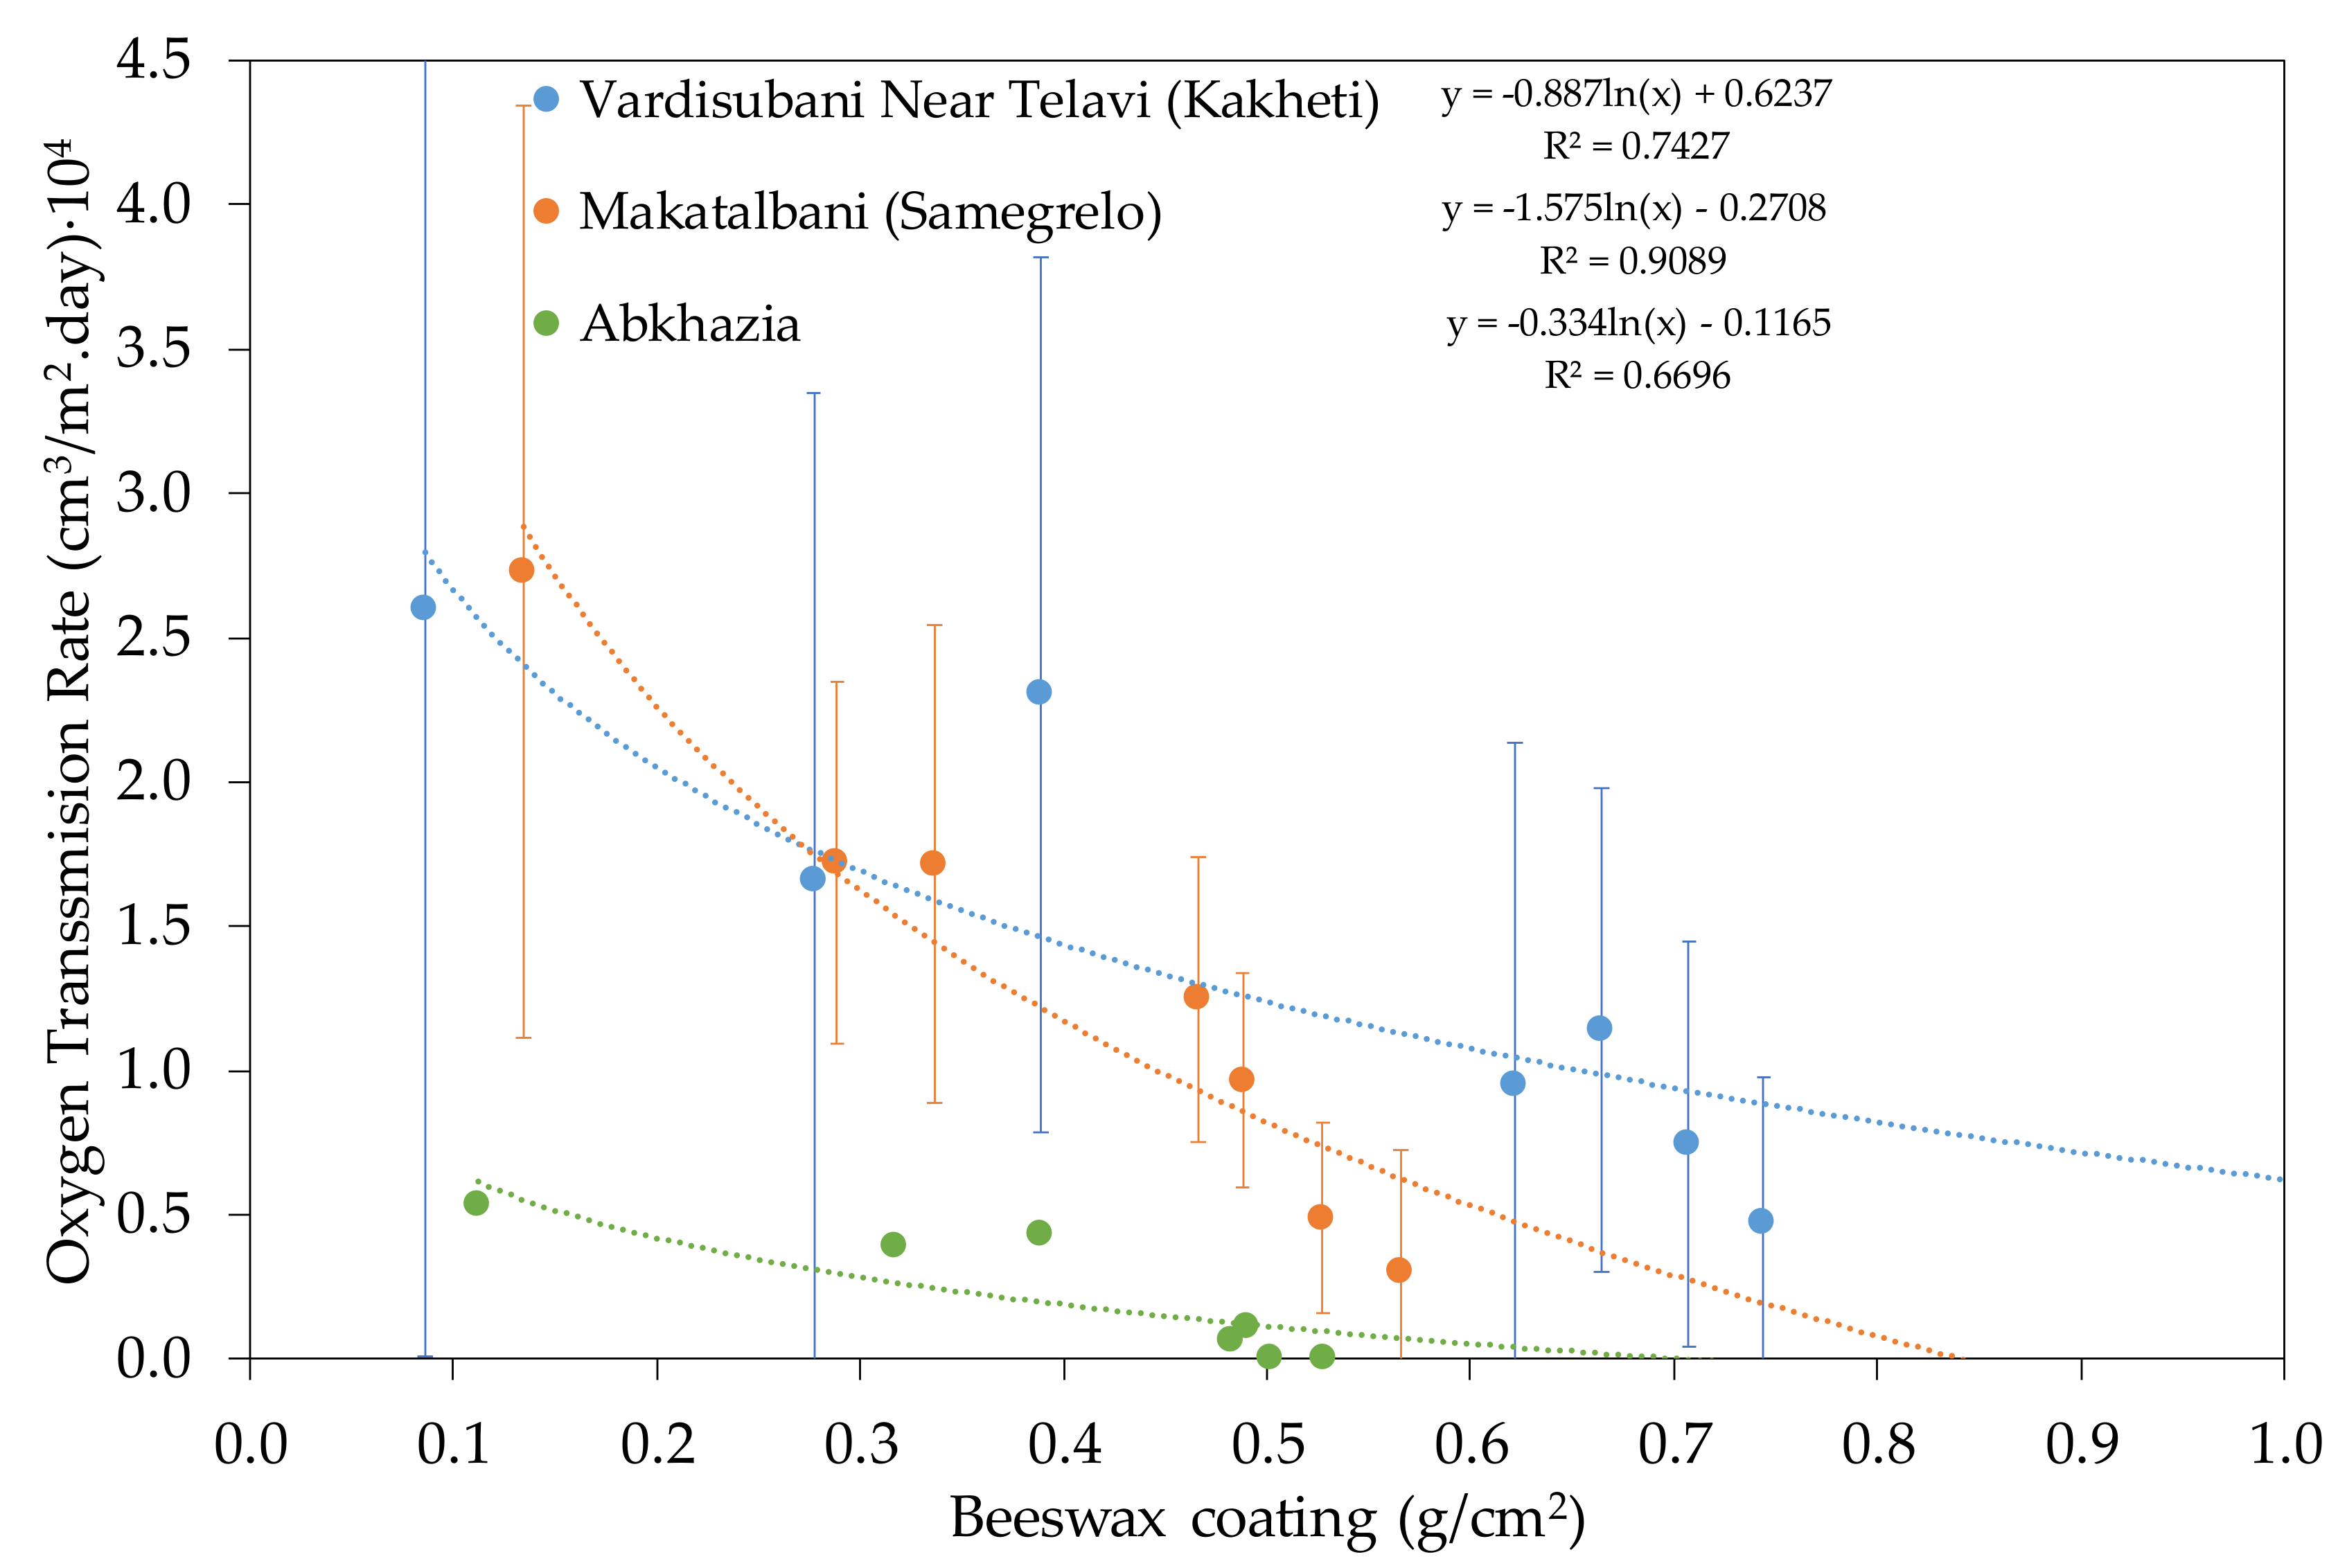
3.1.2. Qvevri from Georgia
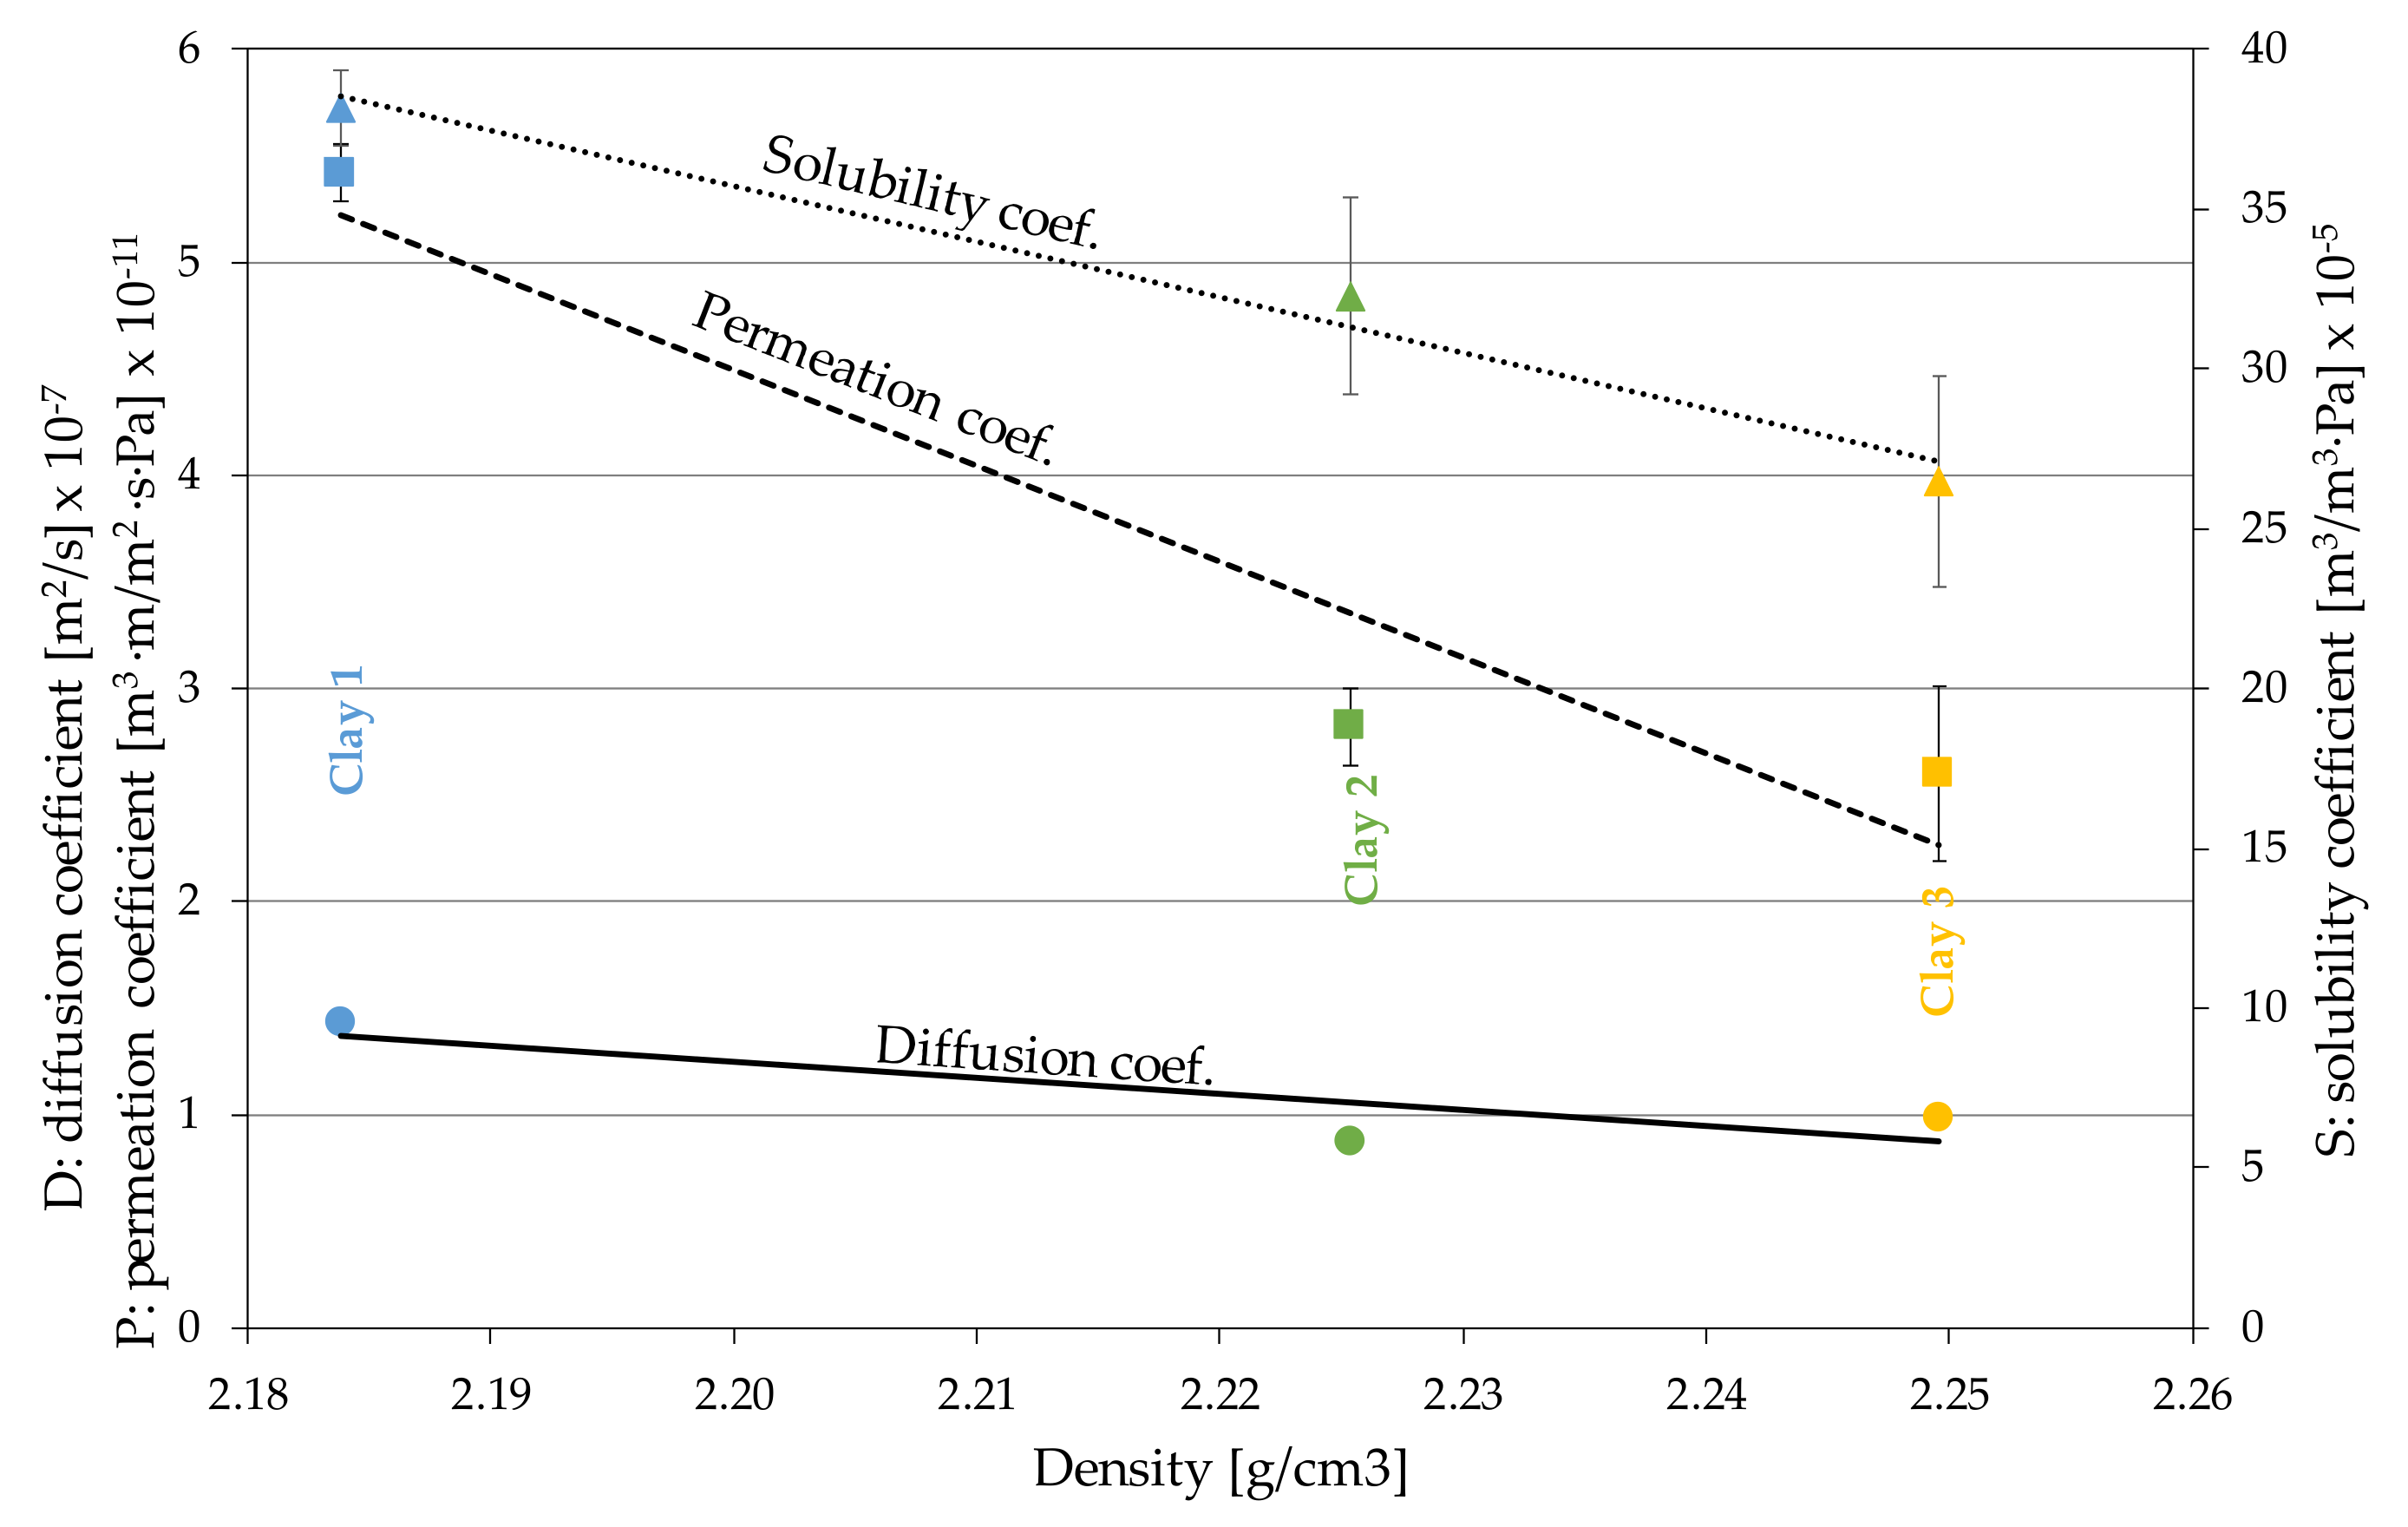
3.2. Claystone or Stoneware
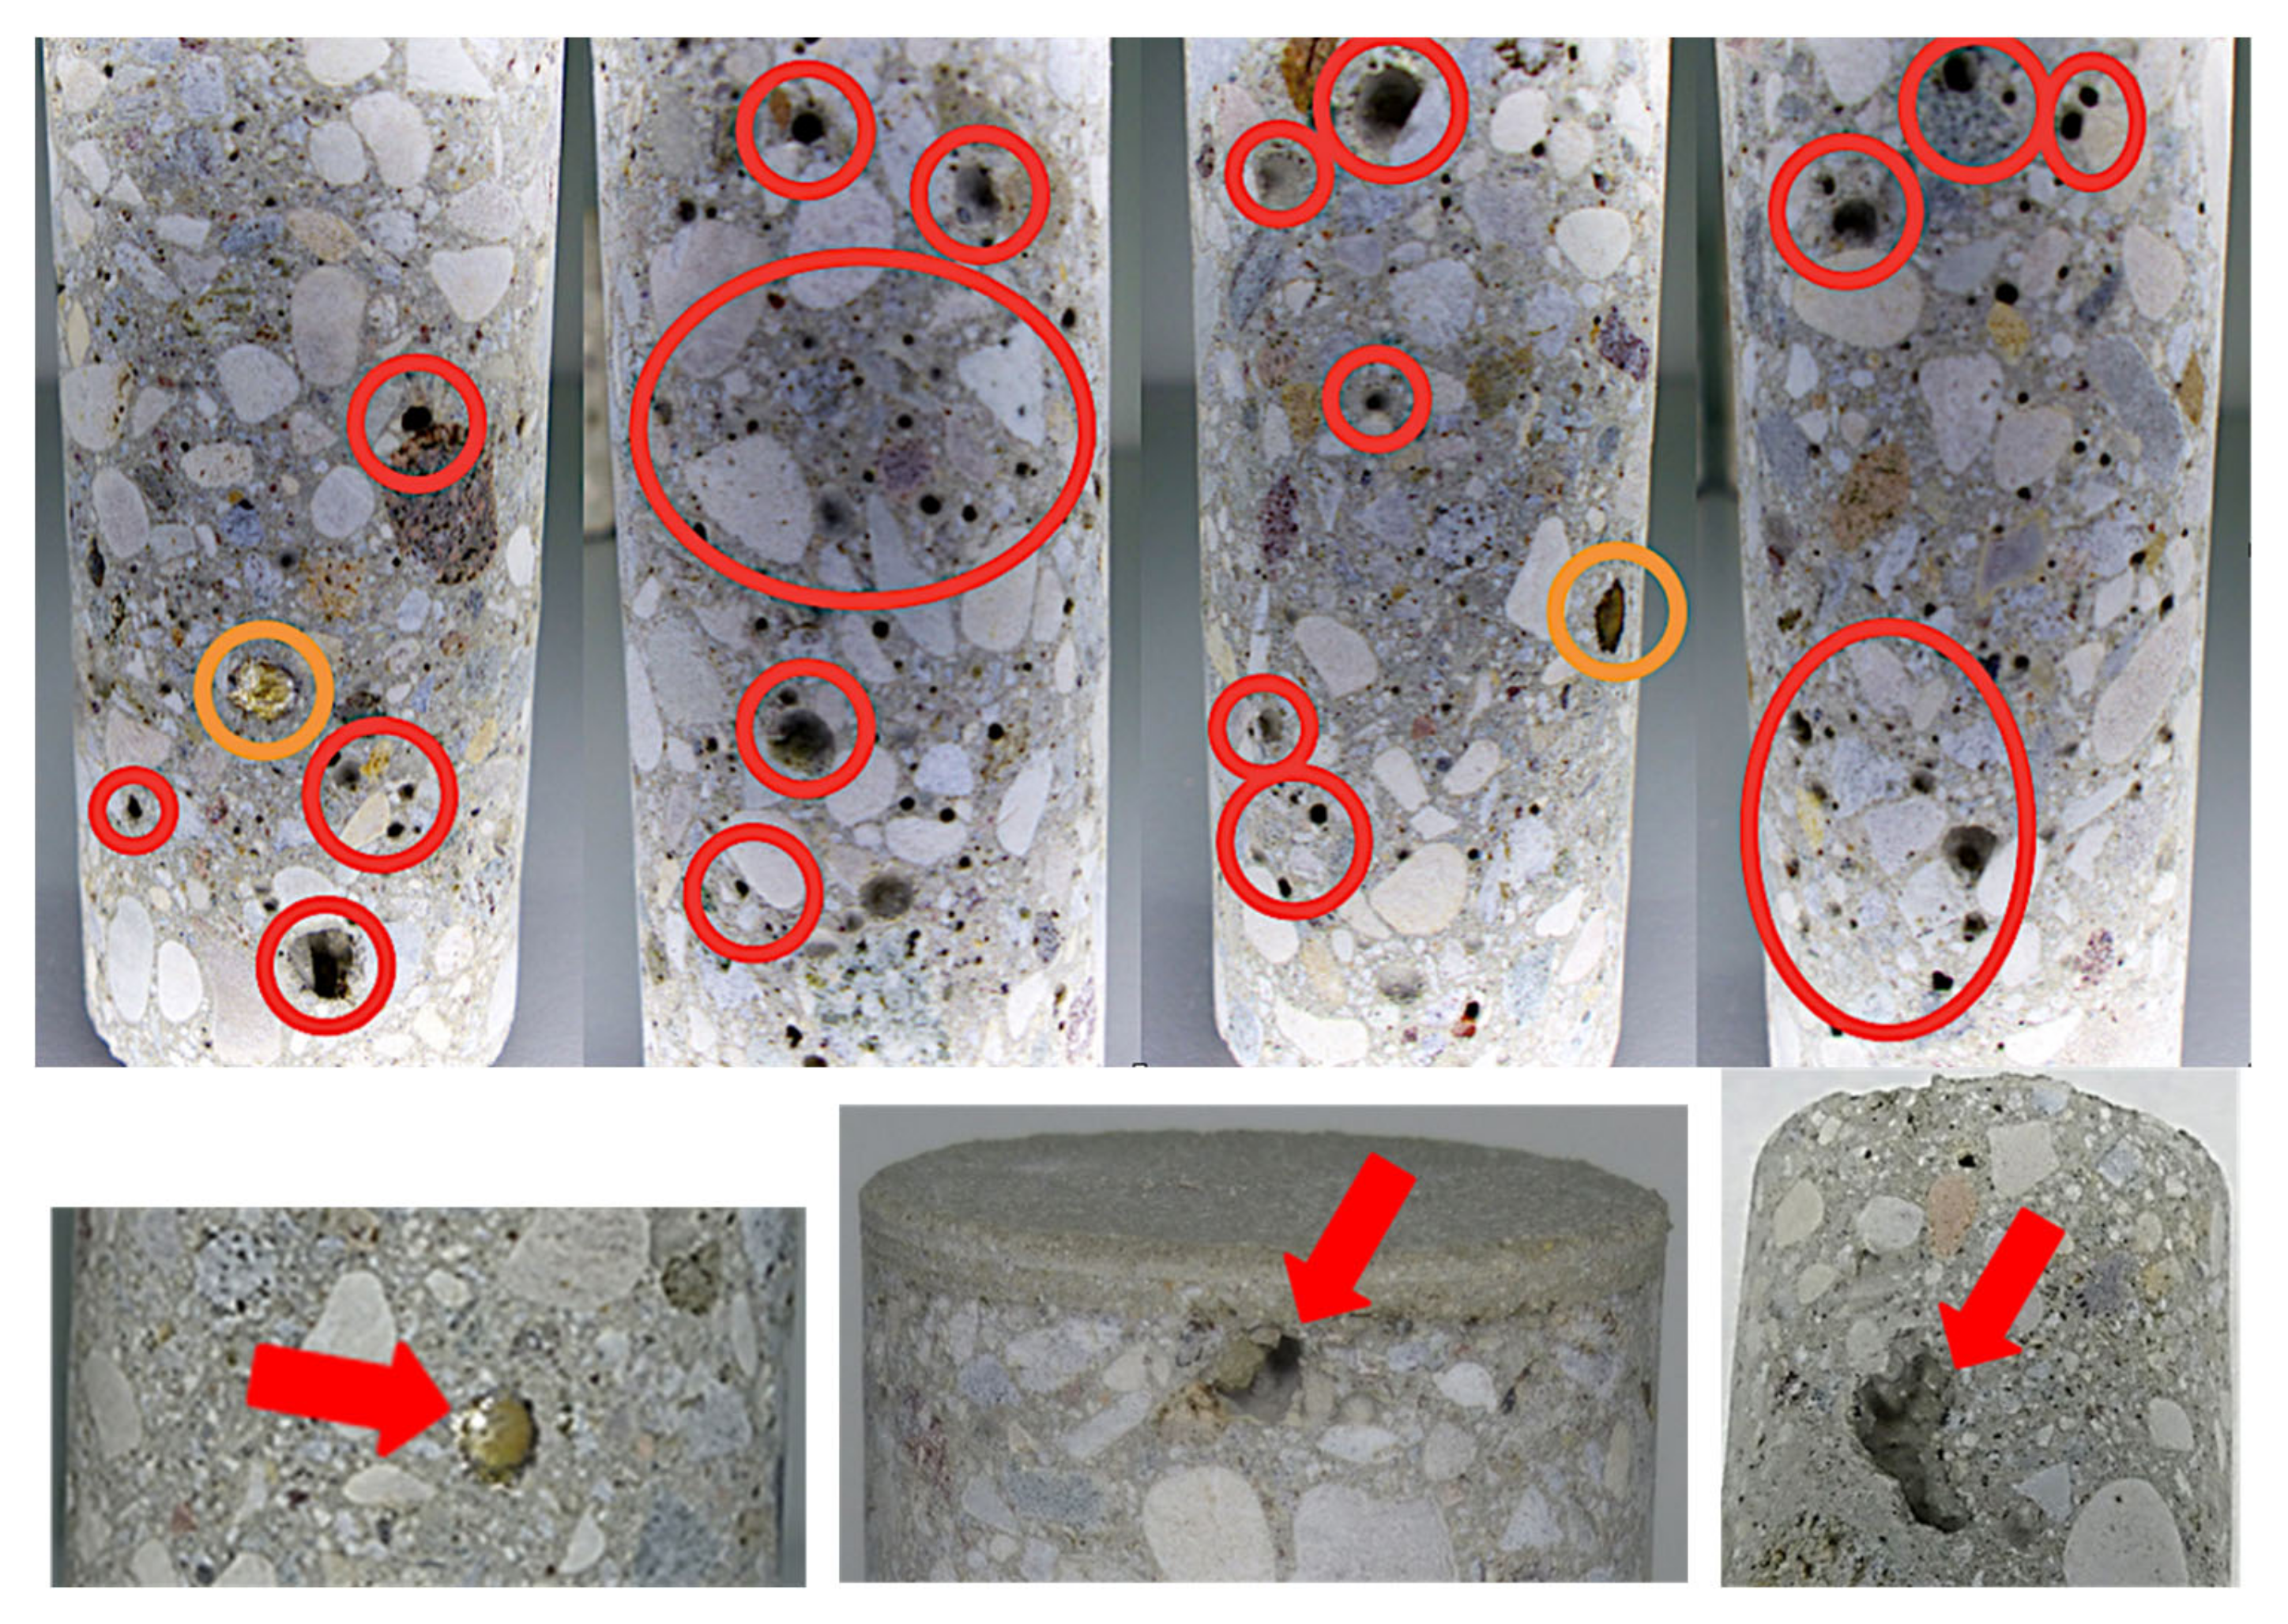
3.3. Concrete
3.3.1. Concrete samples C-RB
3.3.2. Concrete Samples C-DVTec
3.4. Granite
4. Discussion
4.1. Clay or Earthenware
4.2. Claystone
4.3. Concrete
4.4. Granite
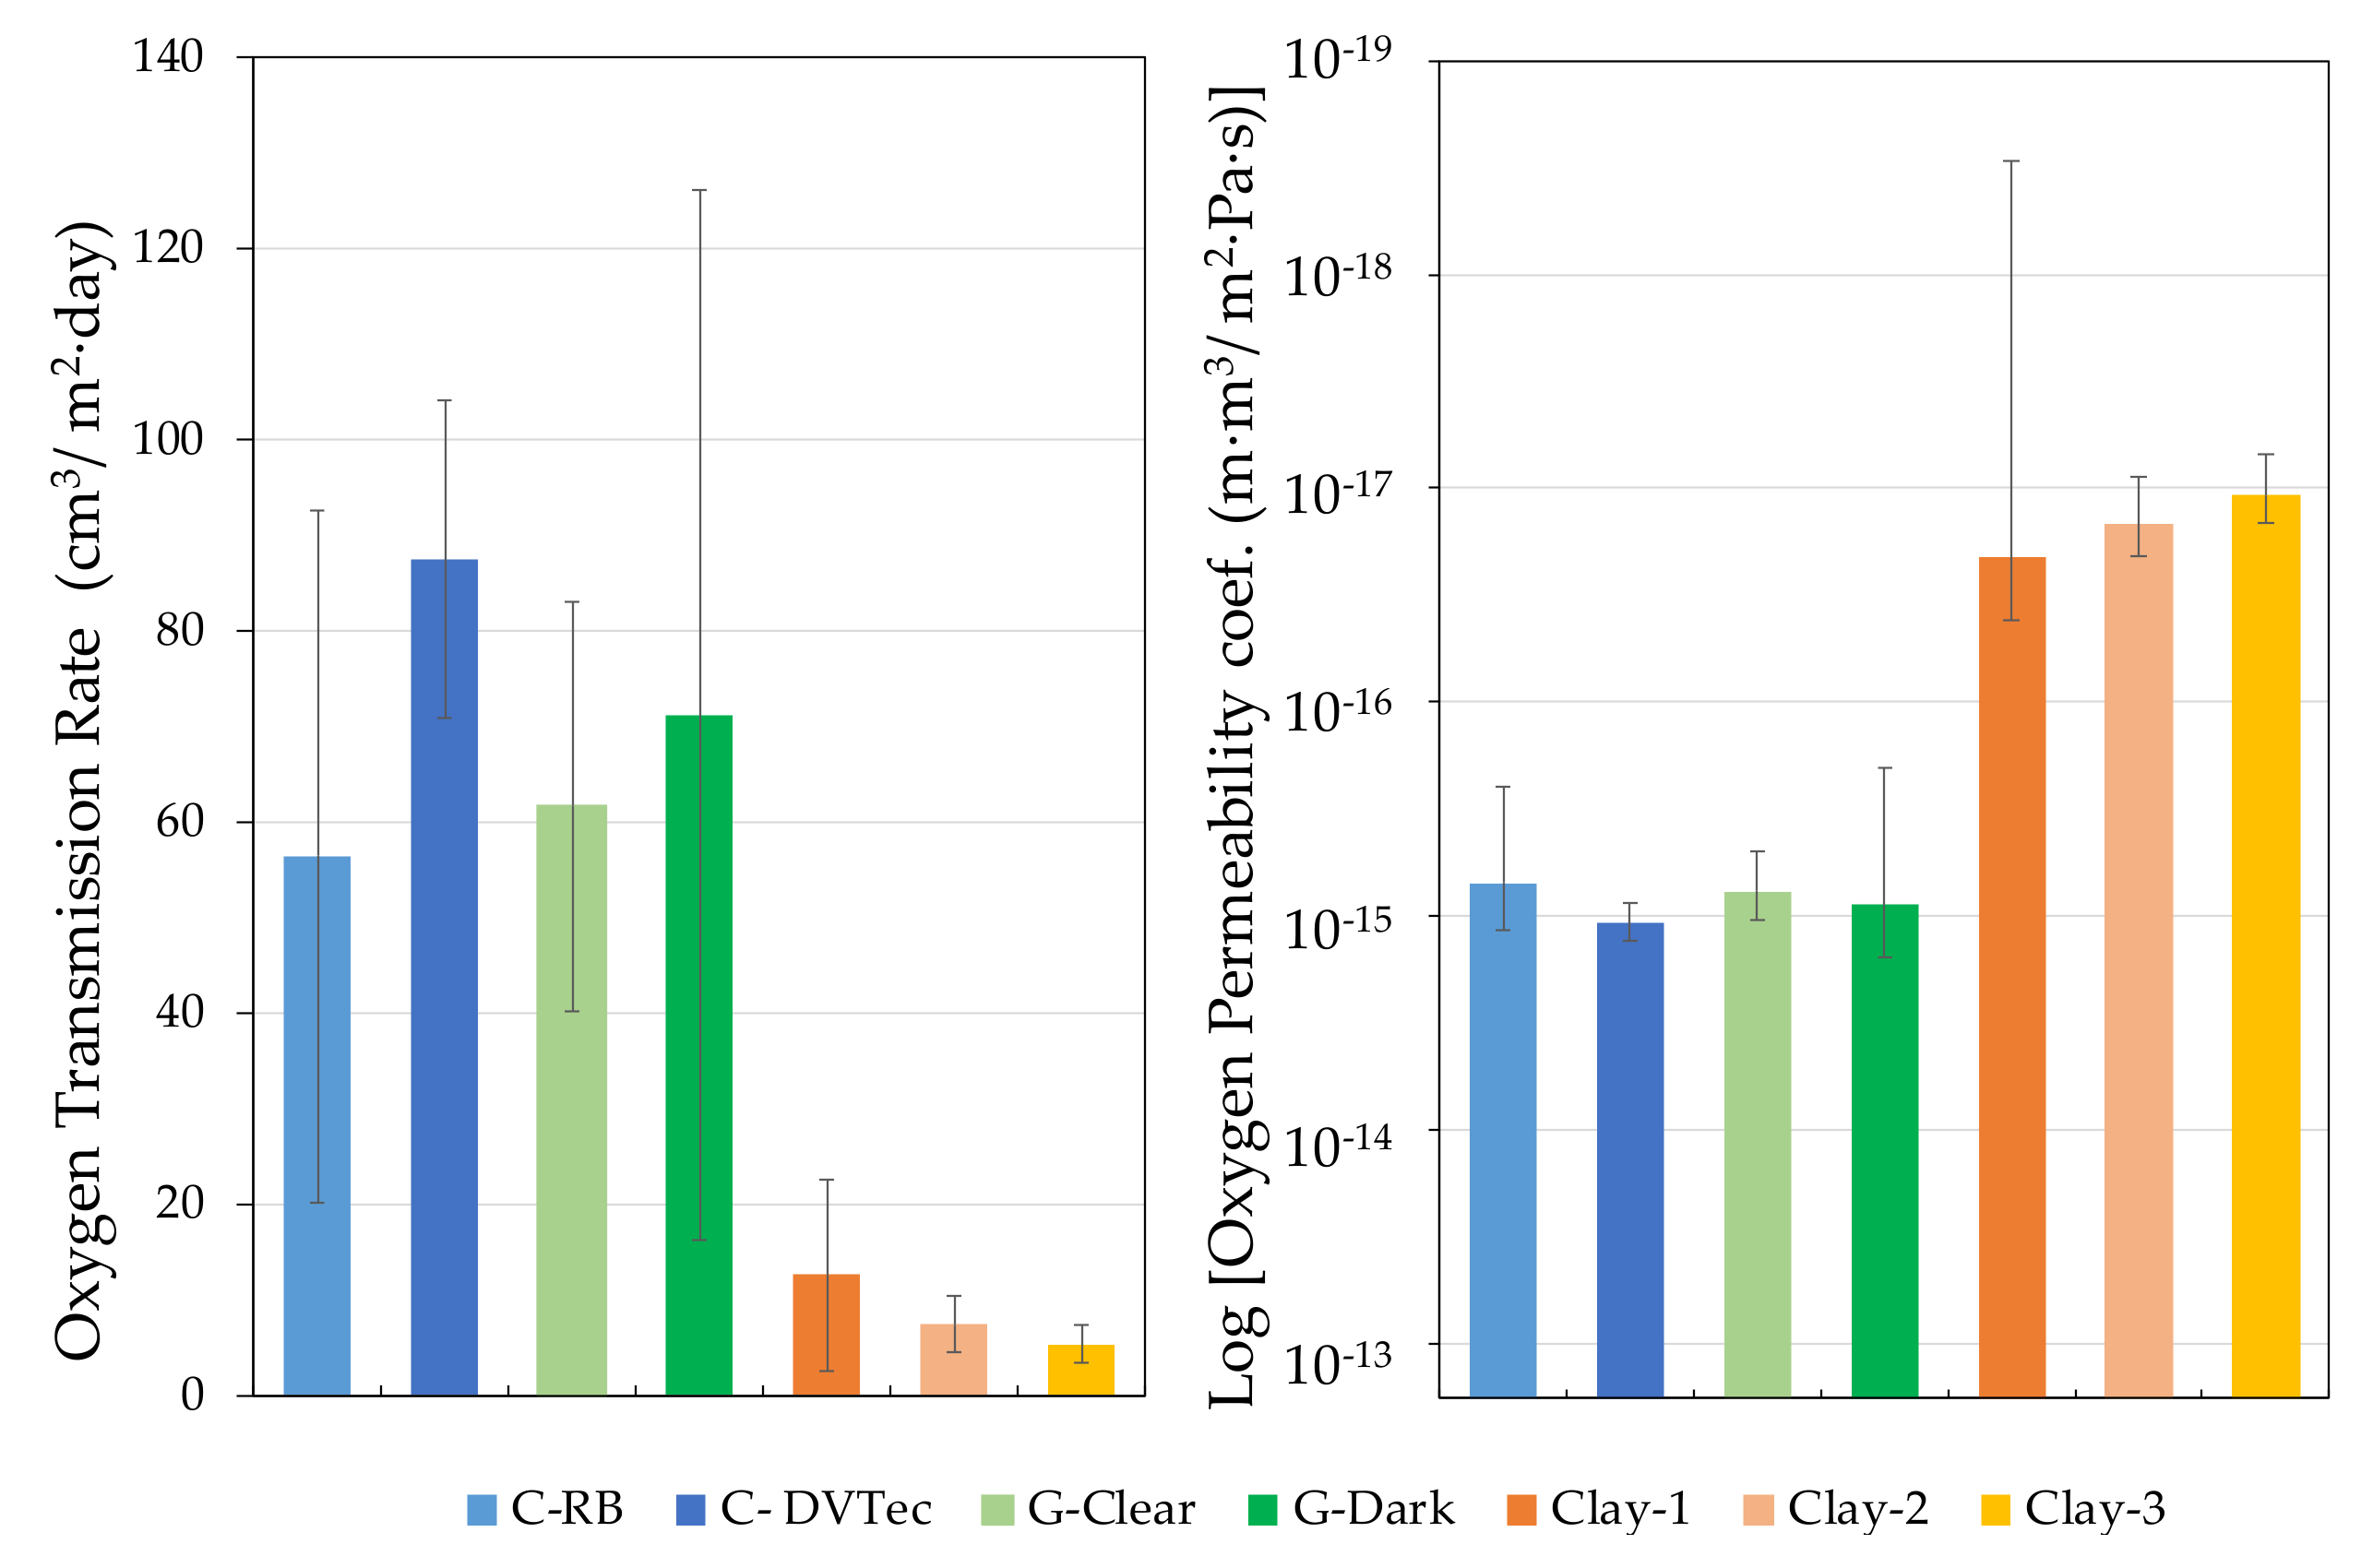
4.5. Comparison of Materials for the Construction of Wine Tanks
5. Conclusions
Author Contributions
Funding
Institutional Review Board Statement
Informed Consent Statement
Data Availability Statement
Acknowledgments
Conflicts of Interest
References
- Nevares, I.; Del Alamo-Sanza, M. New materials for the aging of wines and beverages: Evaluation and comparison. In Food Packaging and Preservation; Elvisier: Amsterdam, The Netherlands, 2018; pp. 375–407. [Google Scholar]
- De Angelis, M.G. Solubility coefficient (S). In Encyclopedia of Membranes; Drioli, E., Giorno, L., Eds.; Springer: Berlin/Heidelberg, Germany, 2014; pp. 1–5. ISBN 978-3-642-40872-4. [Google Scholar]
- Müller, K.; Scheuerer, Z.; Florian, V.; Skutschik, T.; Sängerlaub, S. Comparison of test methods for oxygen permeability: Optical method versus carrier gas method. Polym. Test. 2017, 63, 126–132. [Google Scholar] [CrossRef]
- Larsen, H.; Kohler, A.; Magnus, E.M. Ambient oxygen ingress rate method. An alternative method to Ox-Tran for measuring oxygen transmission rate of whole packages. Packag. Technol. Sci. 2000, 13, 233–241. [Google Scholar] [CrossRef]
- American Society for Testing and Materials D1434-82. Standard Test Method for Determining Gas Permeability Characteristics of Plastic Film and Sheeting; Annu., B., Ed.; ASTM Stand.: West Conshohocken, PA, USA, 2021; Volume 82, p. 615. [Google Scholar] [CrossRef]
- International Standard Organization (ISO) 15105-1. Plastics—Film and Sheeting—Determination of Gas-Transmission Rate—Part 1: Differential-Pressure Methods; International Standard Organization: Geneva, Switzerland, 2007; TC 61 Plas. [Google Scholar]
- German Institute for Standardization DIN 53380-2:2006-11. Testing of Plastics—Determination of Gas Transmission Rate—Part 2: Manometric Method for Testing of Plastic Films; Beuth Publishing DIN: Berlin, Germany, 2006. [Google Scholar] [CrossRef]
- German Institute for Standardization DIN 53380-1:2000-07. Testing of Plastics—Determination of Gas Transmission Rate—Part 1: Volumetrical Method for Testing of Plastic Films; Beuth Publishing DIN: Berlin, Germany, 2000; pp. 4–7. [Google Scholar] [CrossRef]
- American Society for Testing and Materials D3985-05. Standard Test Method for Oxygen Gas Transmission Rate Through Plastic Film and Sheeting Using a Coulometric Sensor; ASTM Stand.: West Conshohocken, PA, USA, 2005; Volume 15. [Google Scholar]
- German Institute for Standardization DIN 53380-3: 1998-07. Testing of Plastics—Determination of Gas Transmission Rate—Part 3: Oxygen-Specific Carrier Gas Method for Testing of Plastic Films and Plastics Mouldings; Beuth Publishing DIN: Berlin, Germany, 1998. [Google Scholar] [CrossRef]
- International Standard Organization (ISO) 15105-2. Plastics—Film and Sheeting—Determination of Gas-Transmission Rate—Part 2: Equal-Pressure Method; International Standard Organization: Geneva, Switzerland, 2003; TC 61 Plas. [Google Scholar]
- German Institute for Standardization DIN 53380-5:2014-12. Testing of Plastics—Determination of Gas Transmission Rate—Part 5: Optical Method for Plastic Films and Moulded Plastic Parts; Beuth Publishing DIN: Berlin, Germany, 2014. [Google Scholar] [CrossRef]
- American Society for Testing and Materials F3136-15. Standard Test Method for Oxygen Gas Transmission Rate through Plastic Film and Sheeting Using a Dynamic Accumulation Method 1; ASTM Stand.: West Conshohocken, PA, USA, 2015; Volume 15. [Google Scholar] [CrossRef]
- American Society for Testing and Materials F2714-08(2013). Standard Test Method for Oxygen Headspace Analysis of Packages Using Fluorescent; ASTM Stand.: West Conshohocken, PA, USA, 2008; Volume 8, pp. 1–4. [Google Scholar] [CrossRef]
- Lomax, M. Permeation of gases and vapours through polymer films and thin sheet—part I. Polym. Test. 1980, 1, 105–147. [Google Scholar] [CrossRef]
- Al-Ismaily, M.; Wijmans, J.; Kruczek, B. A shortcut method for faster determination of permeability coefficient from time lag experiments. J. Membr. Sci. 2012, 165–174. [Google Scholar] [CrossRef]
- Shah, M.R.; Noble, R.D.; Clough, D.E. Measurement of sorption and diffusion in nonporous membranes by transient permeation experiments. J. Membr. Sci. 2007, 287, 111–118. [Google Scholar] [CrossRef]
- Diéval, J.-B.; Vidal, S.; Aagaard, O. Measurement of the Oxygen Transmission Rate of Co-extruded Wine Bottle Closures Using a Luminescence-Based Technique. Packag. Technol. Sci. 2011, 24, 375–385. [Google Scholar] [CrossRef]
- Salvoldi, B.; Beushausen, H.; Alexander, M. Oxygen permeability of concrete and its relation to carbonation. Constr. Build. Mater. 2015, 85, 30–37. [Google Scholar] [CrossRef]
- Kollek, J.J. The determination of the permeability of concrete to oxygen by the Cembureau method—A recommendation. Mater. Struct. 1989, 22, 225–230. [Google Scholar] [CrossRef]
- Torrent, R.; Frenzer, G. A method for rapid determination of the coefficient of permeability of the “covercrete”. In Proceedings of the International Symposium Non-Destructive Testing in Civil Engineering, Berlin, Germany, 26–28 September 1995; pp. 985–992. [Google Scholar]
- Torrent, R.J. A two-chamber vacuum cell for measuring the coefficient of permeability to air of the concrete cover on site. Mater. Struct. 1992, 25, 358–365. [Google Scholar] [CrossRef]
- Philipp, C.; Schödl, H.; Sari, S.; Korntheuer, K.; Patzl-fischer-, E. Influence of different storage containers on chemical and sensory fingerprint of Pinot blanc and Grüner Veltliner wines. Mitteilungen Klosterneubg 2019, 69, 258–279. [Google Scholar]
- Schödl, H.; Schweighofer, H.; Herzog, R. Betonei, Steinfass, Tonamphore & Co. Vergleich mit herkömmlichen Weinbehälter. Der Winzer 2017, 10, 6–15. [Google Scholar]
- Skoczylas, F.; Henry, J.P. A study of the intrinsic permeability of granite to gas. Int. J. Rock Mech. Min. Sci. Geomech. Abstr. 1995, 32, 171–179. [Google Scholar] [CrossRef]
- Seo, G.; Chung, S.; An, D.; Lee, D. Permeabilities of Korean earthenware containers and their potential for packaging fresh produce. Food Sci. Biotechnol. 2005, 14, 82–88. [Google Scholar]
- Seo, G.H.; Yun, J.H.; Chung, S.K.; Park, W.-P.; Lee, D.S. Physical properties of korean earthenware containers affected by soy sauce fermentation use. Food Sci. Biotechnol. 2009, 15, 168–172. [Google Scholar]
- Yun, J.H.; An, D.S.; Lee, K.-E.; Jun, B.S.; Lee, D.S. Modified atmosphere packaging of fresh produce using microporous earthenware material. Packag. Technol. Sci. 2006, 19, 269–278. [Google Scholar] [CrossRef]
- Nevares, I.; Del Alamo-Sanza, M. Oak stave oxygen permeation: A new tool to make barrels with different wine oxygenation potentials. J. Agric. Food Chem. 2015, 63, 1268–1275. [Google Scholar] [CrossRef]
- Nevares, I.; Del Alamo-Sanza, M.; Martínez-Martínez, V.; Menéndez-Miguélez, M.; Bulcke, J.V.D.; Van Acker, J. Influence of Quercus petraea Liebl. wood structure on the permeation of oxygen through wine barrel staves. Holzforschung 2019, 73, 859–870. [Google Scholar] [CrossRef]
- Nevares, I.; Crespo, R.; Gonzalez, C.; Del Alamo-Sanza, M. Imaging of oxygen transmission in the oak wood of wine barrels using optical sensors and a colour camera. Aust. J. Grape Wine Res. 2014, 20, 353–360. [Google Scholar] [CrossRef]
- Nevares, I.; Mayr, T.; Baro, J. Á; Ehgartner, J.; Crespo, R.; Del Alamo-Sanza, M. Ratiometric oxygen imaging to predict oxygen diffusivity in oak wood during red wine barrel aging. Food Bioprocess Technol. 2016, 9, 1049–1059. [Google Scholar] [CrossRef]
- Del Alamo-Sanza, M.; Cárcel, L.M.; Nevares, I. Characterization of the Oxygen Transmission Rate of Oak Wood Species Used in Cooperage. J. Agric. Food Chem. 2017, 65, 648–655. [Google Scholar] [CrossRef]
- Del Alamo-Sanza, M.; Nevares, I. Recent Advances in the Evaluation of the Oxygen Transfer Rate in Oak Barrels. J. Agric. Food Chem. 2014, 62, 8892–8899. [Google Scholar] [CrossRef] [PubMed]
- Del Alamo-Sanza, M.; Nevares, I. Oak wine barrel as an active vessel: A critical review of past and current knowledge. Crit. Rev. Food Sci. Nutr. 2017, 58, 2711–2726. [Google Scholar] [CrossRef] [PubMed]
- Del Alamo-Sanza, M.; Nevares, I.; Mayr, T.; Baro, J. Á; Martínez-Martínez, V.; Ehgartner, J. Analysis of the role of wood anatomy on oxygen diffusivity in barrel staves using luminescent imaging. Sens. Actuators B Chem. 2016, 237, 1035–1043. [Google Scholar] [CrossRef]
- Piergiovanni, L.; Limbo, S. Food packaging materials. In Mechanism of Functional Expression of F1-ATPase; Springer Science and Business Media LLC: Berlin/Heidelberg, Germany, 2016. [Google Scholar]
- Barisashvili, G. Qvevri making in Georgia, history and present. Making Wine in Qvevri—A Unique Georgian Tradition. In Proceedings of the 1st International Qvevri Wine Symposium; Georgian Wine Association, Tbilisi, Georgia, 15–18 September 2011. [Google Scholar]
- Manning, D.A.C. Introduction to industrial minerals. In Introduction to Industrial Minerals; Springer Science and Business Media LLC: Berlin/Heidelberg, Germany, 1995; pp. 35–71. [Google Scholar]
- Martín-Márquez, J.; Rincón, J.M.; Romero, M. Effect of firing temperature on sintering of porcelain stoneware tiles. Ceram. Int. 2008, 34, 1867–1873. [Google Scholar] [CrossRef]
- Del Alamo, M.; Nevares, I. Device for Measuring the Permeability and Diffusivity of Gases in Porous Materials and Method for Measuring Said Parameters Using the Device. World Intellectual Property Organization Patent WO2012/107625, 16 August 2012. Available online: https://patentscope.wipo.int/search/en/detail.jsf?docId=WO2012107625.
- Prat-García, S.; Nevares, I.; Martínez-Martínez, V.; Del Alamo-Sanza, M. Customized oxygenation barrels as a new strategy for controlled wine aging. Food Res. Int. 2020, 131, 108982. [Google Scholar] [CrossRef] [PubMed]
- Real, S.; Bogas, J.A. Oxygen permeability of structural lightweight aggregate concrete. Constr. Build. Mater. 2017, 137, 21–34. [Google Scholar] [CrossRef]
- Kameche, Z.; Ghomari, F.; Choinska, M.; Khelidj, A. Assessment of liquid water and gas permeabilities of partially saturated ordinary concrete. Constr. Build. Mater. 2014, 65, 551–565. [Google Scholar] [CrossRef]
- Villani, C.; Loser, R.; West, M.J.; Di Bella, C.; Lura, P.; Weiss, W.J. An inter lab comparison of gas transport testing procedures: Oxygen permeability and oxygen diffusivity. Cem. Concr. Compos. 2014, 53, 357–366. [Google Scholar] [CrossRef]
- Peroni, V.; Botter, R.; Cabella, R.; Risso, L.; Carbone, C. Mineralogical and microstructural characterization of stoneware for wine use. In Il tempo del Planeta Terra e il Tempo dell’Uomo: Le Geoscienze tra Pasato e Futuro, Proceedings of the Congresso Nazionale Parma, Parma, Italy, 16–19 September 2019; Bernardo, C., Petti, F.M., Innamorati, G., Fascio, L., Eds.; Società Geologica Italiana Roma 2019: Parma, Italy, 2019; p. 116. [Google Scholar]
- AI-Otaibi, O.M.; Barr, B. Comparative study of three permeability tests. In Proceedings of the 27th Conference on Our World In Concrete & Structures, Singapore, 29–30 August 2002; CI-Premier PTE LTD: Singapore, 2002; pp. 145–154. [Google Scholar]
- Buenfeld, N.R.; Okundi, E. Effect of cement content on transport in concrete. Mag. Concr. Res. 1998, 50, 339–351. [Google Scholar] [CrossRef]
- Wong, H.; Zobel, M.; Buenfeld, N.; Zimmerman, R. Influence of the interfacial transition zone and microcracking on the diffusivity, permeability and sorptivity of cement-based materials after drying. Mag. Concr. Res. 2009, 61, 571–589. [Google Scholar] [CrossRef]
- Zhu, W.; Bartos, P.J. Permeation properties of self-compacting concrete. Cem. Concr. Res. 2003, 33, 921–926. [Google Scholar] [CrossRef]
- Wong, H.S.; Zimmerman, R.W.; Buenfeld, N. Estimating the permeability of cement pastes and mortars using image analysis and effective medium theory. Cem. Concr. Res. 2012, 42, 476–483. [Google Scholar] [CrossRef]
- Tittarelli, F. Oxygen diffusion through hydrophobic cement-based materials. Cem. Concr. Res. 2009, 39, 924–928. [Google Scholar] [CrossRef]
- Trinchero, P.; Sidborn, M.; Puigdomenech, I.; Svensson, U.; Ebrahimi, H.; Molinero, J.; Gylling, B.; Bosbach, D.; Deissmann, G. Transport of oxygen into granitic rocks: Role of physical and mineralogical heterogeneity. J. Contam. Hydrol. 2019, 220, 108–118. [Google Scholar] [CrossRef]
- Sidborn, M.; Neretnieks, I. Long term redox evolution in granitic rocks: Modelling the redox front propagation in the rock matrix. Appl. Geochem. 2007, 22, 2381–2396. [Google Scholar] [CrossRef]
- Malmström, M.; Banwart, S. Biotite dissolution at 25°C: The pH dependence of dissolution rate and stoichiometry. Geochim. Cosmochim. Acta 1997, 61, 2779–2799. [Google Scholar] [CrossRef]


| Mode | OTR·10−4 (cm3/m2·day) | Permeability Coef.·1013 (m3·m/m2·s·Pa) | ||||
|---|---|---|---|---|---|---|
| EC (n = 5) | Ebee (n = 5) | Ecol (n = 5) | EC (n = 5) | Ebee (n = 5) | Ecol (n = 5) | |
| Dry | 517.35 ± 117.83 (22.8%) | 109.85 ± 84.50 (76.9%) | 215.23 ± 116.99 (54.4%) | 175407 ± 36257 (20.7%) | 39093 ± 30273 (77.4%) | 81169 ± 46658 (57.5%) |
| Wet (t = 7 days) | 0.12 ± 0.03 (25.0%) | 2.78 ± 2.60 (93.5%) | 14.65 ± 25.26 (172.4%) | 0.23 ± 0.08 (34.8%) | 0.50 ± 0.35 (70.0%) | 22.42 ± 42.83 (191.0%) |
| Liquid absorption (g) | 4.92 ± 0.29 (5.9%) | 2.58 ± 2.33 (90.3%) | 3.86 ± 2.06 (53.4%) | |||
| Moisture content (%) | 8.96 ± 0.45 (5.0%) | 4.51 ± 4.06 (90.0%) | 6.51 ± 3.39 (52.1%) | |||
| Material | Diameter (mm) | Thickness (mm) | Weight (g) | Density (g/cm3) |
|---|---|---|---|---|
| VNT (n = 4) | 30.92 ± 1.33 (4.3%) | 33.16 ± 0.46 (1.4%) | 70.81 ± 0.99 (1.4%) | 1.80 ± 0.01 (0.5%) |
| SAME (n = 3) | 30.43 ± 0.49 (1.6%) | 24.43 ± 0.49 (2%) | 49.70 ± 0.16 (0.3%) | 1.70 ± 0.02 (1.2%) |
| ABK (n = 1) | 31.07 | 24.27 | 49.97 | 1.73 |
| Mode | OTR·10−4 (cm3/m2·Day) | Permeability Coef.·1014 (m3·m/m2·s·Pa) | ||||
|---|---|---|---|---|---|---|
| VNT (n = 4) | SAME (n = 3) | ABK (n = 1) | VNT (n = 4) | SAME (n = 3) | ABK (n = 1) | |
| Dry | 30.97 ± 5.37 (17.3%) | 11.75 ± 10.30 (87.7%) | 12.79 | 122.97 ± 21.03 (17.1%) | 48.50 ± 8.08 (16.7%) | 37.19 |
| Wet (t = 7 days) | 0.22 ± 0.10 (45.4%) | 0.11 ± 0.10 (90.9%) | 0.22 | 0.87 ± 0.39 (44.8%) | 0.47 ± 0.05 (10.6%) | 0.64 |
| Liquid absorption (g) | 5.39 ± 0.31 (1.8%) | 4.21 ± 0.70 (16.6%) | 2.81 | |||
| Moisture content (%) | 7.62 ± 0.50 (6.6%) | 8.48 ± 1.42 (16.7%) | 5.62 | |||
| Material | Furnace T (°C) | Diameter (mm) | Thickness (mm) | Weight (g) | Density (g/cm3) | Absorbed Water (1 h) |
|---|---|---|---|---|---|---|
| Clay 1 (n = 2) | 1100 | 39.05 | 16.00 | 41.83 | 2.18 | 2.79% |
| Clay 2 (n = 2) | 1110 | 39.50 | 15.98 | 43.55 | 2.22 | 1.93% |
| Clay 3 (n = 2) | 1120 | 39.50 | 15.99 | 44.06 | 2.25 | 1.23% |
| Material | Diffusion Coefficient (m2/s) D 107 | OTR (cm3/m2·Day) | Permeability Coef. (m3·m/m2·s·Pa) P∙1011 | Solubility Coef. (m3/m3·Pa) S∙105 |
|---|---|---|---|---|
| Clay 1 (n = 2) | 1.43 ± 0.0155 (1.1%) | 612.64 ± 15.38 (2.5%) | 5.42 ± 0.136 (2.5%) | 38.17 ± 1.18 (3.1%) |
| Clay 2 (n = 2) | 0.877 ± 0.0288 (3.3%) | 319.01 ± 20.51 (6.4%) | 2.82 ± 0.181 (6.4%) | 32.26 ± 3.08 (9.5%) |
| Clay 3 (n = 2) | 0.983 ± 0.0298 (3.0%) | 293.63 ± 46.14 (15.7%) | 2.60 ± 0.408 (15.7%) | 26.47 ± 3.32 (12.5%) |
| Material | OTR (cm3/m2∙Day) | Permeability Coef. (m3∙m/m2∙s∙Pa) P 1017 |
|---|---|---|
| Clay 1 (n = 2) | 12.57 ± 10.02 (79.2%) | 2.09 ± 2.06 (98.6%) |
| Clay 2 (n = 2) | 7.41 ± 2.91 (39.3%) | 1.47 ± 0.58 (39.3%) |
| Clay 3 (n = 2) | 5.38 ± 1.93 (35.9%) | 1.07 ± 0.39 (35.9%) |
| Material | Diameter (mm) | Thickness (mm) | Weight (g) | Density (g/cm3) |
|---|---|---|---|---|
| Average (n = 8) | 36.23 ± 0.05 (0.1%) | 103.35 ± 0.83 (0.8%) | 244.35 ± 2.10 (0.9%) | 2.29 ± 0.009 (0.4%) |
| Material | Diffusion Coef. (m2/s) D∙107 | OTR∙10−9 (cm3/m2∙Day) | Permeability Coef. (m3∙m/m2∙s∙Pa) P∙108 | Solubility Coef. (m3/m3∙Pa) S∙107 |
|---|---|---|---|---|
| No treatment | 3.69 ± 0.42 (11.40%) | 1.08 ± 0.03 (2.55%) | 6.58 ± 0.17 (2.55%) | 18.77 ± 2.17 (11.54%) |
| Tartaric acid conditioned | 4.60 ± 0.53 (11.60%) | 1.19 ± 0.07 (5.59%) | 7.24 ± 0.38 (5.31%) | 16.51 ± 1.65 (9.98%) |
| Material | OTR (cm3/m2∙day) | Permeability Coef. (m3∙m/m2∙s∙Pa) P∙1016 |
|---|---|---|
| Tartaric acid conditioned (n = 8) | 56.43 ± 36.24 (64%) | 7.00 ± 4.50 (64.3%) |
| Material | Weight (g) | Diameter (mm) | Thickness (mm) | Density (g/cm3) |
|---|---|---|---|---|
| Average (n = 7) | 233.00 ± 1.37 (0.59%) | 36.13 ± 0.03 (0.10%) | 102.86 ± 0.57 (0.55%) | 2.21 ± 0.01 (0.44%) |
| Mode | No Treatment | Tartaric Acid | No Treatment | Tartaric Acid |
|---|---|---|---|---|
| Dry | OTR (cm3/m2·day)·10−3 | Permeability coef. (m3·m/m2·s·Pa)·1015 | ||
| 407.57 ± 131 (32.18%) | 0.18 ± 0.12 (69.59%) | 2480 ± 799 (32.20%) | 1.09 ± 0.76 (69.99%) | |
| Wet | OTR (cm3/m2·day)·108 | Permeability coef. (m3·m/m2·s·Pa)·1016 | ||
| 5.16 ± 1.74 (33.67%) | 1.22 ± 0.66 (54.32%) | 5.42 ± 1.82 (33.68%) | 1.26 ± 0.68 (53.70%) | |
| Material | OTR (cm3/m2∙Day) | Permeability Coef. (m3∙m/m2∙s∙Pa) P∙1015 |
|---|---|---|
| Tartaric acid conditioned (n = 7) | 87.54 ± 16.65 (19%) | 1.08 ± 0.21 (22.3%) |
| Material | Diameter (mm) | Thickness (mm) | Weight (g) | Density (g/cm3) |
|---|---|---|---|---|
| G-Clear (n = 7) | 36.18 ± 0.04 (0.10%) | 99.16 ± 2.60 (2.63%) | 264.92 ± 7.26 (2.74%) | 2.60 ± 0.01 (0.42%) |
| G-Dark (n = 8) | 36.10 ± 0.07 (0.18%) | 99.97 ± 0.94 (0.95%) | 269.94 ± 3.40 (1.26%) | 2.64 ± 0.01 (0.30%) |
| Material | Diffusion Coef. (m2/s) D 108 | OTR∙10−6 (cm3/m2∙Day) | Permeability Coef. (m3∙m/m2∙s∙Pa) P∙1011 | Solubility Coef. (m3/m3∙Pa) S∙109 |
|---|---|---|---|---|
| G-Clear (n = 7) | 8.33 ± 2.05 (26.6%) | 1.83 ± 0.21 (11.4%) | 2.79 ± 0.74 (26.6%) | 3.34 ± 0.23 (7.0%) |
| G-Dark (n = 8) | 13.8 ± 17.5 (126.7%) | 1.03 ± 0.062 (6.01%) | 28.2 ± 4.73 (16.7%) | 3.74 ± 1.17 (31.2%) |
| Material | OTR (cm3/m2∙Day) | Permeability Coef. (m3∙m/m2∙s∙Pa) P 1016 |
|---|---|---|
| G-Clear (n = 7) | 61.63 ± 21.36 (34.7%) | 7.67 ± 2.72 (35.5%) |
| G-Dark (n = 8) | 71.21 ± 54.89 (77.1%) | 8.80 ± 6.76 (76.8%) |
Publisher’s Note: MDPI stays neutral with regard to jurisdictional claims in published maps and institutional affiliations. |
© 2021 by the authors. Licensee MDPI, Basel, Switzerland. This article is an open access article distributed under the terms and conditions of the Creative Commons Attribution (CC BY) license (http://creativecommons.org/licenses/by/4.0/).
Share and Cite
Nevares, I.; del Alamo-Sanza, M. Characterization of the Oxygen Transmission Rate of New-Ancient Natural Materials for Wine Maturation Containers. Foods 2021, 10, 140. https://doi.org/10.3390/foods10010140
Nevares I, del Alamo-Sanza M. Characterization of the Oxygen Transmission Rate of New-Ancient Natural Materials for Wine Maturation Containers. Foods. 2021; 10(1):140. https://doi.org/10.3390/foods10010140
Chicago/Turabian StyleNevares, Ignacio, and Maria del Alamo-Sanza. 2021. "Characterization of the Oxygen Transmission Rate of New-Ancient Natural Materials for Wine Maturation Containers" Foods 10, no. 1: 140. https://doi.org/10.3390/foods10010140
APA StyleNevares, I., & del Alamo-Sanza, M. (2021). Characterization of the Oxygen Transmission Rate of New-Ancient Natural Materials for Wine Maturation Containers. Foods, 10(1), 140. https://doi.org/10.3390/foods10010140