1. Introduction
Identifying the very best researchers is a complex and often subjective task. While some scientists achieve global recognition through prestigious awards such as the Nobel or Abel Prizes, many others make substantial and lasting contributions that are less formally acknowledged, through highly cited discoveries, foundational textbook content, influential monographs, or transformative ideas shared via preprints and open data. In the modern academic environment, however, such nuanced recognition often gives way to formalized assessment systems. The evaluation of research performance has become a central pillar of decision-making in academia, influencing funding allocation, hiring, promotion, and reputation (
Hirsch, 2005;
Kelly & Jennions, 2006). To support these processes, institutions and agencies are increasingly relying on bibliometric and citation-based indicators, which aim to translate complex scholarly activities into standardized, quantifiable metrics (
Ellegaard & Wallin, 2015;
Waltman, 2016;
Aksnes et al., 2019). While not without limitations, these indicators now serve as the default tools for assessing research impact across many disciplines.
Traditional metrics such as citation counts (CC) and h-index (H) (
Hirsch, 2005) have become standard due to their simplicity and intuitive appeal. The H, for instance, aims to quantify both the productivity and impact of a researcher by identifying the maximum number of papers (h) that have each received at least h citations. However, their limitations are well documented (
Costas & Bordons, 2007;
Koltun & Hafner, 2021). Both are sensitive to field-specific citation norms (
Alonso et al., 2009), biased against early-career researchers, and unresponsive to co-authorship roles (
Egghe, 2008;
Schreiber, 2008). Variants such as the g-index, AR-index (
Jin et al., 2007), and GFsa-index (
Fernandes & Fernandes, 2024) attempt to refine the h-index by considering citation intensity or publication age. However, structural problems remain, especially as multi-authored papers proliferate and individual contributions become harder to distinguish (
Wuchty et al., 2007;
Aboukhalil, 2014).
More recent proposals integrate authorship position and collaboration dynamics to address attribution issues. For example,
Hagen (
2008) introduced the harmonic counting method to address both inflationary and equalizing biases in co-authorship, offering a more accurate reflection of individual merit based on author rank. Vavryčuk (
Vavryčuk, 2018) proposed fractional or authorship-weighted schemes, which adjust credit allocation among co-authors to reflect individual contributions more accurately. Similarly, field-normalized indicators like Field-Weighted Citation Impact (FWCI) improve cross-disciplinary comparability by accounting for publication type, year, and subject area (
Waltman & van Eck, 2019). By comparing each paper’s citations to global averages for its subject, year, and document type, FWCI improves cross-field comparability and mitigates distortion by citation-dense disciplines (
Zanotto & Carvalho, 2021). Nevertheless, FWCI can capture only a single dimension of research impact. Moreover, that reliance on citation-based indices can distort assessments, especially in highly skewed citation distributions where a few papers drive most of the impact (
Bornmann & Daniel, 2009). Others also caution against overreliance on impact factors and total citation counts, noting a systemic bias in their assessment of scientific productivity (
Seglen, 1992).
In recent years, the field of bibliometric evaluation has evolved beyond simple counts of publications and citations to more nuanced, multidimensional indicators that capture various facets of scholarly influence (
Senanayake et al., 2015;
Ioannidis et al., 2016;
Onjia, 2025). A significant advance came with the Composite Citation Indicator (CCI) developed by Ioannidis et al. (
Ioannidis et al., 2016). It assembles six complementary author-level metrics (total citations; h-index; co-authorship-adjusted hm-index; citations to papers as single, single or first, and single, first, or last author). By normalizing each metric and summing them, the authors generate a single Composite Citation Indicator (CCI) that reflects both overall impact and leadership roles across a researcher’s career in 22 broad fields and 176 subfields. Notably, this methodology laid the foundation for the widely cited “Top 2% Scientists List,” compiled by Stanford University researchers in collaboration with Elsevier. CCI addresses key limitations of traditional metrics, such as field bias, the co-authorship problem, and a lack of role sensitivity.
However, certain conceptual and operational decisions limit CCI’s broader utility. The exclusion of publication volume (SO) as authors “see no point in rewarding a scientist for publishing more papers”, for instance, removes a meaningful productivity signal that, if moderately weighted, could enhance discrimination without incentivizing quantity over quality (
Moed & Halevi, 2015;
Agarwal et al., 2016). Likewise, omitting journal percentile placement and corresponding authorship overlooks widely accepted proxies of research distinction and intellectual responsibility (
Starbuck, 2005;
Lindahl, 2018;
McNutt et al., 2018;
Chinchilla-Rodríguez et al., 2024). Finally, the triple weight for single-author papers and double weight for first-author papers lacks explanation. Reintroducing a productivity aspect, adding excellence layers and citation-quality adjustments, recognizing the corresponding-author role, and empirically tuning authorship weights would yield a more balanced and fairer metric.
The current study aims to address these gaps by proposing an alternative methodology for identifying the top 1% researchers across All Science Journal Classification (ASJC) subject areas (categories) and overall. Using the comprehensive SciVal dataset of Kazakhstani researchers as a starting point, this work proposes a novel performance-based ranking framework that incorporates multiple metrics like: measures of productivity (SO), impact (CC and H), research excellence (publications in the top journals), citation impact (overall and author-position-specific output in top citation percentiles and FWCI), and the extent of international collaboration. The novelty lies in a more nuanced, balanced, and adaptable ranking methodology for identifying top-performing researchers at both field-specific and aggregate levels, incorporating a tailored weighting strategy and the integration of co-authorship correction (Hm-index) in the final rankings. This multi-metric, weighted, and adjustable approach enables a more transparent and context-sensitive identification of top researchers, valuable for national and global research assessments.
Although the current study draws on researcher data from Kazakhstan, this national sample primarily serves to demonstrate the applicability and interpretability of the proposed framework. While a substantial portion of this study is devoted to empirical analysis of Kazakhstani researchers, this is intended as an illustrative application of the CPI framework rather than the central focus of this study.
2. Materials and Methods
This section details the procedural framework used to identify the top-performing Kazakhstani researchers at both field-specific and cross-disciplinary levels. Collectively, these procedures establish a transparent and replicable pathway from raw bibliographic data to the final identification of the national top-ranked researcher list.
Figure 1 illustrates the primary stages of the research, encompassing data collection, metric selection, transformation, weighting, normalization, and ranking processes.
2.1. Data Source and Scope
All bibliometric information was extracted from SciVal (Elsevier), a widely used analytics platform that derives its content from the Scopus database. SciVal was selected because it provides disambiguated author profiles, field-normalized indicators, and a flexible interface for exporting large, subject-segmented datasets. All data was gathered from 13 to 17 April 2025.
Within SciVal’s Countries, Regions & Groups module, “Kazakhstan” was selected as the analytical unit for three key reasons. First, the country’s research ecosystem presents a manageable yet statistically meaningful sample size, large enough to yield diverse performance profiles across disciplines, but limited enough to allow full extraction of bibliometric data within the operational constraints of SciVal. Second, Kazakhstan’s research system is undergoing rapid development, making it a valuable and timely case for piloting new evaluation frameworks that could support national research policy. Third, the study team is institutionally embedded within Kazakhstan, providing contextual knowledge that enhances the interpretation of findings and supports the potential translation of results into practical applications. While this choice has local relevance, the methodological framework proposed is broadly applicable and can be readily replicated in other national or institutional contexts.
Two complementary ranking exercises were conducted. One field-specific (classification by ASJC subject areas), another—subject-independent (overall ranking across all subject areas). Each required a dedicated data-extraction strategy based on the top 500 author profiles ranked by SO (i.e., the number of Scopus-indexed documents). More details are presented in
Section 2.4. Looking ahead, the analysis is grounded in a consolidated dataset of 13,016 author–subject-area records, representing 6717 unique Kazakhstani researchers across all ASJC categories.
Because SciVal’s export interface returns top author lists solely based on SO, our sampling frame inherits all side effects associated with output-based rankings. For example, the preferential inclusion of prolific authors over researchers with a smaller output but an exceptional impact, such as a low number of highly cited publications. Potential biases arising from these inclusion and exclusion criteria, such as the omission of early-career researchers, expatriate scientists, or those with concentrated but influential output, are mentioned in the discussion and limitations section.
2.2. Selected Metrics
To capture the complementary facets of research performance, each retained author profile was benchmarked using the SciVal-defined metrics. The selection of specific metrics and the weighting coefficients was established through the expert judgment of the authors and an extensive review of existing scientometric literature. Each author independently assigned weights to the selected metrics according to their perceived importance in evaluating scientific performance. A few rounds of internal discussion were then held to refine these scores. The final weights represent the median values from this process, normalized to sum to 100. While subjective by design, the weighting scheme can be calibrated to suit different analytical purposes or policy objectives in future studies.
Table 1 presents all 16 metrics used, along with a brief description of their central concept and the rationale for their usage.
2.3. Data Analysis
The analytical workflow of this research consisted of three stages, each driven by a distinct inferential need.
First, because research performance differs markedly across disciplines, it is necessary to map the shape of each field’s distribution before any calculations. For each ASJC category, measures of central tendency (mean and median), dispersion (standard deviation (SD) and interquartile range (IQR)), and extrema were computed for all metrics from
Table 1. The same statistics were calculated for researchers under the subject-independent (overall) dataset. In addition, normality was assessed using the Shapiro–Wilk test, and skewness was quantified using both Pearson’s first and second coefficients.
Second, for inter-metric association testing, we calculated pairwise Pearson correlation coefficients within every ASJC category and again on the overall dataset.
Finally, leaders in each metric used (H, SO, CC, etc.) within both field-specific and subject-independent contexts were identified, serving as a benchmark of individual strengths.
Together, these analytics provide the statistical evidence base for the transformation, weighting, and composite score decisions detailed in
Section 2.4.
2.4. Rankings Calculation
2.4.1. Ranking by ASJC Subject Areas
SciVal assigns every Scopus-indexed publication and, by aggregation, every author profile to one or more of the 27 ASJC subject areas (see
Table 2). For each of the 27 ASJC categories, we selected the top 500 author profiles ranked by the number of Scopus-indexed documents over the ten-year window (2014–2023). With the exceptions of dentistry and nursing, which had 61 and 455 authors, respectively, with at least one publication, a pool of 13,016 author–subject-area records was gathered. Due to the variability in publication intensity across fields, the minimum SO required to appear among the top 500 authors differs by ASJC subject area. Next, all selected metrics were retrieved directly from SciVal’s benchmarking and overview modules, covering the 1996–2025 time range, ensuring consistent computational definitions.
To convert the heterogeneous set of indicators from
Table 1 into a single, field-comparable performance score, we developed a novel methodology based on a distinct set of metrics and a dedicated weighting scheme (
Table 1). For ranking calculation, each raw indicator
xik (metric
k for author
i) was log-transformed to address outliers, stabilize variance, and prevent a few ultra-cited or hyper-productive authors from overwhelming the composite ranking. Within every ASJC research area, we then performed a unit-range normalization by dividing the transformed value for each author by the field-specific maximum for that metric.
where
f denotes the author’s primary ASJC category, consequently, the best-performing researcher in a given field attains a score of 1 for that indicator, and all others fall proportionally between 0 and 1.
Next, we multiplied each normalized indicator
by the assigned weight
reported in
Table 1 and summed across the 16 metrics to obtain the Composite Performance Index (CPI). For each author
i in field
f, the CPI is therefore:
where
is the weight in
Table 1 and
is the log-transformed score for metric
k.
For each subject area, we ranked all eligible Kazakhstani author profiles by their CPI and compiled a list of the top 1% Kazakhstani subject-specific scientists (KZ-TOP-S). Given that the analytical extract is capped at 500 authors per research area, this threshold corresponds to the five researchers with the highest scores in each area. The exception is the dentistry area, where only one researcher was awarded due to the limited author list (61 authors). Authors appearing in multiple ASJC areas retained separate CPIs and rankings within each field. Any record lacking a current Kazakhstani affiliation was excluded from the dataset. The resulting 131 positional awards form the subject-specific excellence list, which is presented in the
Supplementary Materials.
2.4.2. Subject-Independent (Overall) Ranking
To construct a subject-independent list, we consolidated the 13,016 field-specific records described in
Section 2.4.1. Author identifiers were cross-matched and duplicates were removed, yielding 6717 unique Kazakhstani researchers. These consolidated profiles were then reimported into SciVal’s benchmarking module, with the subject filter set to “all subject areas”, and the benchmark window was set to 1996–2025.
For the overall ranking, we retained the same calculation and weighting logic outlined in
Section 2.4.1. The subsequent ranking on this overall CPI produced a holistic Kazakhstani top 1% list (KZ-TOP) of 67 researchers.
3. Results
The section begins with a summary of the descriptive statistics for all sixteen metrics used, outlining key trends across disciplines and the overall dataset with a focus on scholarly output, h-index, citation counts, research excellence, citation impact, and international collaboration. The second part examines the relationships between metrics through correlation analysis. Following this, the individual leaders in each metric and subject area are identified, offering a detailed view of excellence across specific dimensions. The section concludes with the final CPI-based rankings, which integrate all indicators into a composite assessment of top-performing researchers.
3.1. Descriptive Statistics Across Subject Areas
Initially, normality was assessed using the Shapiro–Wilk test, and skewness was evaluated using Pearson’s coefficients. The results revealed deviations from normality, with the majority of indicators exhibiting positive skewness and non-normal distributions (Shapiro–Wilk p < 0.05). This pattern was particularly evident for citation-based metrics and FWCI, where extreme values and heavy right tails were observed. Descriptive statistics were then computed for all indicators, including mean, median (Mdn), SD, and IQR.
3.1.1. Scholarly Output, h-Index, Citation Count
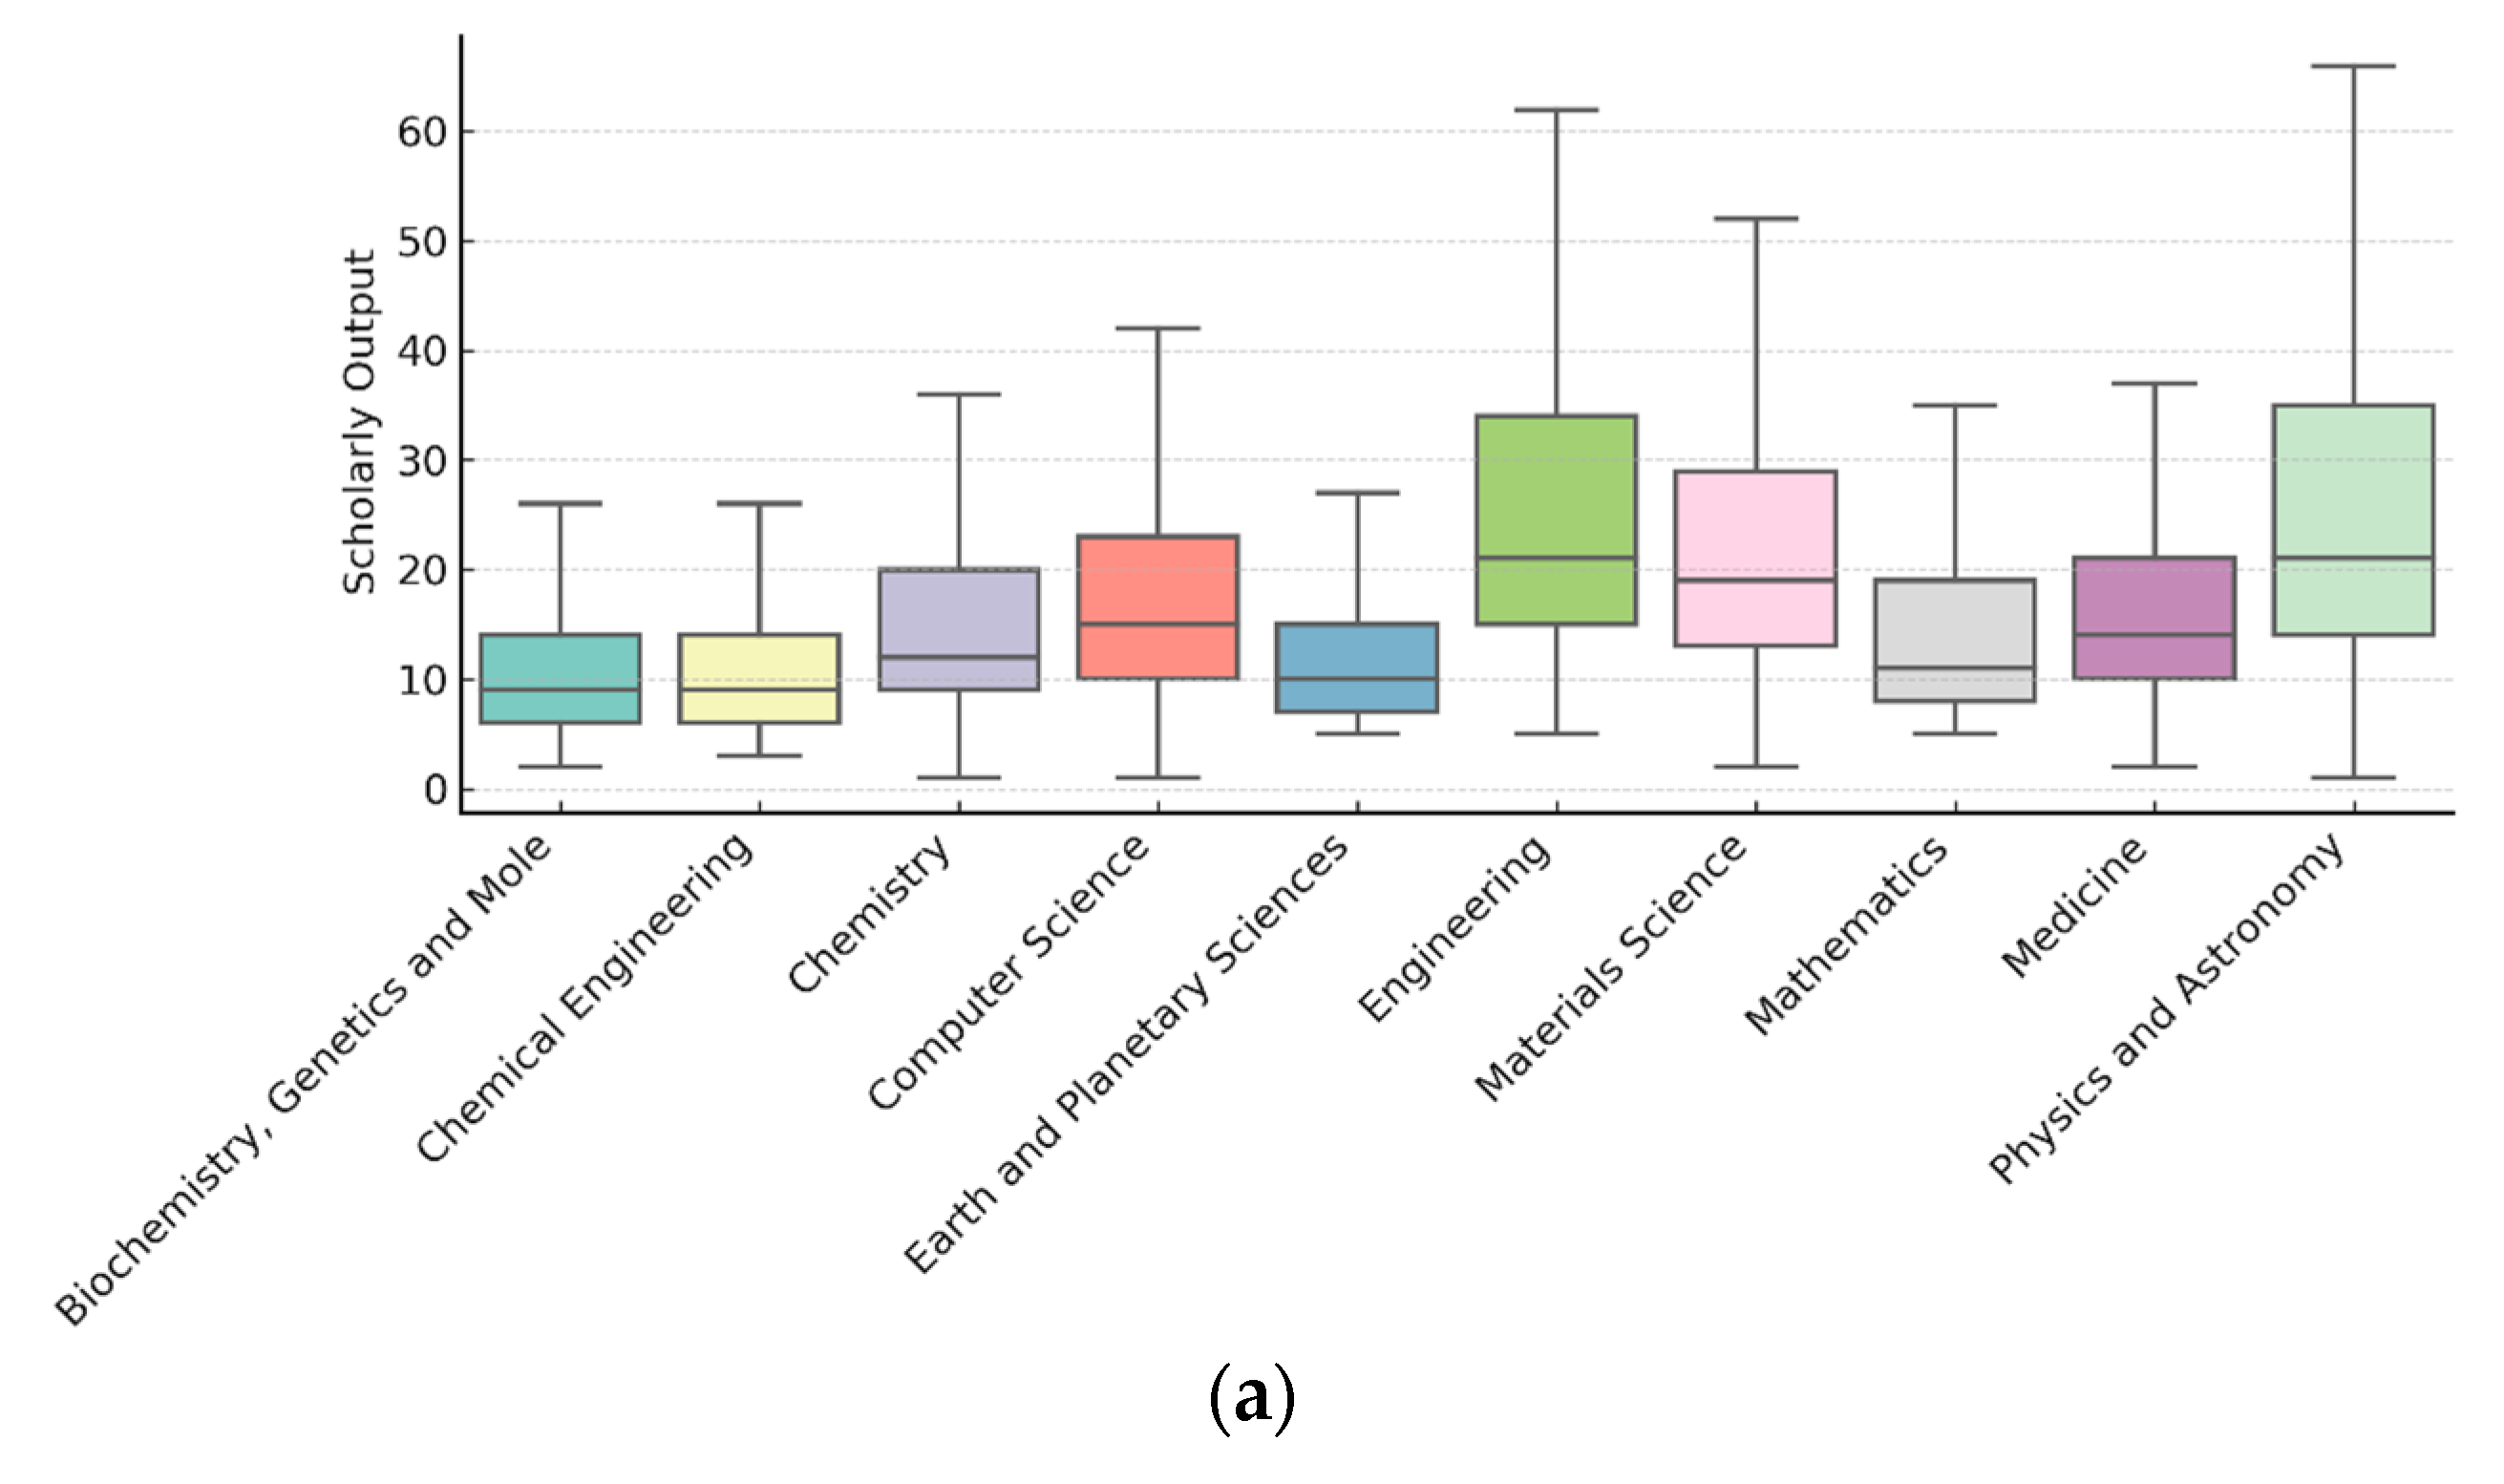
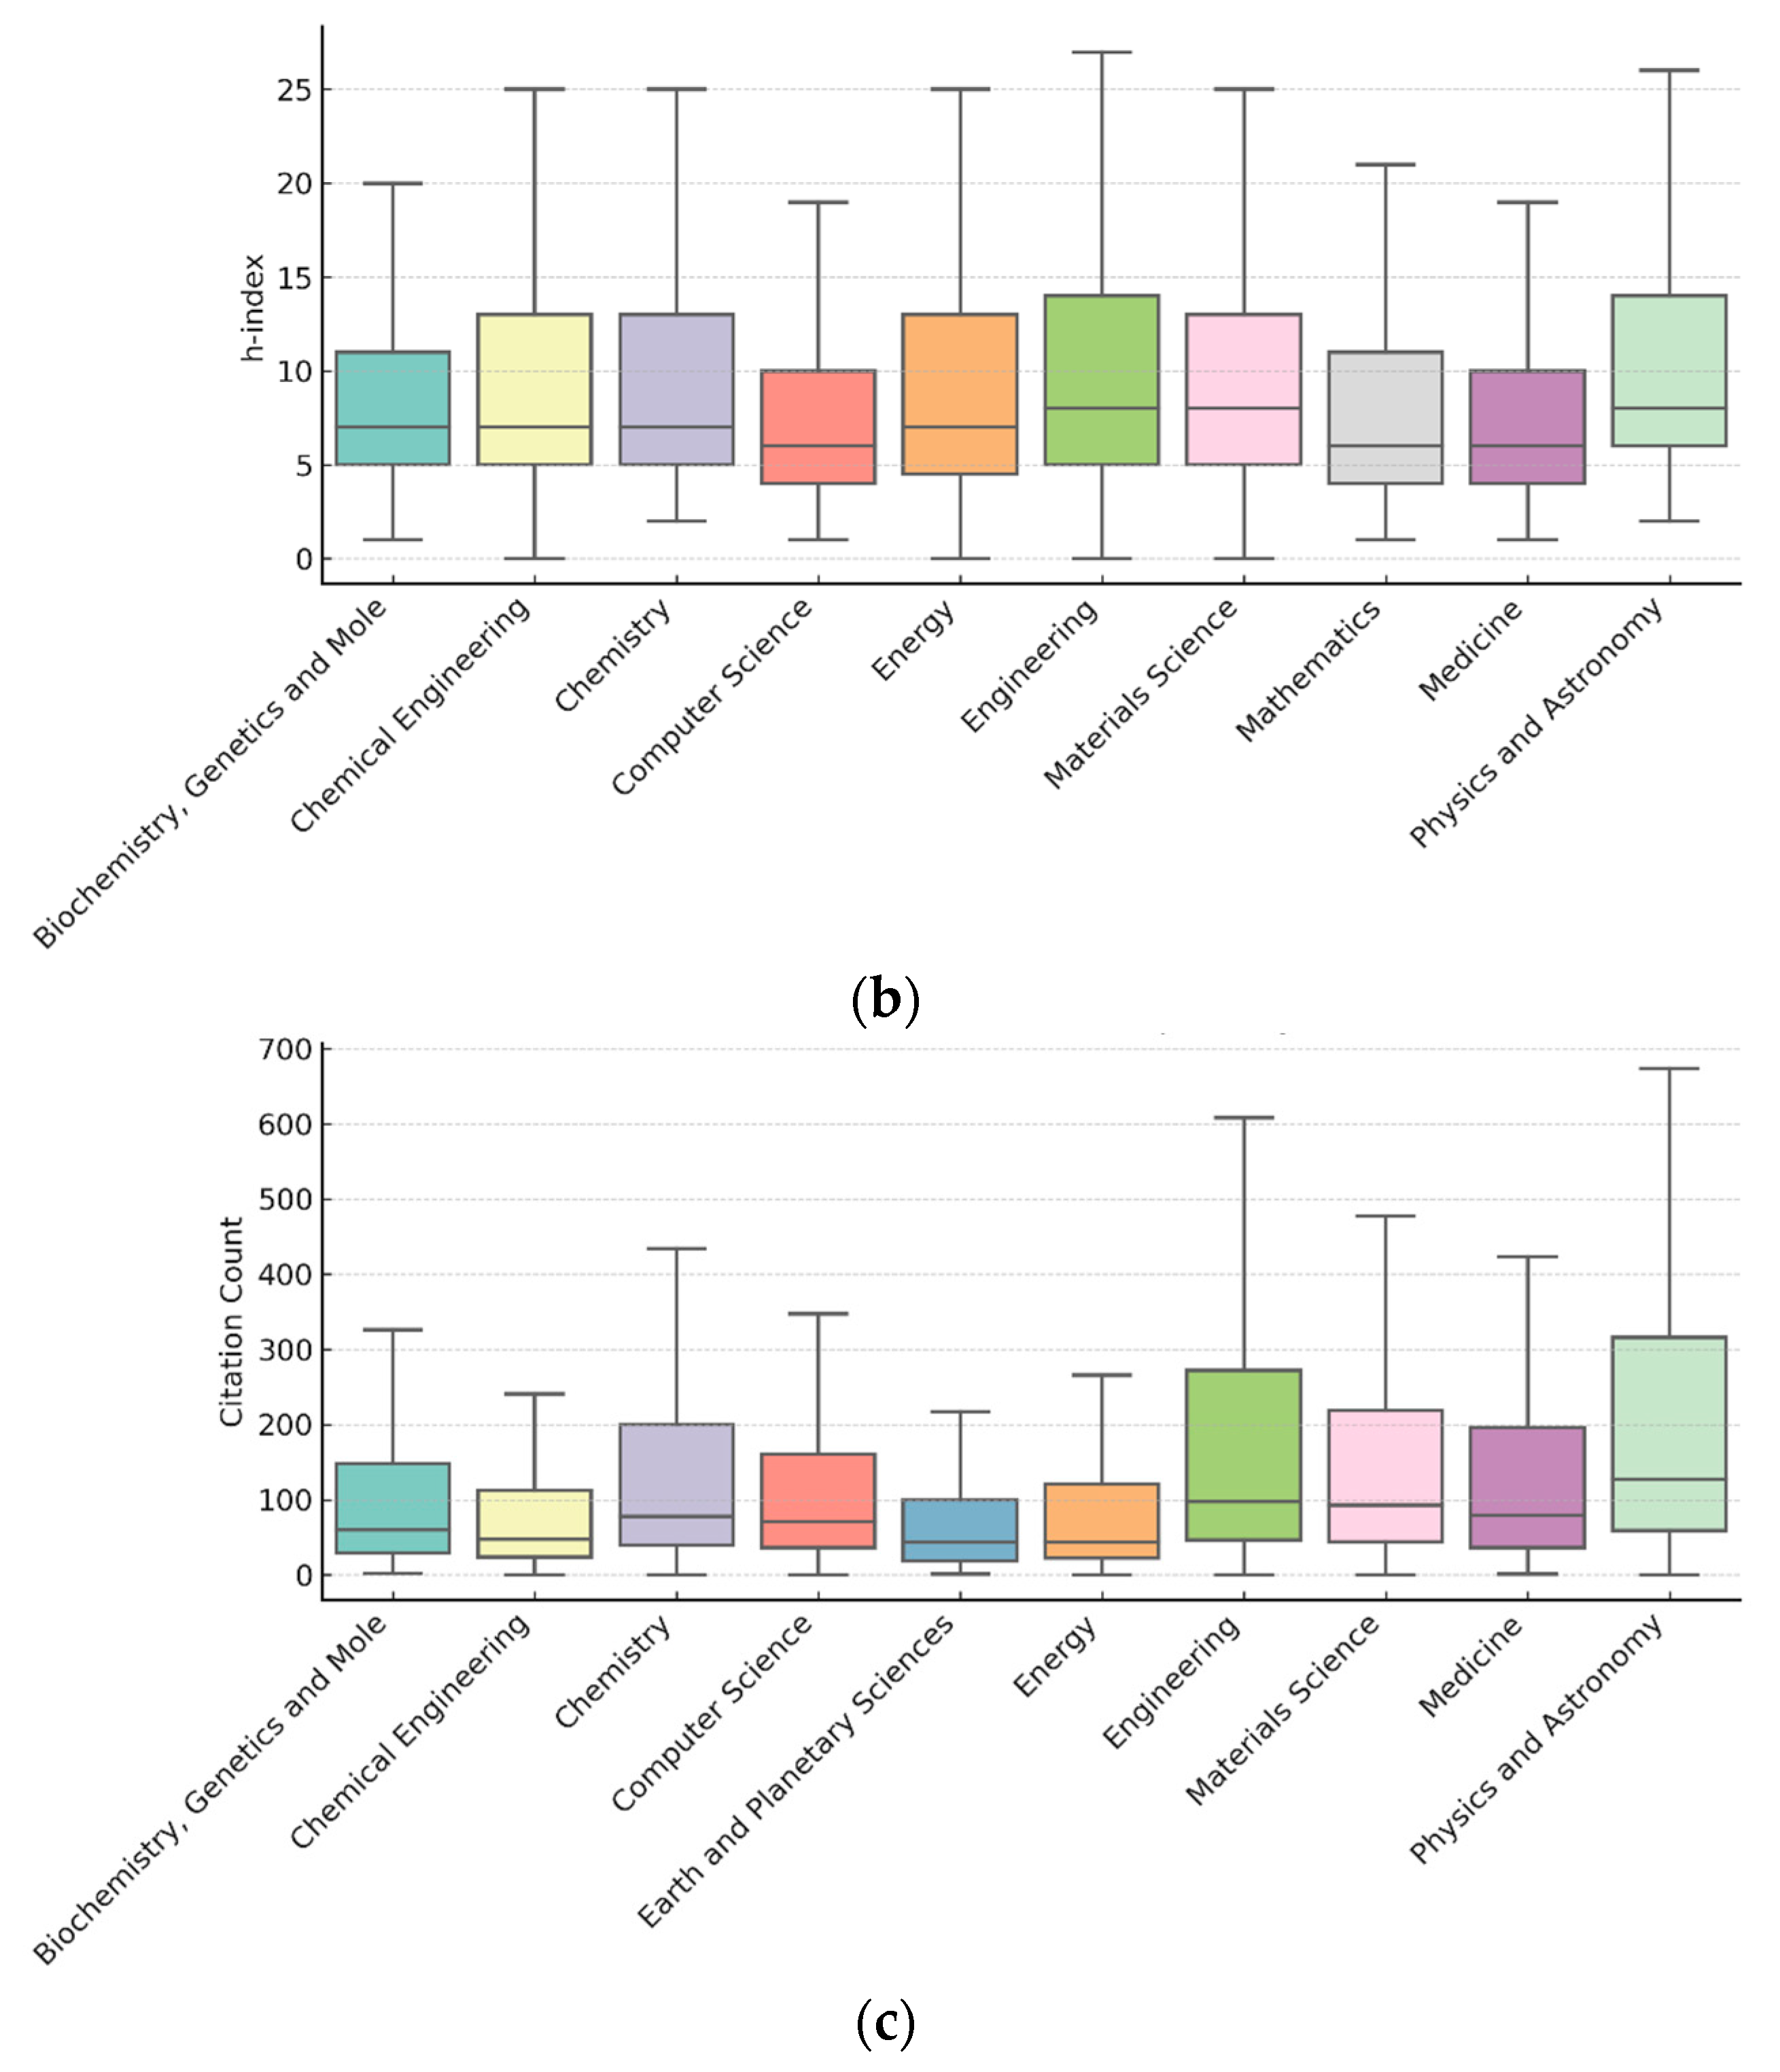
The analysis begins with three fundamental indicators: SO as a measure of research productivity, H as an indicator of career balance between productivity and impact, and CC as a measure of an author’s citation impact. On average, the physics and astronomy area exhibit the highest mean SO (34.5, Mdn = 21) and has the highest mean H (11.4, Mdn = 8), followed by engineering (mean SO = 32.8, Mdn SO = 21; mean H = 10.6, Mdn H = 8). Materials science and computer science rank third and fourth, with mean SO of 28.5 (Mdn = 19) and 23.9 (Mdn = 15), respectively. The mean H is 10.5 (Mdn = 8) and 8.7 (Mdn = 6), respectively. The most significant mean CC exceeding 740 was demonstrated by medicine (Mdn CC = 79), followed by physics and astronomy (mean CC = 610,2, Mdn CC = 127) and engineering with a mean CC of 345 and Mdn = 97,5.
Figure 2 shows the data distributions of mean SO (a), H (b), and CC (c) among the top 10 subject areas.
Medicine exhibits a moderate mean SO of 21.5, but accumulates the highest mean CC (742.7 and Mdn = 79), primarily due to the exceptionally high number of co-authors (up to 1596) on multiple publications (
Abbafati et al., 2020;
Roth et al., 2018;
Feigin et al., 2021), reflecting Kazakhstan’s participation in large-scale global health studies, which have yielded exceptionally high citation counts. The standard deviation of CC in medicine (above 2400) confirms the presence of a few highly cited authors; there are seven with more than 10,000 CC. It is worth noting that such extreme outlier cases were observed only in the field of medicine and represent rare instances within the dataset.
Most life-science areas (e.g., biochemistry, immunology, and microbiology) are moderate-productivity fields and have a mean CC of around 13–18 and a mean H of 8–10. In contrast, social-science areas (e.g., economics, psychology, and social sciences itself) exhibit average CC below 10 with H less than 6. Categories like dentistry, nursing, and arts post the lowest CC and H means. Going deeper into citation and self-citation analysis, the ratio of these two metrics was calculated as:
where
is the citation count without self-citations and
is the total citation count.
Clinical disciplines exhibit the cleanest citation profiles, with medicine having a mean of 0.96, nursing—0.95, and pharmacology and toxicology—0.95. In computer science, engineering, and materials science areas, equals 0.86, 0.88, and 0.89, respectively.
3.1.2. Research Excellence Dimension
The next group of metrics captures research excellence through the distribution of publications in top-tier journals ranked by CiteScore percentiles. Metrics such as P1%JPCiteScore, P10%JPCiteScore, and P25%JPCiteScore reflect the extent to which researchers consistently publish in the most prestigious and widely cited journals.
Across ASJC subject areas, notable disparities were observed in the distribution of publications appearing in high-impact journals. The P25%JPCiteScore metric presents the broadest base of excellence, with physics and astronomy (mean = 8.9, Mdn = 2, SD = 21.7), medicine (mean = 7.1, Mdn = 3, SD = 15.6), engineering (mean = 6.7, Mdn = 2, SD = 14.9), and materials science (mean = 7.6, Mdn = 2, SD = 11.1) leading the cohort. These fields not only demonstrate higher averages but also substantial variability, pointing to a subset of highly productive authors within each discipline. In the field of physics and astronomy, 22 authors have published over 50 articles in the top 25% journal percentiles, in medicine there are 13 authors, and in engineering—10. Conversely, areas such as health professions (mean = 0.2, SD = 0.7), neuroscience (mean = 0.4, SD = 1.5), and decision sciences (mean = 0.5, SD = 4.1) remain significantly low in the P25%JPCiteScore metric, with median values equal to 0. The same categories continue to exhibit weaknesses in other excellence metrics as well. See
Figure 3 for more details.
Focusing on the higher-tier journals, the average values decline, although leading disciplines remain largely consistent. In P10%JPCiteScore physics and astronomy (mean = 3.8, SD = 12.0), medicine (mean = 3.2, SD = 9.4), engineering (mean = 2.8, SD = 8.8), and materials science (mean = 2.0, SD = 6.1) continue to outperform others. At the same time, standard deviations still suggest a skewed distribution dominated by a few prolific individuals. In P1%JPCiteScore, output is even more limited, with averages across most fields dropping below 1. The highest average P1%JPCiteScore appears in medicine (mean = 0.8, SD = 4.1), which also leads all categories in terms of the highest number of authors (84) with at least one paper in the top 1% journal percentile. However, the median value of P1%JPCiteScore is zero across all 27 categories, further confirming that such elite-level outputs are rare and concentrated in a very small subset of researchers.
3.1.3. Citation Impact and International Collaboration
This section begins with an analysis of the Field-Weighted Citation Impact (FWCI), a normalized metric that reflects how frequently an author’s work is cited relative to global expectations of the same year, field, and document type. This is followed by a detailed breakdown of outputs in the top citation percentiles (field-weighted), which highlight the share of publications achieving high citation visibility within their respective fields. The section concludes with an overview of international collaboration, an important factor linked to citation advantage and global research integration. A particular focus is placed on authorship position, specifically on whether researchers appear as first, last, corresponding, or single authors, to assess their visibility and leadership within collaborative outputs. These role-weighted metrics provide a more refined view of an individual’s contribution to high-impact research.
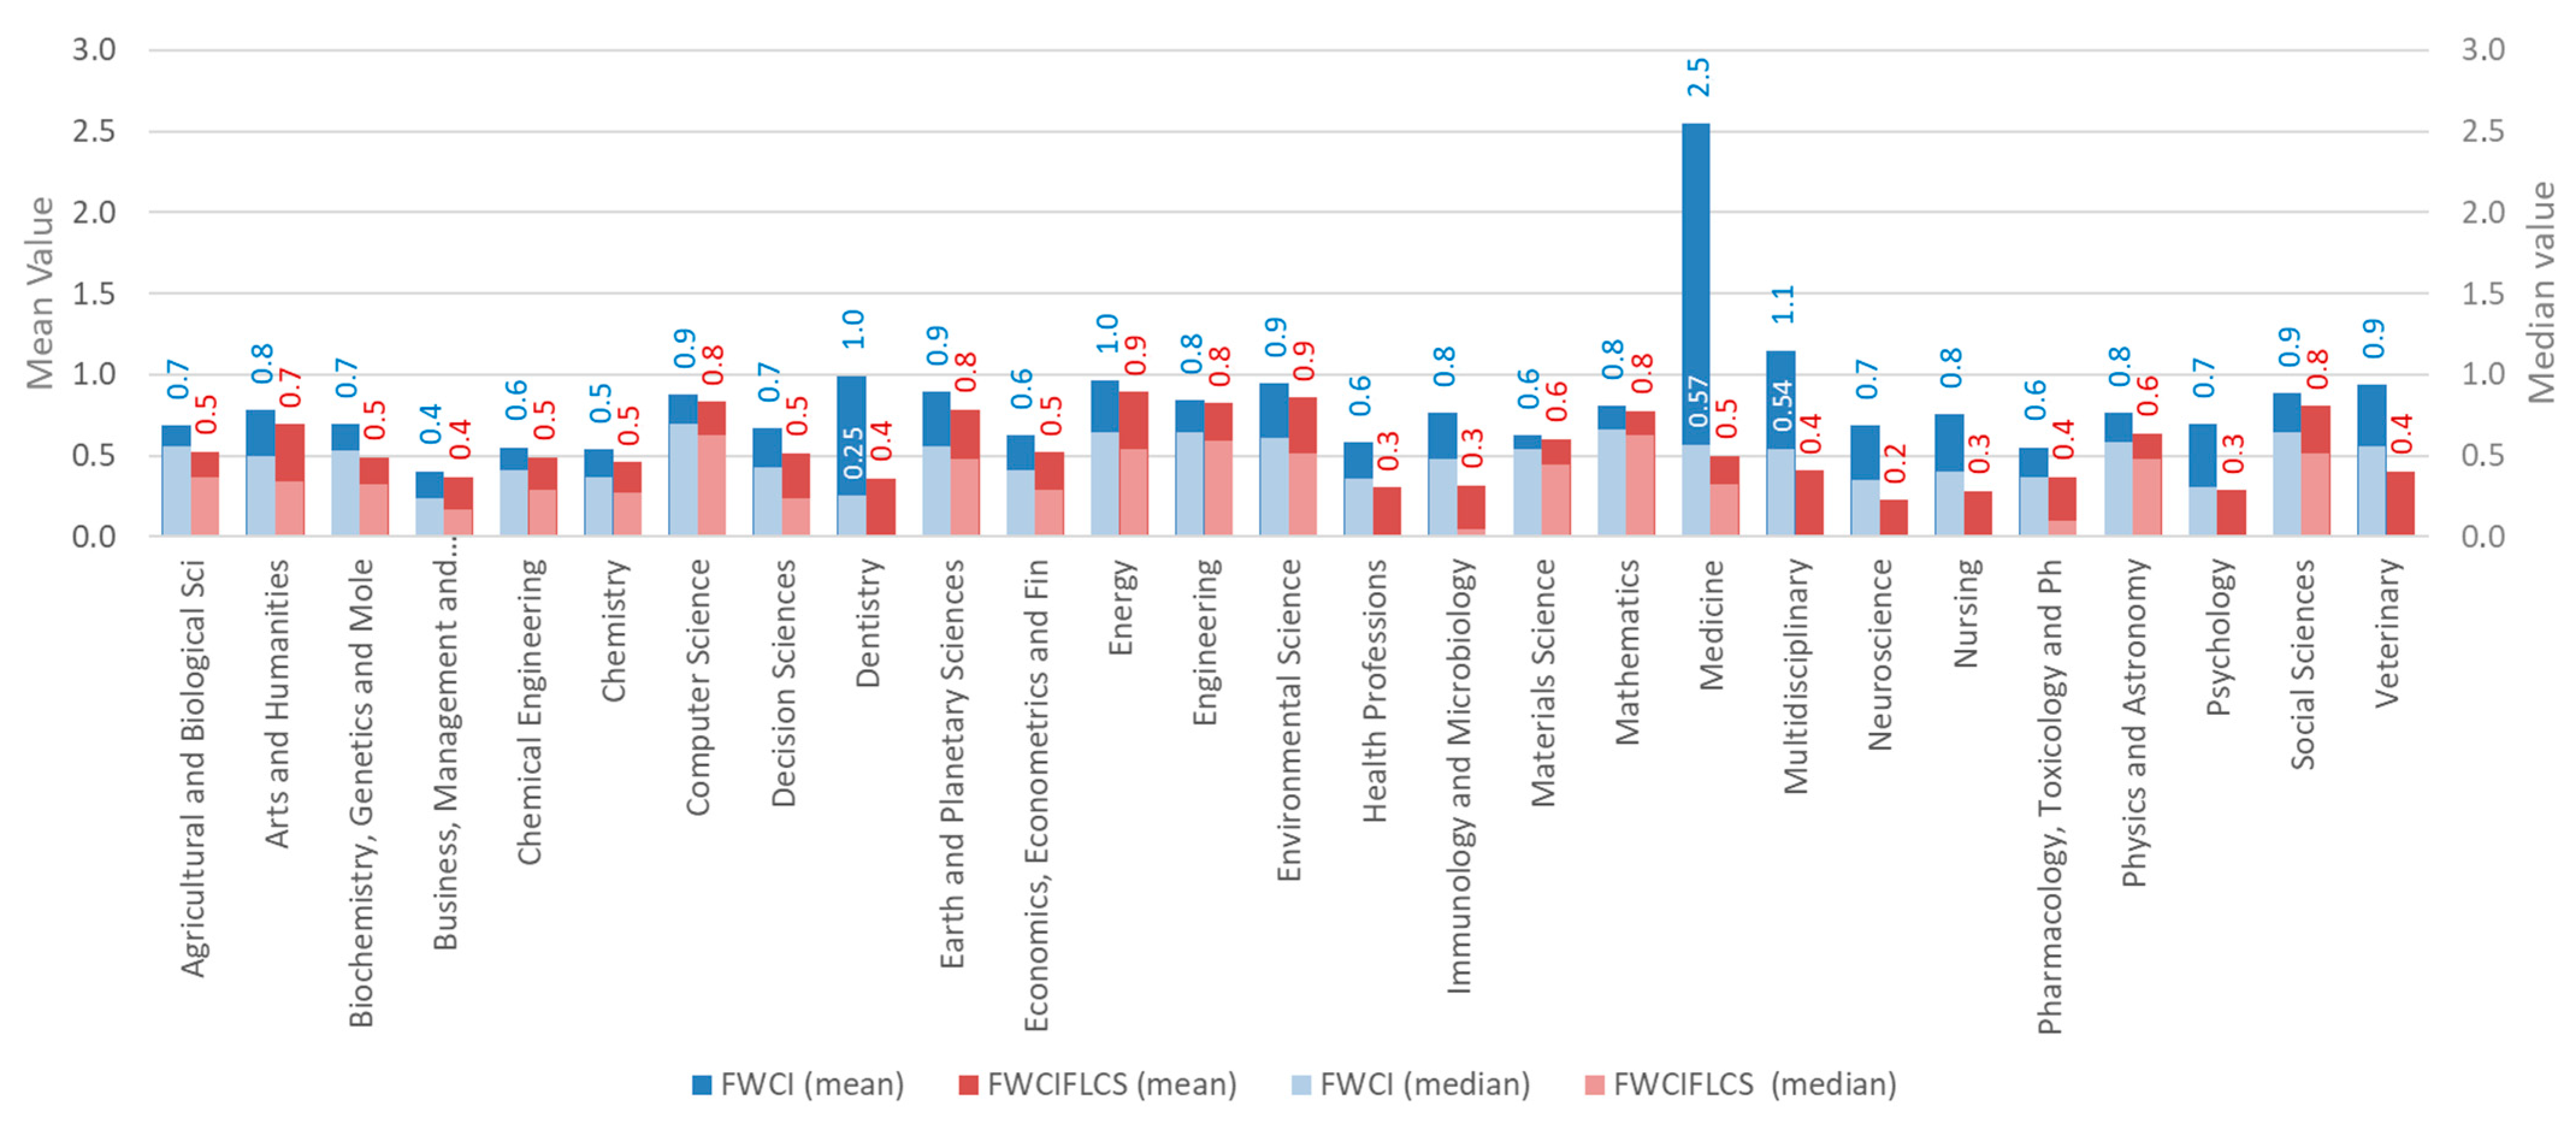
On average, the highest FWCI is observed in medicine (mean = 2.5, SD = 9.6), indicating strong research visibility, however the median value of 0.57 indicates that this average is driven by a small number of highly cited publications, with the majority of outputs performing below the average. Other high-performing areas include multidisciplinary area (mean = 1.1, Mdn = 0.54, SD = 1.3) and energy (mean = 1.0, Mdn = 0.64, SD = 1.2). However, among the 27 ASJC categories, 12 have a mean FWCI below 0.75, and 13 have a median below 0.5, with business and management exhibiting the lowest mean FWCI of 0.4 (Mdn = 0.24), indicating limited global reach or lower citation uptake in these areas. When considering authorship position, focusing only on publications where the researcher is listed as first, last, corresponding, or single author (FWCI
FLCS), the mean values drop in all categories. The most pronounced drops between FWCI and FWCI
FLCS means occur in medicine (from 2.5 to 0.5), multidisciplinary (from 1.1 to 0.4), and dentistry (from 1.0 to 0.4). This decline suggests a decrease in the frequency of Kazakhstani researchers holding leading authorship roles in these areas. Minimal difference between mean values of FWCI and FWCI
FLCS was found in engineering (0.02), business, management and accounting, materials science, and mathematics (all 0.03).
Figure 4 presents the means and medians of FWCI and FWCI
FLCS side by side across all ASJC categories, with 7 subject areas (dentistry, health professions, multidisciplinary, neurosciences, nursing, psychology, and Veterinary) having a median FWCI
FLCS value of 0.
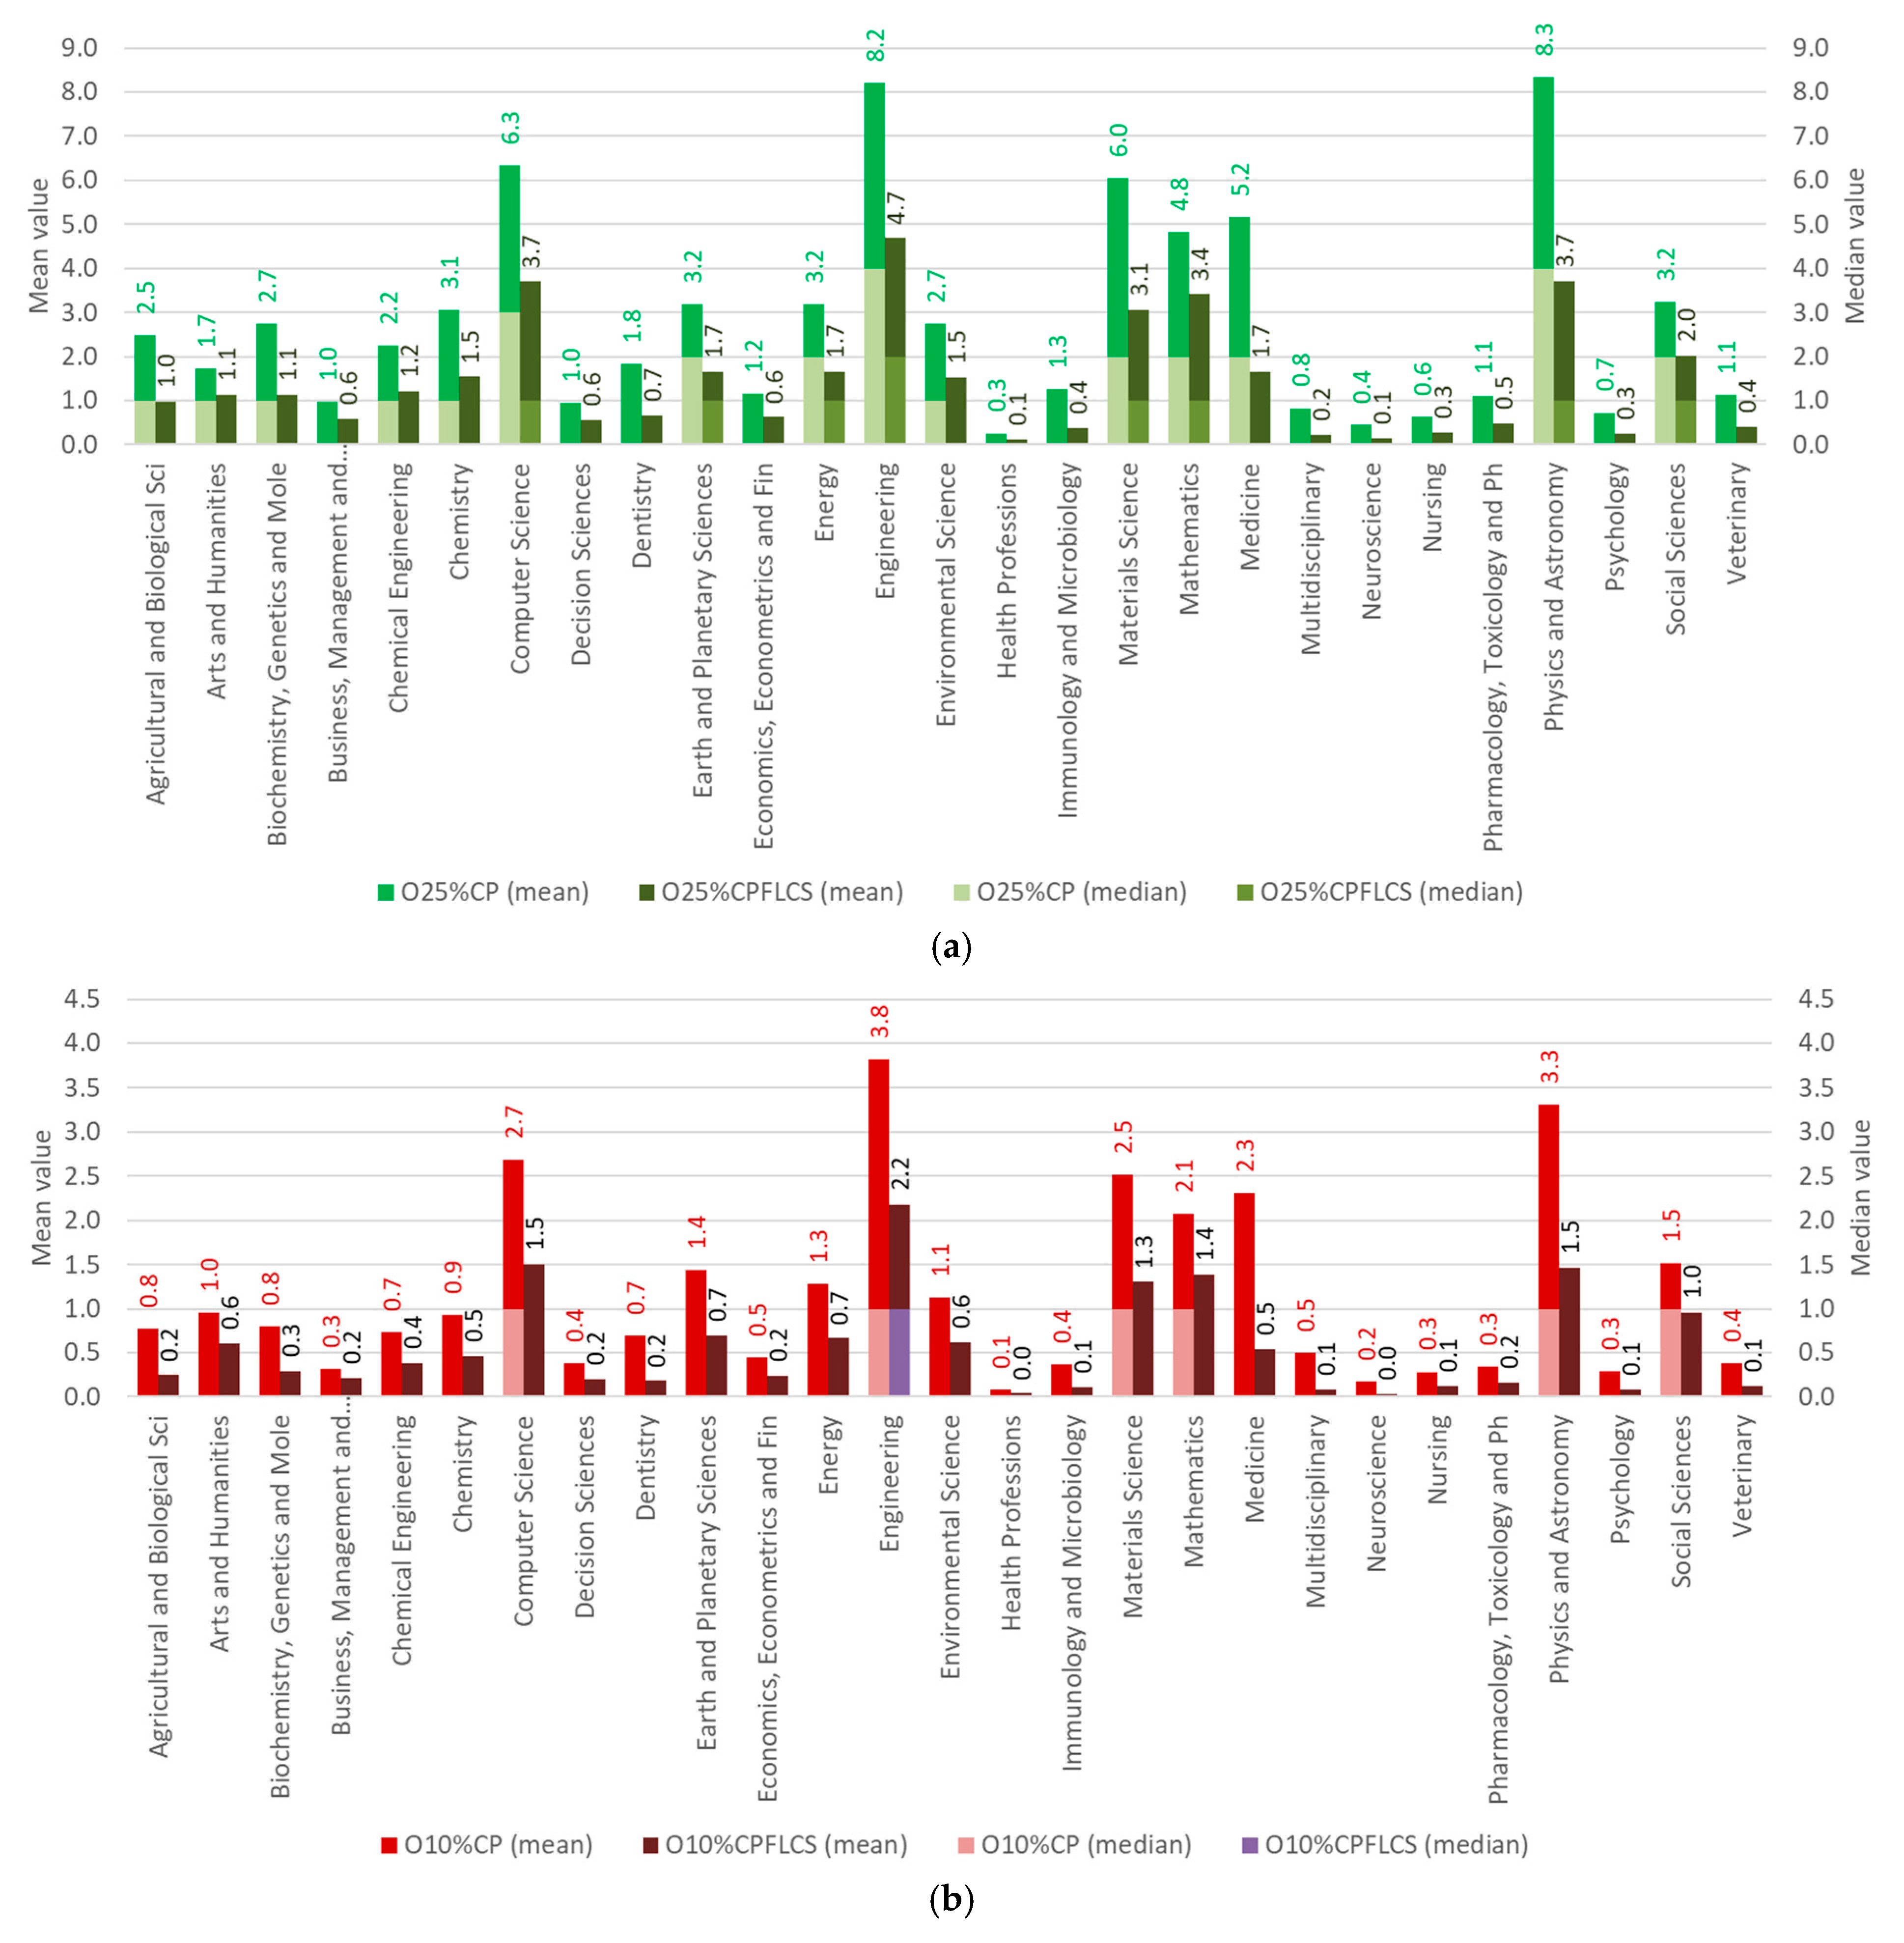
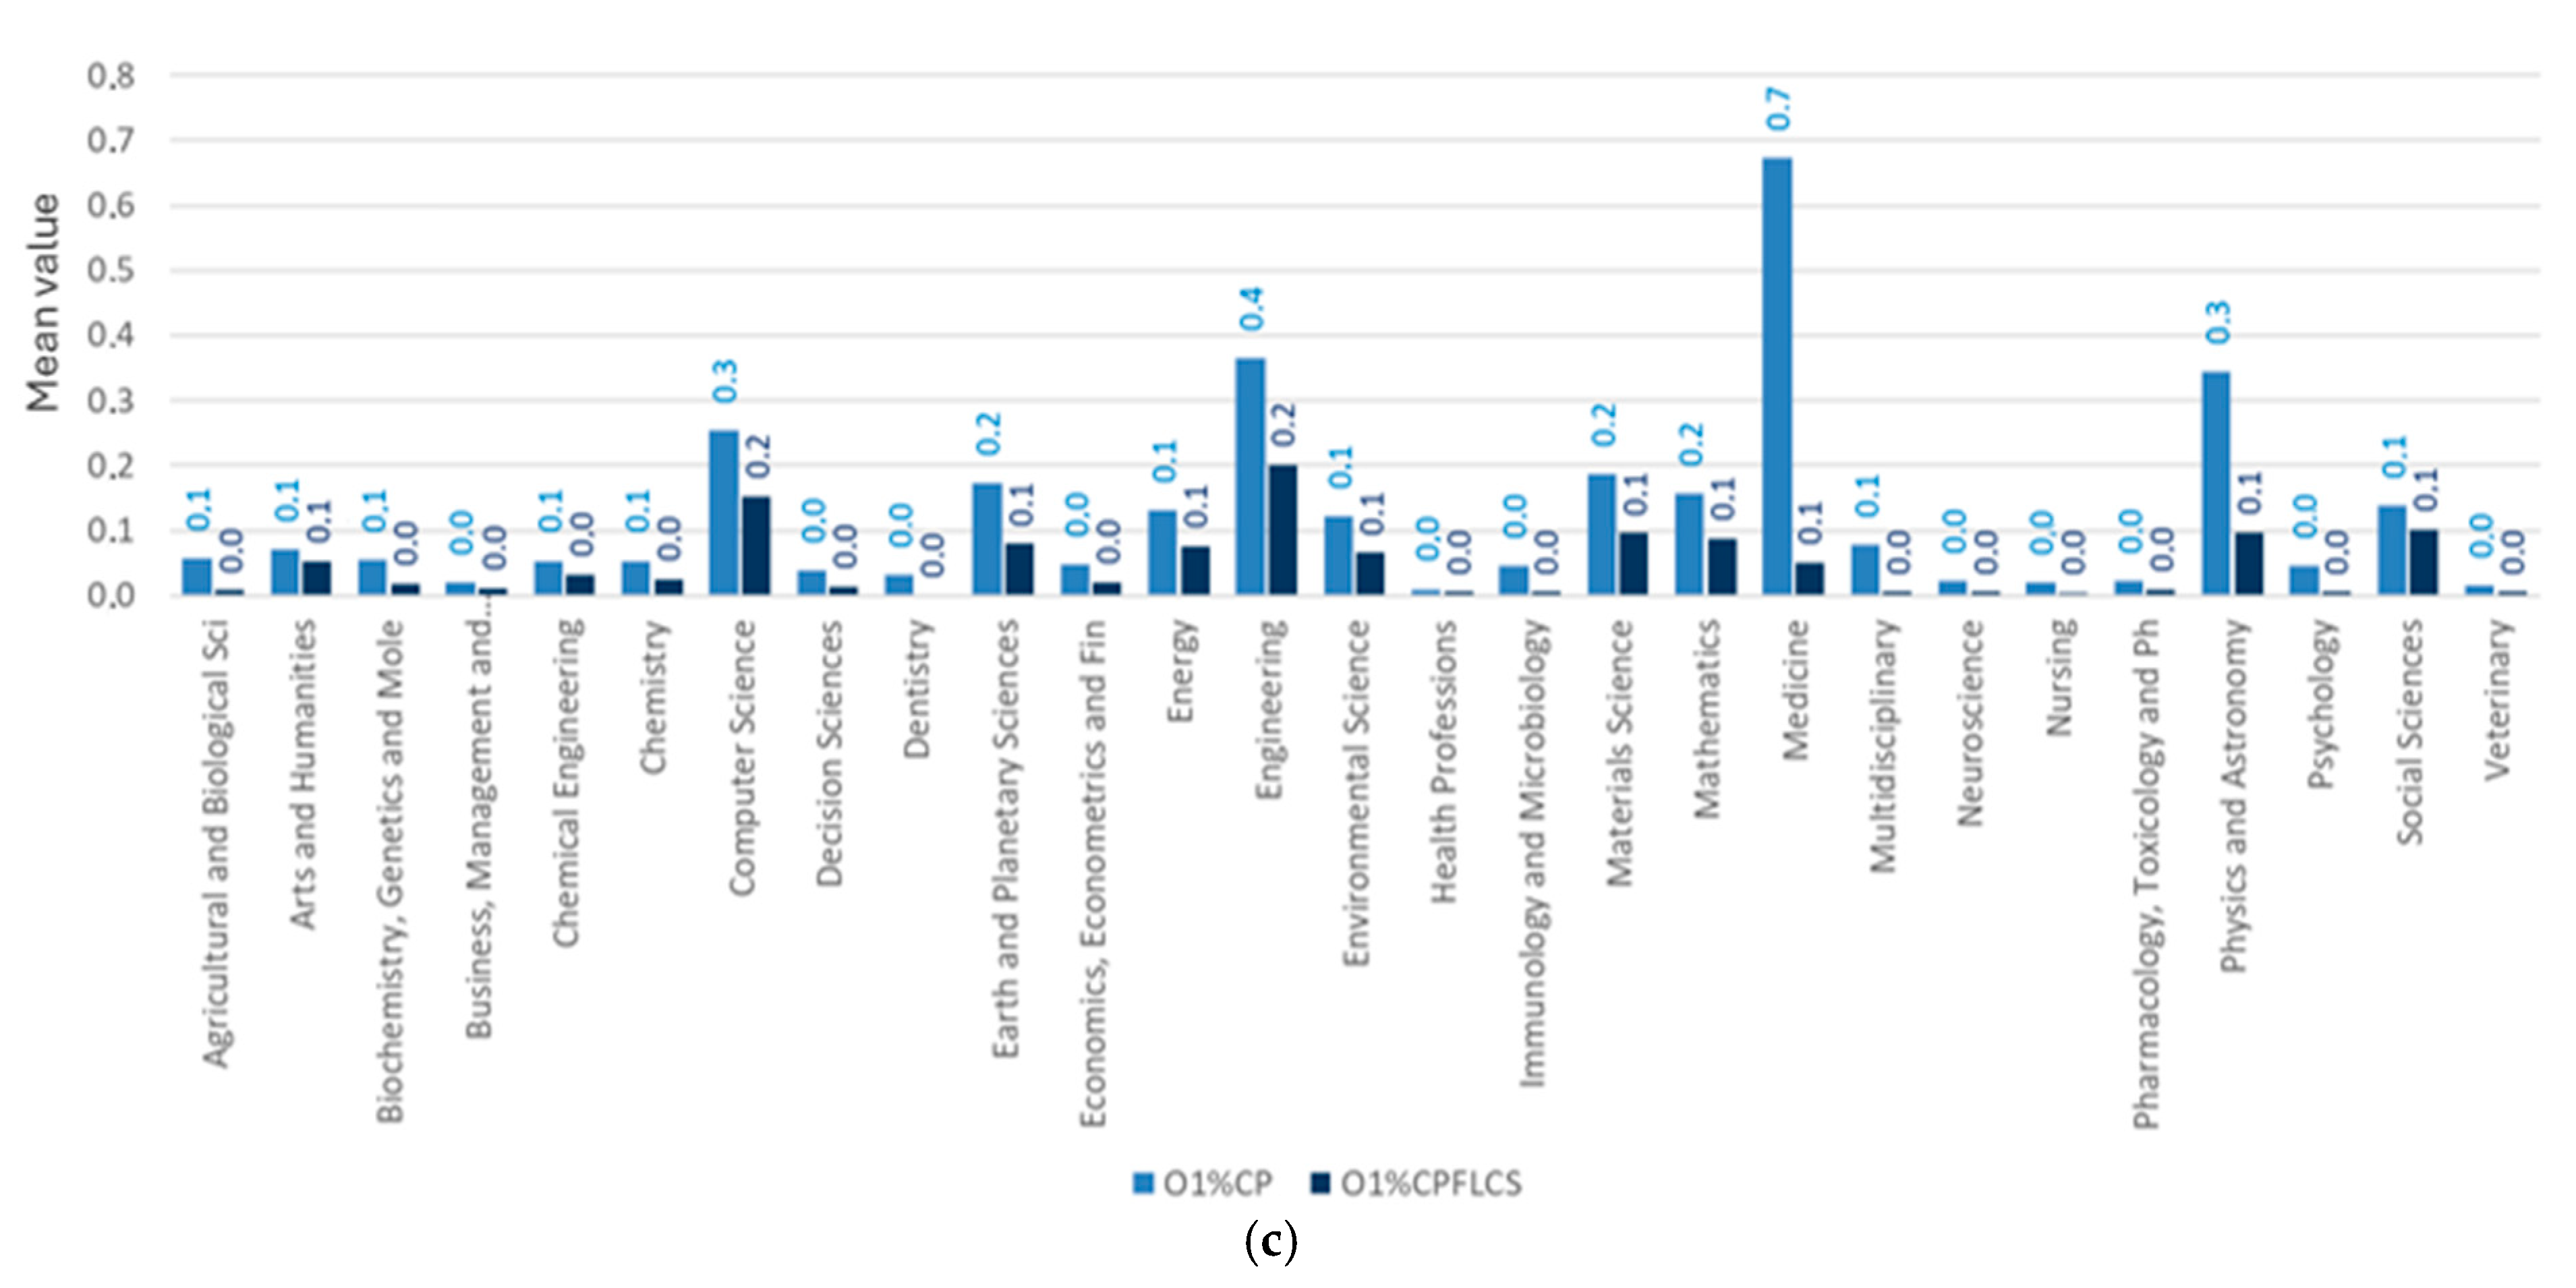
An examination of outputs in the top citation percentiles reveals notable variation in research excellence across disciplines. O25%CP shows that fields such as physics and astronomy (mean = 8.3, Mdn = 4, SD = 17.3), engineering (mean = 8.2, Mdn = 4, SD = 15.6), and computer science (mean = 6.3, Mdn = 3, SD = 17.6) consistently produce a substantial share of highly cited publications. These domains are closely followed by materials science (mean = 6.0, Mdn = 2, SD = 14.6), medicine (mean = 5.2, Mdn = 2, SD = 10.9), and mathematics (mean = 4.8, Mdn = 2, SD = 11.5), underscoring a strong national presence in the technical and physical sciences (
Figure 5a). As the citation threshold narrows, the distribution tightens. Still, the leading disciplines remain largely the same, though mean and median values decline. Engineering (mean = 3.8, Mdn = 1, SD = 8.1), physics and astronomy (mean = 3.3, Mdn = 1, SD = 8.7), and computer science (mean = 2.7, Mdn = 1, SD = 8.4) continue to demonstrate above-average performance in O10%CP (
Figure 5b). In the most selective tier (O1%CP), medicine is the only field with a mean above 0.5, reflecting its involvement in extensive, globally impactful studies (
Roth et al., 2018;
Feigin et al., 2021;
Tran et al., 2022;
Ong et al., 2023). Most other areas report very low output at this elite level, with means ranging from 0.0 to 0.3 and zero median values across all research areas, confirming the highly concentrated nature of O1%CP contributions (
Figure 5c).
When analysis is restricted to role-sensitive outputs (publications where researchers appear as first, last, corresponding, or single authors), citation values decline substantially. In the O25%CP
FLCS engineering, physics and astronomy, and computer science remain the strongest, indicating a leadership presence (
Figure 5a). However, for O10%CP
FLCS and especially O1%CP
FLCS outputs, averages drop to near zero across most fields (
Figure 5b,c). This indicates that while researchers often contribute to high-impact publications, they less frequently occupy the authorship positions most associated with intellectual leadership.
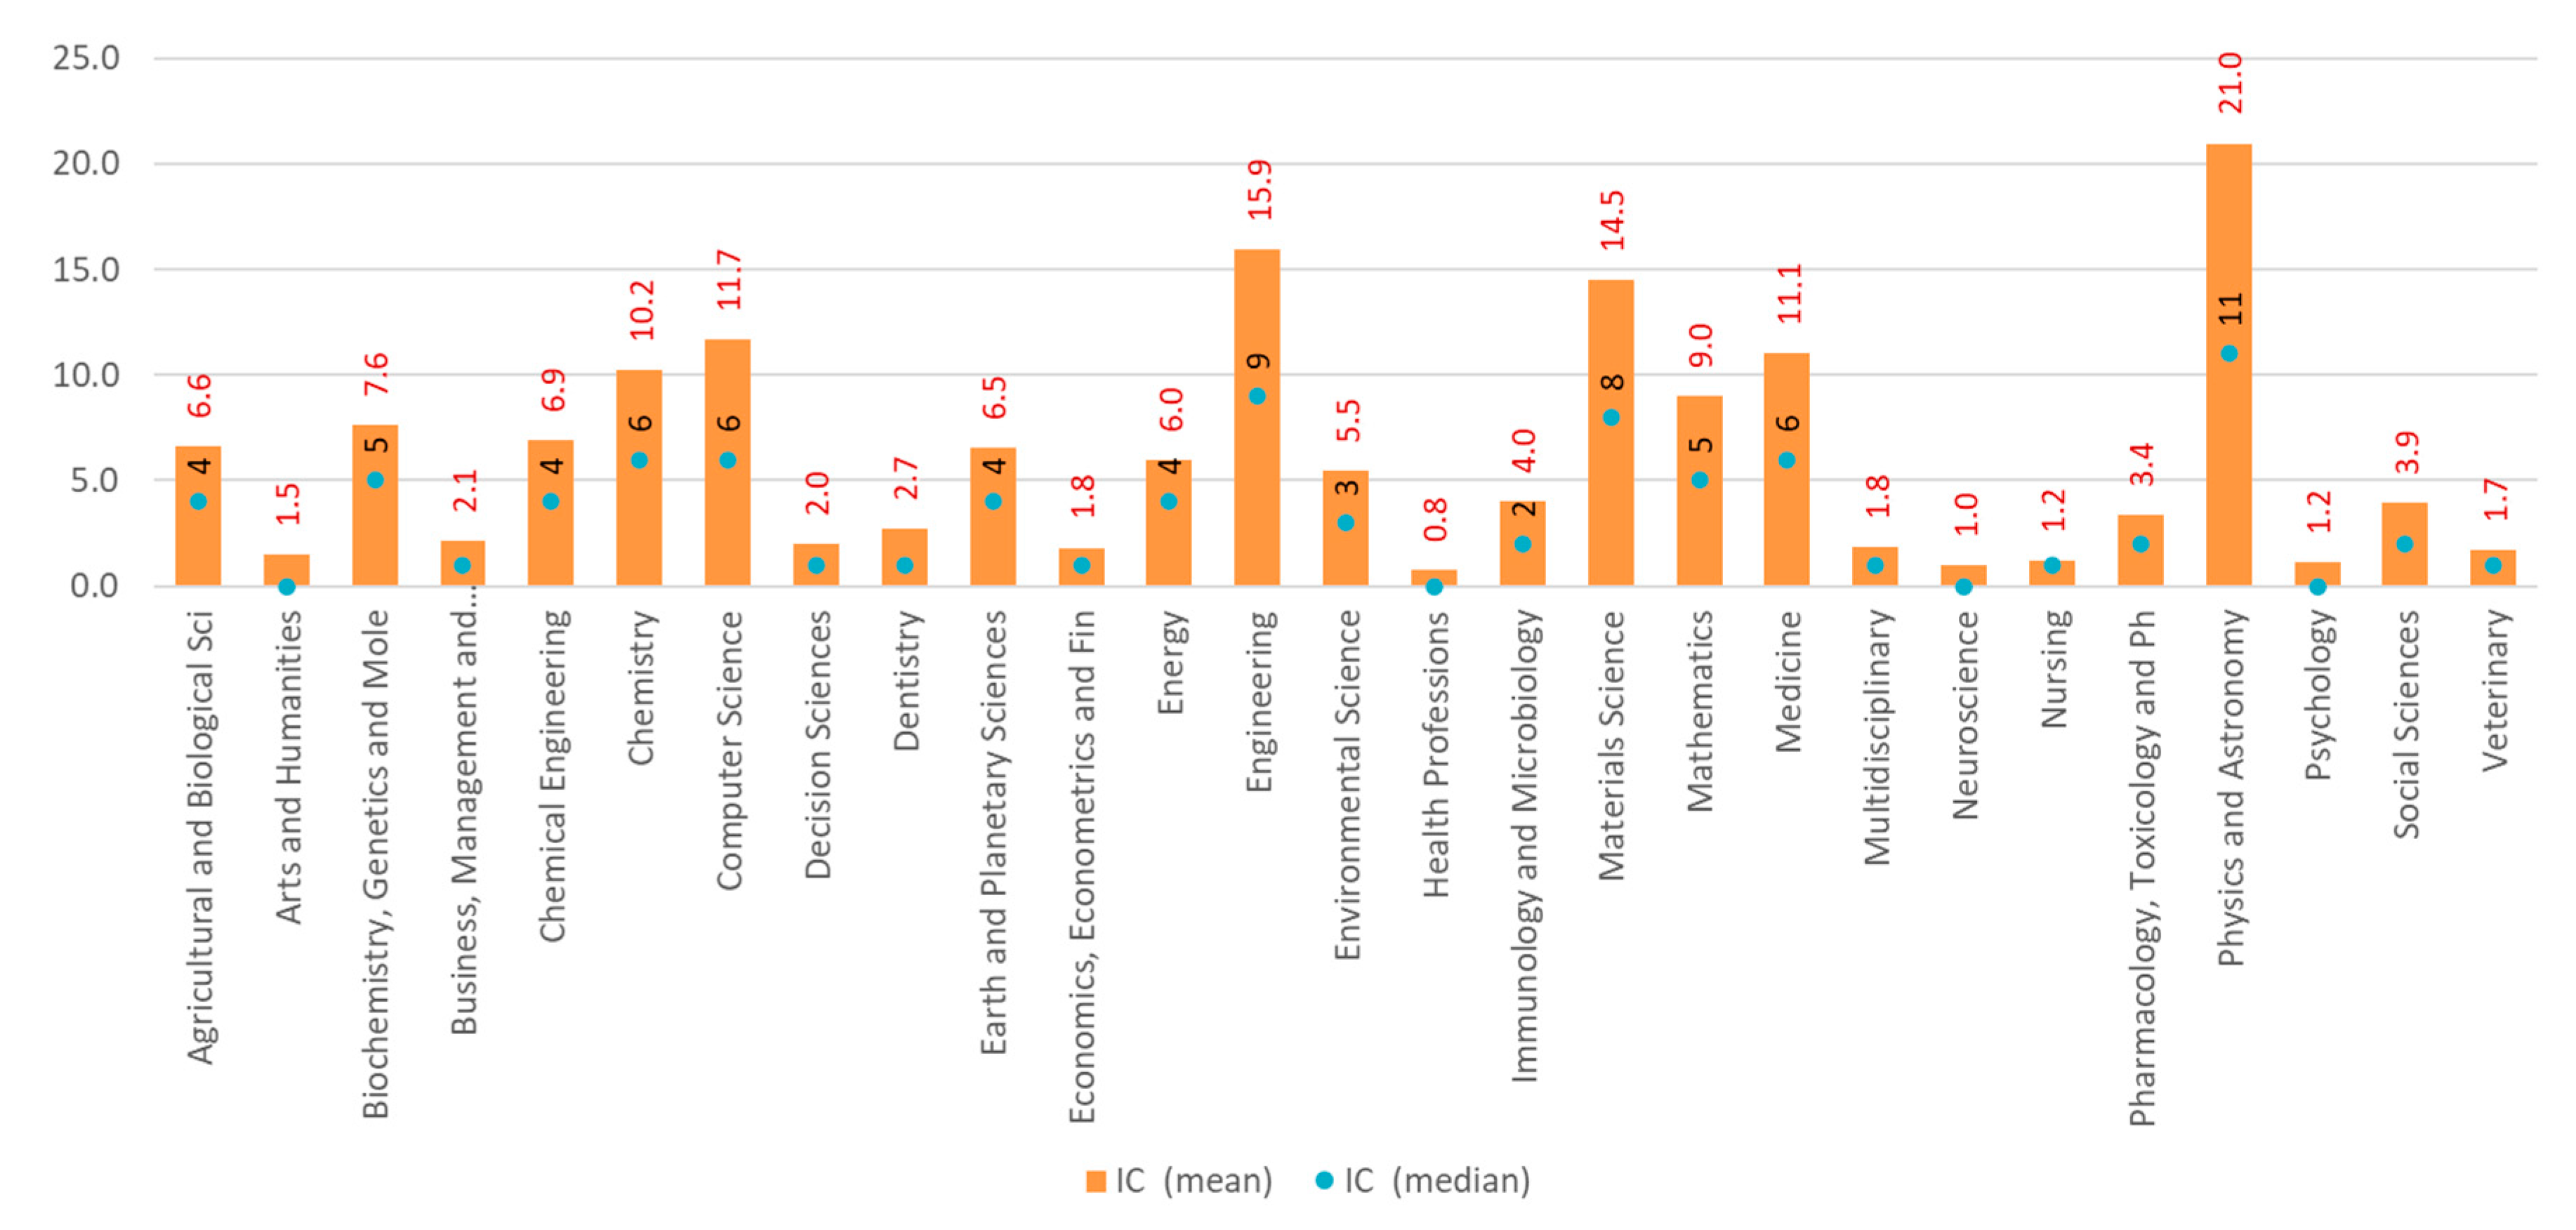
Patterns of international collaboration further reinforce the concentration of excellence in STEM fields. Physics and astronomy (mean = 21.0, Mdn = 11) and engineering (mean = 15.9, Mdn = 9) show the highest mean co-authorship rates with foreign institutions, followed by materials science (14.5), computer science (11.7), and medicine (11.1). In contrast, collaboration levels remain low in disciplines such as nursing (1.0) and health professions (0.8).
Figure 6 shows the mean and standard deviation values of international collaboration by ASJC area.
3.2. Subject-Independent (Overall) Performance
This subsection shifts the focus from disciplinary boundaries to a consolidated national perspective. By aggregating data, it presents a subject-independent statistical profile of Kazakhstan’s 6717 researchers. The metrics are presented in the same order as in the previous subsection, beginning with productivity, h-index and citation, followed by measures of research excellence and citation impact.
Across the dataset, researchers demonstrated wide variation in SO, H, and CC, as seen in
Figure 7. The mean SO was approximately 20.5 (Mdn = 11, SD = 38.7), with a maximum of 1248 papers, indicating a heavily skewed distribution due to the presence of a few extremely prolific authors. The h-index averaged 5.4 (Mdn = 4, SD = 6.1) with a maximum of 89, again showing substantial dispersion. For CC, the mean was 263.9 (Mdn = 45), but the range spanned from zero to over 81,000.
Across all 6717 Kazakhstani researchers, 112 have 0 citations. The mean is 0.87, implying that, on average, 13% of citations are self-citations. The median is slightly higher (0.93), indicating a right-skew driven by a minority of heavily self-citing profiles. Roughly 15% of researchers have less than 0.75, and 3.2% fall below 0.50, signaling potential “citation-farm” behavior or very small, insular research niches. Conversely, 40% of authors have higher than 0.95.
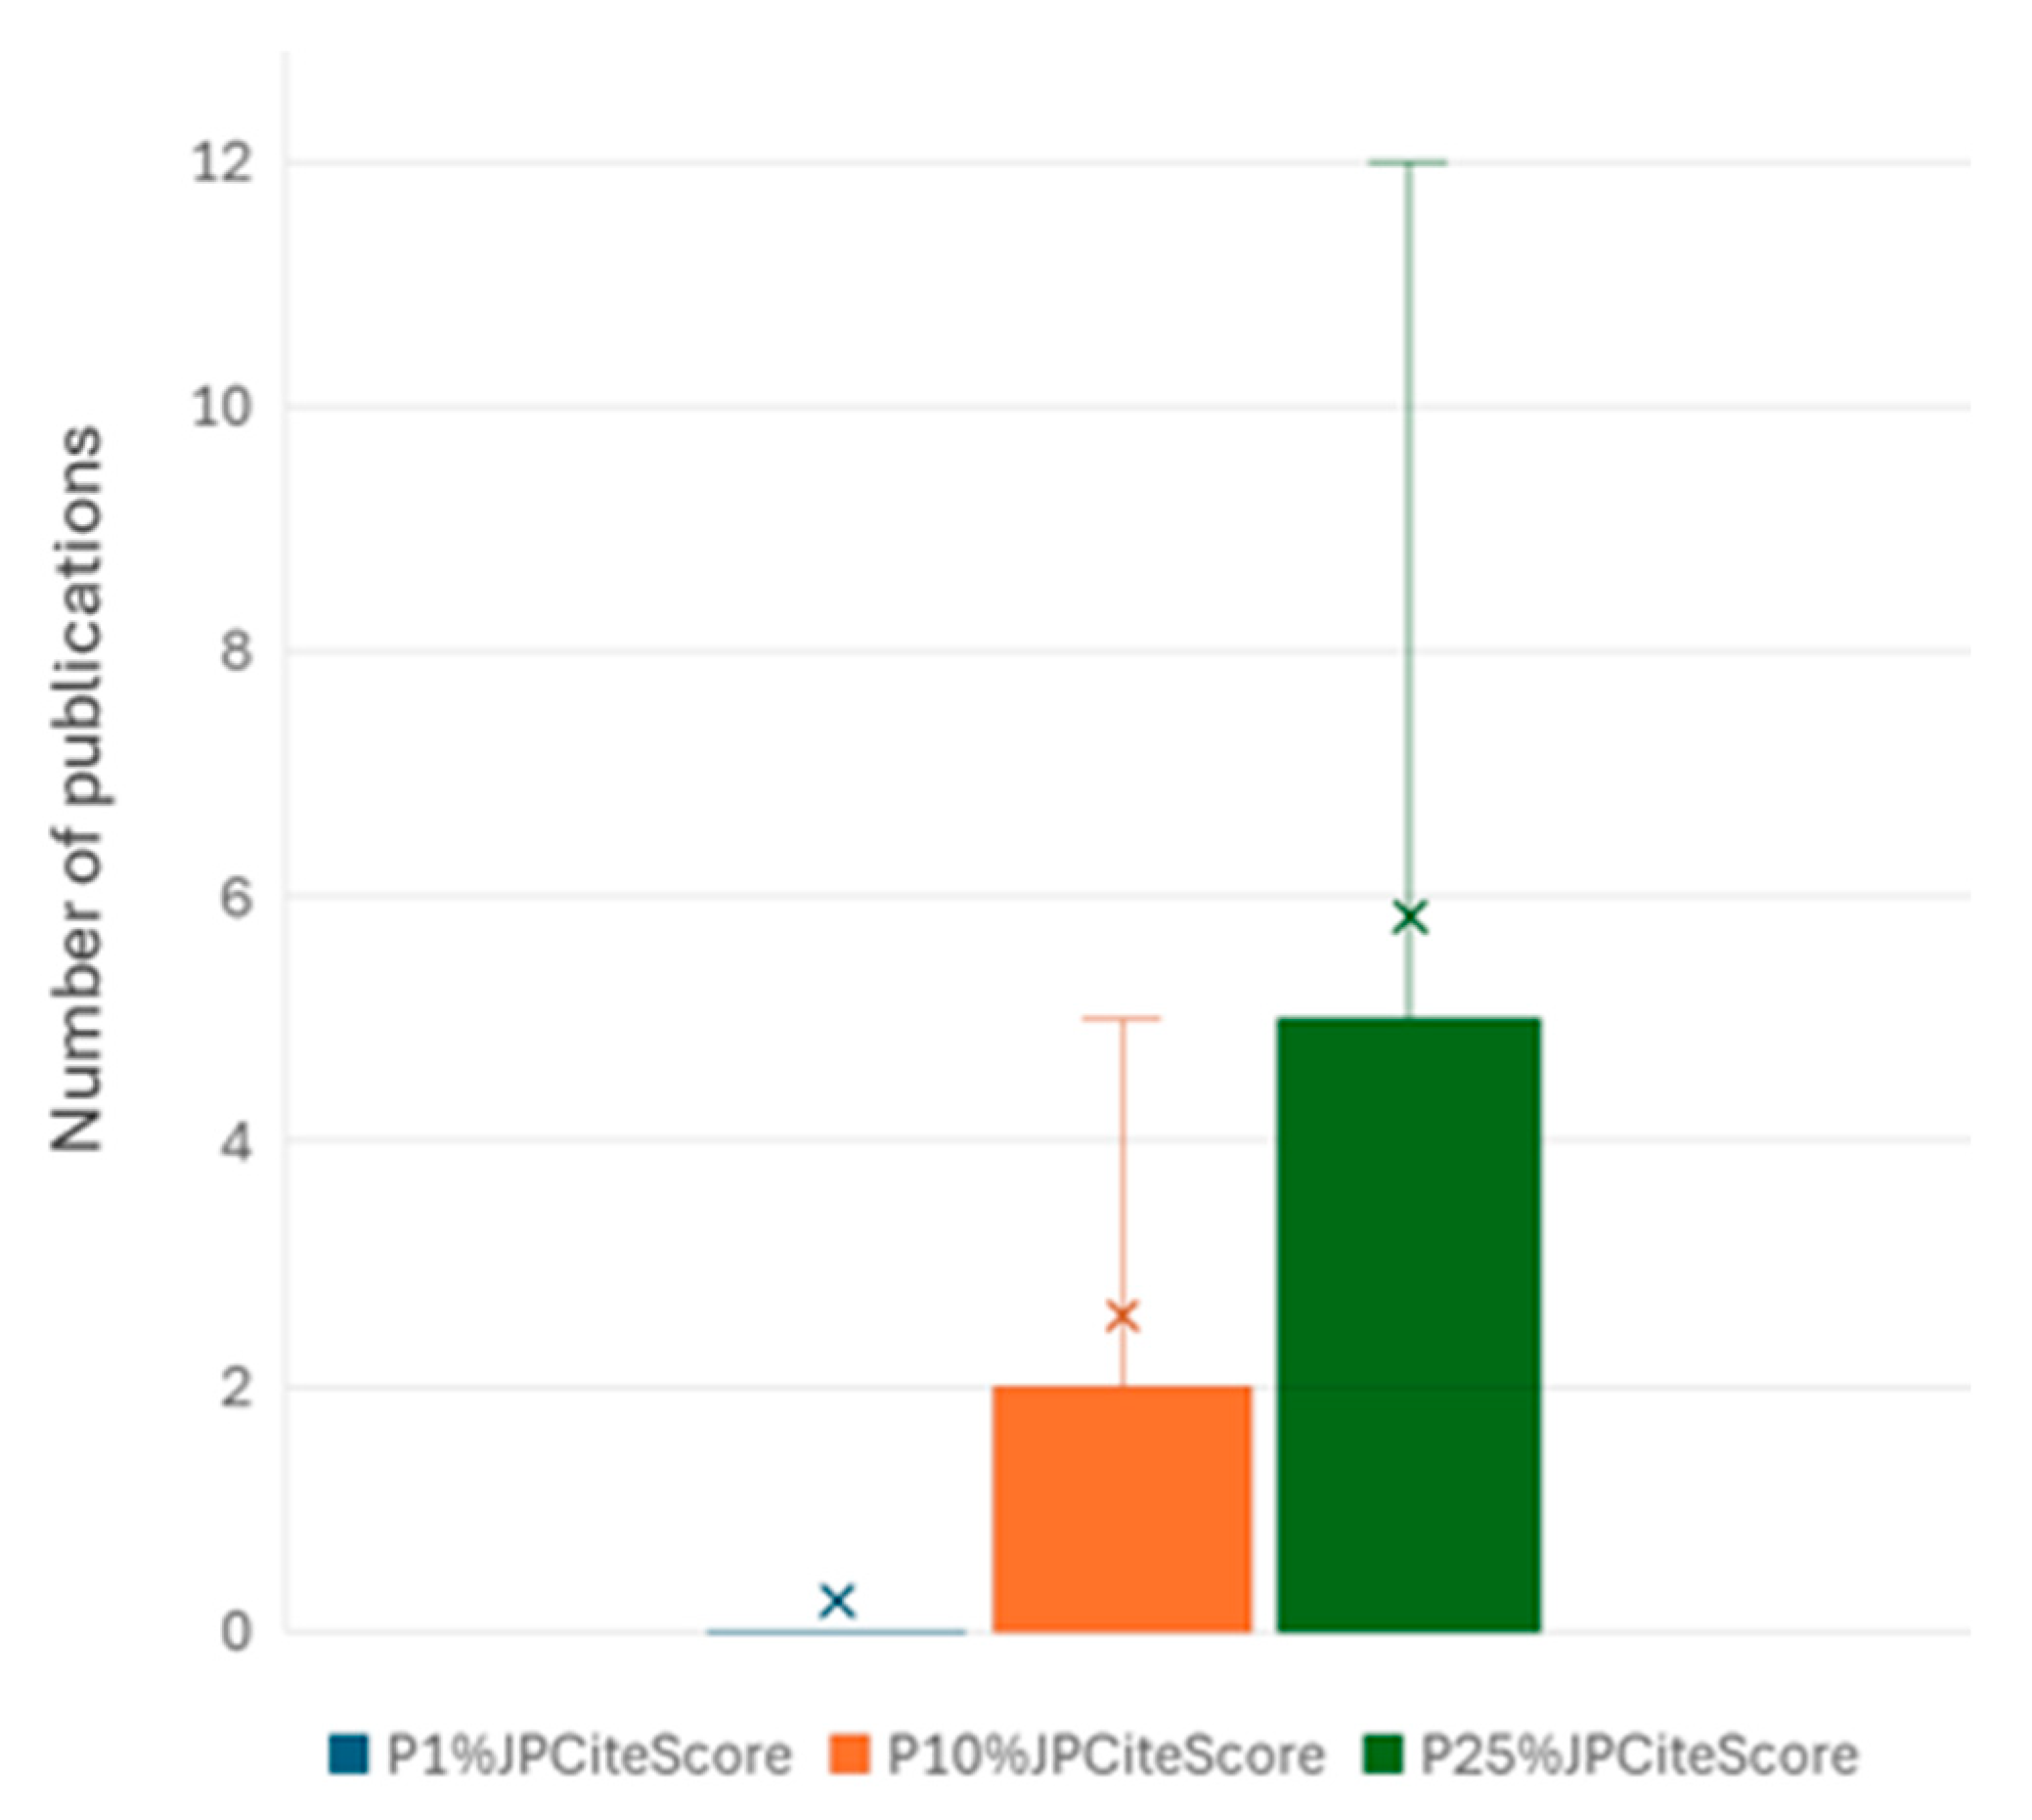
In terms of the research excellence domain, it was observed that the distribution of publications across the top journal percentiles, as defined by CiteScore, was strongly right-skewed. While a broader range of outputs is found in moderately ranked journals (top 10% and 25%), publications in the top 1% journal percentiles were found to be infrequent, with a mean value of 0.3, as shown in
Figure 8. Only 522 researchers out of 6717 (7.8%) have at least one article in a top 1% journal. For the top 10% journal percentiles, the average number of publications was 2.6, accompanied by a large SD of 12.4 (Mdn = 0). Publications within the top 25% journal percentiles were more common, with a mean value of 5.8 (Mdn = 2). However, the high variability observed (SD exceeding 18.8) again indicated significant dispersion. These results reflect that a minimal number of publications appear in high-impact journals.
The mean FWCI across the 27 ASJC subject areas is 0.83 (Mdn = 0.5), suggesting that, overall, Kazakhstani researchers publish at a level below the global citation average (FWCI = 1.0). When authorship roles were restricted to first, last, corresponding, or single authors (FWCI
FLCS), the mean dropped further to 0.54 (Mdn = 0.3), suggesting that individuals in key authorship positions tended to receive even lower citation impact relative to the field. With respect to high-impact citation percentiles, the output in the top 1% field-weighted citation percentiles (O1%CP) averaged 0.22 publications per entity. This value declined to 0.08 for those holding key authorship positions (O1%CP
FLCS), highlighting a reduced presence of leading authors in the most highly cited research outputs. A similar trend was observed in the top 10% and top 25% citation percentiles, as shown in
Figure 9. These patterns point to a notable disparity in citation performance between overall publication output and contributions from lead or corresponding authors. The level of international collaboration (IC) was relatively high, with a mean value of 9.75. This indicates that the average entity engaged in nearly ten internationally co-authored publications, which may serve as a positive indicator of global research connectivity despite modest citation impact indicators.
3.3. Correlation Analysis
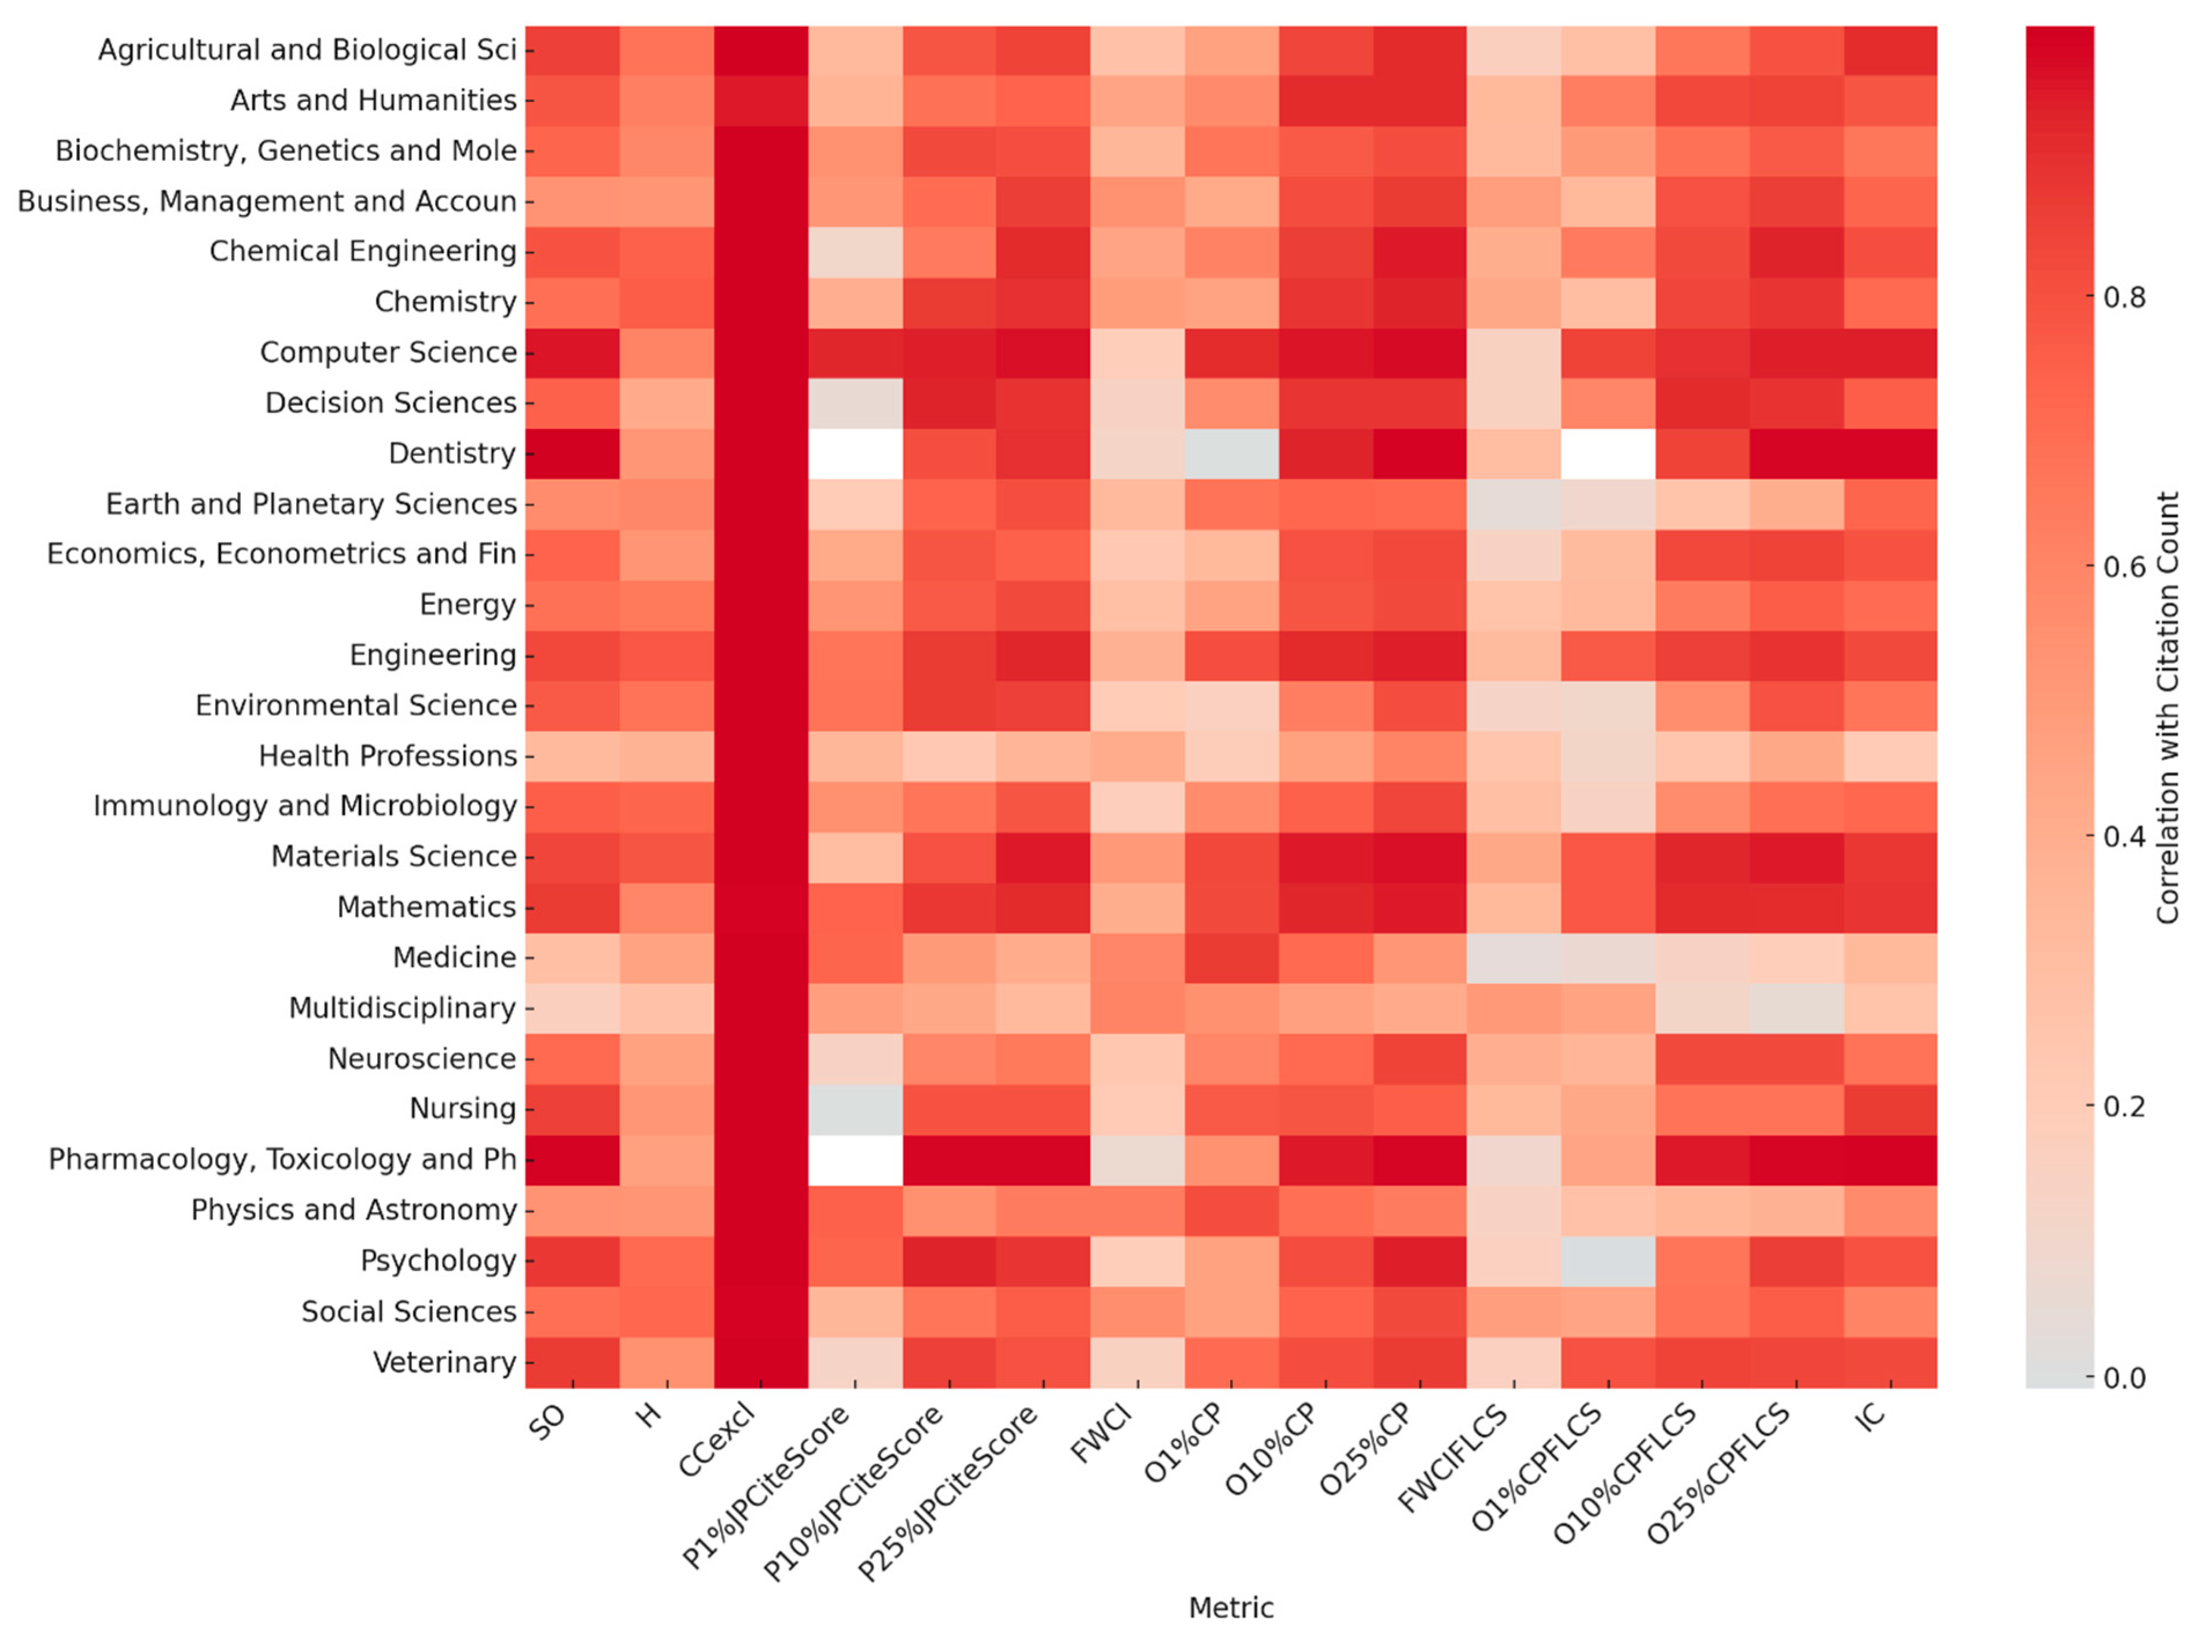
A correlation analysis was conducted to understand relationships among key research performance indicators across ASJC subject areas and overall. The focus was on the associations between impact metrics (H and CC) and excellence indicators like FWCI, top percentile outputs, and IC. This section identifies the strongest drivers of H and CC, structured into two subsections: one on discipline-specific correlations and the other on general trends across the dataset. Pearson correlation was used as a preliminary measure of association among indicators. We acknowledge that the assumptions of linearity and normality for the data used do not fully hold; these results should be interpreted with caution.
3.3.1. Correlation Patterns Across Subject Areas
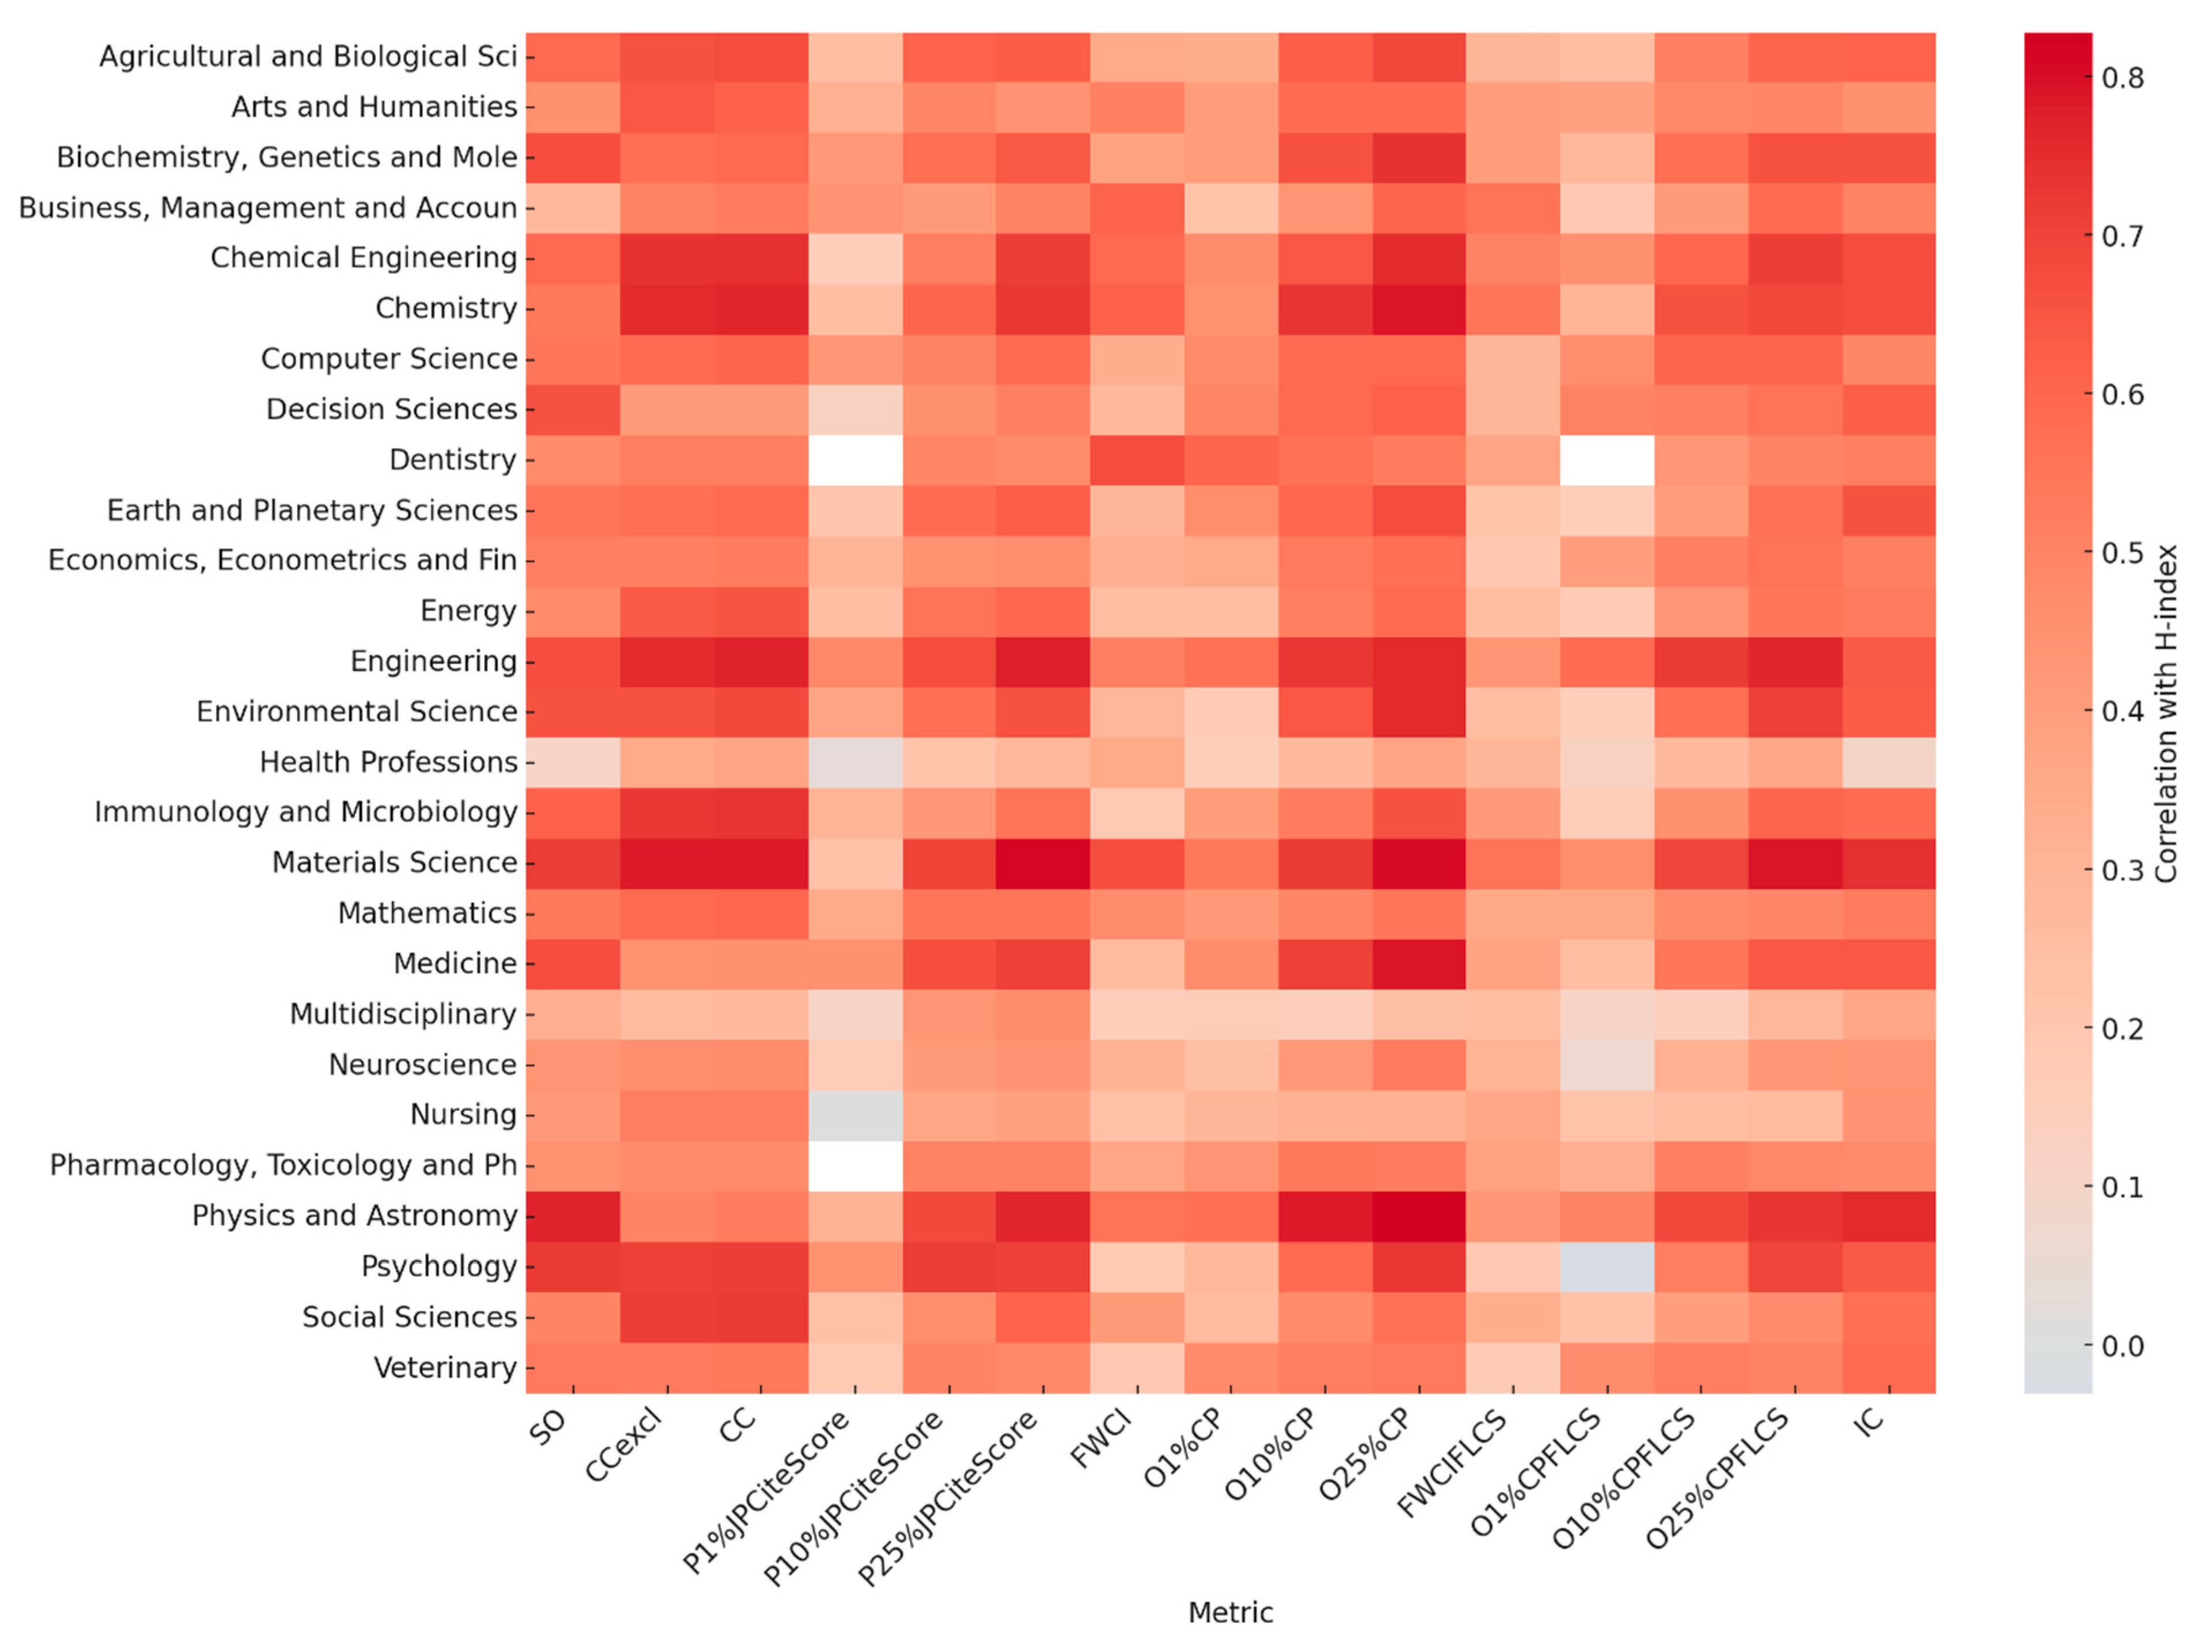
Correlation analysis reveals distinct patterns in how various research excellence metrics relate to H and CC. As shown in
Figure 10, for H, the strongest and most consistent correlations were observed with O25%CP and P10%JP
CiteScore. Fields such as engineering, physics, and computer science exhibit robust associations with these metrics, suggesting that, not surprisingly, steady publishing in a top journal, and (if possible) with high-impact output, are key drivers of H accumulation. In general, the H is expected to correlate strongly with SO, as it reflects both productivity and impact. However, in the Kazakhstani context, association is field-dependent, which can be explained by the presence of many low-citation papers in some fields, which do not contribute to increasing the H. Publishing in high-impact journals for the health professions, business, and arts fields is more challenging and occurs less frequently. As a result, in these fields, simply publishing many papers is not enough to increase the H. What matters more is how often others cite those papers. For physics and astronomy, psychology, medicine, and material science, however, H is strongly correlated with SO. And in almost every field, it correlates closely with CC. In contrast, the most elite indicators, such as O1%CP and P1%JP
CiteScore, exhibit only minimal correlations with H, likely due to their rarity and skewed distribution.
In contrast, correlation with CC is more sensitive to extreme values, such as occasional appearances in the top 1% citation percentile (O1%CP) or publications in the Top 1% CiteScore journals (P1%JP
CiteScore). These metrics, though less predictive of H, display higher correlation with CC in computer science, medicine, environmental science, and physics, see
Figure 11. For some fields, CC is also highly correlated with the number of papers published (SO), especially in computer science, dentistry, pharmacology, and psychology. Metrics tied to author position (O1%CP
FLCS, O10%CP
FLCS, etc.) display noticeably weaker correlations, suggesting that visible authorship roles, while necessary for leadership recognition, contribute less directly to long-term H growth. Additionally, IC exhibits a field-dependent influence, being strongly predictive in disciplines such as physics and astronomy, as well as material science, but marginal for other areas.
Overall, the results indicate that for Kazakhstan, broad publication performance in medium-level journals (P25%JPCiteScore) and output in the top 10% or top 25% citation percentiles (O10%CP and O25%CP) are more predictive of H and CC than selective authorship roles or top-journal publications alone.
3.3.2. Subject-Independent Correlation
The overall correlation analysis reveals a divide between metrics that support H and those that contribute to CC. Among all indicators, SO and O25%CP exhibit the strongest correlation with H (r = 0.81 and 0.83, respectively). Similarly, O25%CPFLCS and P25%JPCiteScore also align closely with H, indicating that both the productivity and citation quality of published work matter for gaining high H numbers. IC correlates with the H as strongly as journal excellence metrics (r ≈ 0.77). Obtaining a visible authorship role (first, last, corresponding, or single author) in publications related to O25%CPFLCS further strengthens the H association to 0.77. In contrast, the same role in high output (top 1% and top 10%) has a negligible effect (r ≈ 0.50 for O1%CPFLCS and 0.68 for O10%CPFLCS).
On the other hand, CC correlates most strongly with O1%CP (r = 0.80), underscoring the weight of a few highly cited publications in increasing CC. Notably, FWCI shows only modest correlation with all other metrics, suggesting it captures a distinct dimension of impact. Indicators based on authorship role (FLCS) show relatively weaker correlations overall, implying that author position alone is a limited predictor of citation-based performance at the aggregate level.
Figure 12 shows the overall correlation heatmap.
3.4. Individual-Level Performance Leaders and Disciplinary Benchmarks
To move from the broad level to a more granular perspective, it is informative to examine which individual researchers lead in each metric and consider the possible reasons behind their performance. This step also helps to identify extreme or atypical cases that may disproportionately influence the overall ranking.
Table 3 highlights the leading researchers in Kazakhstan in each metric and subject area used. Notably, R. Myrzakulov (L.N. Gumilyov Eurasian National University) leads in SO with 323 papers within physics and astronomy and ranks first in multiple excellence metrics, including O25%CP, O10%CP
FLCS, and O25%CP
FLCS. The physics and astronomy area also supplies the highest density of highly cited scientists: 11 authors exceed an h-index of 40 with more than 10,000 citations each.
The case of K. Davletov from Asfendiyarov Kazakh National Medical University stands out. Representing the medical domain, he holds the highest H (56), the highest CC (79,793), and the most publications in top 1% journals (57). A striking feature of Davletov’s portfolio is the exceptionally high number of co-authors on many papers. For example, a 2020 article in the Lancet journal (
Abbafati et al., 2020) lists 1598 authors, reflecting participation in large-scale global health consortia such as the Global Burden of Disease (GBD) studies. This pattern is consistent across numerous articles, with other publications featuring several hundred contributors (
Bentham et al., 2017;
Roth et al., 2018,
2020). These multi-author works have led to extremely high citation counts (over 11,900 citations for the top paper (
Abbafati et al., 2020)). While his individual scholarly contribution to each paper may be diluted in such collaborations, the cumulative effect of participating in high-impact international studies has propelled him to the top of multiple metrics in Kazakhstan.
Regarding field-weighted excellence, A. Dushpanova (Al-Farabi Kazakh National University) posts the highest FWCI (14.6). A. Assilova leads in role-weighted FWCIFLCS (23.94) within the economics and finance domain. Still, it is essential to interpret both these indicators (FWCI and FWCIFLCS) with caution. Based on a small number of publications, they can be highly sensitive to a few exceptionally cited articles, potentially inflating perceived impact beyond what would be observed in a broader or more balanced portfolio. Z. Mazhitova (Astana Medical University) leads in elite lead-author citation percentile (O1%CPFLCS), and M. Zdorovets (Institute of Nuclear Physics) records the highest level of IC, with 281 co-authored outputs.
Table 4 presents the top-performing researchers without subject stratification. A clear pattern emerges with several names appearing in the overall list also dominating within their disciplinary categories. K. Davletov, for instance, maintains his leading status across H, CC, FWCI, and P1%JP
CiteScore, O1%CP, and O10%CP reaffirms his position as the most influential researcher in both disciplinary and overall evaluations. Similarly, Zdorovets reappears as the most prolific scholar, not only in SO and IC but also in O25%CP, reinforcing his role as a key figure in multiple metrics.
Some shifts are also notable. R. Myrzakulov, who dominated authorship-sensitive citation metrics within physics and astronomy, retains only one leading position (O25%CPFLCS) in the overall analysis, suggesting that his most substantial contributions remain concentrated within disciplinary boundaries. Meanwhile, Issakhov rises in the overall table as a leader in both standard and authorship-weighted top-10% citation outputs (O10%CP and O10%CPFLCS), reflecting broader cross-field recognition compared to the subject-level view. This overlap between domain-specific and overall leaders underscores the consistency of excellence among a core group of researchers.
3.5. Kazakhstani Top 1% Rankings
This section outlines the key findings of the study, focusing on the top 1% of Kazakhstani researchers ranked by the CPI. It analyzes both subject-specific (KZ-TOP-S) and overall (KZ-TOP) rankings to provide insights into field-specific and cross-disciplinary research excellence. The section also examines the components of each researcher’s CPI, highlighting the roles of productivity, citation impact, and research quality. These results provide a clear view of individual research performance and form the basis of this study, with KZ-TOP-S and KZ-TOP lists included in the
Supplementary Materials.
3.5.1. Ranking by Subject Areas (KZ-TOP-S)
For each subject area, all eligible Kazakhstani author profiles were ranked based on their CPI, and the top 1% were selected. As the analytical extract was capped at 500 authors per ASJC area, this threshold corresponded to the top five researchers in each field. Dentistry was the only exception, with only one researcher awarded due to the limited author list (61 authors). This selection process resulted in 131 positional awards. The present analysis is based solely on the data of these 131 top researchers.
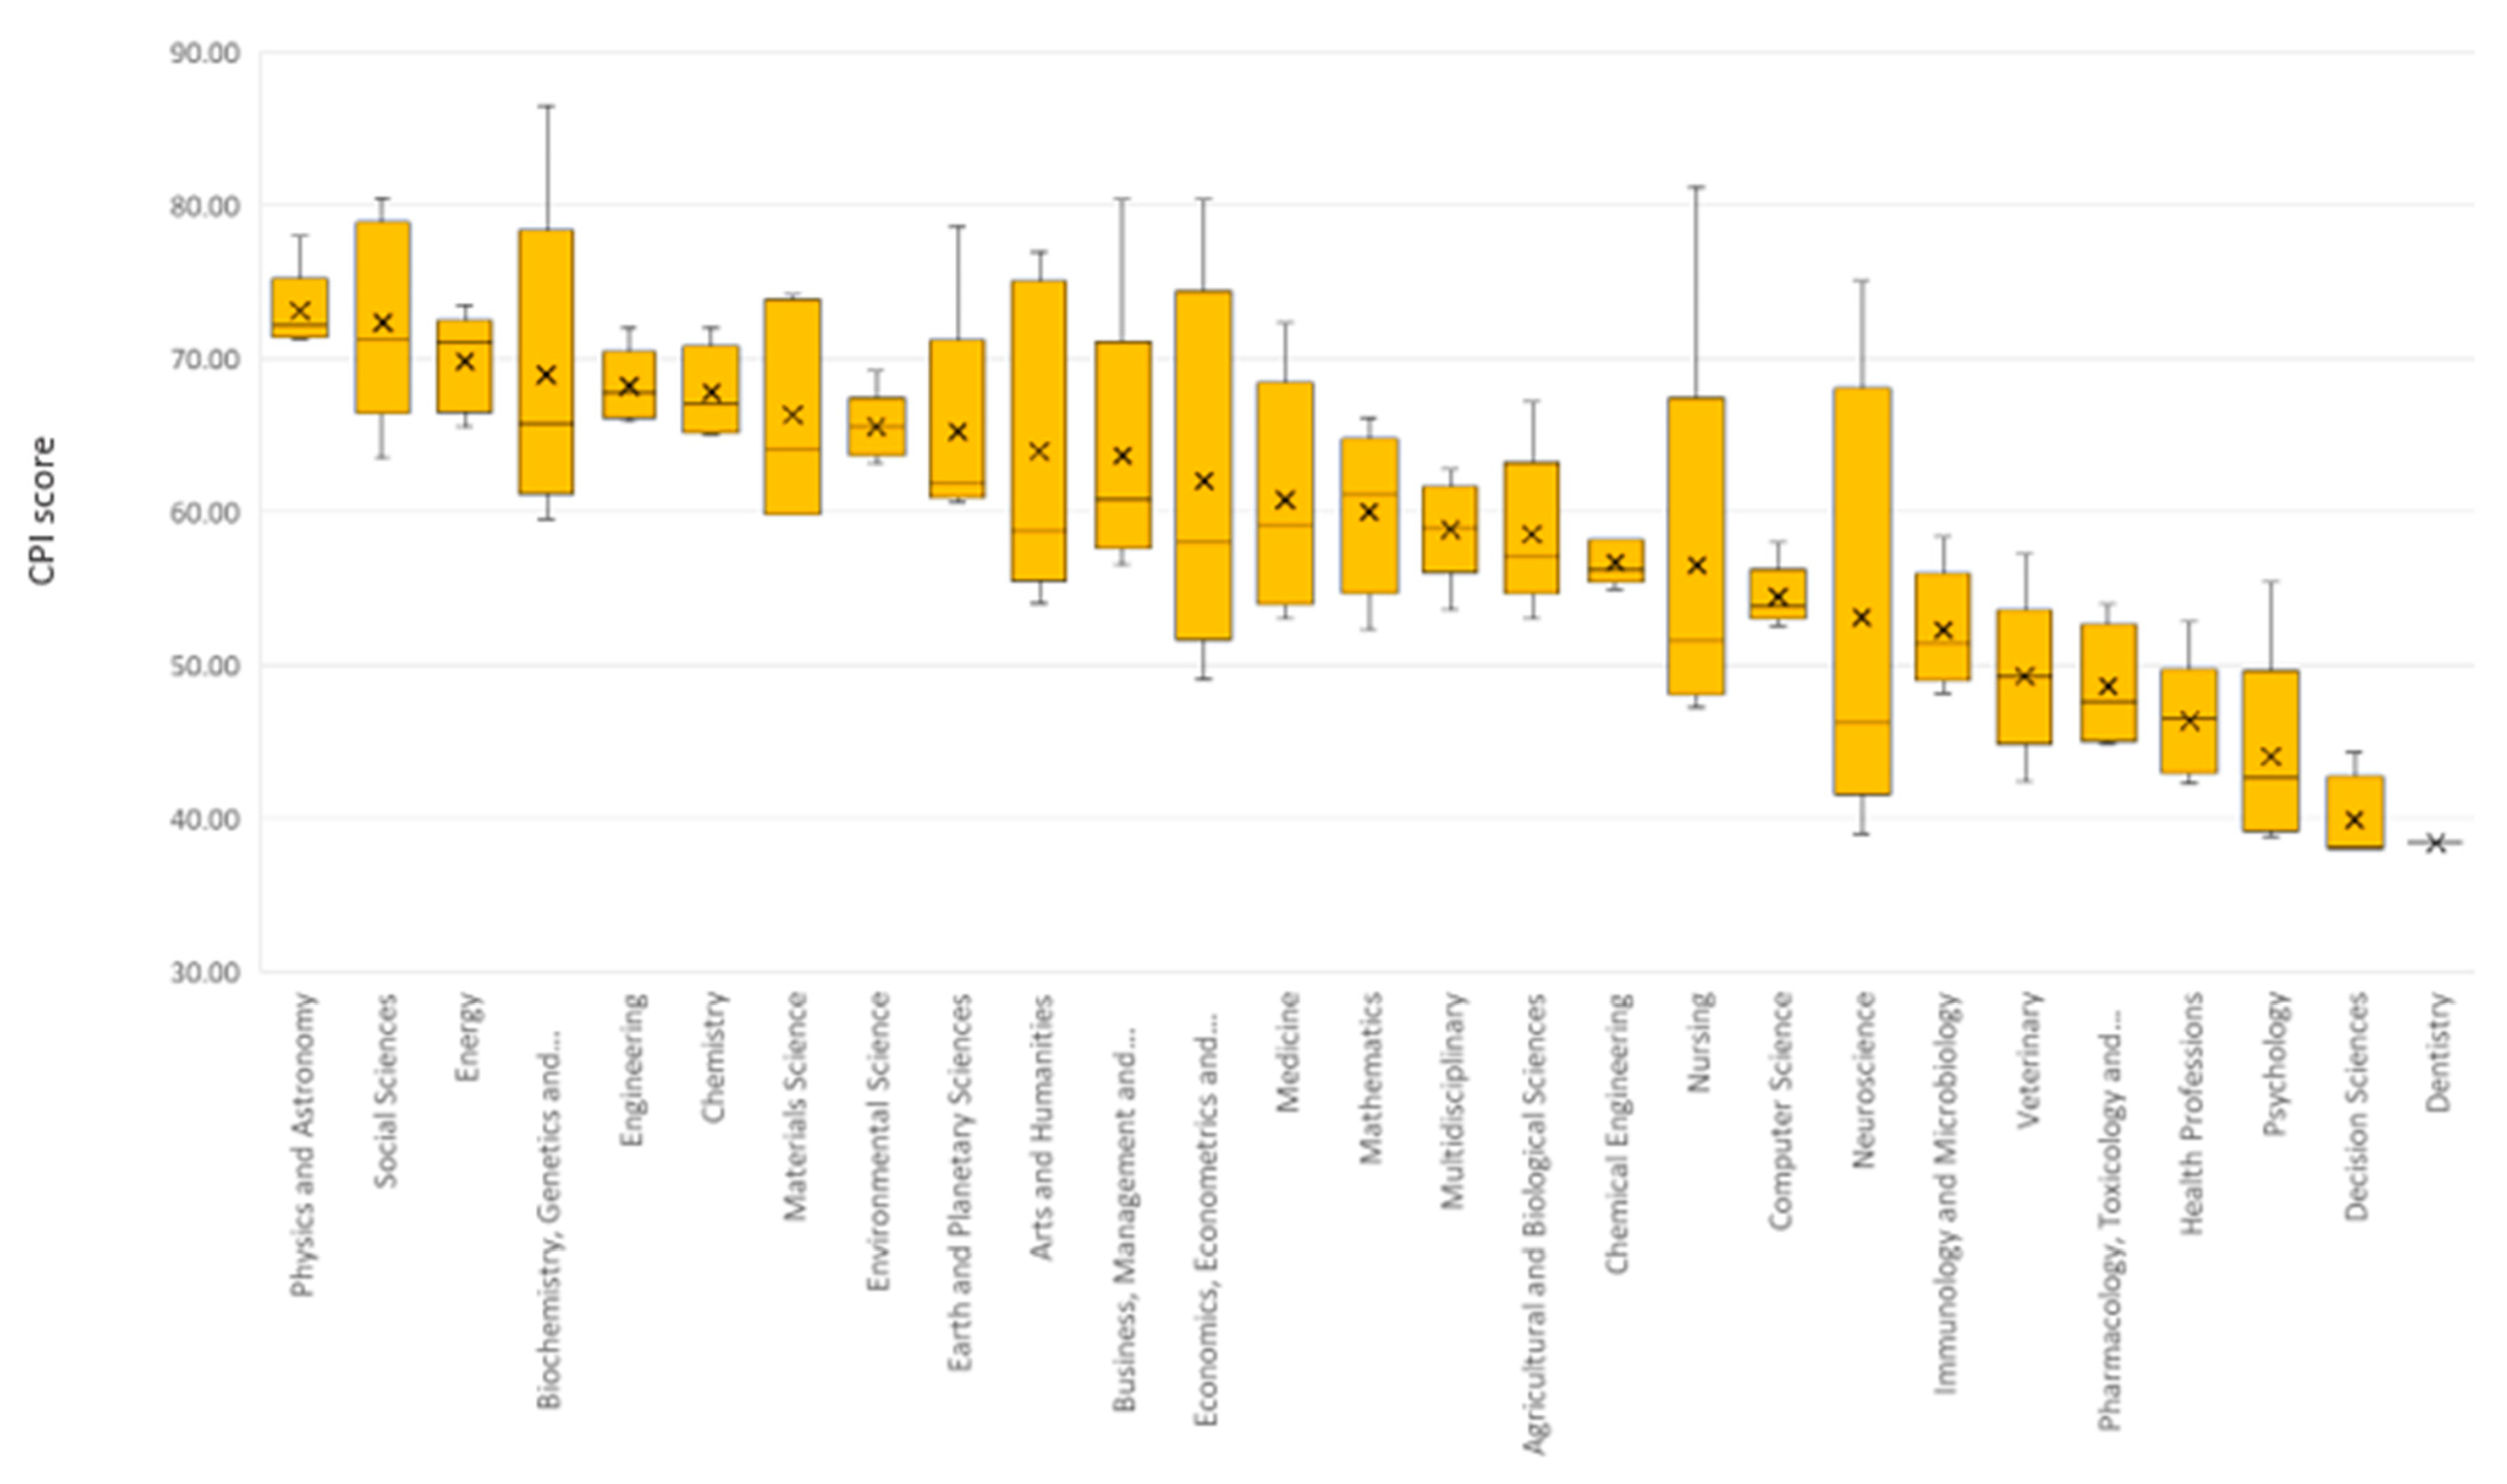
Substantial differences in mean CPI were identified across subject areas. Physics and astronomy (mean = 73.1), social sciences (72.3), and energy (69.8) emerged as the highest-scoring fields. Physics and astronomy benefit from high H, elevated FWCI
FLCS, O1%CP
FLCS, O10%CP
FLCS, and O25%CP
FLCS metrics. With a slightly lower H, the social sciences achieved a high average CPI due to the elevated CC, O1%CP
FLCS, O10%CP
FLCS, and O25%CP
FLCS. The high CPI in engineering was driven by the highest H and excellent results in O1%CP
FLCS, O10%CP
FLCS, and O25%CP
FLCS. In contrast, the lowest mean CPIs were recorded in dentistry (38.4), decision sciences (39.9), and psychology (44.1), reflecting both lower citation density and publication output. Since normalization and log transformation were applied within each ASJC category and per metric, CPI scores reflect relative performance within each field. Therefore, even in disciplines with lower absolute citation volumes, top researchers can achieve high CPI values if they significantly outperform their peers in the field.
Figure 13 shows the mean CPI among all ASJC areas.
The internal variability within subject areas also differed. As seen in
Figure 14, the chemical engineering, computer, and environmental science areas showed relatively narrow score ranges, implying consistently high CPI. Conversely, broader score dispersion was observed in neuroscience, economics, and nursing, indicating a more diverse range of researcher impact levels within these fields. The majority of fields exhibited positive skewness, indicating the presence of high-impact individuals who elevate the field’s average. A slight negative skew was detected in mathematics, where a concentration of strong scores and a few low performers was observed.
Analyzing the CPI composition, a general observation is that the CPI structure is well-balanced. Most researchers’ scores do not overly depend on a single metric, indicating that top performance tends to require excellence across multiple dimensions. The average portion values across CPI components show a moderate distribution. The foundational components (SO, H, and CC) form the performance baseline for most researchers. However, elevated CPI values are typically driven by research excellence metrics, represented by P1%JP or P10%JP, and citation impact metrics, such as O1%CP or O1%CPFLCS. These high-impact indicators introduce significant variation and serve as the main differentiators between average and top-tier performers. However, some researchers display explicit dependency on specific components that differ from the general pattern, highlighting the diversity of possible CPI compositions. For example, D. Sarbassov demonstrated extremely high scores (above 8.0) in authorship-sensitive citation metrics. Such concentrated excellence in key metrics allows for substantial CPI boosts, even when baseline metrics were moderate. In contrast, the most balanced profiles (with the lowest standard deviation of metric portions) were observed in authors such as Bridget Goodman, Suragan Durvudkhan, and Dimitrios Zorbas, suggesting broad and even achievements across all evaluated indicators. These researchers consistently demonstrate strong performance across all dimensions, including quantity, quality, and collaboration.
Figure 15 illustrates the compositions of CPI across various ASJC areas, where physics and astronomy (a) demonstrates the most competitive area, biochemistry, genetics and molecular biology (b) illustrates Sarbassov’s case of dependency on specific components, medicine (c) was included as one of the most diverse top author CPI compositions, and decision sciences (d) is shown to illustrate the composition of CPIs in the lowest scoring subject.
The affiliation distribution among researchers from the KZ-TOP-S reveals a clear concentration of academic excellence within a few leading institutions. As shown in
Figure 16, Nazarbayev University (NU) dominates the landscape, consistently appearing as the primary affiliation in nearly all disciplines, highlighting its central role in the national research ecosystem. In areas such as biochemistry, genetics, molecular biology, energy, and nursing, all the top 5 positions are held by researchers from NU. Al-Farabi Kazakh National University also maintains a visible presence, with notable representatives in veterinary science, decision sciences, economics, econometrics, and finance. Other institutions such as Kazakh-British Technical University, L.N. Gumilyov Eurasian National University, KIMEP University, and Satbayev University are represented across technical and social science domains, but to a lesser extent. Additionally, specialized research centers, such as the Kazakh Research Institute of Processing and Food Industry and the Kazakh National Agrarian Research University, are established in domain-specific fields, including Agriculture, Immunology, and Veterinary Sciences. Overall, while the dataset includes a range of universities and institutes, the data clearly demonstrate a high level of institutional concentration, with a small number of research-intensive universities producing the bulk of Kazakhstan’s highest-performing scholars.
3.5.2. Ranking by All Subject Areas (KZ-TOP)
A total of 6717 unique Kazakhstani researchers were aggregated across all ASJC fields to construct a subject-independent top 1% ranking (KZ-TOP), using the same CPI methodology as outlined earlier. This holistic approach yielded 67 top-performing researchers, representing the top 1% nationally when evaluated without disciplinary segmentation.
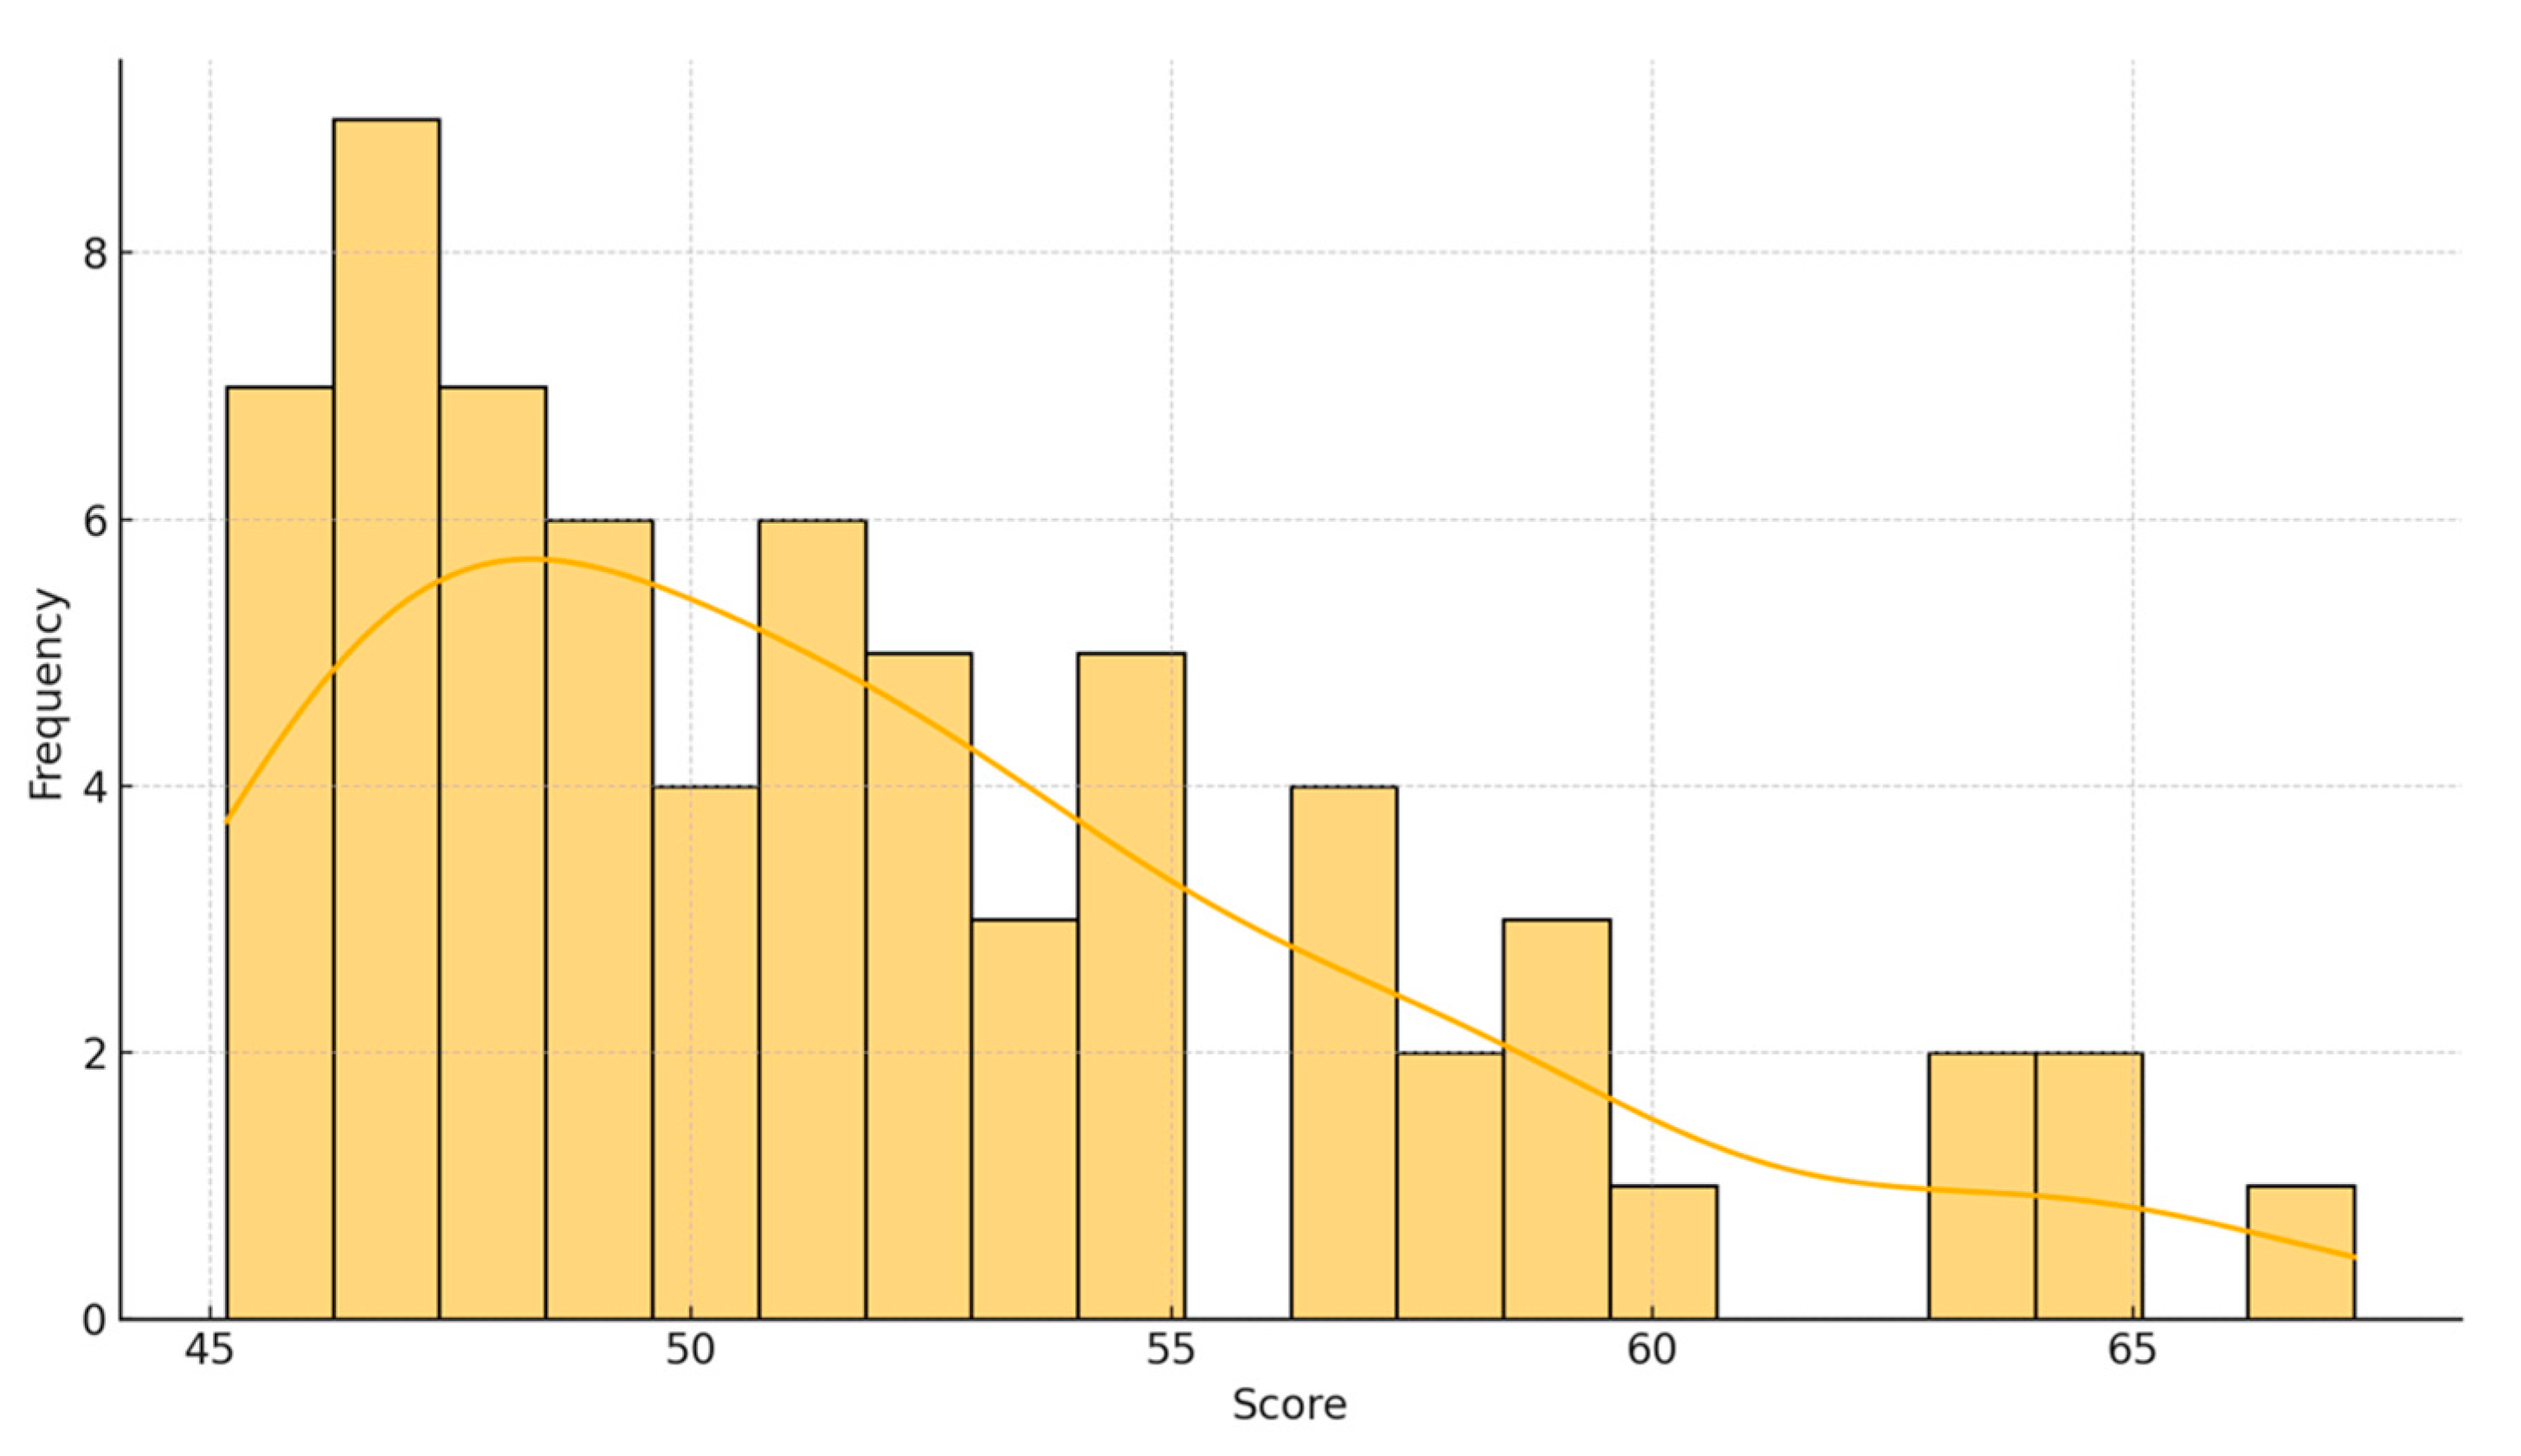
The distribution of CPI scores among the KZ-TOP researchers exhibits a moderately narrow spread, with most values concentrated around the median (
Figure 17). The CPI values range from 45.18 to 67.31, with a median score of 51.1 and a mean of 51.9. This indicates a right-skewed distribution where a few individuals attain markedly high scores, while the majority cluster around the mid-50s. The standard deviation of 5.4 further confirms a relatively tight spread, suggesting that achieving a top rank requires consistent, multidimensional performance rather than extreme outliers in isolated metrics.
A closer examination of the underlying metrics provides further insights into the structural requirements for achieving KZ-TOP. While most researchers exhibited strong baseline performance in SO, H, and CC, mere volume was not sufficient for top placement. In fact, several researchers with modest counts in these metrics still achieved high CPI scores due to exceptional values in research excellence and citation impact dimensions. Interestingly, the minimum values required for KZ-TOP inclusion show that some researchers ranked highly despite having as few as 11 h-index (Hajar Anas), fewer than 40 total publications (Seyit Ye Kerimkhulle and Tarman Bülent), or fewer than 500 citations (Zhanna Mazhitova, and Hajar Anas). But, such profiles were compensated by notably high figures in metrics like FWCI, O1%CP, and O10%CP (both general and FLCS-specific). This again demonstrates that a high CPI of KZ-TOP is not solely a function of productivity but rather reflects a balanced and strategic impact across multiple dimensions. Researchers with a focus on excellence in impactful publishing and highly cited authorship, especially in first, last, or corresponding positions, can thus outperform those with broader yet less impactful output profiles.
The distribution of institutional affiliations indicates a significant centralization of research capacity, with NU standing out as the undisputed leader, as 50 out of the 67 top-ranked researchers (approximately 75%, including the School of Medicine and the Graduate School of Education) are affiliated with NU (
Figure 18).
3.6. Accounting for Author Contribution: Addressing a Key Limitation
The main drawback of the proposed ranking method is its failure to adjust for co-authorship inflation. The current CPI structure does not correct for the number of co-authors, meaning researchers in large collaborative consortia may receive inflated CPI scores from cumulative citations. This limitation arises from the data source (SciVal), which lacks co-authorship-corrected metrics, such as the Hm-index. While fractionalized indicators could be computed, the scale of the dataset (over 6700 researchers) made manual correction impractical. SciVal’s restricted export capabilities further limited automated solutions. To illustrate a potential fix, an experimental adjustment was conducted for the top 1% of Kazakhstani researchers (KZ-TOP) with 67 authors.
For KZ-TOP authors, complete publication records were collected manually, including citation counts and the number of co-authors per paper. The Hm, a co-authorship-adjusted variation of the H, was then calculated as the largest number h such that the sum of the inverse number of authors across the top h papers is at least h (
Schreiber, 2008). Unlike the standard H, which gives full credit to each co-author regardless of team size, the Hm distributes credit fractionally, reducing the inflation caused by extensive collaborations. It was preferred over more complex alternatives due to its transparency and relatively simple calculation. Hm offers a simple and effective adjustment for co-authorship using only publication and author count data, without requiring subjective input or complex modeling.
Before applying Hm for ranking adjustment, a comparison was made between H and Hm values to identify cases of co-authorship inflation. For example, K. K. Davletov, having an H of 57, has only achieved an Hm of 1.94. Mukhtar Kulimbet experienced a significantly sharper difference between H and Hm (19 and 0.41, respectively), representing a relative reduction of nearly 98%. Similarly, Srinivasa Rao Bolla dropped from H of 22 to Hm of 2.91 (−87%). All three researchers are involved in large-scale, highly cited Global Burden of Disease (GBD) studies, many of which list over 1000 co-authors. Although these publications accumulate thousands of citations, the Hm dramatically reduces individual contributions in such collaborative contexts.
Finally, to evaluate the consequences of co-authorship inflation, the KZ-TOP was re-ranked using an adjusted CPI, termed KZ-TOP-F (Fractional). The ranking calculation remained as described in
Section 2.4, but the weighting of the metrics was recalibrated. The Hm was introduced into the CPI as an additional metric with a weight of 15. All other previously used metrics were preserved. The total weight budget was compressed, and most metrics lost around 15% of their value (which translates to a one- or two-point decrease). The traditional H was also retained with a reduced weight to minimize redundancy. All updated weights are presented in
Table 5.
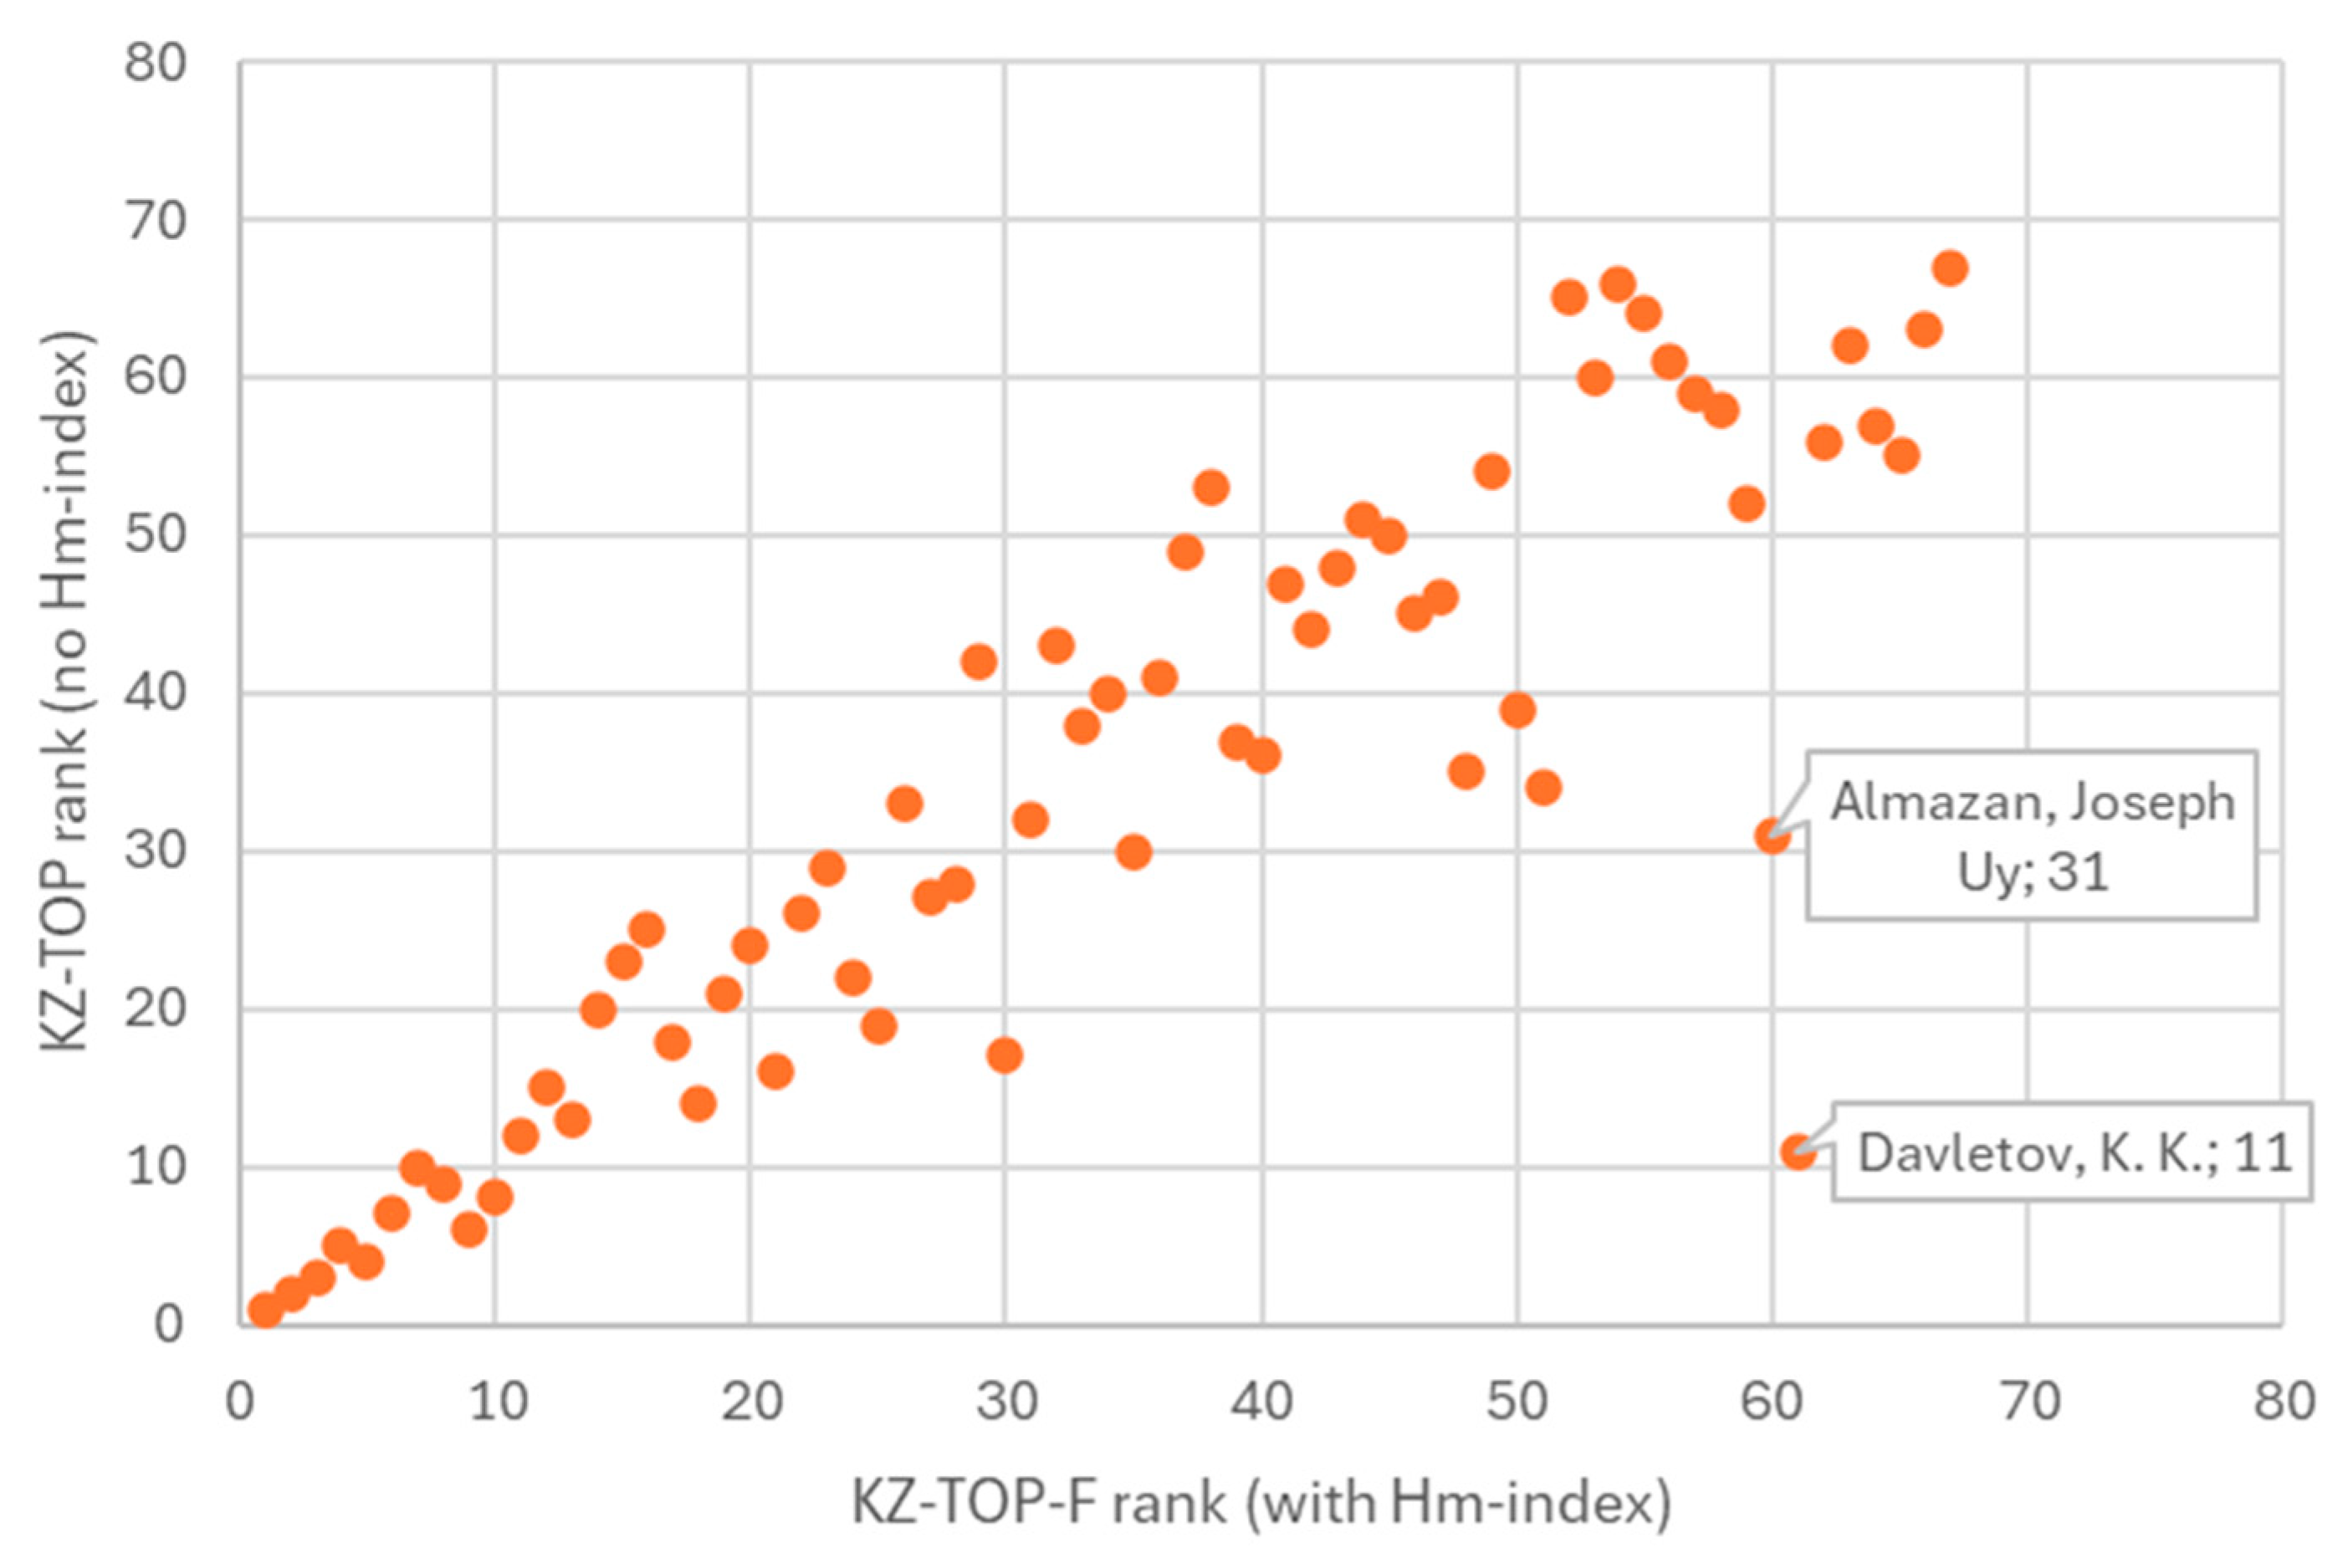
KZ-TOP-F resulted in the reordering of positions among the top 1% researchers.
Figure 19 visualizes the ranking positions of researchers, as determined by KZ-TOP, on the y-axis, and the co-authorship-adjusted KZ-TOP-F on the x-axis. Most points cluster along the diagonal, indicating that the overall structure of the ranking remained intact, but individual positions shifted noticeably. Out of the 67 researchers assessed, 35 individuals improved their positions after the inclusion of the Hm, 24 experienced a decline, and 8 maintained their original rank. The most significant upward shifts were observed for Hemando Quevedo (advanced 15 positions from rank 53 to 38), Peyman Pourafshary (+13 positions from rank 42 to 29), J. Zondy (improved from rank 65 to 52 (+13 positions)), M. S. Hashmi (moved from rank 49 to 37 (+12 positions)), and A. S. Kolesnikov (shifted from rank 66 to 54 (+12 positions)). Conversely, several researchers demonstrated significant downward movement following the adjustment. The most pronounced drops were recorded by K. K. Davletov, who fell from rank 11 to 61 (−50 positions); Joseph Uy Almazan, who went down 29 positions from 31 to 60; Abduzhappar Gaipov (from 34 to 51 (−17 positions)); Siamac Fazli (from 35 to 48 (−13 positions)); and Dos Sarbassov (from 17 to 30 (−13 positions)).
Taken together, these findings substantiate the methodological argument for incorporating co-authorship-adjusted indicators in composite rankings if possible. The experiment with KZ-TOP-F not only enhances fairness in author-level evaluation but also ensures that the ranking better reflects the nature of scholarly contribution.
3.7. Comparative Analysis with the World’s Top 2% Scientists (Stanford/Elsevier Top 2% List)
This section provides an additional benchmarking of the proposed CPI-based ranking by comparing it with the widely recognized Stanford/Elsevier list of the world’s top 2% scientists (SER) (version 7, August 2024 (
Ioannidis, 2024)). The aim is to assess the degree of alignment between national and global rankings, validate the credibility of the CPI methodology, and highlight cases of convergence or discrepancy.
The matching between KZ-TOP and SER lists was performed based on author names and institutional affiliations, as the SER dataset does not provide unique identifiers. While this approach may introduce minor uncertainty, each match was carefully validated to ensure accuracy. A comparative cross-reference between KZ-TOP and SER reveals notable convergence. Among the 29 highest-ranked Kazakhstani scholars in SER for career-long impact lists, 21 individuals also appear in the KZ-TOP list. In the single-year impact rankings, of the 42 top-ranked Kazakhstani academics in SER, 27 are also included in the KZ-TOP list. While this overlap demonstrates a strong alignment with the internationally recognized ranking, the proposed methodology offers additional value by providing a more flexible and context-sensitive framework. It incorporates complementary dimensions such as research productivity, publication quality, international collaboration, and co-authorship adjustment, elements that are either not emphasized or treated differently in existing composite indices like the SER.
However, rank positions vary. For instance, Ata Akcil holds the #1 career-long rank in SER list but appears only 10th in KZ-TOP, while Issakhov is ranked #1 in the KZ-TOP but only 16th (career) and 6th (single-year) globally (see
Table 6). Researchers such as Ata Akcil, Ratbay Myrzakulov, Shazim Ali Memon, Saffet Yagiz, and Alibek Issakhov consistently appear in both rankings, indicating that their academic impact is robust across various rankings.
On the other hand, several top-ranked researchers from SER, such as Singh Prim, Sarkyt Kudaibergenov, Timur Atabaev, and Akhtar Muhammad Tahir, are absent from the KZ-TOP, not due to a lack of Kazakhstani affiliation, but rather because of comparatively lower scores in key excellence and impact metrics. Specifically, their values in indicators such as P1%JPCiteScore, P10%JPCiteScore, FWCI, O1%CP, and O10%CP (both field-weighted and author-role weighted) tended to fall just below the threshold set by the top 67 researchers. While their academic influence remains significant, as reflected in their SER ranking, the proposed ranking places greater emphasis on the top percentile and author-role-sensitive performance, which slightly reduces their relative standing in the national context. Nonetheless, researchers like Shariati Mohammad Ali, Seyit Ye Kerimkhulle, and Sami Mohammad, who are not among the top in SER, receive elevated CPI scores due to exceptional values in normalized excellence metrics, such as FWCI or top-percentile publications.
Overall, the strong intersection between the two rankings supports the credibility of the KZ-TOP framework in identifying high-performing researchers. This alignment not only enhances confidence in the proposed ranking system but also highlights Kazakhstan’s emerging presence in the global research landscape. While the overlap is notable, differences in ranking positions across CPI and SER are to be expected, as the two systems rely on distinct methodologies, data coverage, and metric structures. These foundational differences underscore the complementary nature of the two approaches, each offering unique perspectives on research excellence and together providing a more comprehensive basis for national science strategies.
3.8. Retraction History of Top-Ranked Authors
In recent years, the role of retractions in bibliometric evaluation has gained increased attention (
Campos-Varela & Ruano-Raviña, 2019;
Koo & Lin, 2024). Retractions, the formal withdrawal of published scientific articles, serve as an essential mechanism for maintaining the integrity of the scholarly record. While they may result from unintentional errors or research misconduct, retractions are not punitive in nature; rather, they serve to ensure transparency and uphold scientific standards. Nonetheless, retraction cases can significantly affect a researcher’s reputation and career prospects, and thus merit consideration in any comprehensive performance assessment (
Azoulay et al., 2017).
To this end, the retraction records of authors included in the KZ-TOP, KZ-TOP-S, and KZ-TOP-F lists were examined. In general, less than 0.33% of publications were retracted. Eight authors were identified as having at least one retracted publication. In most cases, only a single article had been withdrawn. However, two individuals, A. Kozlovskiy and M. Zdorovets, had a disproportionately high number of retractions, with 15 retracted articles each (out of 435 and 469 total publications, respectively). Both scholars hold leading positions across several fields in our KZ-TOP-S ranking and have made the top 5 in the overall list (KZ-TOP and KZ-TOP-F), primarily due to strong productivity (SO), high H-index, citation impact (O25%CP), and international collaboration (IC). While these indicators contribute to their high composite scores, their retraction histories suggest that their positions should be interpreted with caution. Going forward, future refinements of the CPI could benefit from incorporating retraction-aware adjustments penalties or flags, helping to ensure a more nuanced and trustworthy evaluation of researcher performance.
4. Discussion
This study introduces and applies a CPI-based methodology for identifying top-performing researchers, using multidimensional data drawn from SciVal. By consolidating 16 distinct bibliometric metrics, this framework provides a more holistic evaluation of scholarly performance than traditional single-metric systems. Using the dataset of Kazakhstani researchers as a starting point, this work explores a performance ranking system that incorporates measures of productivity (SO), impact (CC and H), research excellence (publications in the top journals), citation impact (overall and author-position-specific output in top citation percentiles and FWCI), and the extent of international collaboration. The methodology involved normalizing and aggregating a composite score and producing two ranking outputs: a subject-specific top 1% performer list (KZ-TOP-S) and a subject-independent national top 1% list (KZ-TOP). To illustrate how co-authorship bias can be addressed, an additional experimental ranking was produced using the Hm-index for the KZ-TOP list, based on manually collected publication data for 67 top authors.
Importantly, the CPI was designed to address several limitations identified in prior composite indicators. While existing composite indicators laid the essential groundwork by incorporating role-sensitive citation metrics, their exclusion of key dimensions, such as scholarly output, journal excellence tiers, and the corresponding authorship role, limits their comprehensiveness. The proposed CPI reintroduces these critical variables while applying a custom weighting scheme, normalization procedures, and an optional co-authorship correction (Hm-index). This positions the CPI as a transparent, reproducible, and extensible framework for more equitable researcher assessment, especially in national contexts with heterogeneous research systems.
To assess convergence with established rankings, a comparative analysis with the Stanford/Elsevier Top 2% (SER) list was conducted. Overall, the strong intersection between the two rankings supports the credibility of the CPI methodology in identifying influential researchers. However, the differences in ranking positions across CPI and SER arise from fundamental differences in methodology, coverage, and metric design. The CPI integrates more granular productivity and authorship-role data, while SER emphasizes cumulative citation impact across longer periods.
The proposed approach not only aims to identify the top-ranked scientists at the national level but also enhances transparency and contextual relevance, potentially applying for a global research assessment. The results revealed that CPI provides a well-balanced representation of research performance. Scholars with high CPI scores demonstrated strength across multiple dimensions. Foundational metrics, such as SO, H, and CC, served as performance baselines. At the same time, research excellence (e.g., Publications in Top 1% Journal Percentiles) and citation impact (e.g., Output in Top 1% Citation Percentiles) were the differentiating factors that elevated some authors above others. The overlap observed between KZ-TOP and global SER underscores the potential robustness and utility of CPI in identifying the most influential researchers.
4.1. Limitations
The CPI, like all bibliometric-based frameworks, has inherent limitations. One fundamental concern lies in the impossibility of asserting that researchers ranked highest by CPI are unequivocally more influential than others who scored slightly lower. Influence in academia is multifaceted and context-dependent. There is no universally accepted standard for evaluating scientific value, particularly across disciplines, languages, and institutional settings. Citation-based systems (no matter how complex) only approximate influence and impact through proxies that are inevitably limited.
A key methodological limitation in our ranking is the lack of adjustment for co-authorship inflation. The CPI framework, as implemented, does not explicitly address the number of co-authors per publication. As a result, researchers who regularly collaborate in large consortia may receive disproportionately elevated scores. To address this issue, future versions of the CPI may incorporate fractionalized metrics or co-authorship-corrected indices such as the Hm-index, which assigns credit based on author contribution depth. Also, to partially address the challenge of credit allocation in multi-authored publications, the CPI includes targeted metrics that count only those publications where the researcher holds a lead (first), senior (last), corresponding, or sole authorship role. These positions are widely recognized as proxies for substantial intellectual contribution and research leadership. However, while this approach enhances attribution precision, it does not fully eliminate the risk of inflated credit.
Another constraint pertains to the dataset’s source—SciVal. Although it provides comprehensive and validated citation data, it only includes publications indexed in Scopus and applies activity thresholds based on time windows. As such, researchers with fewer recent publications or those active primarily before 1996 may be excluded or undervalued. Also, the initial sampling frame inherits inherent biases associated with output-based rankings, due to the platform’s export interface, which defaults to listing top authors based solely on SO. This mechanism favors prolific authors, potentially overlooking researchers with a modest number of publications but exceptionally high impact. In addition, since the number of researchers varies significantly across ASJC categories, applying a uniform sample size of 500 authors per field may lead to uneven representation, with larger fields potentially being underrepresented relative to their actual researcher base. Moreover, the technical limitations of SciVal impose practical constraints on data extraction. The system restricts the volume of information that can be retrieved in a single operation, making automated data acquisition unfeasible. As a result, large-scale analyses require substantial manual effort and computational resources. This constraint partially motivated the selection of Kazakhstan as a case study: the country’s research output is sufficiently extensive to support statistically meaningful comparisons, yet manageable within the data-handling capacity of both the SciVal interface and the research team. However, it is acknowledged that the relatively small national sample size may limit the generalizability of certain patterns and findings, particularly when extrapolated to larger or more diverse research systems. Finally, SciVal author profiles are built primarily on affiliation-based metadata and do not fully capture researcher mobility or expatriate status. As a result, the term “Kazakhstani researchers” in our manuscript refers to researchers affiliated with institutions in Kazakhstan at the time of data extraction.
Thirdly, age and career stage further complicate the interpretation of CPI. Due to the lack of reliable data on birth years or graduation date completion, the proposed ranking cannot account for career length. As a result, early-career researchers are inherently disadvantaged, as they have had fewer opportunities to accumulate output and citations. Conversely, long-established scholars may benefit from the cumulative effect of decades of publication history.
Additionally, the CPI metric’s composition and weighting, while grounded in the author’s expertise, remain open to discussion. The 16 metrics used in CPI were chosen to reflect distinct aspects of researcher performance; certain indicators, especially those based on similar citation percentile thresholds, may share underlying statistical relationships. Moreover, the index’s sensitivity to minor variations in metric composition suggests that alternative normalizations or weightings could slightly shift rankings.
4.2. Future Research Directions
Future research should aim to refine the CPI by applying more nuanced metric selection procedures, adjusting metric weighting, and exploring additional data sources beyond SciVal. For example, possible refinements of the CPI methodology should consider statistical techniques such as dimensionality reduction (e.g., PCA or machine learning feature selection) to identify and potentially consolidate overlapping metrics. Also, an expanded weighting model should be developed based on a survey involving a broader group of experts in bibliometrics, institutional research, and academic policy. This approach is expected to enable a more generalized and externally validated weighting scheme for future applications of the CPI.
As an additional option, future studies can also integrate emerging AI-based assistance into the research workflow. AI can be incorporated as supportive, real-time components at key stages, including metric selection and weighting. However, all AI-generated content must be critically reviewed and validated by domain experts to ensure reliability and contextual relevance. This co-creative approach might enable a more robust and accurate weighting scheme for the future CPI.
Furthermore, triangulation with expert peer assessments and societal impact indicators as a qualitative dimension would enhance CPI’s comprehensiveness. These may also encompass contributions such as datasets, software, policy citations, community engagement, and other forms of scholarly relevance that go beyond bibliometric performance. Integrating such elements would help advance the assessment of research excellence in alignment with emerging global best practices.
5. Conclusions
The proposed CPI framework is designed to identify top-performing researchers and holds potential value for both national and global research assessments. As a case study, a list of the top 1% Kazakhstani researchers was generated, providing subject-specific and subject-independent benchmarks tailored to the national research landscape. The CPI represents a meaningful step toward more sophisticated academic evaluation. The implemented co-authorship adjustment strategy (Hm incorporation) provides a fairer, multidimensional basis for identifying high-performing scholars while acknowledging the field-specific nuances of research production and influence.
However, the use of proposed CPI should be viewed not as a definitive judgment of scientific worth, but as a guiding tool for informed evaluation and resource allocation within different research ecosystems. In addition, limitations related to data source coverage, academic age normalization, and interpretability remain, as all bibliometric indicators, especially those applied to individual researchers, are known to carry a medium to high risk of misrepresentation due to data incompleteness, career interruptions, or field-specific publishing norms. For this reason, caution is advised when interpreting CPI scores in isolation. Future iterations of the CPI may benefit from incorporating qualitative assessments, triangulating bibliometric data with peer review and expert judgment to ensure a more balanced evaluation framework.
Ultimately, no ranking system can perfectly capture the complexity of academic contribution. Yet, by recognizing both the strengths and the limitations of composite metrics, institutions can move toward more balanced, equitable, and meaningful assessments of research excellence.

