Article

Evolution of Inter-University Research Collaboration in the Chengdu–Chongqing Economic Circle (2005–2024): A Biblio-Metric Perspective

Faculty of Education, Srinakharinwirot University, Bangkok 10110, Thailand
*
Authors to whom correspondence should be addressed.
Publications 2025, 13(4), 56; https://doi.org/10.3390/publications13040056
Submission received: 25 September 2025 / Revised: 23 October 2025 / Accepted: 27 October 2025 / Published: 3 November 2025

Abstract

The Chengdu–Chongqing Economic Circle (CCEC) represents a key regional development initiative in China. University research collaboration plays a vital role in advancing its innovation ecosystem and supporting sustainable growth. This study examines inter-university collaboration among 47 public universities in the CCEC based on 53,968 co-authored publications from 2005 to 2024. Using bibliometric and visualization techniques in CiteSpace 6.4.R2, it explores the structure and evolution of collaboration from institutional, thematic, and author perspectives. The results reveal a steady expansion of collaborative activities driven by national innovation strategies. Leading institutions such as Sichuan University, UESTC, and Chongqing University act as central hubs connecting diverse research communities. Collaboration has diversified from traditional fields toward interdisciplinary areas including materials, environmental science, and applied mathematics. Author networks are becoming more cohesive, reflecting stronger knowledge integration across universities. The study highlights how policy-driven collaboration fosters regional innovation capacity and provides evidence-based insights for strengthening university networks and advancing the CCEC’s role as a science and technology innovation hub in western China.

1. Introduction

The Chengdu–Chongqing Economic Circle (CCEC), one of China’s most significant national regional development initiatives, was established to promote integrated development, foster innovation, narrow regional disparities, and strengthen linkages with Eurasian markets. In the context of “big science”—characterized by large-scale, resource-intensive, and cross-institutional research projects (Galison & Hevly, 1993; Price, 1963)—universities serve as critical knowledge producers and innovation catalysts. Their collaborative scientific research not only advances frontier knowledge but also drives the formation of regional innovation centers and enhances economic competitiveness.
The CCEC has a solid innovation foundation, encompassing one-quarter of western China’s universities and one-fifth of its research institutes. Given that private universities often have limited research capacity, the region’s 47 public universities constitute the core of innovation and inter-institutional collaboration (Rui et al., 2023). Strengthening collaboration among these institutions could accelerate the integration and utilization of innovative resources, thereby advancing the CCEC urban agglomeration and promoting high-quality economic development in western China.
To better conceptualize this process, the analytical framework of this study is grounded in the theory of regional innovation systems (RISs), which views innovation as a territorially embedded process shaped by institutional, organizational, and spatial interactions (Asheim & Gertler, 2006; Fernandes et al., 2021). From this perspective, the CCEC represents an emerging innovation system in western China, where universities act as core knowledge producers and connectors within the regional innovation network. Linking bibliometric evidence with RIS theory enables a deeper understanding of how research collaboration structures reflect institutional configurations and policy dynamics within the CCEC.
Despite a growing body of literature on the regional development strategies of the CCEC, including studies that examine aspects of its collaborative networks, few have conducted a systematic and comprehensive analysis of the region’s inter-university collaboration landscape. Consequently, the current status and evolutionary trajectory of CCEC research collaboration remain insufficiently understood.
To address this gap, this study analyzes co-authored publications from 47 public universities within the CCEC between 2005 and 2024. It identifies core institutions, maps research themes, and visualizes collaboration networks to reveal their structural characteristics and evolutionary patterns. Distinct from earlier bibliometric studies, this research integrates institutional, thematic, and author-level perspectives within a regional innovation framework, providing a holistic understanding of how inter-university collaboration in the CCEC has evolved.
Research Questions
  • How has research collaboration among CCEC universities evolved, and which institutions occupy central positions within the collaboration network?
  • What are the major thematic areas of inter-university research collaboration, and how have these themes evolved over time?
  • What are the structural characteristics of author-level collaboration within the CCEC, and how have they changed over time?

2. Literature Review

Compared with individual-level partnerships, inter-university collaboration emphasizes the exchange and dissemination of research resources as well as the pursuit of advanced and complex research goals. With the advancement of contemporary scientific research, collaboration across universities has become essential for the transmission of information, the growth of the academic ecosystem, and significant scientific discoveries (Ducharme et al., 2024; Schwachula, 2021; Tetrevova & Vlckova, 2020).
Current research on inter-university collaboration in CCEC and other urban agglomerations can be categorized into three distinct groups according to the study’s scope:
The first category examines the primary factors influencing inter-university research collaboration, showing that both internal and external conditions play a role. External factors encompass the development of faculty-student relationships, government policy guidance, and advancements in information technology. Internal factors consist of shifts in knowledge production, unequal distribution of academic resources, and a more refined division of labor in scientific research (Mwantimwa & Kassim, 2023; Owusu-Nimo & Boshoff, 2017; Ravasi et al., 2024; Sonnenwald, 2007). While these studies provide valuable insights into the motivations for university research collaboration, they overlook the fact that some universities engage in inter-university research collaboration infrequently or rarely at all.
The second category focuses on the factors that affect the extent of collaboration between universities in scientific research. Research indicates that the extent of scientific research collaboration among universities is affected by several key factors, including institution type, research capacity (measured by publication output and citation impact), disciplinary composition, and resource status (Jithoo & Langa, 2025; Kyvik & Reymert, 2017; Lewis et al., 2012). However, this line of inquiry does not fully explain the underlying reasons for the observable selectivity in inter-university research collaboration.
The third group addresses the issue of selective collaboration. Studies employing proximity theory and social network analysis construct networks of inter-university research collaborations. These studies conclude that selective collaboration—the tendency of universities to partner preferentially with certain institutions according to institutional type, research specialization, or spatial proximity—is shaped by key contextual factors such as institutional, organizational, and geographic proximity (Roebken, 2008; Shen et al., 2025). This literature presents credible justifications for the selective collaboration of inter-university; however, it still contains several issues.
From a theoretical standpoint, existing research rarely links inter-university collaboration to the broader literature on regional innovation systems (RIS), which conceptualizes scientific collaboration as a territorially embedded process influenced by policy, institutional, and organizational configurations (Asheim & Gertler, 2006; Fernandes et al., 2021). This gap suggests the need to examine how inter-university research collaboration reflects—and contributes to—the structural evolution of emerging regional innovation systems such as the CCEC.
In summary, although prior studies have examined the drivers, patterns, and selectivity of inter-university collaboration, they have rarely considered how such collaboration evolves within a regional innovation system. This gap underscores the need for an integrated bibliometric approach capable of capturing both the structural dynamics and thematic evolution of inter-university networks. Building on this perspective, the present study explores the collaborative patterns among CCEC universities to reveal how institutional linkages and research themes co-evolve within an emerging regional innovation context.

3. Data and Methods

3.1. Research Methods

This study employs bibliometric analysis to examine the publication outputs of CCEC universities, thereby revealing the overall structure and evolutionary trends of research collaborations, as well as analyzing core institutions, research themes, and collaborative relationships (Olabiyi et al., 2025; Rapti et al., 2025; Yang et al., 2025). Bibliometrics (Pritchard, 1969) applies mathematical and statistical methods to quantitatively analyze publications, revealing patterns of knowledge production, dissemination, and utilization (Lawani, 1981; Salini, 2016). Recognized as a reliable method for uncovering research trends and collaboration patterns (Mohsen et al., 2025; L. Wang & Zhao, 2025), bibliometrics has been widely applied in business research (Donthu et al., 2021) and education studies (Kastrin & Hristovski, 2021; Rashid et al., 2021; Rojas-Sánchez et al., 2023).
This study employed CiteSpace 6.4.R2 (Advanced Edition) software, a widely utilized instrument for bibliometric analysis. This Java-based software, developed by Professor Chaomei Chen at Drexel University and the WISE Lab at Dalian University of Technology, is an efficient tool for analyzing and visualizing patterns and trends across multiple knowledge domains (Chen, 2004). Its capabilities include identifying research frontiers, tracking knowledge advancements, and revealing the expansion of collaboration and citation networks. The application facilitates the exploration of research frontiers, disciplinary trends, and potential research hotspots (Chu et al., 2023; Junjia et al., 2023; Mohsen et al., 2025).
This study employs several key bibliometric and network indicators to evaluate the structure and dynamics of inter-university collaboration within the CCEC.
(1)
Co-authored Publications. The network of collaboration was constructed based on co-authored publications, defined as papers jointly published by two or more universities. Co-authorship provides a direct and widely accepted proxy for measuring actual research collaboration between institutions (Glänzel & Schubert, 2005; Katz & Martin, 1997).
(2)
Betweenness Centrality. In social network analysis, betweenness centrality measures the extent to which a node lies on the shortest paths connecting other nodes (Freeman, 1977). It reflects a university’s bridging capability in facilitating information and knowledge flow within the collaboration network. A higher betweenness centrality value indicates that the institution is playing a crucial role in connecting otherwise isolated research clusters and facilitating cross-institutional collaboration (Chen, 2006; Newman, 2001). In this study, it was calculated using CiteSpace 6.4.R2.
(3)
Citation Bursts. The strongest citation bursts were detected using CiteSpace’s burst detection algorithm (Kleinberg, 2003). A citation burst indicates a rapid increase in the frequency with which a keyword or reference is cited during a given period, highlighting emerging research frontiers or shifts in thematic focus (Chen, 2012).

3.2. Research Data

Publication data were obtained from the Web of Science Core Collection, covering the Science Citation Index Expanded (SCIE) and the Social Sciences Citation Index (SSCI). Using advanced search functions, we extracted co-authored publications involving any pair of the 47 CCEC public universities between 2005 and 2024 (see Appendix A, Table A1 for the full list of universities). We restricted the dataset to peer-reviewed articles and reviews, excluding editorials, corrections, and other non-research materials. Following the established practice in similar studies (Katz, 1992), affiliated hospitals were excluded to prevent data contamination and ensure analytical consistency across higher education institutions.
To ensure data accuracy, we standardized university abbreviations in Web of Science, accounted for name variations (e.g., “Sichuan University” vs. “Sichuan University of Science & Engineering”). The following is the search formula, using Chengdu University of Technology and Chengdu University of Traditional Chinese Medicine as examples: AD = (Chengdu Univ Technol) and AD = (“Chengdu Univ Tradit Chinese Med” OR “Chengdu Univ TCM”) NOT AD = (“Hosp Chengdu Univ Tradit Chinese Med” OR “Hosp Chengdu Univ TCM”) NOT AD = (Chengdu Univ Technol, Engn & Tech Coll).
The data collection process for bibliometric analysis followed the PRISMA (Preferred Reporting Items for Systematic Reviews and Meta-Analyses) guidelines, using the flowchart developed by (Page et al., 2021), as shown in Figure 1. A total of 69,040 co-authored papers were identified following the search. After verifying the publication year and removing duplicates, 53,968 co-authored articles were available for study.

3.3. Data Analysis

A total of 53,968 co-authored publications from the Web of Science were imported into the CiteSpace system, with the temporal slicing parameter set from January 2005 to December 2024, utilizing 1 year per slice. The CiteSpace figures display the pertinent parameter settings in the top left corner, while the remaining parameters are set to their default values.
The visualizations generated by CiteSpace utilize nodes and edges, where N represents the total number of network nodes, and E indicates the number of connecting edges among these nodes (Chen, 2006). The dimensions of each node indicate the frequency of data references or occurrences, whilst the connecting edges illustrate relationships among nodes, with the thickness of these edges signifying the strength of these linkages (Liu et al., 2022). Based on these connections, CiteSpace applies a clustering algorithm to group nodes with closely related collaboration patterns into clusters. Each cluster represents a community of universities that share stronger internal than external ties, indicating cohesive subnetworks of research cooperation (Chen, 2013; Newman, 2006).
The quality and robustness of the cluster structure were assessed using two parameters: the modularity Q value and the mean silhouette S value. The Q value measures the extent to which the network can be divided into distinct clusters, where values above 0.3 indicate a significant modular structure (Newman, 2006). The S value evaluates the internal consistency and separation of the clusters; values above 0.5 indicate reasonable clustering, while values above 0.7 denote high reliability (Chen, 2016). Together, these indicators ensure that the identified collaboration clusters are both stable and interpretable.

4. Results and Discussion

4.1. Temporal Distribution of Publications

Figure 2 illustrates the quantity of co-authored publications produced by CCEC universities from 2005 to 2024. The authors divided the joint publications among CCEC universities over the past two decades into four phases based on the temporal inflection points in publication volume: the embryonic phase, the exploring phase, the deepening phase, and the accelerated phase. The embryonic stage (2005–2010) yielded 2478 co-authored papers, averaging 413 papers annually; the exploratory stage (2011–2015) yielded 6157 co-authored papers, averaging approximately 1231 papers annually; the deepening stage (2016–2020) yielded 16,135 co-authored papers, averaging 3227 papers annually; and the accelerated stage (2021 and beyond) yielded 29,198 co-authored papers, averaging approximately 7300 papers annually.
Based on the output of joint publications during the four phases outlined above, relevant national policies seem to have played a positive role in the region’s research collaboration output. In April 2016, China released the “Chengdu-Chongqing Urban Agglomeration Development Plan,” which specifically advocated for increased collaboration and improved innovation and entrepreneurial capabilities in the region. In this context, scientific research collaboration among CCEC universities has markedly intensified since 2016. Between 2016 and 2020, the mean yearly quantity of co-authored SCI and SSCI publications was 2.62 times greater than that of the period from 2011 to 2015. In October 2021, China released the “Outline of the Plan for the Construction of the Chengdu-Chongqing Economic Circle,” advocating for the establishment of a nationally significant center for scientific and technological innovation in the region. CCEC universities have proactively addressed national policies by prioritizing the enhancement of scientific and technological innovation skills and participating in collaborative scientific research, thereby markedly increasing their willingness to cooperate. Since 2021, the average annual quantity of co-authored SCI and SSCI publications has been 2.26 times greater than that of the period from 2016 to 2020. The increase in teamwork on scientific research among CCEC universities is expected to continue and grow stronger, driven by national strategies and regional cooperation.

4.2. Overall Collaboration Network Analysis

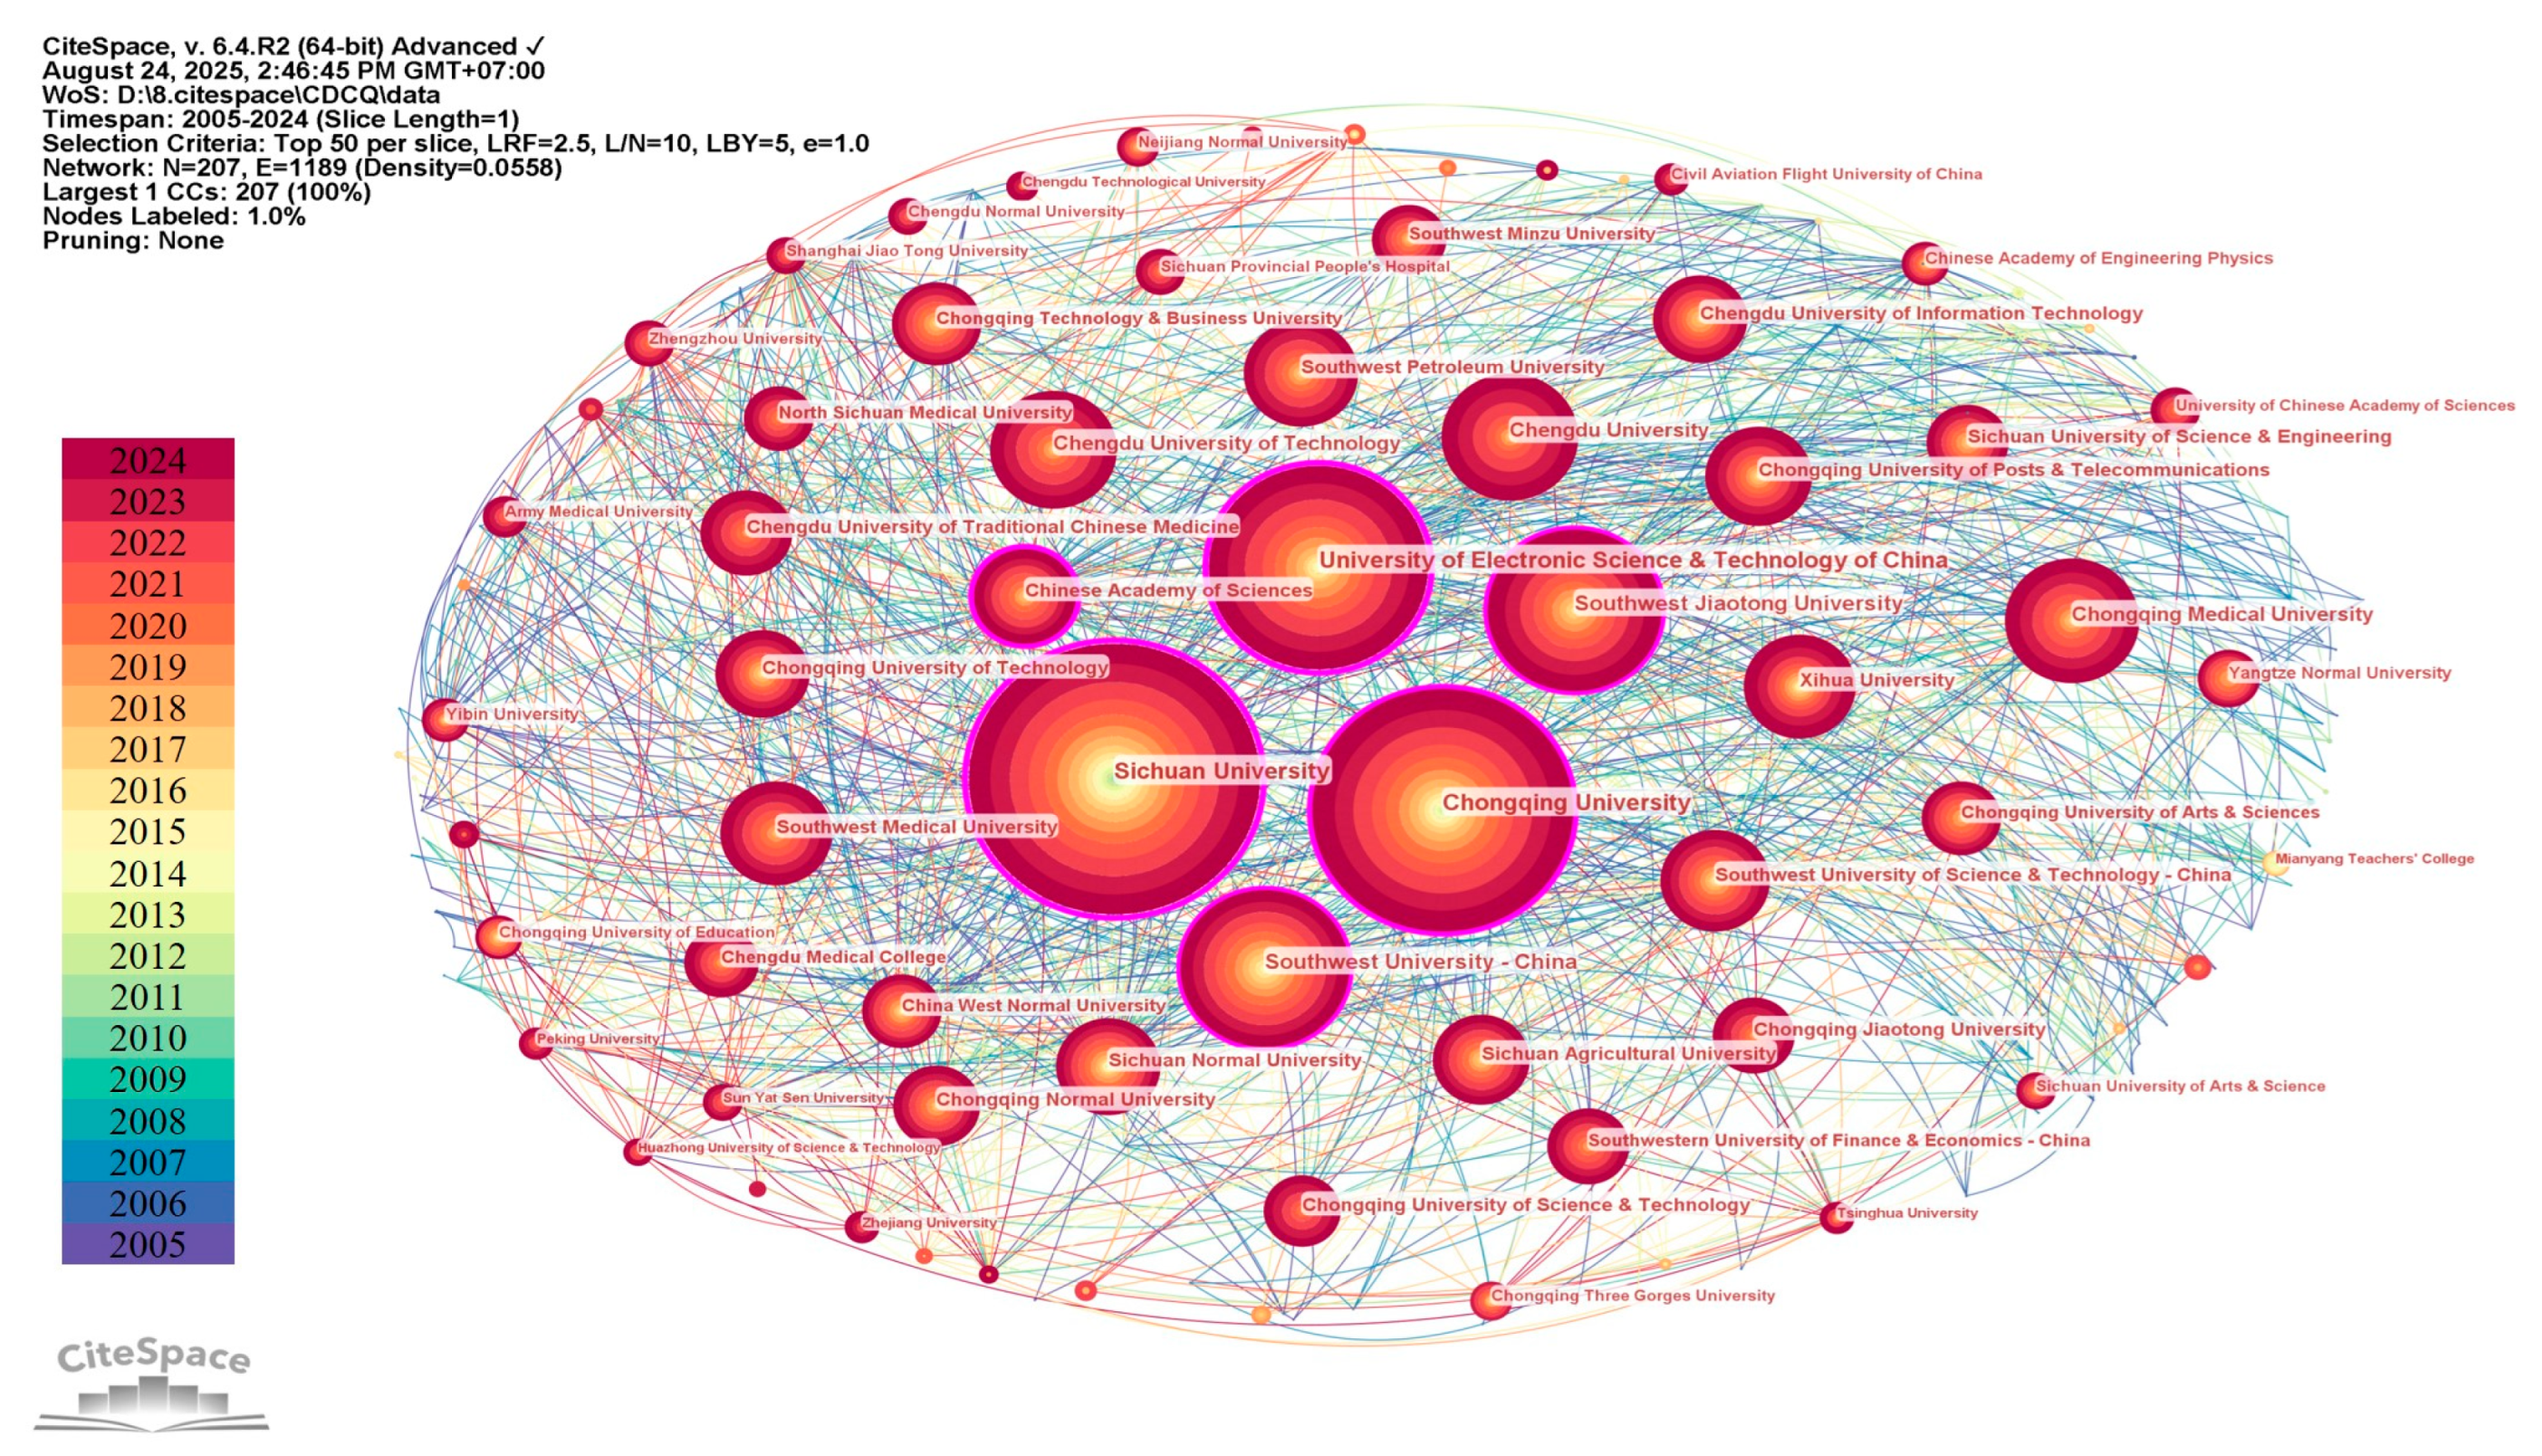
Figure 3 illustrates the overall collaboration network framework of CCEC universities. Sichuan University (SCU), University of Electronic Science and Technology of China (UESTC), Chongqing University (CQU), Chinese Academy of Sciences (CAS), Southwest Jiaotong University (SWJTU), and Southwest University (SWU) are pivotal entities within the collaborative network, significantly contributing to the CCEC universities’ research collaboration framework. The universities integral to these collaborative networks are situated in Chengdu and Chongqing. This finding aligns with Hou et al. (2023), who similarly identified Chongqing and Chengdu as central hubs within the CCEC network. The results show the close research collaboration between CAS and CCEC universities. Although CAS is not a university and its headquarters are located outside the CCEC. Nonetheless, its pivotal role in the CCEC universities’ research collaboration network illustrates its strong scientific partnership with CCEC universities.
Table 1 enumerates the ten foremost universities ranked by betweenness centrality. The universities exhibiting a betweenness centrality exceeding 0.1 are SCU (0.58), UESTC (0.41), CQU (0.3), CAS (0.21), SWJTU (0.13), and SWU (0.12), respectively. These universities act as key “bridges” or “hubs” connecting different clusters within the network (Freeman, 1977). For instance, although UESTC has produced 24.6% fewer papers than CQU, its higher betweenness centrality (0.41 vs. 0.30) suggests a more strategic position in facilitating knowledge flow and interdisciplinary collaboration (Wasserman & Faust, 1994). Similarly, China West Normal University (CWNU) and Chongqing Medical University (CQMU), ranking ninth and tenth with a centrality of 0.05, also play bridging roles, linking disciplinary fields such as chemistry, materials science, and clinical medicine that have achieved global recognition in ESI rankings.
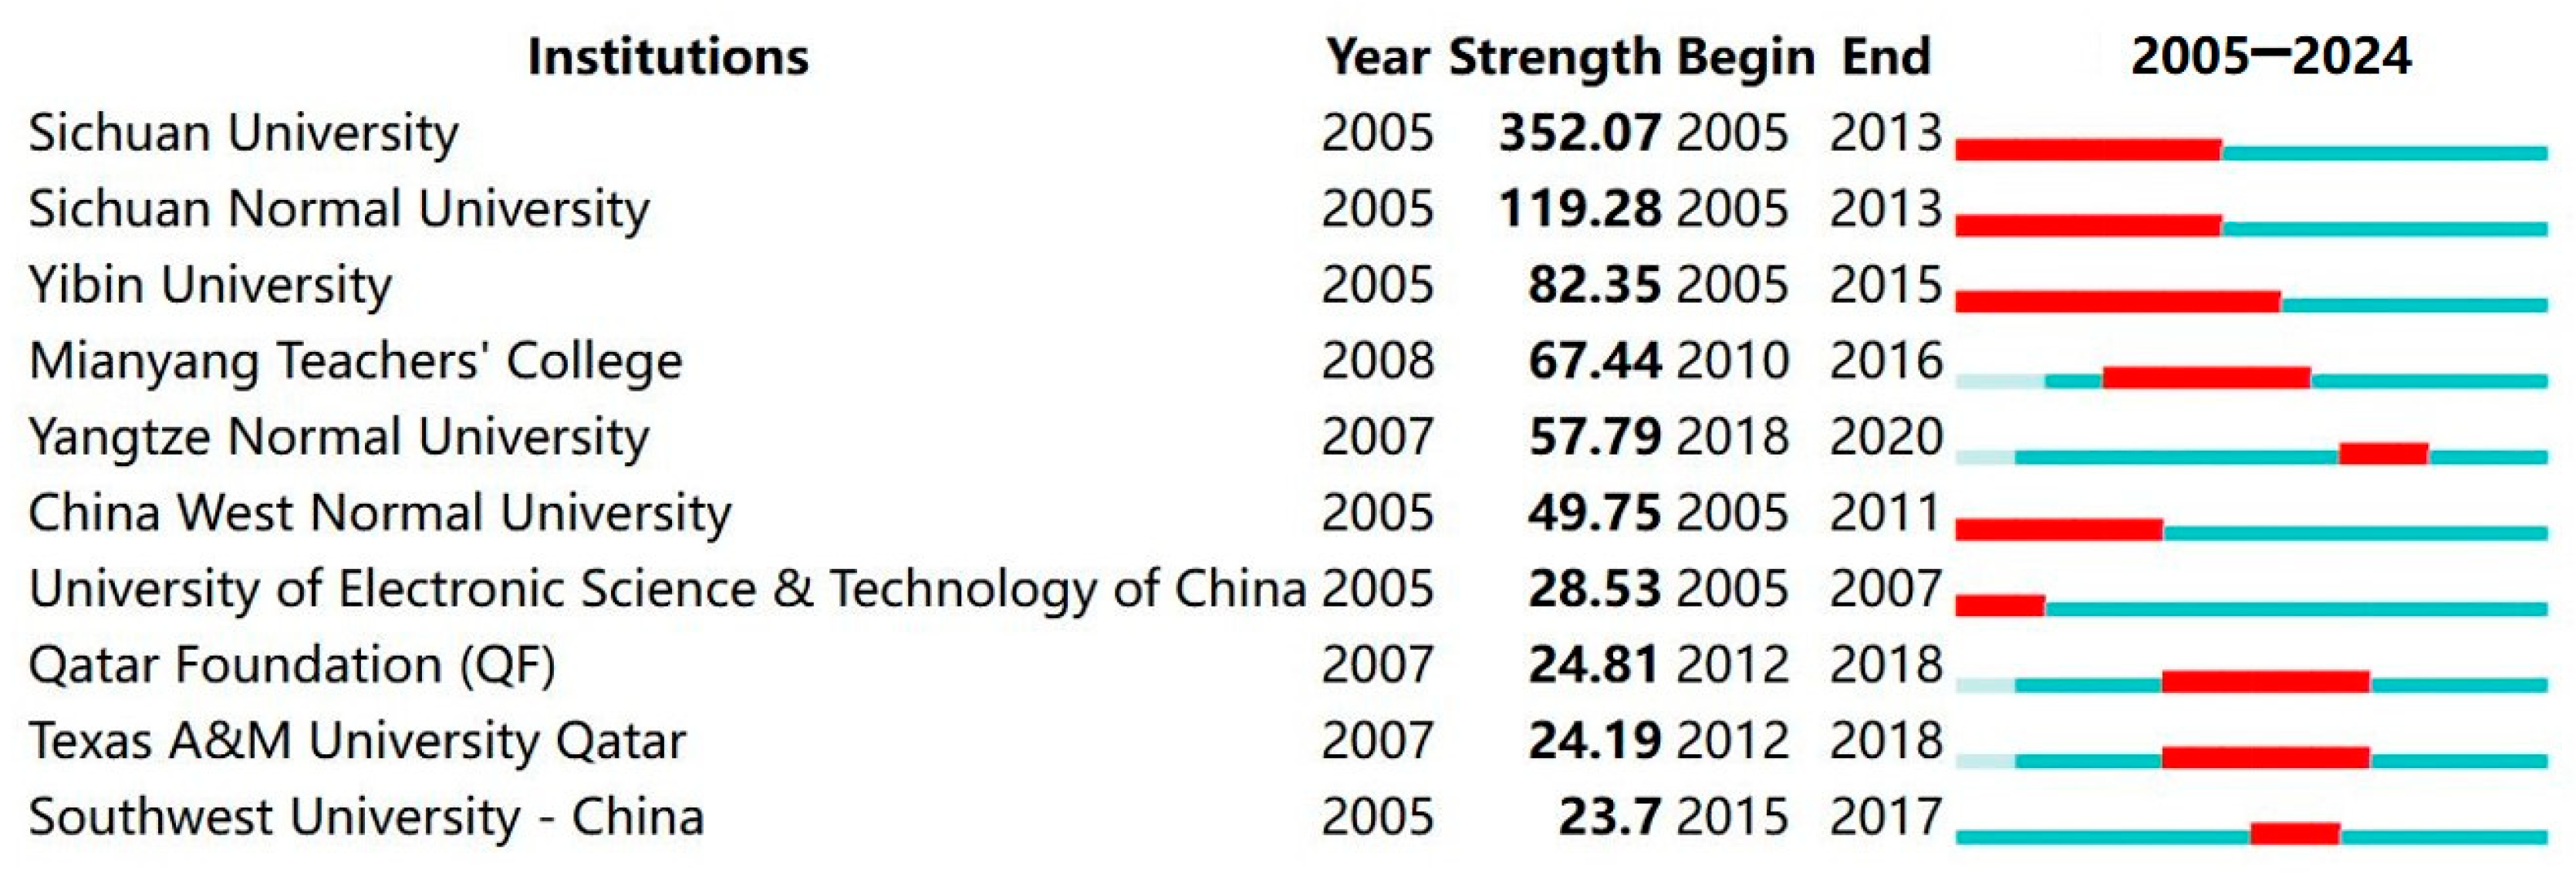
As shown in Figure 4, SCU exhibits the strongest citation burst (352.07) during 2005–2013, confirming its central influence in regional collaboration. In contrast, UESTC, though ranking second in centrality, shows a lower citation burst, emphasizing its role as a structural connector rather than a citation hotspot. Meanwhile, institutions such as Mianyang Teachers’ College (MYTC) and SWU display bursts mainly after 2010, suggesting that several regional universities have gradually integrated into the core network over the past decade. Additionally, Sichuan Normal University (SCNU) demonstrates temporal peaks of collaboration despite relatively low overall centrality, reflecting episodic engagement driven by specific research projects.
Notably, the presence of Qatar Foundation (QF) and Texas A&M University at Qatar (TAMUQ) in the 2012–2018 burst period illustrates the increasing internationalization of the CCEC network, indicating expanding cross-border partnerships beyond the regional scope. However, the overall network remains relatively sparse, with limited inter-university linkages in the CCEC. This structure reflects both institutional and administrative barriers as well as unequal resource distribution in the CCEC. Compared with the Yangtze River Delta and the Guangdong–Hong Kong–Macao Greater Bay Area—regions that have been shown in prior studies to sustain relatively dense and multi-centered collaboration networks (Li & Phelps, 2018; J. Ma et al., 2020)—the CCEC still exhibits an early-stage integration pattern that depends heavily on top-down policy stimuli rather than on mature institutionalized partnerships.
Overall, the findings reveal a multi-layered and evolving collaboration network among CCEC universities. Core institutions such as SCU, UESTC, and CQU consistently anchor the network, serving as knowledge brokers that bridge disciplinary and institutional boundaries. In contrast, peripheral universities like MYTC are gradually gaining access to the regional collaboration system. The contrast between centrality and citation burst patterns underscores differentiated institutional functions—some universities sustain long-term knowledge connectivity, while others contribute to short-term research surges. The results suggest that enhancing cross-city partnerships and supporting collaborative platforms could help transform the CCEC’s fragmented network into a more cohesive and innovation-driven regional system.

4.3. Thematic Co-Occurrence Cluster Network Analysis

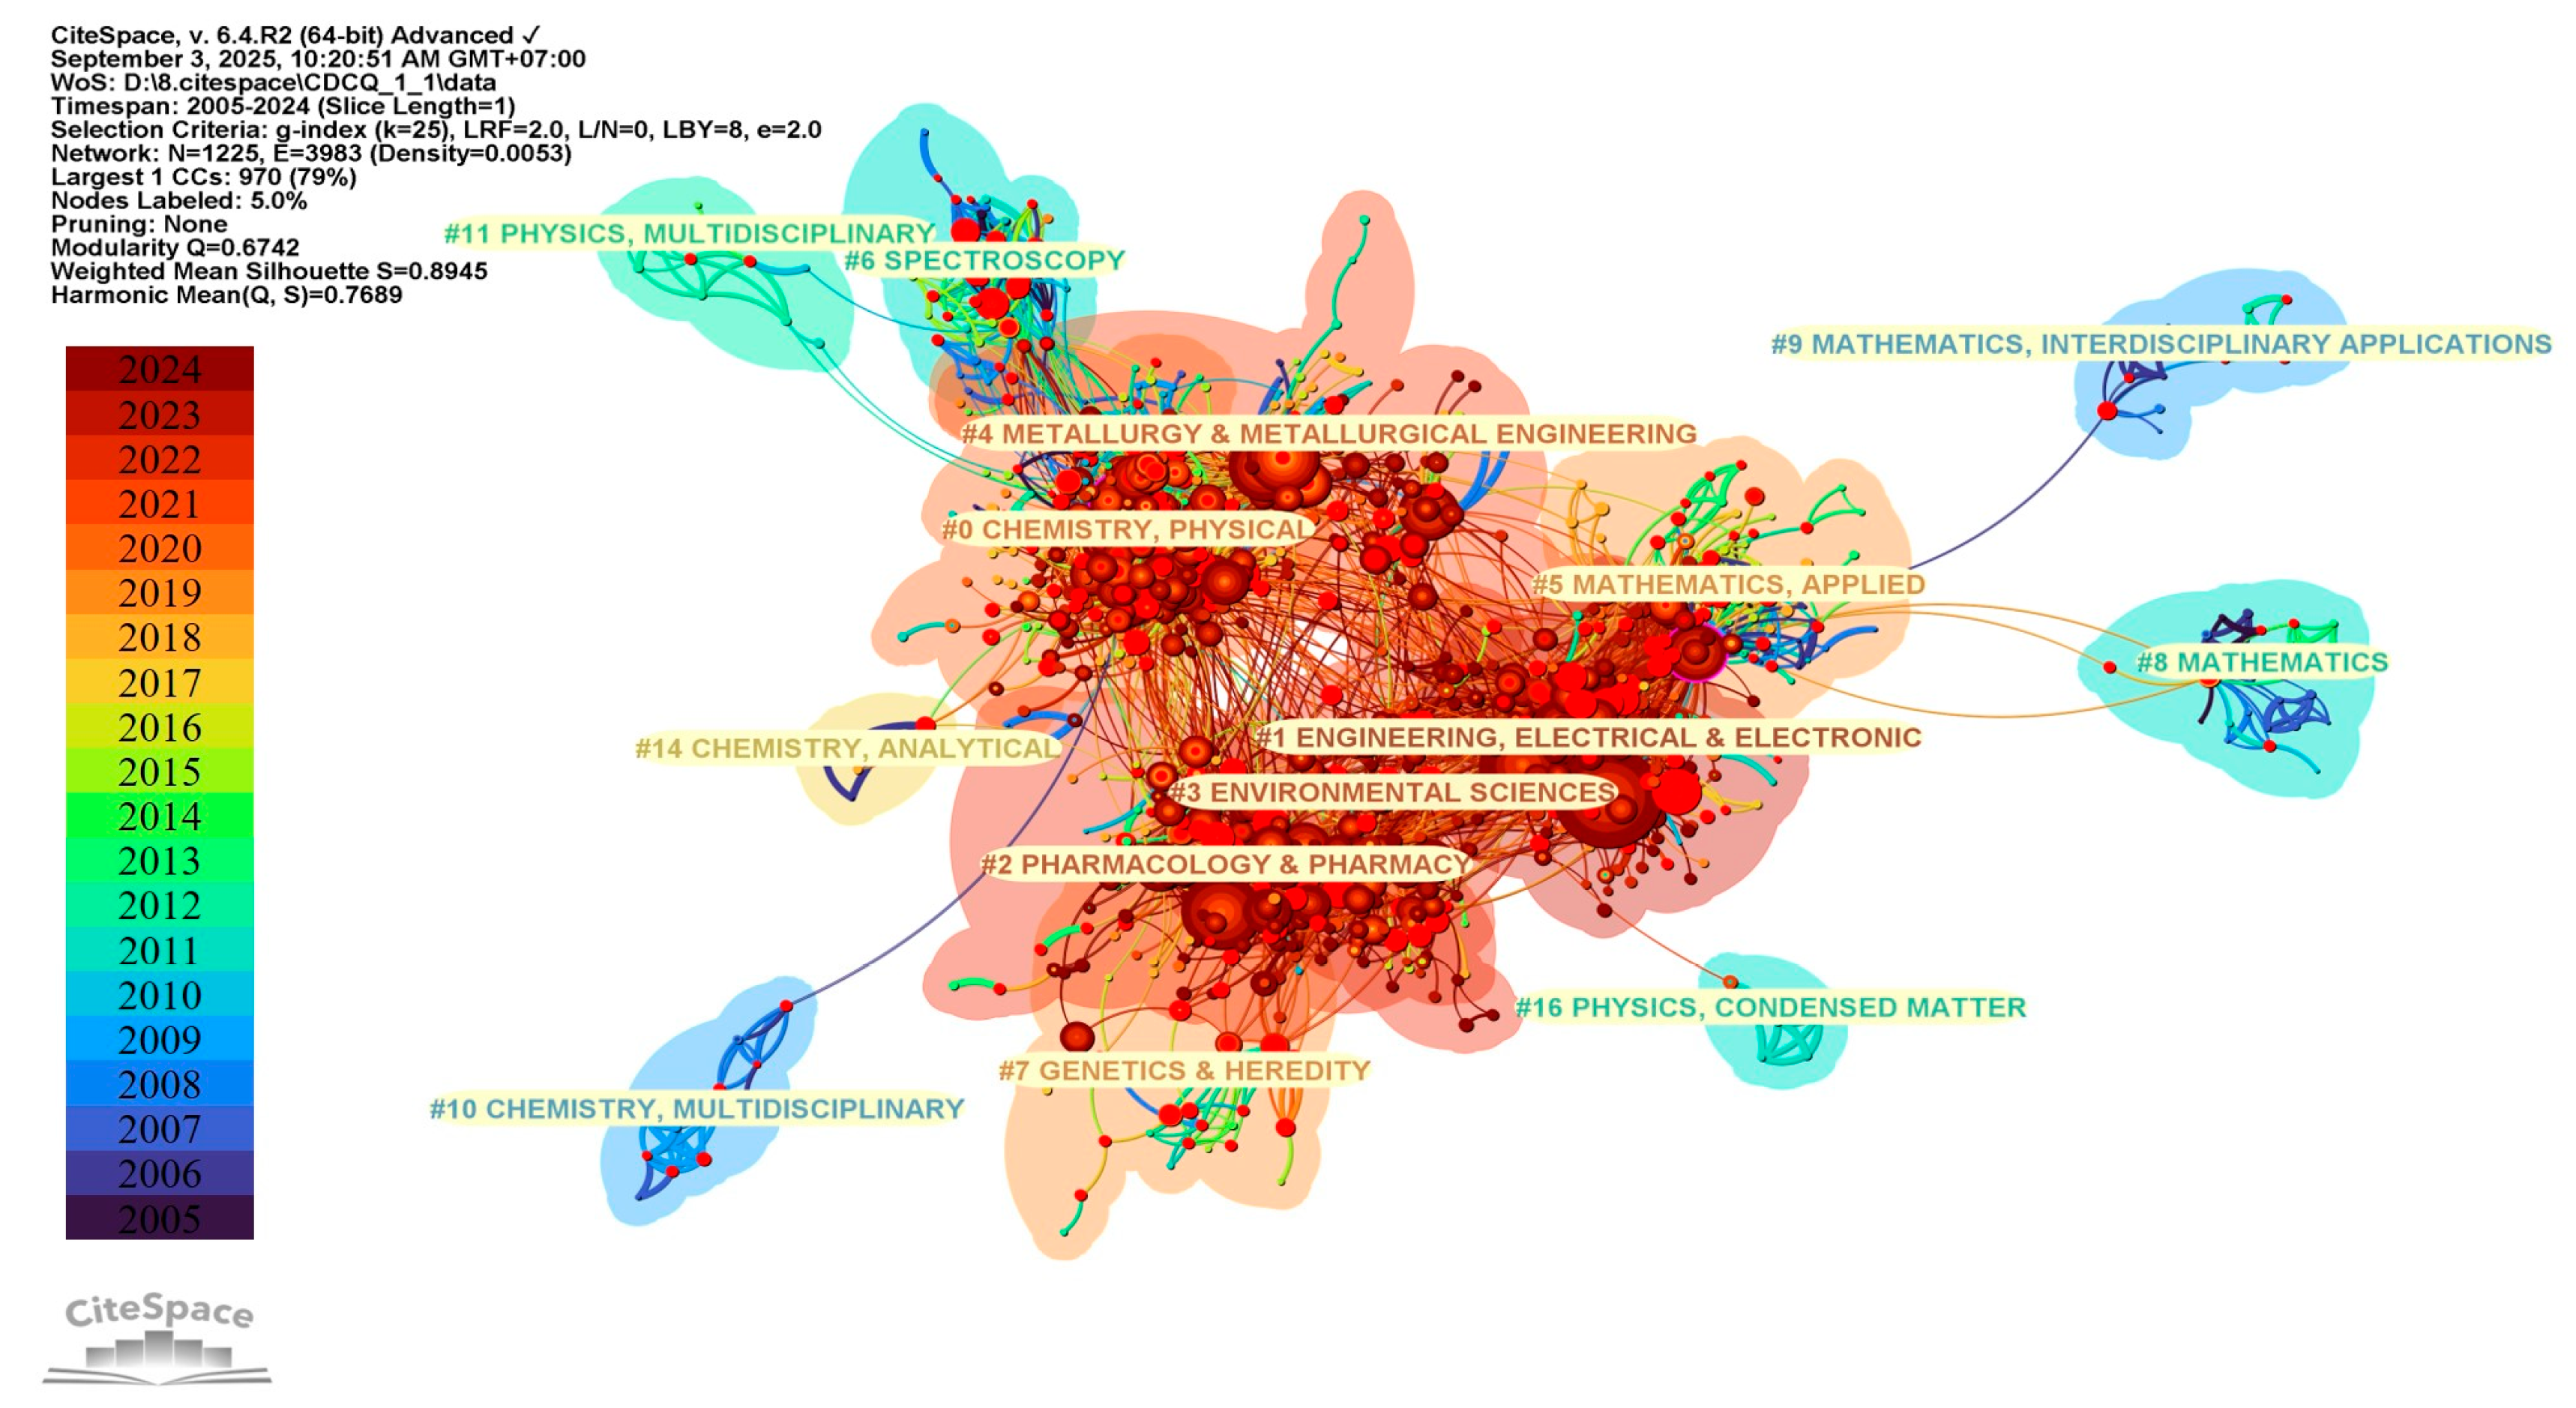
To analyze the CCEC universities’ research collaboration network at the meso-level, a co-occurrence clustering analysis was performed to identify the main thematic domains, as illustrated in Figure 5. Fourteen primary clusters were identified, forming a well-defined structure dominated by six key domains: “Chemistry, Physical,” “Engineering, Electrical & Electronic,” “Pharmacology & Pharmacy,” “Environmental Sciences,” “Metallurgy & Metallurgical Engineering” and “Mathematics, Applied.” These clusters correspond closely to CCEC’s three major industrial sectors—electronic information, automotive manufacturing, and high-end equipment—which each generate an output value exceeding one trillion RMB. This alignment underscores the strong linkage between academic collaboration and the region’s industrial development trajectory. Recent studies (Yuan et al., 2023; Yuman & Yutian, 2022) demonstrate that CCEC’s new energy vehicle and electronic information sectors are advancing rapidly, illustrating that research collaboration among CCEC universities can effectively enhance regional technological innovation and economic development.
Modules #0 “Chemistry, Physical” and #1 “Engineering, Electrical & Electronic” show the largest node sizes and strongest internal linkages, reflecting their central roles in shaping the research structure of the CCEC network. Cross-disciplinary linkages among modules—particularly between Mathematics, Chemistry, Materials Science, and Engineering—demonstrate the growing trend toward interdisciplinary collaboration. Such connections reveal an increasingly integrated research ecosystem where applied mathematics and physical sciences intersect with engineering and technology innovation. This interdisciplinary collaboration has supported the CCEC’s transition toward sustainable, innovation-driven development (Specht & Crowston, 2022; Vaverková et al., 2025). In contrast, peripheral clusters such as clusters #6 “Spectroscopy,” #8 “Mathematics,” and #14 “Chemistry, Analytical,” primarily serve as methodological foundations that support research within central domains, rather than as standalone thematic frontiers.
The Modularity Q value is 0.742, exceeding the 0.3 threshold, indicating a strong modular structure, while the silhouette S value (0.892) is above 0.7, confirming high internal consistency and explanatory robustness. Together, these metrics suggest that the cluster division is both statistically valid and conceptually meaningful, accurately distinguishing coherent topic areas within the CCEC network.
Analysis of the “Top 10 Terms with the Strongest Citation Bursts” (Figure 6) reveals clear temporal shifts in CCEC research priorities. Early-stage bursts (2005–2013), such as electron paramagnetic resonance, spin-Hamiltonian parameter, and crystal- and ligand-field theory, point to an initial emphasis on physical chemistry and materials science—fields dominated by fundamental theoretical and experimental research. After 2014, emerging terms such as complex network and time-varying delays gained prominence, indicating a transition toward multidisciplinary domains like systems science, control theory, and computational modeling. This shift corresponds with the global rise of artificial intelligence and deep learning technologies after 2011 (Qin et al., 2024), which spurred methodological convergence across engineering, mathematics, and computer science.
These thematic shifts are also aligned with national and regional policy guidance. The Chengdu–Chongqing Urban Agglomeration Development Plan and related innovation policies have encouraged collaborative research in emerging industries, including the Internet of Things, intelligent manufacturing, and smart vehicles (K. Wang et al., 2023). The co-evolution of research themes and policy priorities demonstrates the responsiveness of CCEC universities to broader innovation agendas.
Overall, the temporal evolution of bursty terms mirrors the spatial configuration of the thematic clusters: early dominance of physical and chemical sciences has gradually given way to more complex, interdisciplinary, and application-oriented fields. This pattern reflects a deepening of the CCEC’s regional innovation capacity and the growing maturity of its academic ecosystem. Compared with the Yangtze River Delta and the Greater Bay Area—where thematic networks are denser and more diversified (Li & Phelps, 2018; H. Ma et al., 2020)—the CCEC network still exhibits a more concentrated thematic structure centered on engineering and applied science. This indicates that while the region has developed a coherent research base, it remains in a formative stage of thematic diversification within its regional innovation system.

4.4. Analysis of the Author Collaboration Network

To gain deeper insights into the structure and evolution of CCEC’s research collaboration network at the micro level, this study analyzed the two largest thematic clusters identified earlier: cluster #0 “Chemistry, Physical” and cluster #1 “Engineering, Electrical & Electronics”.
As shown in Figure 7, the author collaboration network of Cluster #0 displays a relatively sparse structure, with a density of 0.0066 and the largest connected component comprising 36% of all nodes. The low density suggests fragmented collaboration patterns and limited integration among research teams. However, the gradual increase in connectedness after 2012 indicates a transition from isolated research groups toward more cohesive scientific communities. A few authors, such as those in the subfields of materials chemistry and applied physics, exhibit high betweenness centrality values, functioning as intermediaries who bridge separate research teams and facilitate the circulation of knowledge across institutional boundaries (Wasserman & Faust, 1994).
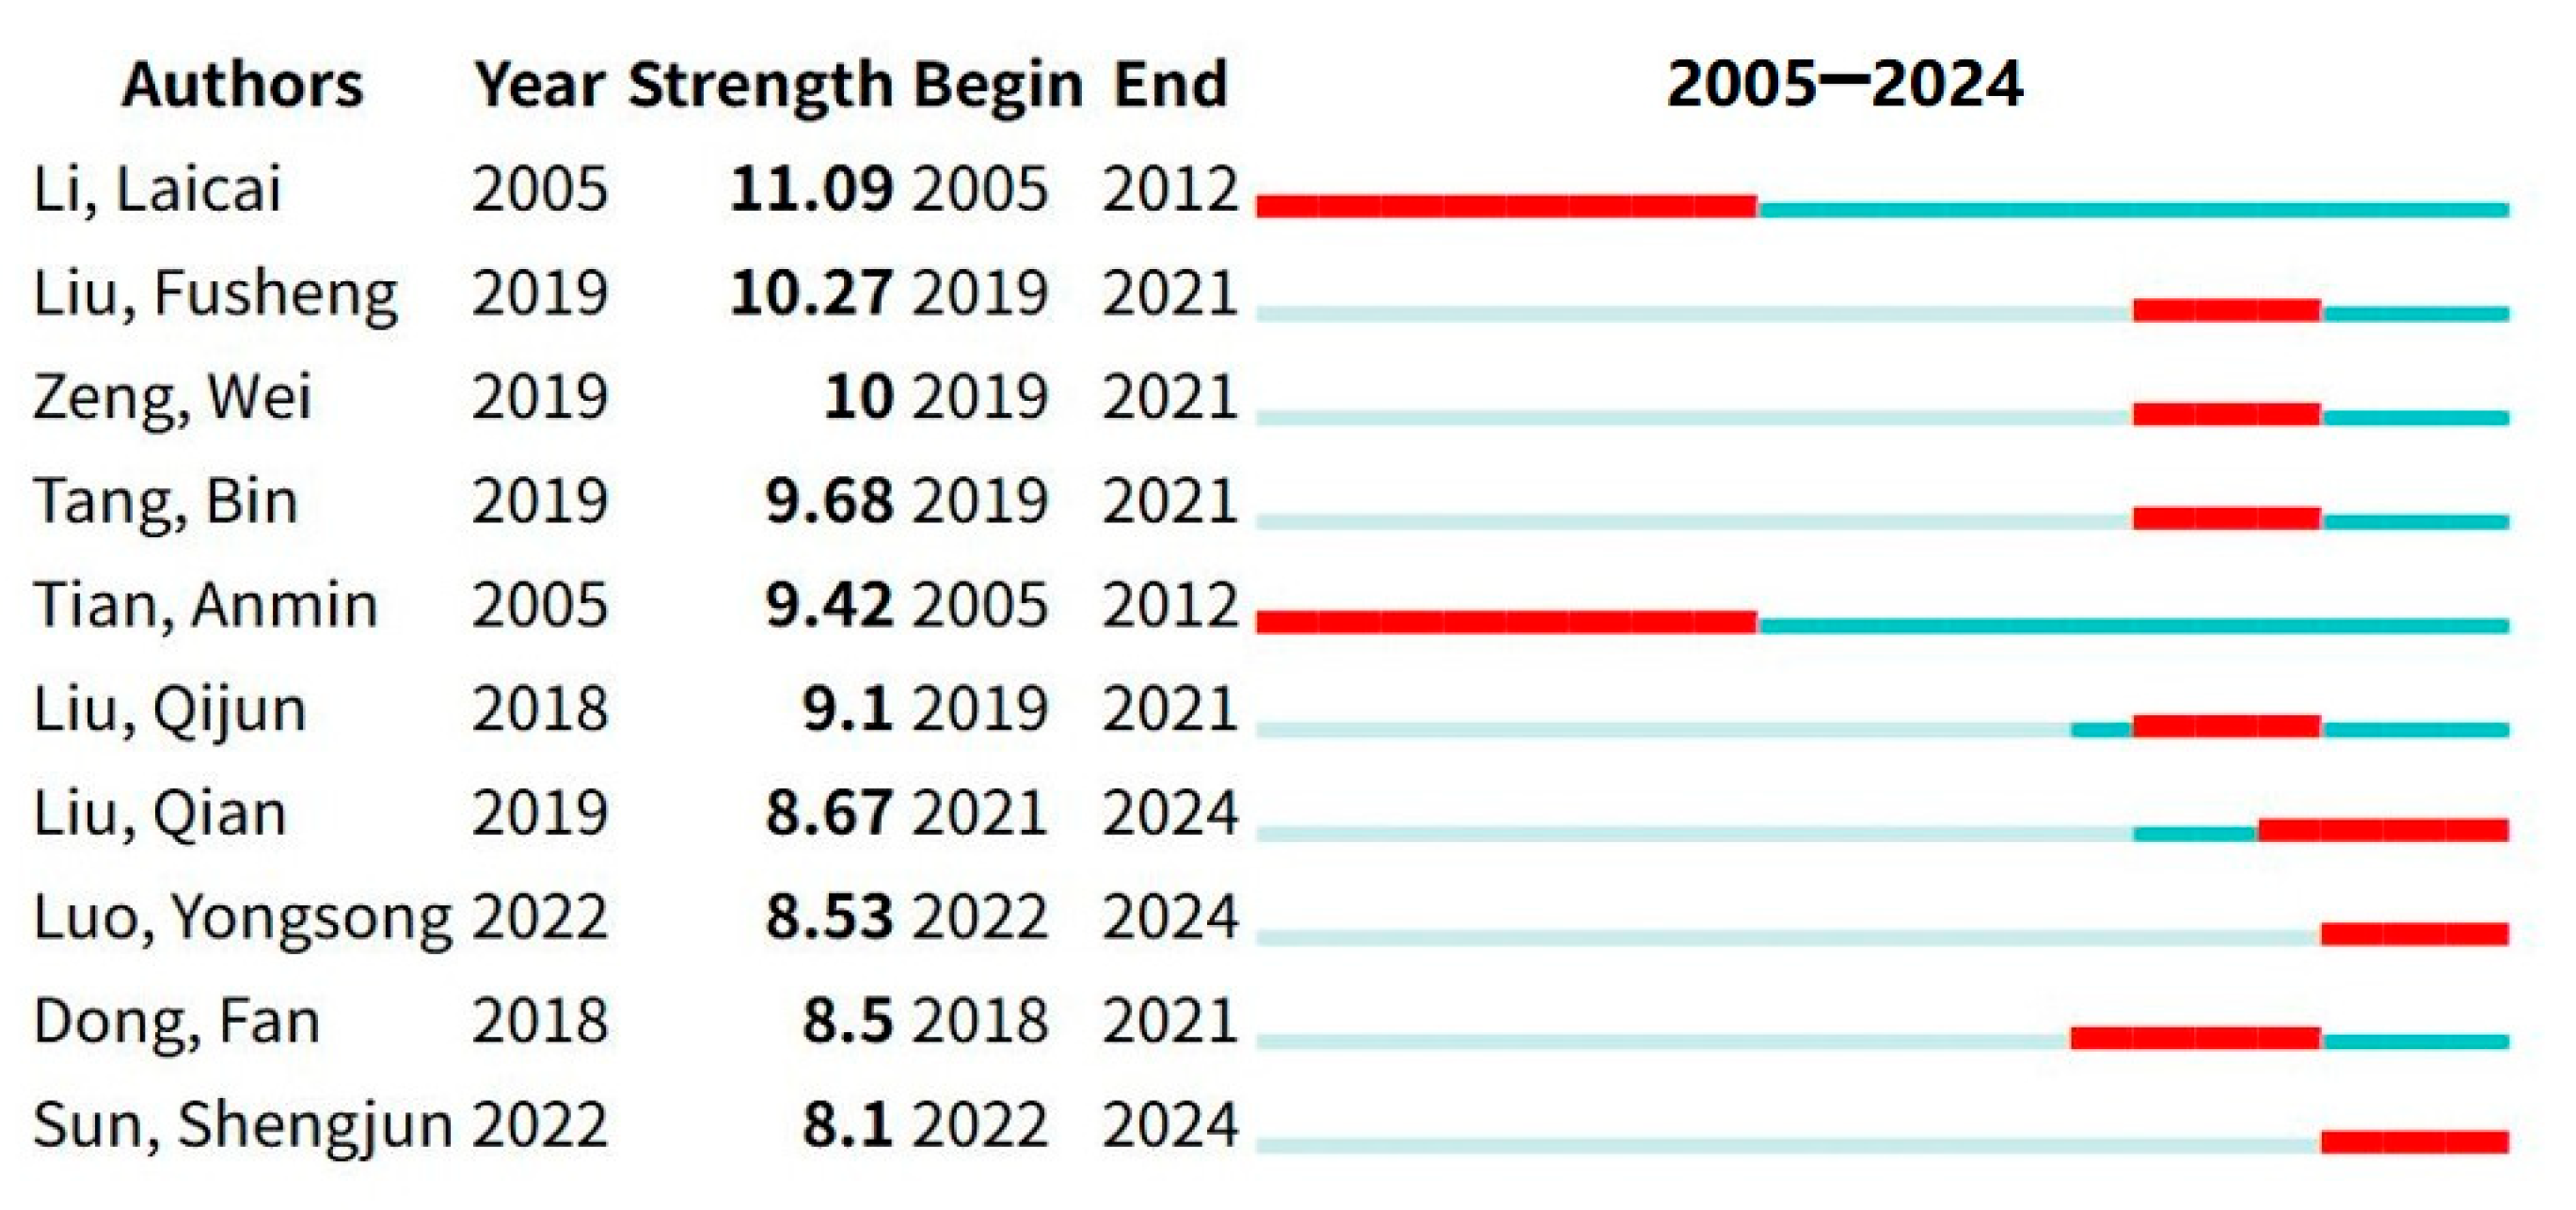
The citation burst analysis (Figure 8) reveals several short-term “emergent authors,” whose works gained rapid academic attention between 2019 and 2024. This pattern reflects the dynamic nature of emerging research topics, where new scholars frequently contribute to fast-developing subfields rather than forming long-term, stable collaborations. Such episodic author bursts are common in regions undergoing rapid scientific transition, as observed in other developing innovation systems (Fernandes et al., 2021).
As illustrated in Figure 9, the author network in Cluster #1 is also relatively sparse (density = 0.0076), but it demonstrates a clearer multi-core structure. Several core teams centered on applied engineering and electronic systems research show higher betweenness centrality, indicating pivotal roles in linking smaller, specialized clusters. The absence of early collaboration (2005–2009) suggests that inter-university partnerships in this domain emerged later, likely driven by policy incentives for information technology and smart manufacturing after 2010.
Figure 10 further identifies authors with the strongest citation bursts between 2019 and 2024, signaling that this field has experienced accelerated growth and diversification in recent years. Rather than individual scholarly dominance, these bursts indicate that multiple emerging teams are simultaneously driving research fronts in electronic and information engineering.
When viewed through the lens of the Regional Innovation Systems (RIS) framework (Asheim & Gertler, 2006; Fernandes et al., 2021), these micro-level author networks reveal how localized research collaborations contribute to the broader regional innovation structure. The relatively sparse structure of the collaboration network may stem from institutional silos and fragmented funding systems that have historically limited cross-university cooperation within the CCEC. However, national initiatives launched after 2016 have progressively reduced these barriers, and inter-university collaboration has been developing toward systemic integration. Core authors and teams act as knowledge brokers, connecting institutional nodes and enabling cross-disciplinary innovation. Over time, the rise in connectivity and the emergence of new collaborative ties signify a gradual strengthening of the region’s scientific base—an early stage of the regional innovation cycle characterized by institutional learning and network consolidation.
In summary, while the author networks of CCEC universities remain less dense than those in more mature innovation regions such as the Yangtze River Delta or the Greater Bay Area, the increasing linkage strength and evolving collaboration patterns suggest a positive trajectory toward greater integration, specialization, and knowledge diffusion across institutional and disciplinary boundaries.

5. Conclusions

This study provides a systematic bibliometric analysis of scientific research collaboration among universities in the CCEC. The findings reveal a clear trajectory of expansion in collaboration scale, thematic diversity, and institutional connectivity, reflecting the growing impact of national and regional innovation strategies.
(1)
Policy-driven evolution of collaboration. The development of university collaboration in the CCEC aligns closely with major national strategies. Collaborative publications increased sharply after these initiatives, confirming that policy interventions and funding incentives have been central to stimulating cross-institutional research integration.
(2)
Centralization of the collaboration network around core universities. Leading universities—SCU, UESTC, and CQU—occupy dominant positions in the collaboration network. Their high betweenness centrality demonstrates their bridging role in linking diverse research teams and fields. These institutions function as regional innovation anchors, providing critical platforms for research coordination and talent mobility.
(3)
Expanding interdisciplinary frontiers. Thematic co-occurrence analysis shows that collaborative research has diversified beyond traditional fields such as chemistry and engineering, extending into environmental science, materials, and applied mathematics. This transition toward interdisciplinary integration reflects the region’s adaptive response to the national “innovation-driven development” strategy and the demand for cross-sectoral problem-solving capacity.
(4)
Uneven network integration. Despite growing author collaboration, peripheral institutions remain weakly connected, suggesting structural imbalances within the regional innovation system. This fragmentation limits knowledge diffusion and reduces the overall efficiency of the collaboration network.
To address these gaps and strengthen regional innovation capacity, the following actions are proposed:
(1)
Embed collaboration in institutional frameworks. Universities and regional authorities should institutionalize cross-university cooperation through formalized alliances, joint laboratories, and co-funded research centers. These initiatives can be coordinated under national programs such as the Double First-Class University Plan or Western Innovation Hub Construction to ensure sustained financial and policy support.
(2)
Align funding mechanisms with collaborative performance. The Ministry of Education, the Ministry of Science and Technology, and local governments should design funding schemes that explicitly reward inter-institutional and interdisciplinary collaboration. For instance, adjusting the National Natural Science Foundation of China (NSFC) evaluation criteria to emphasize collaborative outcomes can incentivize deeper regional partnerships.
(3)
Strengthen policy coordination and innovation governance. A regional-level innovation coordination committee could be established to harmonize university–industry–government interactions, facilitate joint project management, and monitor collaboration performance. Integrating innovation indicators into local performance evaluation systems can further enhance accountability and network sustainability.
Overall, the CCEC’s evolving research collaboration network demonstrates the transformative potential of coordinated policy, institutional leadership, and interdisciplinary convergence. Continued efforts to embed collaboration within funding systems and governance frameworks will be crucial for consolidating the CCEC’s role as a leading innovation engine in western China.

Author Contributions

Conceptualization, T.Z. and C.P.; methodology, T.Z.; software, T.Z.; validation, T.Z., P.T. and C.P.; formal analysis, T.Z.; investigation, T.Z.; resources, P.T.; data curation, T.Z.; writing—original draft preparation, T.Z.; writing—review and editing, T.Z.; visualization, T.Z.; supervision, P.T. and C.P.; project administration, P.T.; funding acquisition, P.T. All authors have read and agreed to the published version of the manuscript.

Funding

This research received no external funding.

Institutional Review Board Statement

Not applicable.

Informed Consent Statement

Not applicable.

Data Availability Statement

The data presented in this study are openly available in [Evolution of Inter-University Research Collaboration in the Chengdu–Chongqing Economic Circle (2005–2024)] [https://doi.org/10.5281/zenodo.17199067 (25 September 2025)] [17199067].

Conflicts of Interest

The authors declare no conflicts of interest.

Appendix A

Table A1. List of 47 Public Universities in the CCEC.
NO.University NameLocation
1Chengdu Medical CollegeChengdu, Sichuan Province
2Chengdu Normal UniversityChengdu, Sichuan Province
3Chengdu Sport UniversityChengdu, Sichuan Province
4Chengdu Technological UniversityChengdu, Sichuan Province
5Chengdu UniversityChengdu, Sichuan Province
6Chengdu University of Information TechnologyChengdu, Sichuan Province
7Chengdu University of TechnologyChengdu, Sichuan Province
8Chengdu University of Traditional Chinese MedicineChengdu, Sichuan Province
9Sichuan Conservatory of MusicChengdu, Sichuan Province
10Sichuan Normal UniversityChengdu, Sichuan Province
11Sichuan Tourism UniversityChengdu, Sichuan Province
12Sichuan UniversityChengdu, Sichuan Province
13Southwest Jiaotong UniversityChengdu, Sichuan Province
14Southwest Minzu UniversityChengdu, Sichuan Province
15Southwest Petroleum UniversityChengdu, Sichuan Province
16Southwestern University of Finance and EconomicsChengdu, Sichuan Province
17University of Electronic Science and Technology of ChinaChengdu, Sichuan Province
18Xihua UniversityChengdu, Sichuan Province
19Chongqing Jiaotong UniversityChongqing
20Chongqing Medical UniversityChongqing
21Chongqing Normal UniversityChongqing
22Chongqing Police CollegeChongqing
23Chongqing Technology and Business UniversityChongqing
24Chongqing Three Gorges UniversityChongqing
25Chongqing UniversityChongqing
26Chongqing University of Arts and SciencesChongqing
27Chongqing University of EducationChongqing
28Chongqing University of Posts and TelecommunicationsChongqing
29Chongqing University of Science and TechnologyChongqing
30Chongqing University of TechnologyChongqing
31Sichuan International Studies UniversityChongqing
32Southwest UniversityChongqing
33Southwest University of Political Science and LawChongqing
34Yangtze Normal UniversityChongqing
35Sichuan University of Arts and ScienceDazhou, Sichuan Province
36Civil Aviation Flight University of ChinaDeyang, Sichuan Province
37Leshan Normal UniversityLeshan, Sichuan Province
38Sichuan Police CollegeLuzhou, Sichuan Province
39Southwest Medical UniversityLuzhou, Sichuan Province
40Mianyang Normal UniversityMianyang, Sichuan Province
41Southwest University of Science and TechnologyMianyang, Sichuan Province
42China West Normal UniversityNanchong, Sichuan Province
43North Sichuan Medical CollegeNanchong, Sichuan Province
44Neijiang Normal UniversityNeijiang, Sichuan Province
45Sichuan Agricultural UniversityYa’an, Sichuan Province
46Yibin UniversityYibin, Sichuan Province
47Sichuan University of Science & EngineeringZigong, Sichuan Province

References

  1. Asheim, B. T., & Gertler, M. S. (2006). The geography of innovation: Regional innovation systems. In J. Fagerberg, & D. C. Mowery (Eds.), The Oxford Handbook of Innovation. Oxford University Press. [Google Scholar] [CrossRef]
  2. Chen, C. (2004). Searching for intellectual turning points: Progressive knowledge domain visualization. Proceedings of the National Academy of Sciences, 101suppl_1, 5303–5310. [Google Scholar] [CrossRef]
  3. Chen, C. (2006). CiteSpace II: Detecting and visualizing emerging trends and transient patterns in scientific literature. Journal of the American Society for Information Science and Technology, 57(3), 359–377. [Google Scholar] [CrossRef]
  4. Chen, C. (2012). Predictive effects of structural variation on citation counts. Journal of the Association for Information Science & Technology, 63(3), 431–449. [Google Scholar]
  5. Chen, C. (2013). The structure and dynamics of scientific knowledge. In C. Chen (Ed.), Mapping scientific frontiers: The quest for knowledge visualization (pp. 163–199). Springer. [Google Scholar] [CrossRef]
  6. Chen, C. (2016). CiteSpace: A practical guide for mapping scientific literature. Nova Science Publishers. [Google Scholar]
  7. Chu, W. W., Hafiz, N. R. M., Mohamad, U. A., Ashamuddin, H., & Tho, S. W. (2023). A review of STEM education with the support of visualizing its structure through the CiteSpace software. International Journal of Technology and Design Education, 33(1), 39–61. [Google Scholar] [CrossRef]
  8. Donthu, N., Kumar, S., Mukherjee, D., Pandey, N., & Lim, W. M. (2021). How to conduct a bibliometric analysis: An overview and guidelines. Journal of Business Research, 133, 285–296. [Google Scholar] [CrossRef]
  9. Ducharme, L. J., Fujimoto, K., Kuo, J., Stewart, J., Taylor, B., & Schneider, J. (2024). Collaboration and growth in a large research cooperative: A network analytic approach. Evaluation and Program Planning, 102, 102375. [Google Scholar] [CrossRef]
  10. Fernandes, C., Farinha, L., Ferreira, J. J., Asheim, B., & Rutten, R. (2021). Regional innovation systems: What can we learn from 25 years of scientific achievements? Regional Studies, 55(3), 377–389. [Google Scholar] [CrossRef]
  11. Freeman, L. (1977). A set of measures of centrality based on betweenness. Sociometry, 40, 35–41. [Google Scholar] [CrossRef]
  12. Galison, P. L., & Hevly, B. W. (1993). Big science: The growth of large-scale research. University of Chicago Press. [Google Scholar]
  13. Glänzel, W., & Schubert, A. (2005). Analysing scientific networks through co-authorship. In H. F. Moed, W. Glänzel, & U. Schmoch (Eds.), Handbook of quantitative science and technology research: The use of publication and patent statistics in studies of S&T systems (pp. 257–276). Springer. [Google Scholar] [CrossRef]
  14. Hou, L., Liu, Y., & He, X. (2023). Research on the mechanism of regional innovation network in western China based on ERGM: A case study of Chengdu-Chongqing Shuangcheng economic circle. Sustainability, 15(10), 7993. [Google Scholar] [CrossRef]
  15. Jithoo, D., & Langa, P. (2025). Bridging the gap: Fostering cross-border intra-african research collaboration among south african universities. Internationalisation of Higher Education, 12(1), 61–85. [Google Scholar] [CrossRef]
  16. Junjia, Y., Alias, A. H., Haron, N. A., & Abu Bakar, N. (2023). A bibliometric review on safety risk assessment of construction based on citespace software and WoS database. Sustainability, 15(15), 11803. [Google Scholar] [CrossRef]
  17. Kastrin, A., & Hristovski, D. (2021). Scientometric analysis and knowledge mapping of literature-based discovery (1986–2020). Scientometrics, 126(2), 1415–1451. [Google Scholar] [CrossRef]
  18. Katz, J. S. (1992). Bibliometric assessment of intranational university—University collaboration [Doctoral dissertation, University of Sussex]. Available online: https://www.researchgate.net/profile/J-Katz-3/publication/34019430_Bibliometric_assessment_of_intranational_university_-_university_collaboration/links/0912f513790b0ec830000000/Bibliometric-assessment-of-intranational-university-university-collaboration.pdf (accessed on 22 September 2025).
  19. Katz, J. S., & Martin, B. R. (1997). What is research collaboration? Research Policy, 26(1), 1–18. [Google Scholar] [CrossRef]
  20. Kleinberg, J. (2003). Bursty and hierarchical structure in streams. Data Mining and Knowledge Discovery, 7(4), 373–397. [Google Scholar] [CrossRef]
  21. Kyvik, S., & Reymert, I. (2017). Research collaboration in groups and networks: Differences across academic fields. Scientometrics, 113(2), 951–967. [Google Scholar] [CrossRef] [PubMed]
  22. Lawani, S. M. (1981). Bibliometrics: Its theoretical foundations, methods and applications. Libri, 31(4), 294–315. [Google Scholar] [CrossRef]
  23. Lewis, J. M., Ross, S., & Holden, T. (2012). The how and why of academic collaboration: Disciplinary differences and policy implications. Higher Education, 64(5), 693–708. [Google Scholar] [CrossRef]
  24. Li, Y., & Phelps, N. A. (2018). Articulating China’s science and technology: Knowledge collaboration networks within and beyond the Yangtze River delta megalopolis in China. Chinese Geographical Science, 28(2), 247–260. [Google Scholar] [CrossRef]
  25. Liu, D., Che, S., & Zhu, W. (2022). Visualizing the knowledge domain of academic mobility research from 2010 to 2020: A bibliometric analysis using CiteSpace. SAGE Open, 12(1), 15. [Google Scholar] [CrossRef]
  26. Ma, H., Li, Y., & Huang, X. (2020). Proximity and the evolving knowledge polycentricity of megalopolitan science: Evidence from China’s Guangdong-Hong Kong-Macao Greater Bay Area, 1990–2016. Urban Studies, 58(12), 2405–2423. [Google Scholar] [CrossRef]
  27. Ma, J., Jiang, F., Gu, L., Zheng, X., Lin, X., & Wang, C. (2020). Patterns of the network of cross-border university research collaboration in the Guangdong-Hong Kong-Macau greater bay area. Sustainability, 12(17), 6846. [Google Scholar] [CrossRef]
  28. Mohsen, M. A., Althebi, S., & Qadhi, S. (2025). Mapping the evolution of computer-assisted language learning research: A 44-year bibliometric overview. European Journal of Education, 60(2), e70051. [Google Scholar] [CrossRef]
  29. Mwantimwa, K., & Kassim, M. (2023). Why does researchers’ collaboration matter in research activities? Higher Education Quarterly, 77(4), 741–755. [Google Scholar] [CrossRef]
  30. Newman, M. E. J. (2001). The structure of scientific collaboration networks. Proceedings of the National Academy of Sciences, 98(2), 404–409. [Google Scholar] [CrossRef]
  31. Newman, M. E. J. (2006). Modularity and community structure in networks. Proceedings of the National Academy of Sciences, 103(23), 8577–8582. [Google Scholar] [CrossRef] [PubMed]
  32. Olabiyi, O. J., Vuuren, C. J. V., Du Plessis, M., Xue, Y., & Zhu, C. (2025). Digital academic leadership in higher education institutions: A bibliometric review based on CiteSpace. Education Sciences, 15(7), 846. [Google Scholar] [CrossRef]
  33. Owusu-Nimo, F., & Boshoff, N. (2017). Research collaboration in Ghana: Patterns, motives and roles. Scientometrics, 110(3), 1099–1121. [Google Scholar] [CrossRef]
  34. Page, M. J., McKenzie, J. E., Bossuyt, P. M., Boutron, I., Hoffmann, T. C., Mulrow, C. D., Shamseer, L., Tetzlaff, J. M., Akl, E. A., Brennan, S. E., Chou, R., Glanville, J., Grimshaw, J. M., Hróbjartsson, A., Lalu, M. M., Li, T., Loder, E. W., Mayo-Wilson, E., McDonald, S., … Moher, D. (2021). The PRISMA 2020 statement: An updated guideline for reporting systematic reviews. BMJ, 372, n71. [Google Scholar] [CrossRef]
  35. Price, D. J. D. S. (1963). Little science, big science. Columbia University Press. [Google Scholar] [CrossRef]
  36. Pritchard, A. (1969). Statistical Bibliography or Bibliometrics? Journal of Documentation, 25(4), 348–349. [Google Scholar]
  37. Qin, Y., Xu, Z., Wang, X., & Skare, M. (2024). Artificial intelligence and economic development: An evolutionary investigation and systematic review. Journal of the Knowledge Economy, 15(1), 1736–1770. [Google Scholar] [CrossRef]
  38. Rapti, S., Tselegkaridis, S., Sapounidis, T., & Triantafyllou, S. A. (2025). A bibliometric and content analysis of educational robotics’ impact on communication, collaboration, critical thinking, and creativity in kindergarten. Thinking Skills and Creativity, 57, 101849. [Google Scholar] [CrossRef]
  39. Rashid, S., Rehman, S. U., Ashiq, M., & Khattak, A. (2021). A scientometric analysis of forty-three years of research in social support in education (1977–2020). Education Sciences, 11(4), 149. [Google Scholar] [CrossRef]
  40. Ravasi, D., Zhu, J., Wan, W., Dorobantu, S., & Gruber, M. (2024). What makes research collaborations successful? Advice from AMJ authors. Academy of Management Journal, 67(3), 583–594. [Google Scholar] [CrossRef]
  41. Roebken, H. (2008). The formation and development of co-operations among South African universities. Higher Education, 56(6), 685–698. [Google Scholar] [CrossRef]
  42. Rojas-Sánchez, M. A., Palos-Sánchez, P. R., & Folgado-Fernández, J. A. (2023). Systematic literature review and bibliometric analysis on virtual reality and education. Education and Information Technologies, 28(1), 155–192. [Google Scholar] [CrossRef] [PubMed]
  43. Rui, D., Hong, L., & Xiaoli, X. (2023). Analysis of the higher education research in the chengdu-chongqing region: A comparative perspective based on three major economic circles in China. Contemporary Social Sciences, 8(1), 102–115. [Google Scholar] [CrossRef]
  44. Salini, S. (2016). An introduction to bibliometrics. In T. Greenfield, & S. Greener (Eds.), Research methods for postgraduates (3rd ed., pp. 130–143). Wiley. [Google Scholar]
  45. Schwachula, A. (2021). Transnational science cooperation for sustainable development. In S. Chaturvedi, H. Janus, S. Klingebiel, X. Li, A. d. Mello e Souza, E. Sidiropoulos, & D. Wehrmann (Eds.), The Palgrave handbook of development cooperation for achieving the 2030 agenda: Contested collaboration (pp. 59–88). Palgrave Macmillan. [Google Scholar] [CrossRef]
  46. Shen, C., Yang, Z., Lam, F. I., Tam, S. W., Yang, W., & Li, Y. (2025). Scientific and technological innovation cooperation network of the Greater Bay Area in South China: A social network analysis. PLoS ONE, 20(7), e0326515. [Google Scholar] [CrossRef]
  47. Sonnenwald, D. H. (2007). Scientific collaboration. In B. Cronin (Ed.), Annual review of information science and technology: Volume 41 (pp. 643–681). Information Today. [Google Scholar]
  48. Specht, A., & Crowston, K. (2022). Interdisciplinary collaboration from diverse science teams can produce significant outcomes. PLoS ONE, 17(11), e0278043. [Google Scholar] [CrossRef]
  49. Tetrevova, L., & Vlckova, V. (2020). The role of inter-university cooperation in the knowledge society. Perspectives: Policy and Practice in Higher Education, 24, 28–34. [Google Scholar]
  50. Vaverková, M. D., Polak, J., Kurcjusz, M., Jena, M. K., Murali, A. P., Nair, S. S., Aktaş, H., Hadinata, M. E., Ghezelayagh, P., & Andik, S. D. S. (2025). Enhancing sustainable development through interdisciplinary collaboration: Insights from diverse fields. Sustainable Development, 33(3), 3427–3454. [Google Scholar] [CrossRef]
  51. Wang, K., Dong, K., Wu, J., & Wu, J. (2023). Patterns of artificial intelligence policies in China: A nationwide perspective. Library Hi Tech, 43(1), 295–325. [Google Scholar] [CrossRef]
  52. Wang, L., & Zhao, X. (2025). Literature review on the image of the Communist Party of China in the past 30 years: Based on the bibliometric analysis of CiteSpace software. China Report, 61(2), 270–291. [Google Scholar] [CrossRef]
  53. Wasserman, S., & Faust, K. (1994). Social network analysis: Methods and applications. Cambridge University Press. [Google Scholar] [CrossRef]
  54. Yang, Y., Zhang, Y., Sun, D., He, W., & Wei, Y. (2025). Navigating the landscape of AI literacy education: Insights from a decade of research (2014–2024). Humanities and Social Sciences Communications, 12(1), 374. [Google Scholar] [CrossRef]
  55. Yuan, Y., Guo, J., & Guo, Z. (2023). An evolutionary analysis of higher-order interaction collaborative innovation networks in China’s new energy vehicle industry. Sustainability, 15(15), 11478. [Google Scholar] [CrossRef]
  56. Yuman, F., & Yutian, L. (2022). The spatiotemporal evolution and influencing factors of electronic information manufacturing industry in China. Tropical Geography, 42(12), 1980–1992. [Google Scholar] [CrossRef]
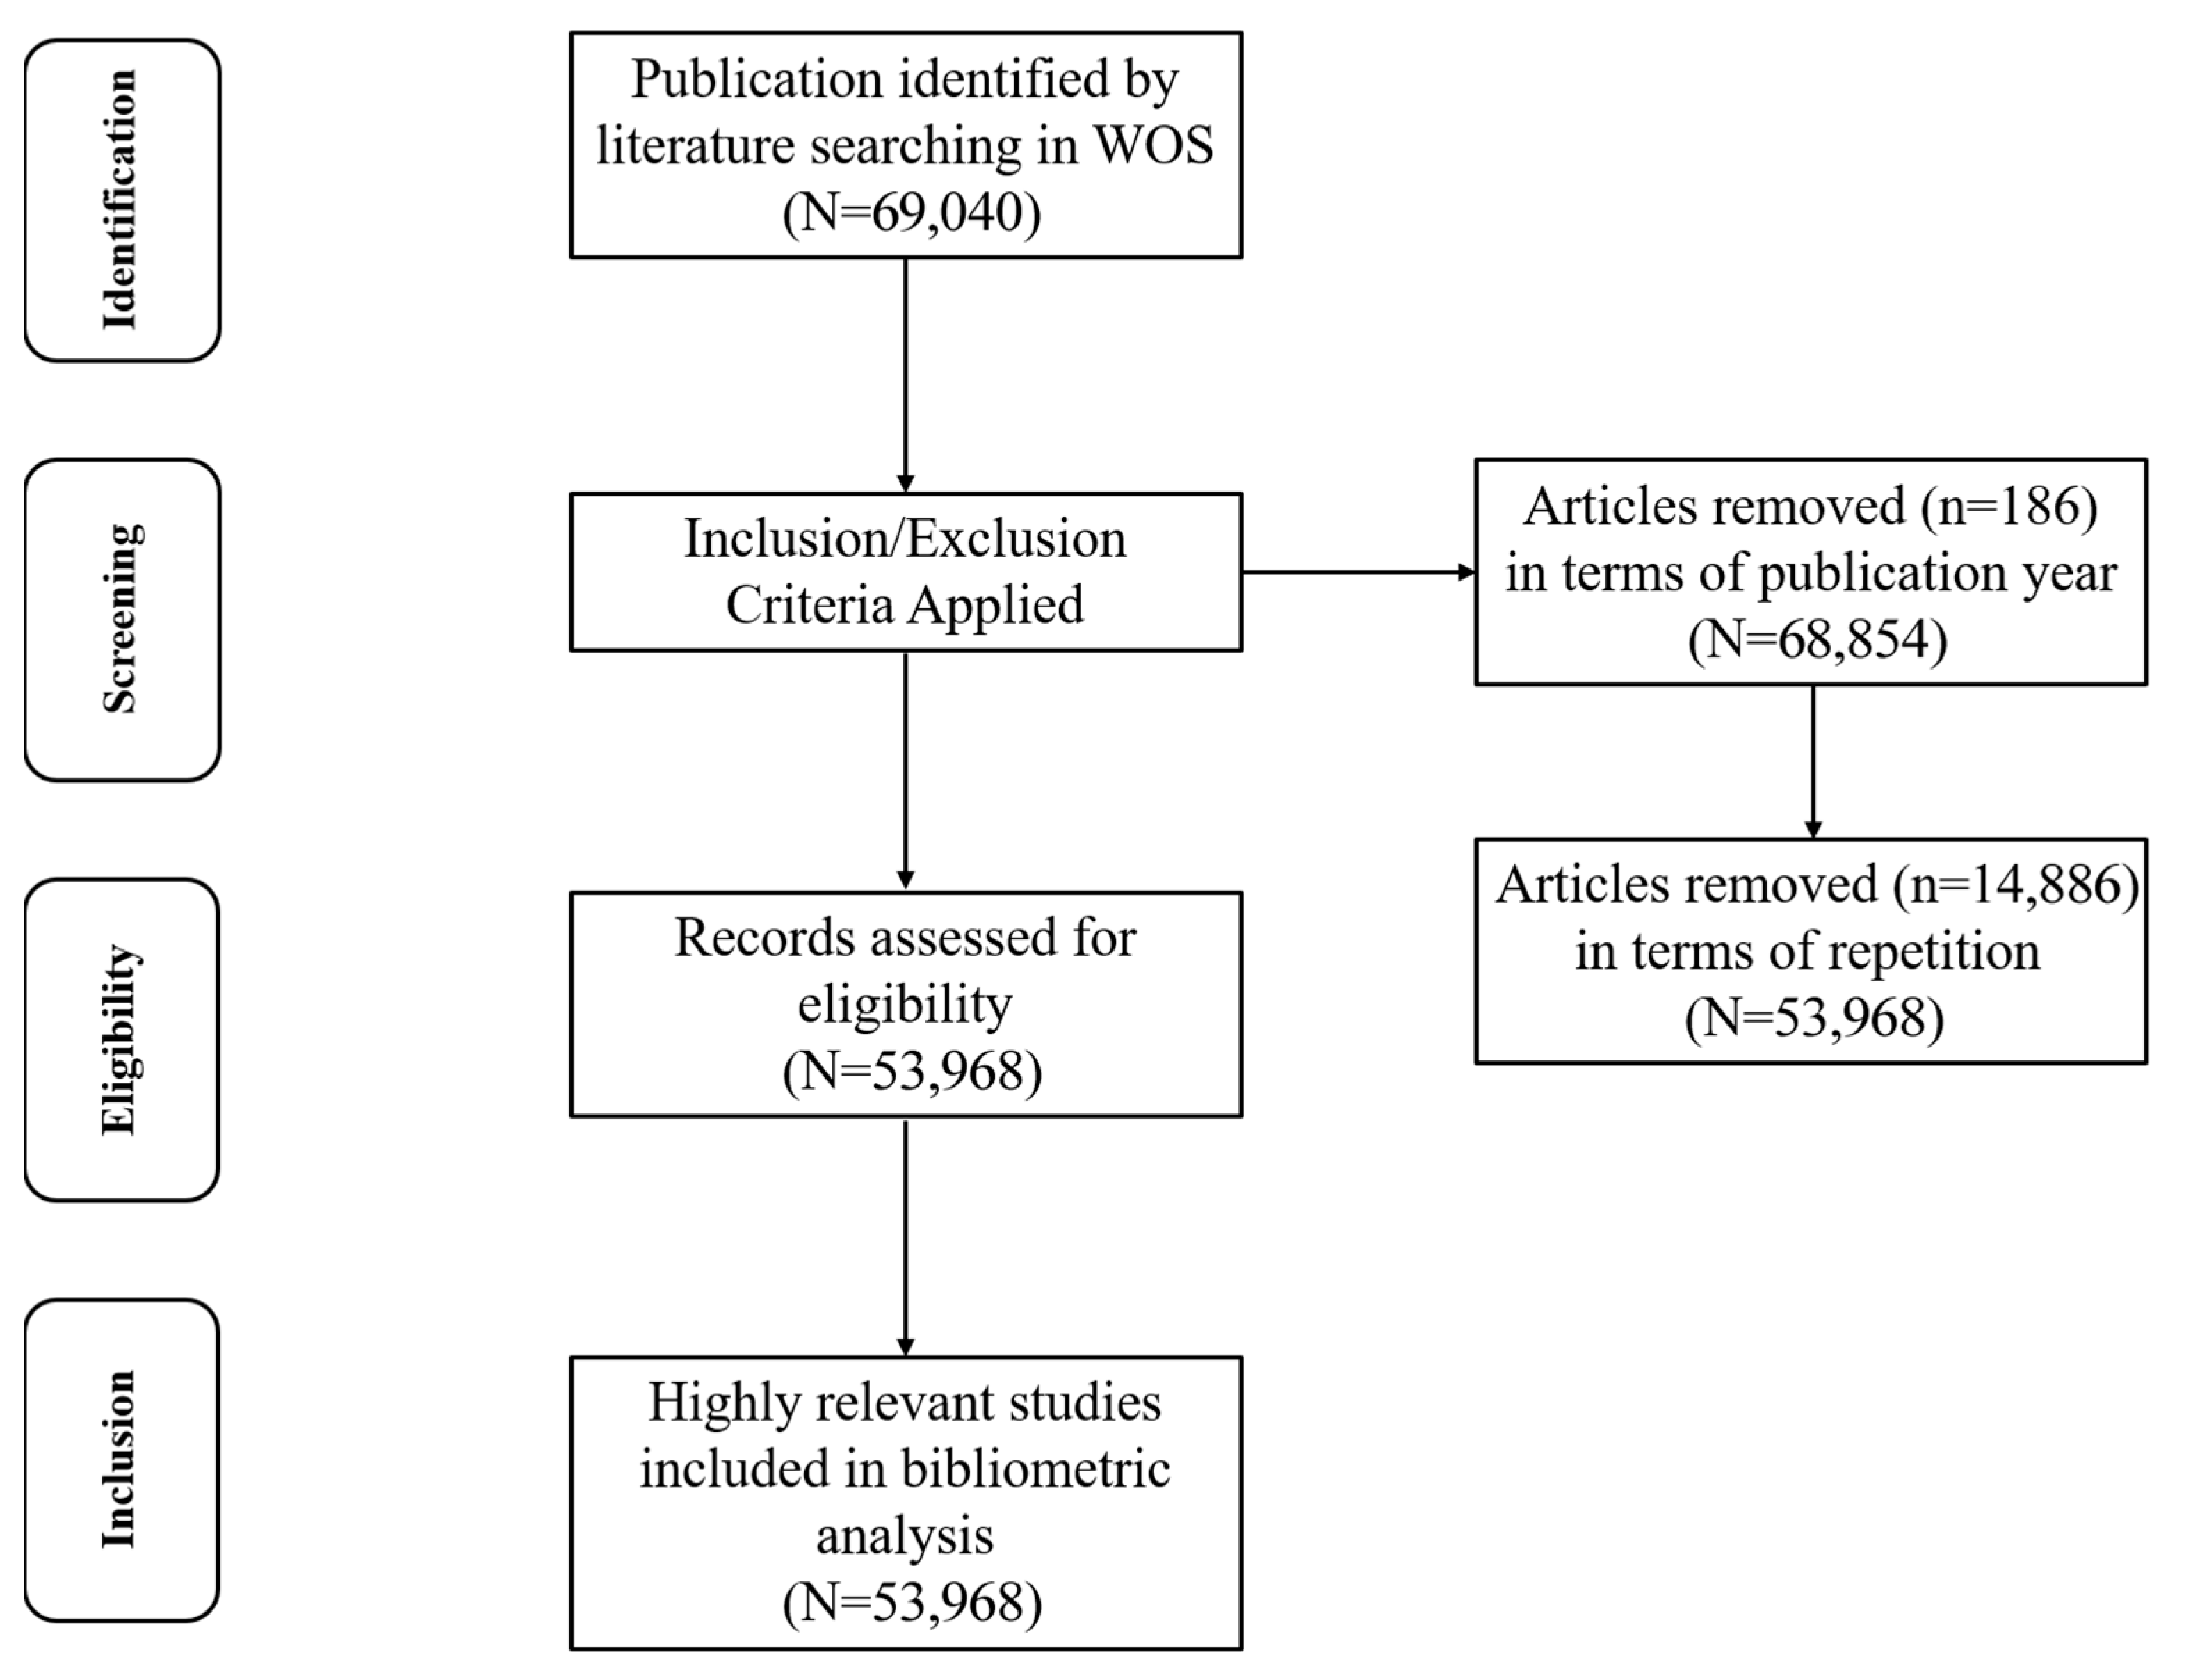
Figure 1. The Four-Phase Flowchart of Data Extraction and Screening for CCEC University Research Collaboration.
Publications 13 00056 g001
Figure 2. The Temporal Distribution of Publications of the CCEC Inter-University Research Collaboration (2005–2024).
Publications 13 00056 g002
Figure 3. Overall Collaboration Network of CCEC Universities (2005–2024). Note: Node size represents the number of joint publications. Edge thickness reflects the strength of collaboration between institutions. The purple outer circle represents institutions with betweenness centrality greater than 0.1.
Publications 13 00056 g003
Figure 4. Top 10 Institutions with the Strongest Citation Bursts in Scientific Collaboration of CCEC Universities. Note: “Strength” represents the magnitude of the citation burst, indicating how strongly an institution’s publications were cited during a specific period. Higher values reflect more intense increases in citation frequency and greater short-term influence within the collaboration network.
Publications 13 00056 g004
Figure 5. Thematic Co-occurrence Cluster Network of CCEC Universities’ Scientific Collaboration. Note: 1. Under CiteSpace’s default settings, clusters #12, #13, and #15 are excluded from the largest connected component and, therefore, are not shown in Figure 5. 2. Node size represents citation frequency, with larger nodes indicating higher citation counts. Link thickness reflects the strengths of co-citation relationships between documents. Colors distinguish different thematic clusters, with each cluster representing a coherent research area within the CCEC universities’ scientific collaboration network.
Publications 13 00056 g005
Figure 6. Top 10 Terms with the Strongest Citation Bursts in Scientific Collaboration of CCEC Universities. Note: “Strength” represents the magnitude of the citation burst, indicating how strongly an institution’s publications were cited during a specific period. Higher values reflect more intense increases in citation frequency and greater short-term influence within the collaboration network.
Publications 13 00056 g006
Figure 7. Author Collaboration Network of Research Theme Cluster #0 in CCEC Universities. Note: Node size represents the number of joint publications. Edge thickness reflects the strength of collaboration between institutions. The purple outer circle represents institutions with betweenness centrality greater than 0.1.
Publications 13 00056 g007
Figure 8. Top 10 Authors with the Strongest Citation Bursts in Research Theme Cluster #0 of CCEC Universities. Note: “Strength” represents the magnitude of the citation burst, indicating how strongly an institution’s publications were cited during a specific period. Higher values reflect more intense increases in citation frequency and greater short-term influence within the collaboration network.
Publications 13 00056 g008
Figure 9. Author Collaboration Network of Research Theme Cluster #1 in CCEC Universities. Note: Node size represents the number of joint publications. Edge thickness reflects the strength of collaboration between institutions. The purple outer circle represents institutions with betweenness centrality greater than 0.1.
Publications 13 00056 g009
Figure 10. Top 4 Authors with the Strongest Citation Bursts in Research Theme Cluster #1 of CCEC Universities. Note: “Strength” represents the magnitude of the citation burst, indicating how strongly an institution’s publications were cited during a specific period. Higher values reflect more intense increases in citation frequency and greater short-term influence within the collaboration network.
Publications 13 00056 g010
Table 1. Top 10 CCEC Universities Ranked by Betweenness Centrality.
No.PublicationsCentralityUniversity
116,1670.58Sichuan University
296370.41University of Electronic Science & Technology of China
312,7850.3Chongqing University
427760.21Chinese Academy of Sciences
563720.13Southwest Jiaotong University
661280.12Southwest University—China
726160.09Chongqing University of Posts & Telecommunications
826930.08Southwest University of Science & Technology—China
916800.05China West Normal University
1040320.05Chongqing Medical University
Disclaimer/Publisher’s Note: The statements, opinions and data contained in all publications are solely those of the individual author(s) and contributor(s) and not of MDPI and/or the editor(s). MDPI and/or the editor(s) disclaim responsibility for any injury to people or property resulting from any ideas, methods, instructions or products referred to in the content.