Article

Effect of the (Nd,Dy)-Double Doping on the Structural Properties of Ceria

by
Cristina Artini
1,2,*,
Lara Gigli
3,
Maria Maddalena Carnasciali
1,4 and
Marcella Pani
1,5
1
Department of Chemistry and Industrial Chemistry, University of Genova, Via Dodecaneso 31, 16146 Genova, Italy
2
Institute of Condensed Matter Chemistry and Technologies for Energy, National Research Council, CNR-ICMATE, Via De Marini 6, 16149 Genova, Italy
3
Elettra-Sincrotrone Trieste S.C.p.A., ss 14, km 163.5, 34149 Basovizza, Italy
4
INSTM, Genova Research Unit, Via Dodecaneso 31, 16146 Genova, Italy
5
CNR-SPIN, Corso Perrone 24, 16152 Genova, Italy
*
Author to whom correspondence should be addressed.
Inorganics 2019, 7(8), 94; https://doi.org/10.3390/inorganics7080094
Submission received: 12 June 2019 / Revised: 15 July 2019 / Accepted: 23 July 2019 / Published: 26 July 2019
(This article belongs to the Special Issue Rare Earth-Doped Ceria Systems and Their Applications)

Abstract

:
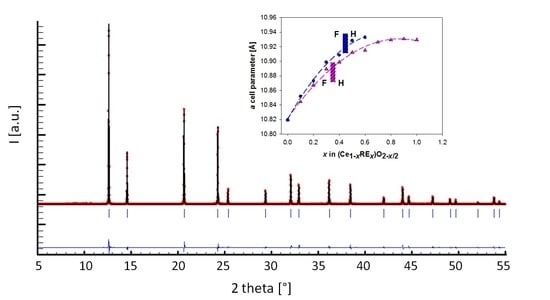
The crystallographic properties of the Ce1−x(Nd0.63Dy0.37)xO2−x/2 system (0 ≤ x ≤ 0.6) were studied by means of synchrotron powder X-ray diffraction and compared to the ones of Sm-doped ceria. The aim of this work was to investigate the effect of substituting Sm3+ by a mixture of a smaller and a larger ion that ensures a more pronounced Ce4+/dopant size mismatch while having the same average ionic size as Sm3+. Two main findings came to light: (a) the compositional region of the CeO2-based solid solution widens up to x ranging between 0.4 and 0.5, and (b) the cell parameter is larger than the one of Sm-doped ceria at each composition. Both effects are expected to play a significant role on the ionic conductivity of the material. The results are discussed in terms of disorder and cation-vacancy association.

Graphical Abstract

1. Introduction

Rare Earth (RE)-doped ceria systems form a thoroughly studied class of ceramic materials displaying interesting values of ionic conductivity, which make them attractive solid electrolytes to be used in solid oxide fuel cells (SOFCs) working in the intermediate temperature range (673–973 K) [1]. Ce0.9Gd0.1O1.95 and Ce0.8Sm0.2O1.90, for instance, present a remarkable ionic conductivity value of 102 S cm1 at 773 K [2,3], which allows us to significantly lower the cell operating temperature with respect to SOFCs by employing Y2O3-doped ZrO2 as an electrolyte, and, thus, to prolong the cell lifetime.
The mechanism of ionic conductivity in doped ceria is strictly connected to the structural properties of the material, such as defects association to the extent of the CeO2-based solid solution. For this reason, the crystallographic approach is not separate from the investigation of physical properties. On the contrary, it is fundamental in drawing guidelines aimed at designing efficient materials. Ionic conductivity in doped ceria implies the diffusion of O2− anions through the vacancies induced by the random partial substitution of Ce4+ by a trivalent ion. The mechanism optimally works if concentration and size of the doping ion fall within the proper range: if the dimension of the guest ion is sufficiently close to the one of Ce4+, the fluorite-related cubic structure of CeO2 (hereafter named F, space group F m 3 ¯ m , Ce coordination number: 8) tolerates the Ce4+ substitution, at least in terms of long range order and up to a certain degree, and oxygen vacancies can freely move through the lattice. Nevertheless, maximum values of ionic conductivity are observed at x (in Ce1−xRExO2−x/2) ~0.10–0.15, which, generally, corresponds to a composition far from the upper compositional limit of the phase. The cited maximum occurs well within the F range, because with increasing x, an increasing portion of the whole vacancies amount is blocked at fixed positions and no more able to move, since it becomes part of C-structured nano-domains and microdomains [4]. Recently, reverse Monte Carlo modeling indicated that, in Sm-doped ceria already at x = 0.05, the descriptions of average and local structure do not coincide, which suggests that, even at such a small doping level, the local environment around Ce4+ undergoes a distortion with respect to the F structure due to the formation of randomly oriented C-type droplets [5]. The C cubic structure (space group I a 3 ¯ , RE coordination number: 6) consists of a superstructure of F, which presents a cell parameter that, for RE ≡ Sm and Gd, is roughly doubled with respect to the one of CeO2.
Beyond the F upper compositional limit, two different scenarios appear, depending on the Ce4+/RE3+ size mismatch: if it exceeds 10%, the two-phase (F + C) field results to be stable, while, below this threshold, a hybrid F/C phase occurs [6]. In agreement with these remarks, Sm-doped and Gd-doped ceria, which are the most efficient systems in terms of ionic conductivity, crystallize in the hybrid atomic arrangement [7,8]. Lu-doped ceria, on the contrary, presents the two-phase (F + C) field when more than ~40% Ce4+ atoms are replaced by Lu3+ [9,10]. The occurrence of the hybrid (H) phase can be recognized in diffraction patterns through the absence of splitting between the peaks common to F and C, accompanied by an increase in intensity of the superstructure peaks with increasing x. Further signs marking the F→H transition are the abrupt discontinuity in the coefficient of thermal expansion [11,12] and in the formation temperature of the oxides [13]. The nature of H, which is widely discussed in previous papers [1,7,8,10,11,14,15], consists of a solid solution where the F-related CeO2 phase behaves as a matrix, and C-structured RE2O3 microdomains act as guests (while, in the F region, guests are represented by the randomly placed RE3+ ions).
As previously mentioned, the Sm-doped system is one of the most efficient ceria-based materials to be used as electrolytes [16]. Nevertheless, even if dimensional issues definitely play a role, the reason for this behavior is non-trivial, since it cannot be just attributed to the reduced lattice strain due to the Ce4+/Sm3+ size resemblance: Nd-doped ceria, for instance, shows similarly high ionic conductivity values, in spite of a remarkably larger strain caused by the non-negligible Ce4+/Nd3+ size mismatch [17]. Similarly, films of doped ceria exhibit a higher ionic conductivity when doped by a Nd/Sm mixture than by the sole Sm, due to the increased tensile strain brought about by the presence of Nd [18]. Starting from this point, the present work is intended to study the structural features of a system, Ce1−x(Nd0.63Dy0.37)xO2−x/2, where the most promising properties of both Nd-doped and Sm-doped ceria in terms of ionic conductivity are associated. The reasonableness of this choice is also testified by results reported in Reference [19], which indicate a value of ionic conductivity of 2.2 × 10² S/cm at 873 K for Ce0.8Nd0.1Dy0.1O1.85.
The Ce1−x(Nd0.63Dy0.37)xO2−x/2 doubly doped system combines an average dopant ionic size very close to the one of Sm3+, and a significant lattice strain due to the presence of a larger (Nd3+) and a smaller (Dy3+) ion with respect to Sm3+. The mean size of Sm3+ is reproduced by using an Nd/Dy mixture in the 0.63:0.37 atomic ratio, given that the Nd3+ and the Dy3+ ionic sizes (CN8) are 1.109 Å and 1.027 Å [20], respectively. The cited mixture provides an average dopant size of 1.079 Å, which exactly corresponds to the ionic radius reported for Sm3+ (CN8) [20]. Co-doping of ceria has been very widely studied in the past few years [21], since it has long been known as an effective method to enhance the ionic conductivity performance of ceria [22]. This approach was, in fact, generally predicted to favor higher values of ionic conductivity as compared to singly-doped systems, due to the hindering effect exerted by the presence of different doping ions on the growth of large C-structured clusters [23] and to the increased mobility of charge carriers. The issue is debated [24], but the effect of suppression of the oxygen vacancies local ordering is expected to lead to higher values of ionic conductivity, which is experimentally observed in the previously mentioned Nd/Dy- [19], and also in Gd/Y- [25], Gd/Sm- [25,26,27], La/Sm- [28], Sm/Nd- [29], Nd/Gd- [30], Pr/Nd- [31], Pr/Gd- [32], Er/Gd- [33], Pr/La- [34], La/Dy- [35] doped CeO2. In this work, a detailed study of the way the contemporary presence of two different doping ions enlarges the compositional extent of the F phase by hindering the vacancies association, and how it affects the main structural parameters of doped ceria, is presented.

2. Results

A series of six samples with nominal x = 0, 0.1, 0.2, 0.3, 0.4, 0.5, and 0.6, belonging to the Ce1−x(Nd0.63Dy0.37)xO2−x/2 system, was investigated. The lanthanide content of all the oxides was checked by scanning electron microscopy coupled to energy-dispersive system (SEM-EDS), and the experimental x values are collected in Table 1. It can be observed that they are very close to the nominal ones. Relying on this outcome, for each sample, the stoichiometric cationic amount was implemented into the structural model, and not allowed to vary in Rietveld refinement cycles. Figure 1 reports SEM microphotographs taken on the surface of the pellet of sample NdDy20 (a) and NdDy60 (b): A larger particle size is revealed by increasing the dopant content.
Since, for 0.1 ≤ x ≤ 0.4, only peaks related to the F structure appear, while superstructure peaks occur starting from x = 0.5, diffraction patterns were refined, according to two structural models, namely to F (0.1 ≤ x ≤ 0.4) and H (x = 0.5 and 0.6). Structural models F, H, and C are reported as Supplementary Materials in Table S1. While, in F, only two atomic positions are occupied (the 4a site by the rare earth and the 8c by O), in C, the rare earth site is split into two distinct positions. The hybrid structure H represents a transcription of F positions in terms of I a 3 ¯ , i.e., the space group that properly describes the C structure. As a consequence, structural parameters, which, in the F m 3 ¯ m space group, were constrained by symmetry, are no more fixed in I a 3 ¯ , and become a sensitive mark of the F/H transition occurring under the action of the C microdomains growth. Moreover, an additional position with respect to C is needed in 16c to place the excess oxygen atoms. Therefore, the H structure shares characters of both F and C without being identical to any one of them: rather, it conveniently describes the gradual and continuous transition from F to C by increasing the doping ion content.
The peak profile matching was done for each pattern using the pseudo-Voigt function. The background was optimized by linear interpolation of a set of ~70 points chosen from the experimental pattern. Individual displacement parameters B were refined for each Ce/Nd/Dy site. In the H model, the same refined B was attributed to both oxygen atoms.
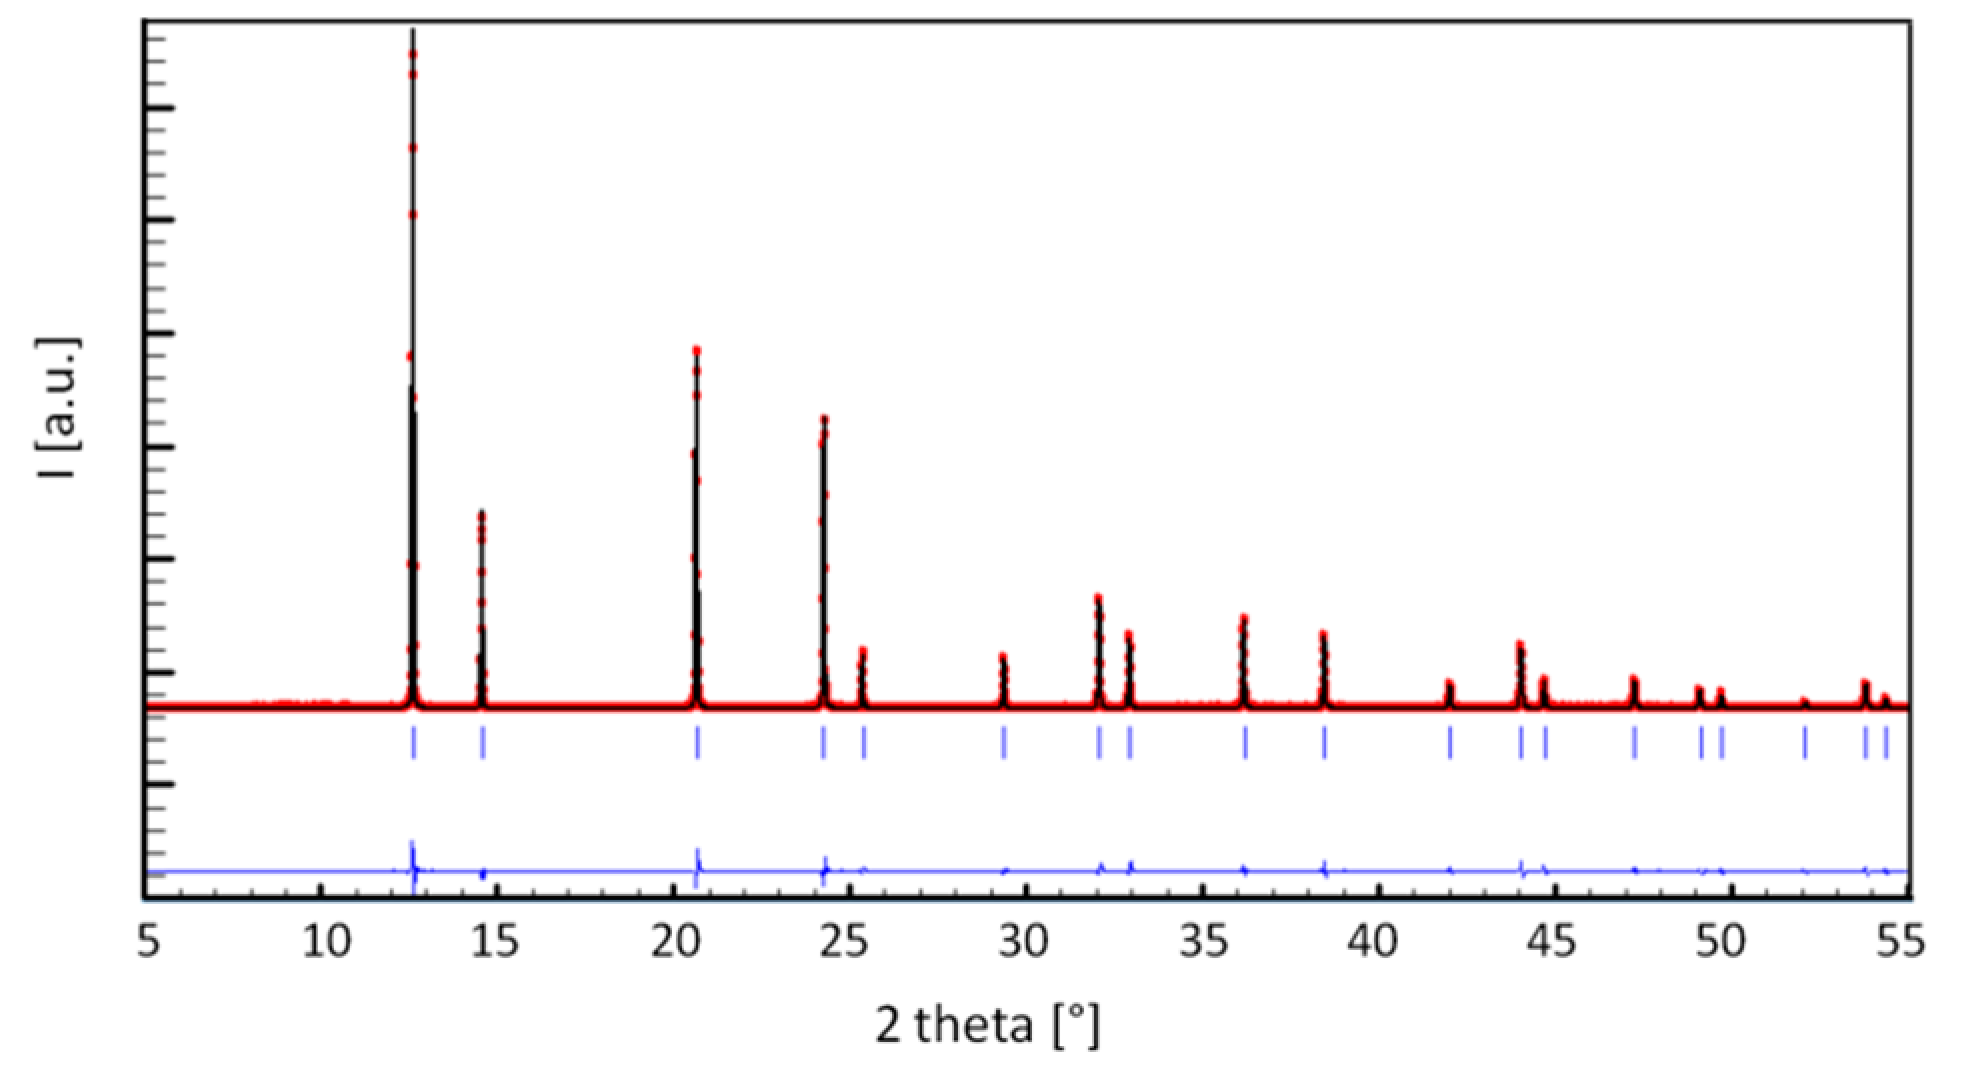
Diffraction patterns of samples with x ranging between 0.1 and 0.4 were also refined, according to the H structural model, in order to study the behavior of parameters sensitive to the F/C transition, such as, for example, the RE1 x position and the O2 occupancy factor. In Figure 2, the Rietveld refinement plot of sample NdDy20 is reported as a representative example.
The analysis of X-ray diffraction results suggests two main observations: if compared to the Sm-doped system, (a) the compositional extent of the F region is wider and, (b) at each composition, the cell parameter is larger.
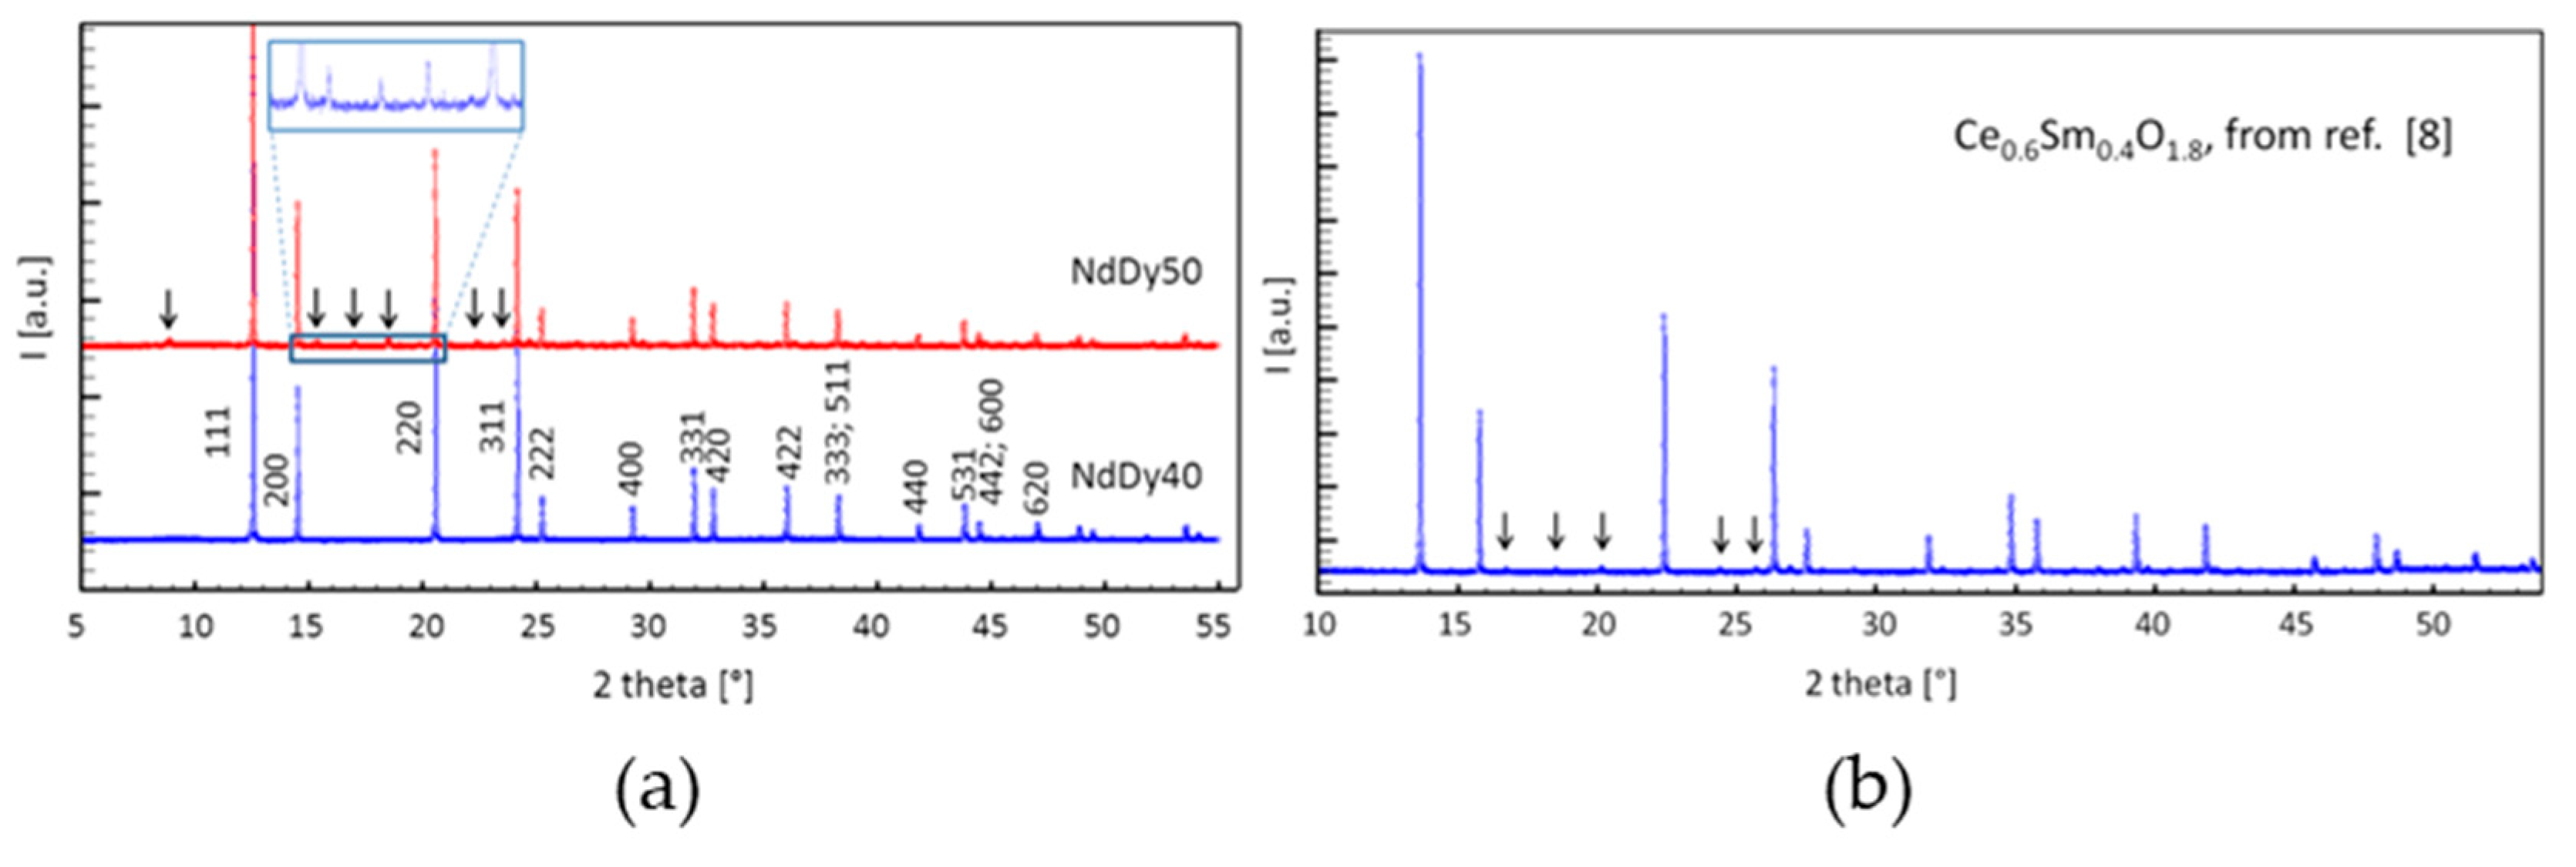
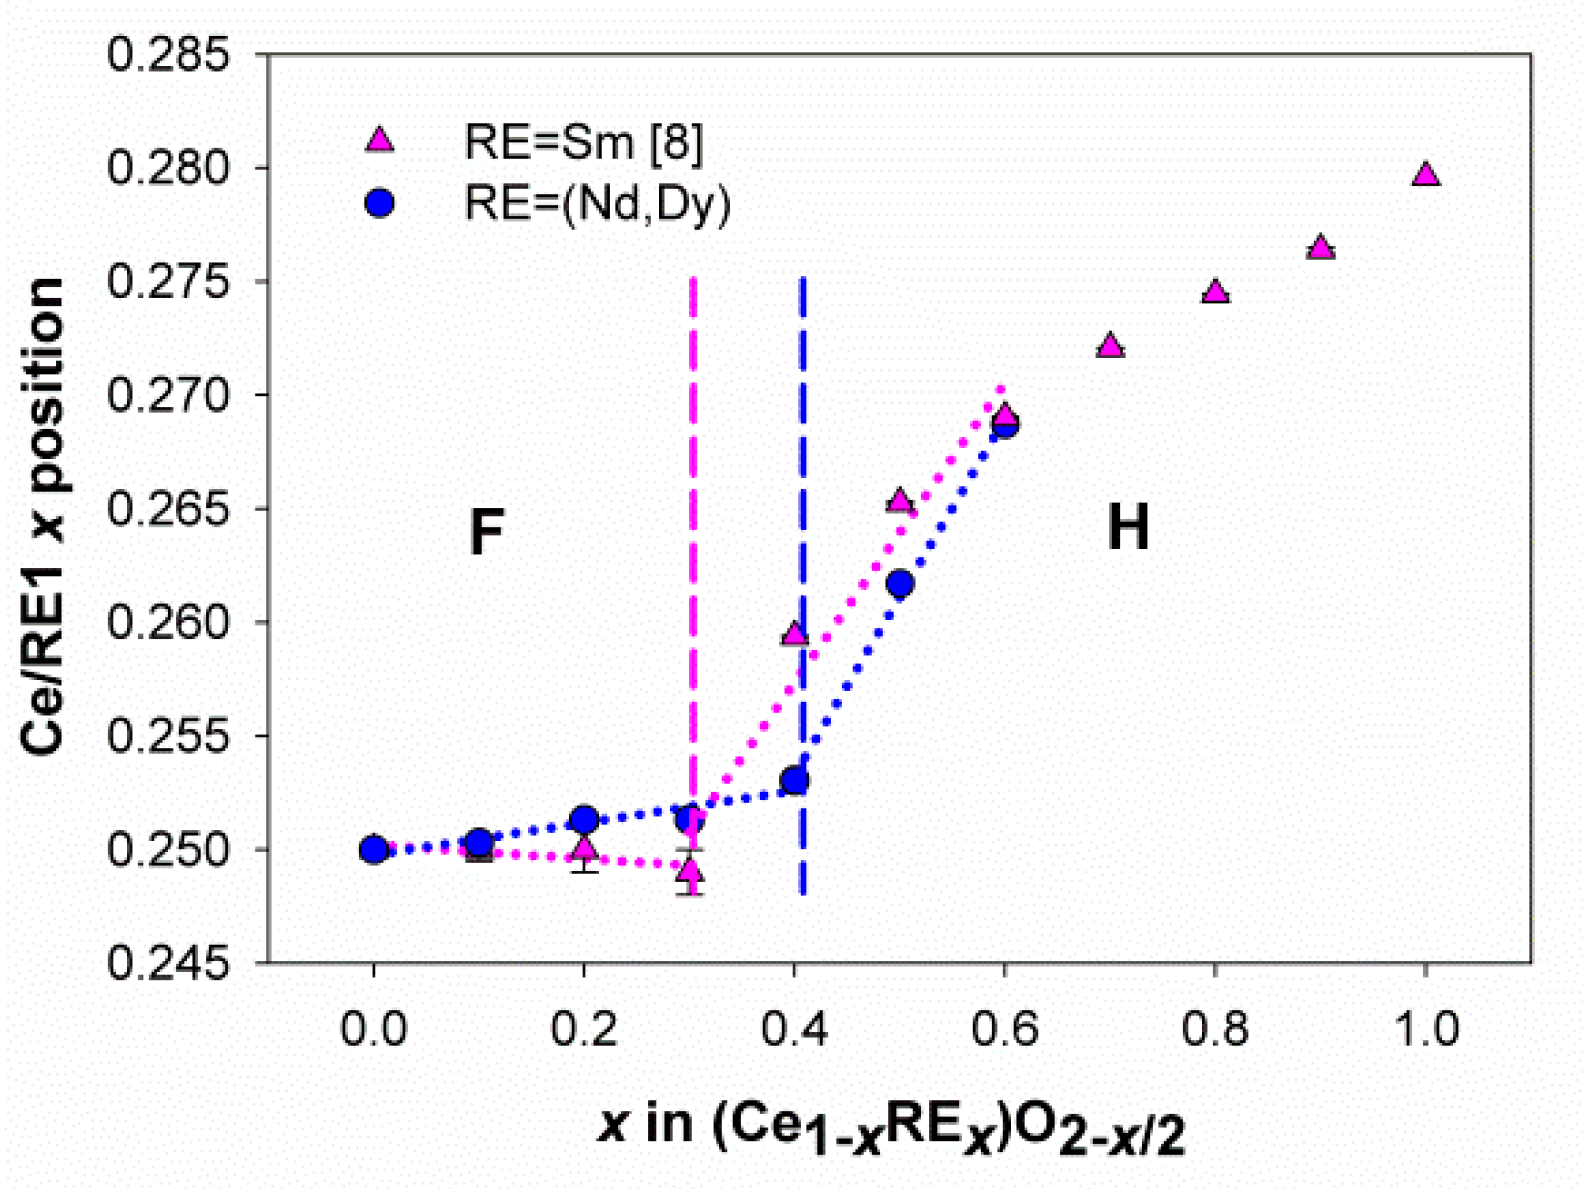
With reference to item (a), diffraction patterns reported in Figure 3a indicate that the most lightly doped sample displaying superstructure peaks is NdDy50, which suggests that the F/H transition is located at x ranging between 0.4 and 0.5. In Figure 3b, the diffractogram collected on Ce0.6Sm0.4O1.8 is shown as a term of comparison: peaks belonging to H are clearly visible. A further structural parameter marking the F/H transition is the RE1 x position: when C microdomains dispersed within the F matrix are large enough to be revealed by X-rays, this parameter significantly moves from ¼, i.e., from the value imposed by symmetry in F m 3 ¯ m , toward ~0.28, which is the value typical of the RE1 x position of the 24d site in I a 3 ¯ . Figure 4, reporting the trend of the RE1 x position vs. the RE content for both the Nd/Dy- and the Sm-doped ceria [8], clearly suggests that, in the former system, the F/H transition occurs at higher dopant content with respect to the latter, which confirms the previously described evidence.
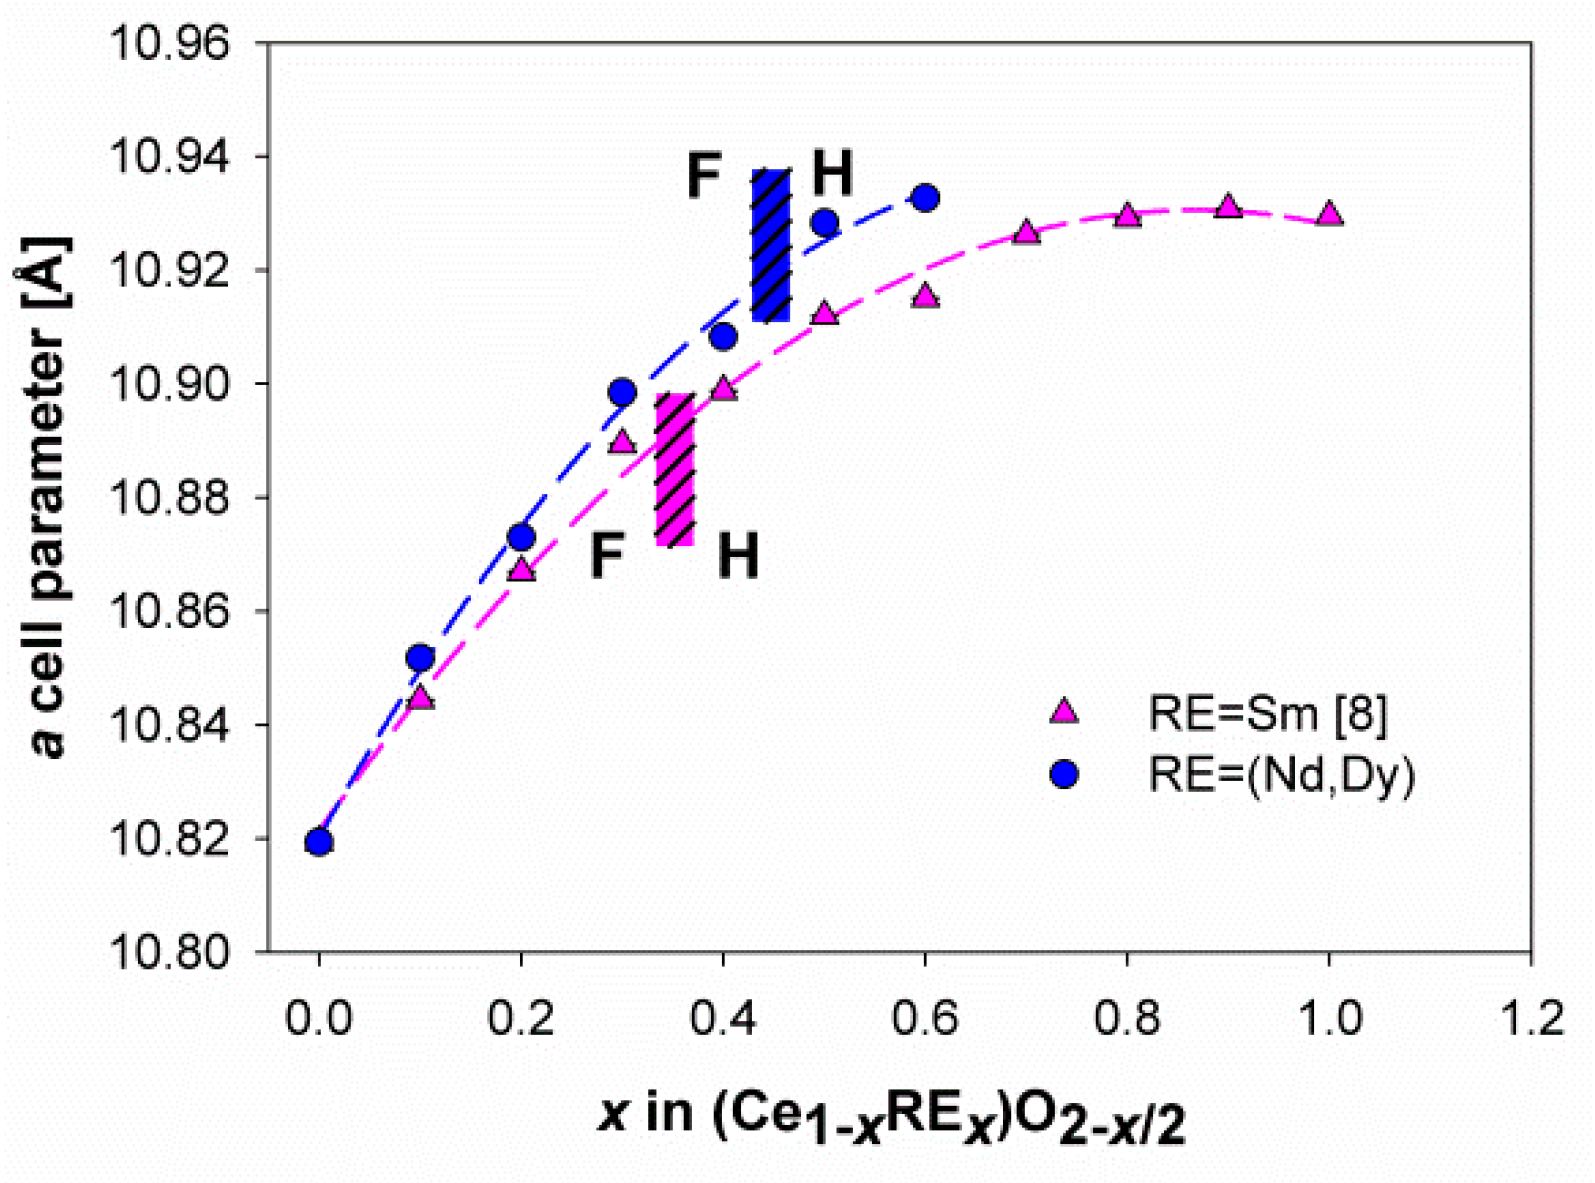
Figure 5 shows the behavior of the lattice parameter of both Sm- [8] and Nd/Dy-doped ceria as a function of the dopant content. In both systems, the trend is not linear, due to the not constant atomic content of the cell due to the oxygen loss taking place with increasing x, as discussed in References [8,10].
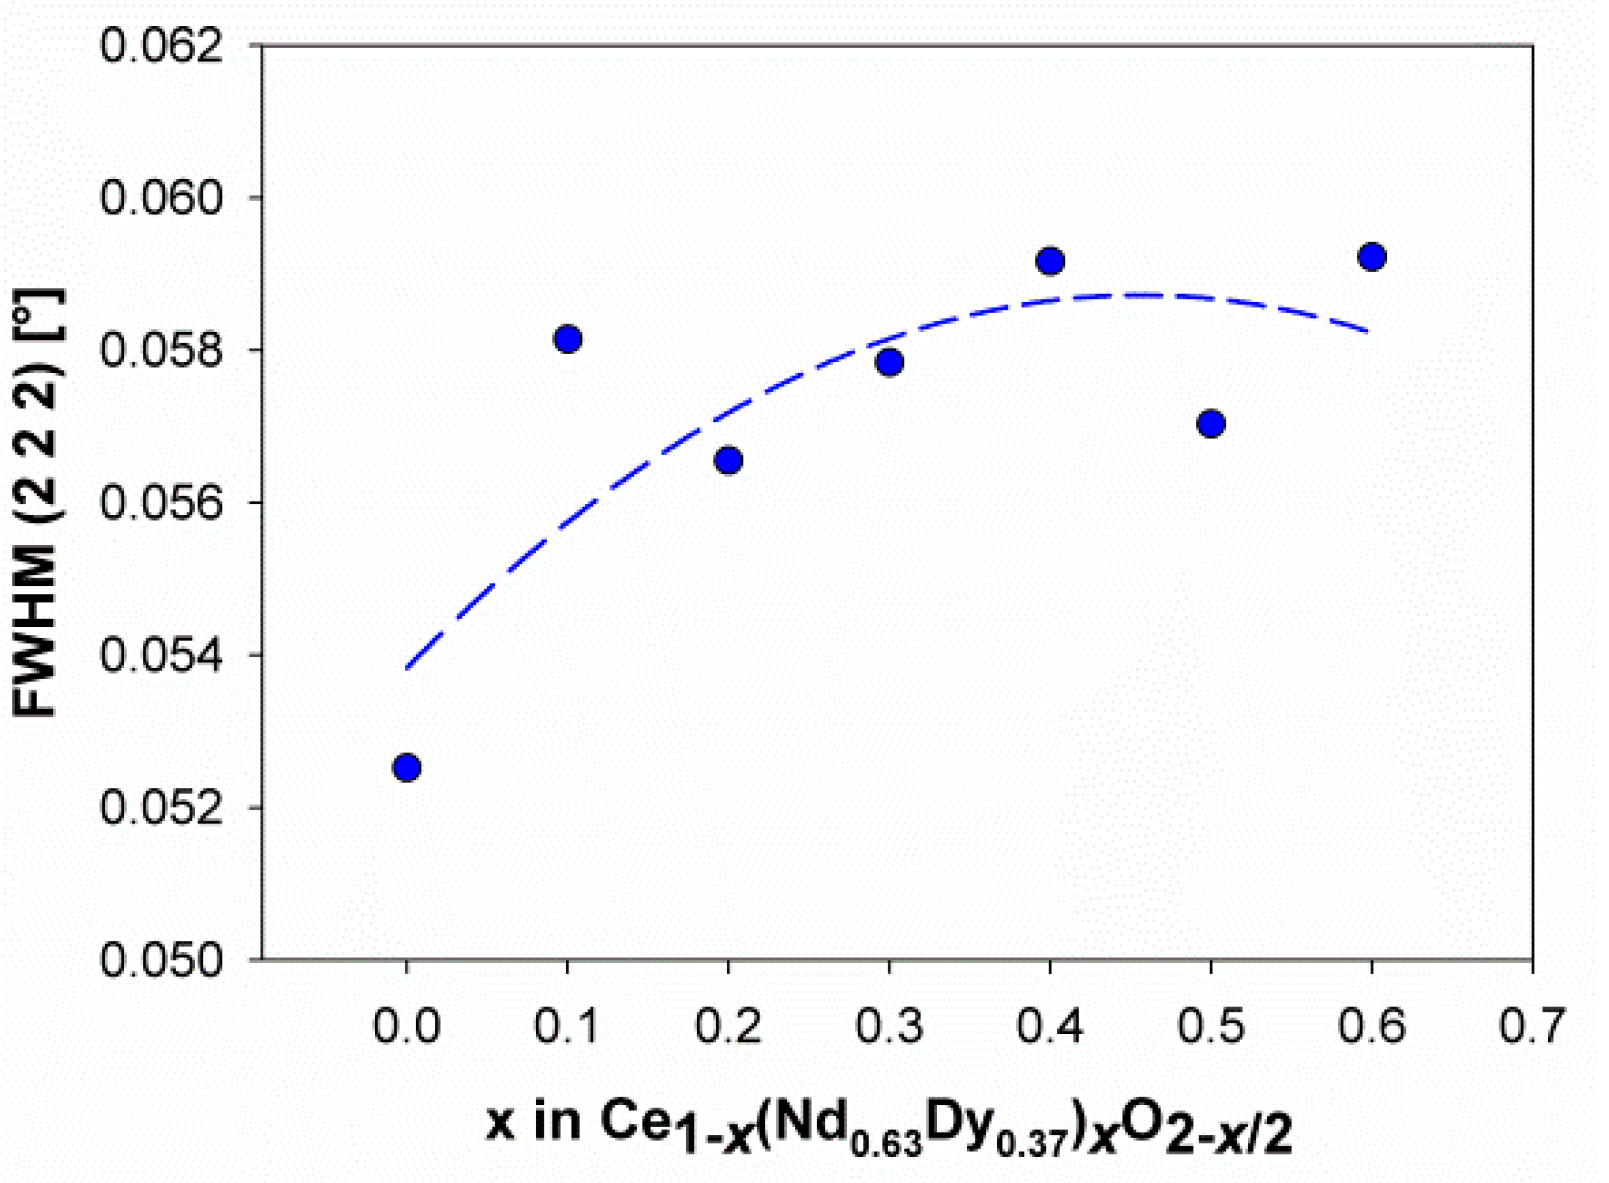
A further hint toward a change in the structural properties of the Nd/Dy-doped systems comes from the analysis of the full width at half maximum (FWHM) of the most intense structure peak. In Figure 6, reporting the previously mentioned parameter as a function of the Nd/Dy content, a progressive rise can be observed up to x = 0.4, which suggests a disorder increase taking place within the F phase by increasing the doping ion content. The strain effect brought about by the insertion of both doping ions results in a broadening of the peak, which grows until the F matrix tolerates the entrance into the structure of randomly located guests. The roughly constant FWHM value revealed at higher x, on the contrary, is fully compatible with the growth of C microdomains, which incorporate an increasing amount of vacancies by subtracting them from the F-based solid solution.

3. Discussion

The two main results derived from the experimental results previously described, namely the widening of the F compositional region and the increase of the cell parameter with respect to the Sm-doped system, lead to the conclusion that the (Nd0.63Dy0.37) mixture does not behave like the isodimensional Sm3+. On the contrary, it seems to mimic a larger ion. Doping by a larger ion causes not only—as expected—an increase in the cell parameter, but also a shift of the F limit toward higher x values, such as x = 0.4 and x = 0.6 for RE ≡ Nd3+ and La3+ [36], respectively. This phenomenon takes place for two main reasons: (a) the stability of the F and the C phase depend on the size resemblance of Ce4+ and RE3+ both with coordination number 8 (which rules F) and 6 (which rules H) (therefore, the actual extent of both phases is driven by the interplay of the Ce4+/RE3+ size similarity with both coordination numbers) [1], and (b) a larger atom more effectively counterbalances the creation of vacancies within F, which tend to shrink the lattice.
The reason why a lanthanide mixture mimics a larger ion is most likely the disorder effect caused by the presence of different doping ions, which partially hinders the maturation of C microdomains and, ultimately, makes the F phase more tolerant toward vacancies. This hypothesis is corroborated by the results of theoretical studies, which predicts a restraint in the growth of C clusters in co-doped systems [23].
The effect exerted by Nd/Dy co-doping on the lattice parameter is very unique as well, since results reported in the literature show different data depending on the system considered. The Ce1−xSmx/2 Ndx/2O2−x/2 system, for instance, is claimed to show a linear trend of the lattice parameter as a function of x, and this behavior is interpreted as the mark for a reduced attraction vacancy/dopant. This, consequently, leads to the observed inhibition of the C microdomains growth and the consequent higher ionic conductivity [29]. On the contrary, this is not the case of the Nd/Dy-doped system, which shows a nonlinear trend of the lattice parameter (see Figure 5), as expected for systems where the total atomic content is not kept constant with changing x. Nevertheless, even in this case, an enlargement of the F region is observed, as previously described.
The higher value of the cell parameter observed at each composition with respect to the Sm-doped system, seems to suggest that the lattice size is mainly driven by the larger of the two doping ions, rather than by the average ionic dimension. This result likely deals with the issue related to cation-vacancy association [1]. This is a very complicated item, which is primarily ruled by two factors including the stronger repulsion of vacancies by tetravalent Ce4+ rather than by the trivalent dopant(s), and the preference of smaller ions toward lower coordination numbers. In spite of the somehow contradictory results of EXAFS measurements, a general tendency is observed, consisting in the preferred association of vacancies to the first-neighbor site of dopants smaller than, and to the second-neighbor site of dopants larger than Gd3+ [37]. This conclusion is in good agreement with the work by Ye et al. [38], which, through a theoretical study, predict the first-neighbor location of vacancies in Yb-, Y-, and Dy-doped ceria and the second-neighbor one in systems containing larger doping ions, such as Gd3+ and Sm3+. A similar conclusion was also obtained by Zhang et al. [39], with reference to systems doped with ions going from Sm3+ to Tm3+.
The cell parameter of doped ceria is bound to the cation-vacancy association, since it is mainly determined by the size of the doping ion, which randomly enters the F matrix. Ions trapped into C clusters virtually do not affect the lattice size. The preferential association of vacancies to smaller rather than to larger ions provides a possible explanation for the observed discrepancy between the cell size of Sm- and of Nd/Dy-doped ceria, notwithstanding the identical average ionic radius.

4. Materials and Methods

4.1. Synthesis

Six compositions belonging to the Ce1−x(Nd0.63Dy0.37)xO2−x/2 system with nominal x = 0, 0.1, 0.2, 0.3, 0.4, 0.5, and 0.6 were synthesized by oxalates co-precipitation, as previously described [40,41]. The Nd/Dy ratio was chosen, so that the mean ionic size of the lanthanides mixture reproduces the one of Sm3+ [CN:8], i.e., the most efficient dopant for ceria in terms of ionic conductivity. Stoichiometric amounts of Ce (Johnson Matthey ALPHA 99.99% wt.), Nd2O3, and Dy2O3 were separately dissolved in HCl (13% vol.). Mixing of the two solutions followed. Afterward, the precipitation of the mixed Ce/Nd/Dy oxalate was accomplished by adding a solution of oxalic acid in large excess. Oxalates were then filtered, washed, dried for 12 h, and, subsequently, thermally treated at 1373 K in air for four days to obtain the mixed oxides. Samples are named NdDy10, NdDy20, and so on, according to the nominal (Nd,Dy) atomic percent with respect to the total rare earth’s content.

4.2. Scanning Electron Microscopy–Energy-Dispersive System (SEM-EDS)

Scanning electron microscopy with field emission gun and energy-dispersive system (FE-SEM-EDS, Zeiss SUPRA 40 VP-30-51 scanning electron microscope, equipped with a high sensitivity “InLens” secondary electron detector, and an EDS microanalysis INCA Suite Version 4.09, Oxford Instruments, Abingdon-on-Thames, UK) was employed to check the overall rare earth content of all the samples. Pellets of pressed powders were coated by a graphite layer and analyzed at a working distance of 15 mm, with acceleration voltage 20 kV. EDS analyses were carried out on at least four points for each sample.

4.3. Synchrotron X-Ray Powder Diffraction

Room temperature diffraction patterns of all the samples were collected at the powder diffraction beamline (MCX) at Elettra synchrotron radiation facility located in Trieste, Italy, by a Huber 4-axes X-ray diffractometer equipped with a fast scintillator detector. Specimens were placed in borosilicate capillary tubes with inner diameter of 0.5 mm, and rotated at a speed of 180 rpm. Acquisitions were done in the angular range 5° ≤ 2θ ≤ 55° with step 0.01°, counting time 1 s, with the incident beam energy set at 18 keV.
The FullProf suite [42] was used to refine structural models by the Rietveld method.

5. Conclusions

A crystallographic investigation was performed by powder synchrotron X-ray diffraction on several samples belonging to the Ce1−x(Nd0.63Dy0.37)xO2−x/2 system with the aim to study the effect of the substitution of Sm3+ by a mixture of a larger and a smaller rare earth ion providing an average ionic radius very close to the ionic radius of Sm3+. The idea underlying this work is that co-doping is expected to enhance the ionic conductivity of the system by inhibiting the C clusters’ growth.
Two main findings were revealed: with respect to Sm-doped ceria, (a) the compositional extent of the CeO2-based solid solution widens, and (b) the cell parameter is larger at each composition. These data suggest that the (Nd0.63Dy0.37) mixture acts as a larger ion with respect to Sm3+. The former observation can find an explanation invoking the disorder increase caused by the contemporary presence of two different doping ions, which hinders the growth of the C-structured microdomains. The latter is ascribed to the preference of vacancies toward association with the first-neighbor site of doping ions smaller than Gd3+, which, in the present case, translates into a preferred association of vacancies with Dy3+ rather than with Nd3+. This effect tends to subtract the smaller doping ion (Dy3+) from the CeO2-based solid solution, with the larger ion (Nd3+), consequently, exerting a stronger effect on the cell size. The inhibition of the C microdomains maturation is a positive precondition for obtaining high values of ionic conductivity.

Supplementary Materials

The following are available online at https://www.mdpi.com/2304-6740/7/8/94/s1, Table S1: Hybrid structural model compared to the F structure typical of CeO2 and the C structure typical of sesquioxides of heavy rare earths.

Author Contributions

Conceptualization, C.A. and M.P. Investigation, L.G., M.M.C., and M.P. Writing—original draft, C.A. Writing—review & editing, C.A., L.G., M.M.C., and M.P.

Funding

This research received no external funding.

Acknowledgments

Anna Fois is acknowledged for the preliminary data treatment.

Conflicts of Interest

The authors declare no conflict of interest.

References

  1. Artini, C. RE-doped ceria systems and their performance as solid electrolytes: A puzzling tangle of structural issues at the average and local scale. Inorg. Chem. 2018, 57, 13047–13062. [Google Scholar] [CrossRef] [PubMed]
  2. Steele, B.C.H. Appraisal of Ce1−yGdyO2−y/2 electrolytes for IT-SOFC operation at 500 °C. Solid State Ion. 2000, 129, 95–110. [Google Scholar] [CrossRef]
  3. Presto, S.; Artini, C.; Pani, M.; Carnasciali, M.M.; Massardo, S.; Viviani, M. Ionic conductivity and local structural features in Ce1−xSmxO2−x/2. Phys. Chem. Chem. Phys. 2018, 20, 28338–28345. [Google Scholar] [CrossRef] [PubMed]
  4. Coduri, M.; Scavini, M.; Pani, M.; Carnasciali, M.M.; Klein, H.; Artini, C. From nano to microcrystals: Effect of different synthetic pathways on defects architecture in heavily Gd-doped ceria. Phys. Chem. Chem. Phys. 2017, 19, 11612–11630. [Google Scholar] [CrossRef] [PubMed]
  5. Kraynis, O.; Timoshenko, J.; Huang, J.; Singh, H.; Wachtel, E.; Frenkel, A.I.; Lubomirsky, I. Modeling strain distribution at the atomic level in doped ceria films with extended X-ray absorption fine structure spectroscopy. Inorg. Chem. 2019, 58, 7527–7536. [Google Scholar] [CrossRef] [PubMed]
  6. Artini, C.; Carnasciali, M.M.; Costa, G.A.; Plaisier, J.R.; Pani, M. A novel method for the evaluation of the Rare Earth (RE) coordination number in RE-doped ceria through Raman spectroscopy. Solid State Ion. 2017, 311, 90–97. [Google Scholar] [CrossRef]
  7. Artini, C.; Costa, G.A.; Pani, M.; Lausi, A.; Plaisier, J. Structural characterization of the CeO2/Gd2O3 mixed system by synchrotron X-ray diffraction. J. Solid State Chem. 2012, 190, 24–28. [Google Scholar] [CrossRef]
  8. Artini, C.; Pani, M.; Carnasciali, M.M.; Buscaglia, M.T.; Plaisier, J.; Costa, G.A. Structural features of Sm- and Gd-doped ceria studied by synchrotron X-ray diffraction and μ-Raman spectroscopy. Inorg. Chem. 2015, 54, 4126–4137. [Google Scholar] [CrossRef] [PubMed]
  9. Artini, C.; Joseph, B.; Costa, G.A.; Pani, M. Crystallographic properties of Lu-doped ceria, Ce1−xLuxO2−x/2, at pressures up to 7 GPa. Solid State Ion. 2018, 320, 152–158. [Google Scholar] [CrossRef]
  10. Artini, C.; Pani, M.; Carnasciali, M.M.; Plaisier, J.R.; Costa, G.A. Lu-, Sm- and Gd-doped ceria: A comparative approach to their structural properties. Inorg. Chem. 2016, 55, 10567–10579. [Google Scholar] [CrossRef]
  11. Artini, C.; Pani, M.; Lausi, A.; Masini, R.; Costa, G.A. High temperature structural study of Gd-doped ceria by synchrotron X-ray diffraction (673 K ≤ T ≤ 1073 K). Inorg. Chem. 2014, 53, 10140–10149. [Google Scholar] [CrossRef] [PubMed]
  12. Artini, C.; Carnasciali, M.M.; Viviani, M.; Presto, S.; Plaisier, J.R.; Costa, G.A.; Pani, M. Structural properties of Sm-doped ceria electrolytes at the fuel cell operating temperatures. Solid State Ion. 2018, 315, 85–91. [Google Scholar] [CrossRef]
  13. Artini, C.; Nelli, I.; Pani, M.; Costa, G.A.; Caratto, V.; Locardi, F. Thermal decomposition of Ce-Sm and Ce-Lu mixed oxalates: Influence of the Sm- and Lu-doped ceria structure. Thermochimica Acta 2017, 651, 100–107. [Google Scholar] [CrossRef]
  14. Scavini, M.; Coduri, M.; Allieta, M.; Brunelli, M.; Ferrero, C. Probing complex disorder in Ce1−xGdxO2−x/2 using the pair distribution function analysis. Chem. Mater. 2012, 24, 1338–1345. [Google Scholar] [CrossRef]
  15. Coduri, M.; Masala, P.; Allieta, M.; Peral, I.; Brunelli, M.; Biffi, C.A.; Scavini, M. Phase transformations in the CeO2-Sm2O3 system: A multiscale powder diffraction investigation. Inorg. Chem. 2018, 57, 879–891. [Google Scholar] [CrossRef]
  16. Kuharuangrong, S. Ionic conductivity of Sm, Gd, Dy- and Er-doped ceria. J. Power Sources 2007, 171, 506–510. [Google Scholar] [CrossRef]
  17. Omar, S.; Wachsman, E.D.; Jones, J.L.; Nino, J.C. Crystal structure-ionic conductivity relationships in doped ceria. J. Am. Ceram. Soc. 2009, 92, 2674–2681. [Google Scholar] [CrossRef]
  18. Pandiyan, A.; Rajagopalan, R.; Hassan Tanveer, W.; Yu, W.; Cha, S.W.; Krishna Moorthy, S.B. Scalable lattice-strain in preferentially oriented acceptor-doped ceria oxide film and its impact on oxygen ion transport kinetics. Electrochem. Acta 2018, 264, 203–215. [Google Scholar] [CrossRef]
  19. Bhabu, K.A.; Theertagiri, J.; Madhavan, J.; Balu, T.; Rajasekaran, T.R. Superior oxide ion conductivity of novel acceptor doped cerium oxide electrolytes for intermediate-temperature solid oxide fuel cell applications. J. Phys. Chem. C 2016, 120, 18452–18461. [Google Scholar] [CrossRef]
  20. Shannon, R.D. Revised effective ionic radii and systematic studies of interatomic distances in halides and chalcogenides. Acta Cryst. 1976, A32, 751–767. [Google Scholar] [CrossRef]
  21. Dell’Agli, G.; Spiridigliozzi, L.; Pansini, M.; Accardo, G.; Yoon, S.P.; Frattini, D. Effect of the carbonate environment on morphology and sintering behaviour of variously co-doped (Ca, Sr, Er, Pr) Samarium-doped ceria in co-precipitation/hydrothermal synthesis. Ceram. Int. 2018, 44, 17935–17944. [Google Scholar] [CrossRef]
  22. Van Herle, J.; Seneviratne, D.; Mc Evoy, A.J. Lanthanide co-doping of solid electrolytes: AC conductivity behaviour. J. Eur. Ceram. Soc. 1999, 19, 837–841. [Google Scholar] [CrossRef]
  23. Ou, D.R.; Ye, F.; Mori, T. Defect clustering and local ordering in rare earth co-doped ceria. Phys. Chem. Chem. Phys. 2011, 13, 9554–9560. [Google Scholar] [CrossRef] [PubMed]
  24. Burbano, M.; Nadin, S.; Marrocchelli, D.; Salanne, M.; Watson, G.M. Ceria co-doping: Synergistic or average effect? Phys. Chem. Chem. Phys. 2014, 16, 8320–8331. [Google Scholar] [CrossRef] [PubMed]
  25. Zayąc, W.; Molenda, J. Electrical conductivity of doubly doped ceria. Solid State Ion. 2008, 179, 154–158. [Google Scholar]
  26. Kim, N.; Kim, B.H.; Lee, D. Effect of co-dopant addition on properties of gadolinia-doped ceria electrolyte. J. Power Sources 2000, 90, 139–143. [Google Scholar] [CrossRef]
  27. Coles-Aldridge, A.V.; Baker, R.T. Ionic conductivity in multiply substituted ceria-based electrolytes. Solid State Ion. 2018, 316, 9–19. [Google Scholar] [CrossRef] [Green Version]
  28. Gupta, M.; Shirbhate, S.; Ojha, P.; Acharya, S. Processing and conductivity behavior of La, Sm, Fe singly and double doped ceria: As electrolytes for IT-SOFC. Solid State Ion. 2018, 320, 199–209. [Google Scholar] [CrossRef]
  29. Omar, S.; Wachsman, E.; Nino, J. Higher conductivity Sm3+ and Nd3+ co-doped ceria-based electrolyte materials. Solid State Ion. 2008, 178, 1890–1897. [Google Scholar] [CrossRef]
  30. Arabaci, A.; Altınçekiç, T.G.; Der, M.; Öksüzömer, M.A.F. Preparation and properties of ceramic electrolytes in the Nd and Gd Co-doped ceria systems prepared by polyol method. J. Alloy Compd. 2019, 792, 1141–1149. [Google Scholar] [CrossRef]
  31. Babu, A.S.; Bauri, R. Rare earth co-doped nanocrystalline ceria eletrolytes for intermediate temperature solid oxide fuel cells (IT-SOFC). ECS Trans. 2013, 57, 1115–1123. [Google Scholar] [CrossRef]
  32. Arabaci, A. Synthesis and characterization of Pr/Gd co-doped ceria by using the citric acid–nitrate combustion method. Solid State Ion. 2018, 326, 69–76. [Google Scholar] [CrossRef]
  33. Arabaci, A.; Sariboğa, V.; Őksüzőmer, M.A.F. Er and Gd co-doped ceria-based electrolyte materials for IT-SOFCs prepared by the cellulose-templating method. Met. Mater. Trans. A 2014, 45, 5259–5269. [Google Scholar] [CrossRef]
  34. Madhuri, C.; Venkataramana, K.; Nurhayati, A.; Vishnuvardhan Reddy, C. Effect of La3+ and Pr3+ co-doping on structural, thermal and electrical properties of ceria ceramics as solid electrolytes for IT-SOFC applications. Curr. Appl. Phys. 2018, 18, 1134–1142. [Google Scholar] [CrossRef]
  35. Venkataramana, K.; Madhuri, C.; Madhusudan, C.; Suresh Reddy, Y.; Bhikshamaiah, G.; Vishnuvardhan Reddy, C. Investigation on La3+ and Dy3+ co-doped ceria ceramics with an optimized average atomic number of dopants for electrolytes in IT-SOFCs. Ceram. Int. 2018, 44, 6300–6310. [Google Scholar] [CrossRef]
  36. Horlait, D.; Claparède, L.; Clavier, N.; Szencnekt, S.; Dacheux, N.; Ravaux, J.; Podor, R. Stability and structural evolution of CeIV1−xLnIIIxO2−x/2 solid solutions: A coupled μ-Raman/XRD approach. Inorg. Chem. 2011, 50, 150–161. [Google Scholar] [CrossRef] [PubMed]
  37. Minervini, L.; Zacate, M.O.; Grimes, R.W. Defect cluster formation in M2O3-doped CeO2. Solid State Ion. 1999, 116, 339–349. [Google Scholar] [CrossRef]
  38. Ye, F.; Mori, T.; Ou, D.R.; Cormack, A.N. Dopant type dependency of domain development in rare earth-doped ceria: An explanation by computer simulation of defect clusters. Solid State Ion. 2009, 180, 1127–1132. [Google Scholar] [CrossRef]
  39. Zhang, L.; Meng, J.; Yao, F.; Zhang, W.; Liu, X.; Meng, J.; Zhang, H. Insight into the Mechanism of the Ionic Conductivity for Ln-Doped Ceria (Ln = La, Pr, Nd, Pm, Sm, Gd, Tb, Dy, Ho, Er, and Tm) through First-Principles Calculation. Inorg. Chem. 2018, 57, 12690–12696. [Google Scholar] [CrossRef] [PubMed]
  40. Artini, C.; Costa, G.A.; Carnasciali, M.M.; Masini, R. Stability fields and structural properties of intra rare earths perovskites. J. Alloy Compd. 2010, 494, 336–339. [Google Scholar] [CrossRef]
  41. Artini, C.; Costa, G.A.; Masini, R. Study of the formation temperature of mixed LaREO3 (RE≡Dy, Ho, Er, Tm, Yb, Lu) and NdGdO3 oxides. J. Anal. Calorim. 2011, 103, 17–21. [Google Scholar] [CrossRef]
  42. Rodriguez-Carvajal, J. Recent advances in magnetic structure determination by neutron powder diffraction. Phys. B Condens. Matter 1993, 192, 55–69. [Google Scholar] [CrossRef]
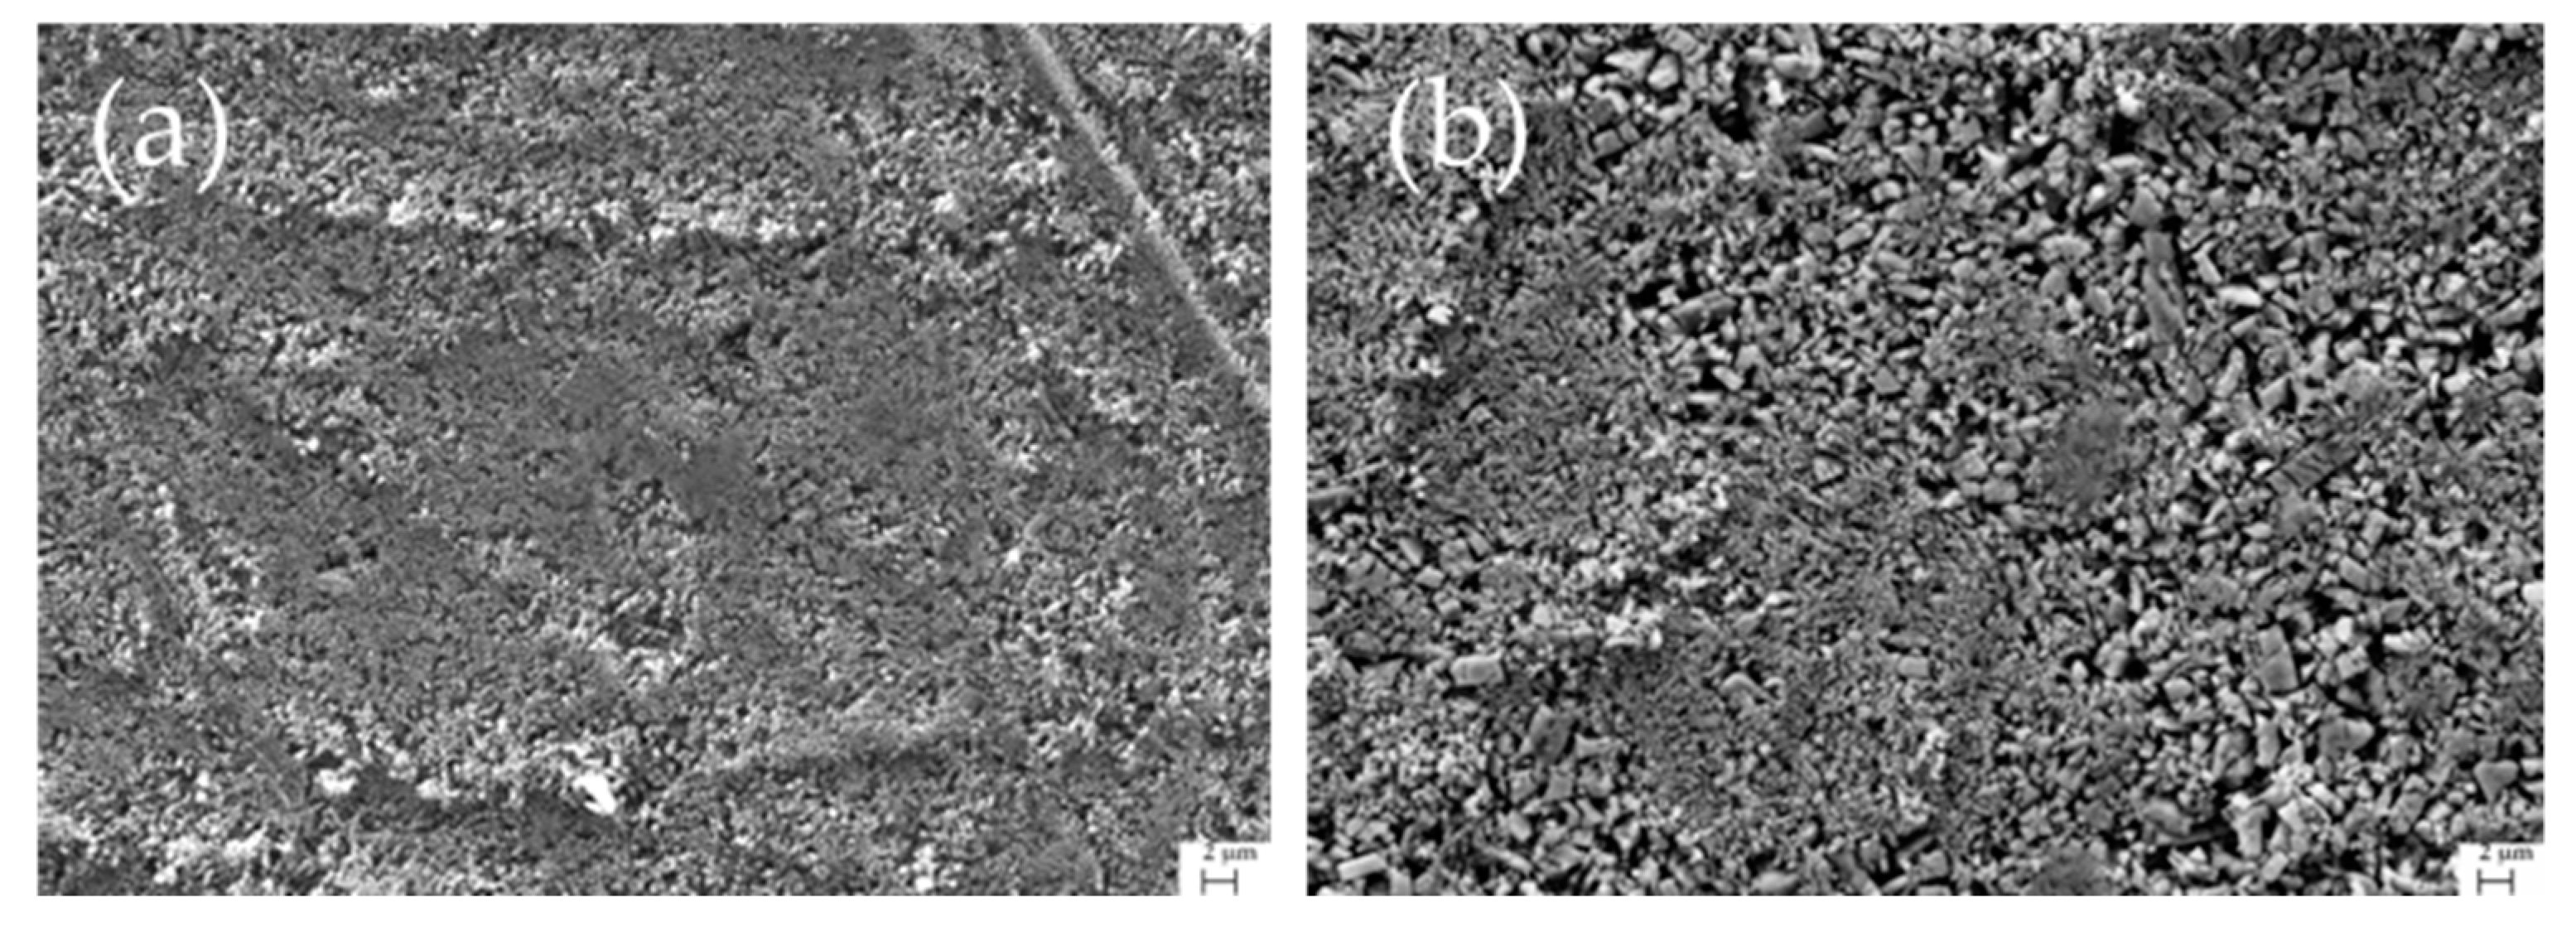
Figure 1. SEM microphotographs taken by backscattered electrons on the surface of pellets of sample (a) NdDy20 and (b) NdDy60.
Inorganics 07 00094 g001
Figure 2. Rietveld refinement plot of sample NdDy20. The dotted (red) and the continuous (black) lines are the experimental and the calculated diffraction pattern, respectively. The lower line is the difference curve, and vertical bars show the calculated positions of Bragg peaks.
Inorganics 07 00094 g002
Figure 3. Diffraction patterns of (a) NdDy40 and NdDy50 samples and (b) sample Ce0.6Sm0.4O1.8 [8]. Arrows indicate the presence of superstructure peaks, with an enlarged view between 14° and 21°. In (a) Miller indices of peaks belonging to the F phase are reported within the diffraction pattern of NdDy40.
Inorganics 07 00094 g003
Figure 4. Trend of the RE1 x position in the Nd/Dy- and Sm-doped systems. Data of Sm are taken from Reference [8]. Error bars are sometimes hidden by data markers. Dotted lines are regression lines fitting data within the F and the H region. The vertical dashed lines approximately indicate the position of the F/H transition.
Inorganics 07 00094 g004
Figure 5. Trend of the lattice parameter of the Nd/Dy- and Sm-doped systems as a function of the doping ion(s) content. Data of Sm are taken from Reference [8]. Error bars are hidden by data markers. Data are fitted by second order polynomial functions.
Inorganics 07 00094 g005
Figure 6. FWHM values of the most intense structure peak as a function of the Nd/Dy content. The dashed line is a second order polynomial function fitting experimental data.
Inorganics 07 00094 g006
Table 1. Values of x in Ce1−x(Nd0.63Dy0.37)xO2−x/2 resulting from EDS, and Rietveld agreement factors.
Sample NamexRB aχ2 b
NdDy100.09(1)2.271.70
NdDy200.19(2)1.811.80
NdDy300.29(7)2.551.73
NdDy400.37(6)2.741.73
NdDy500.47(9)9.731.45
NdDy600.58(5)9.792.73
a R B = k | I k , o b s I k , c a l c | k | I k , o b s | ; b χ 2 = ( R w p R e x p ) 2