
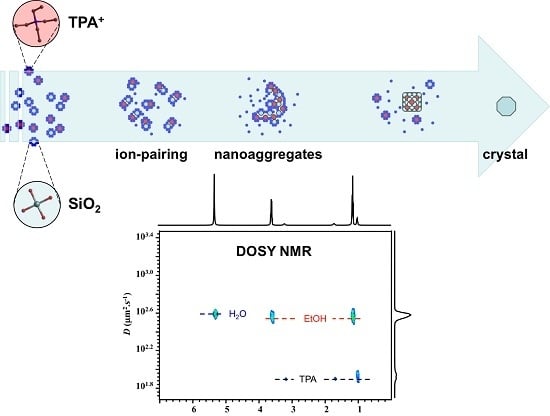
Tetrapropylammonium Occlusion in Nanoaggregates of Precursor of Silicalite-1 Zeolite Studied by 1H and 13C NMR


Abstract
:
1. Introduction
2. Results and Discussion
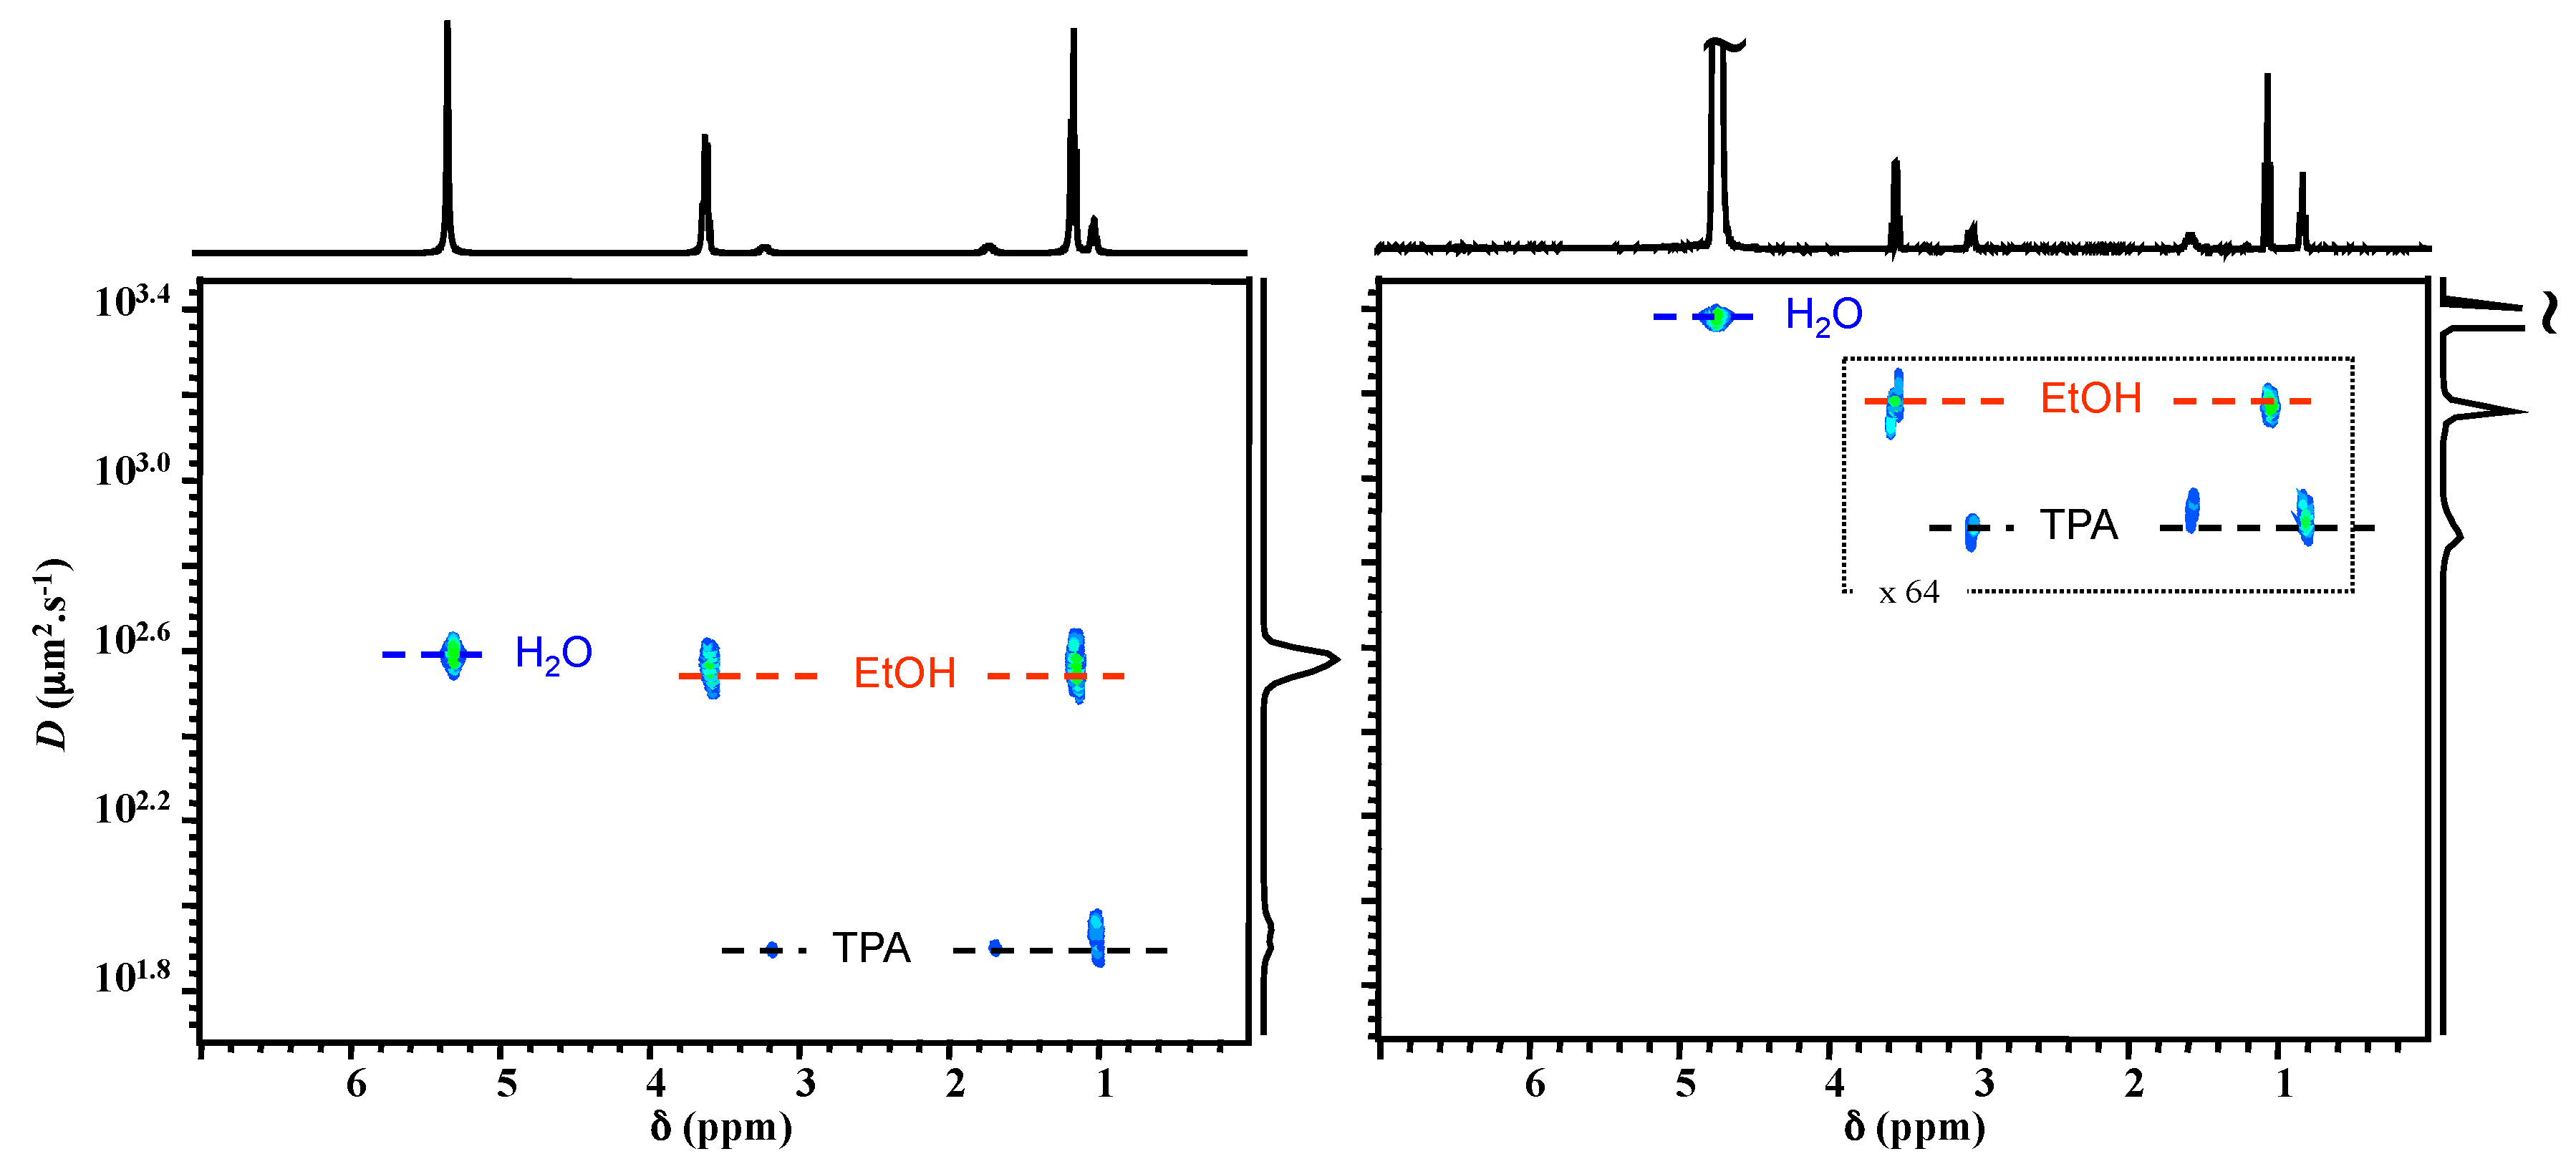
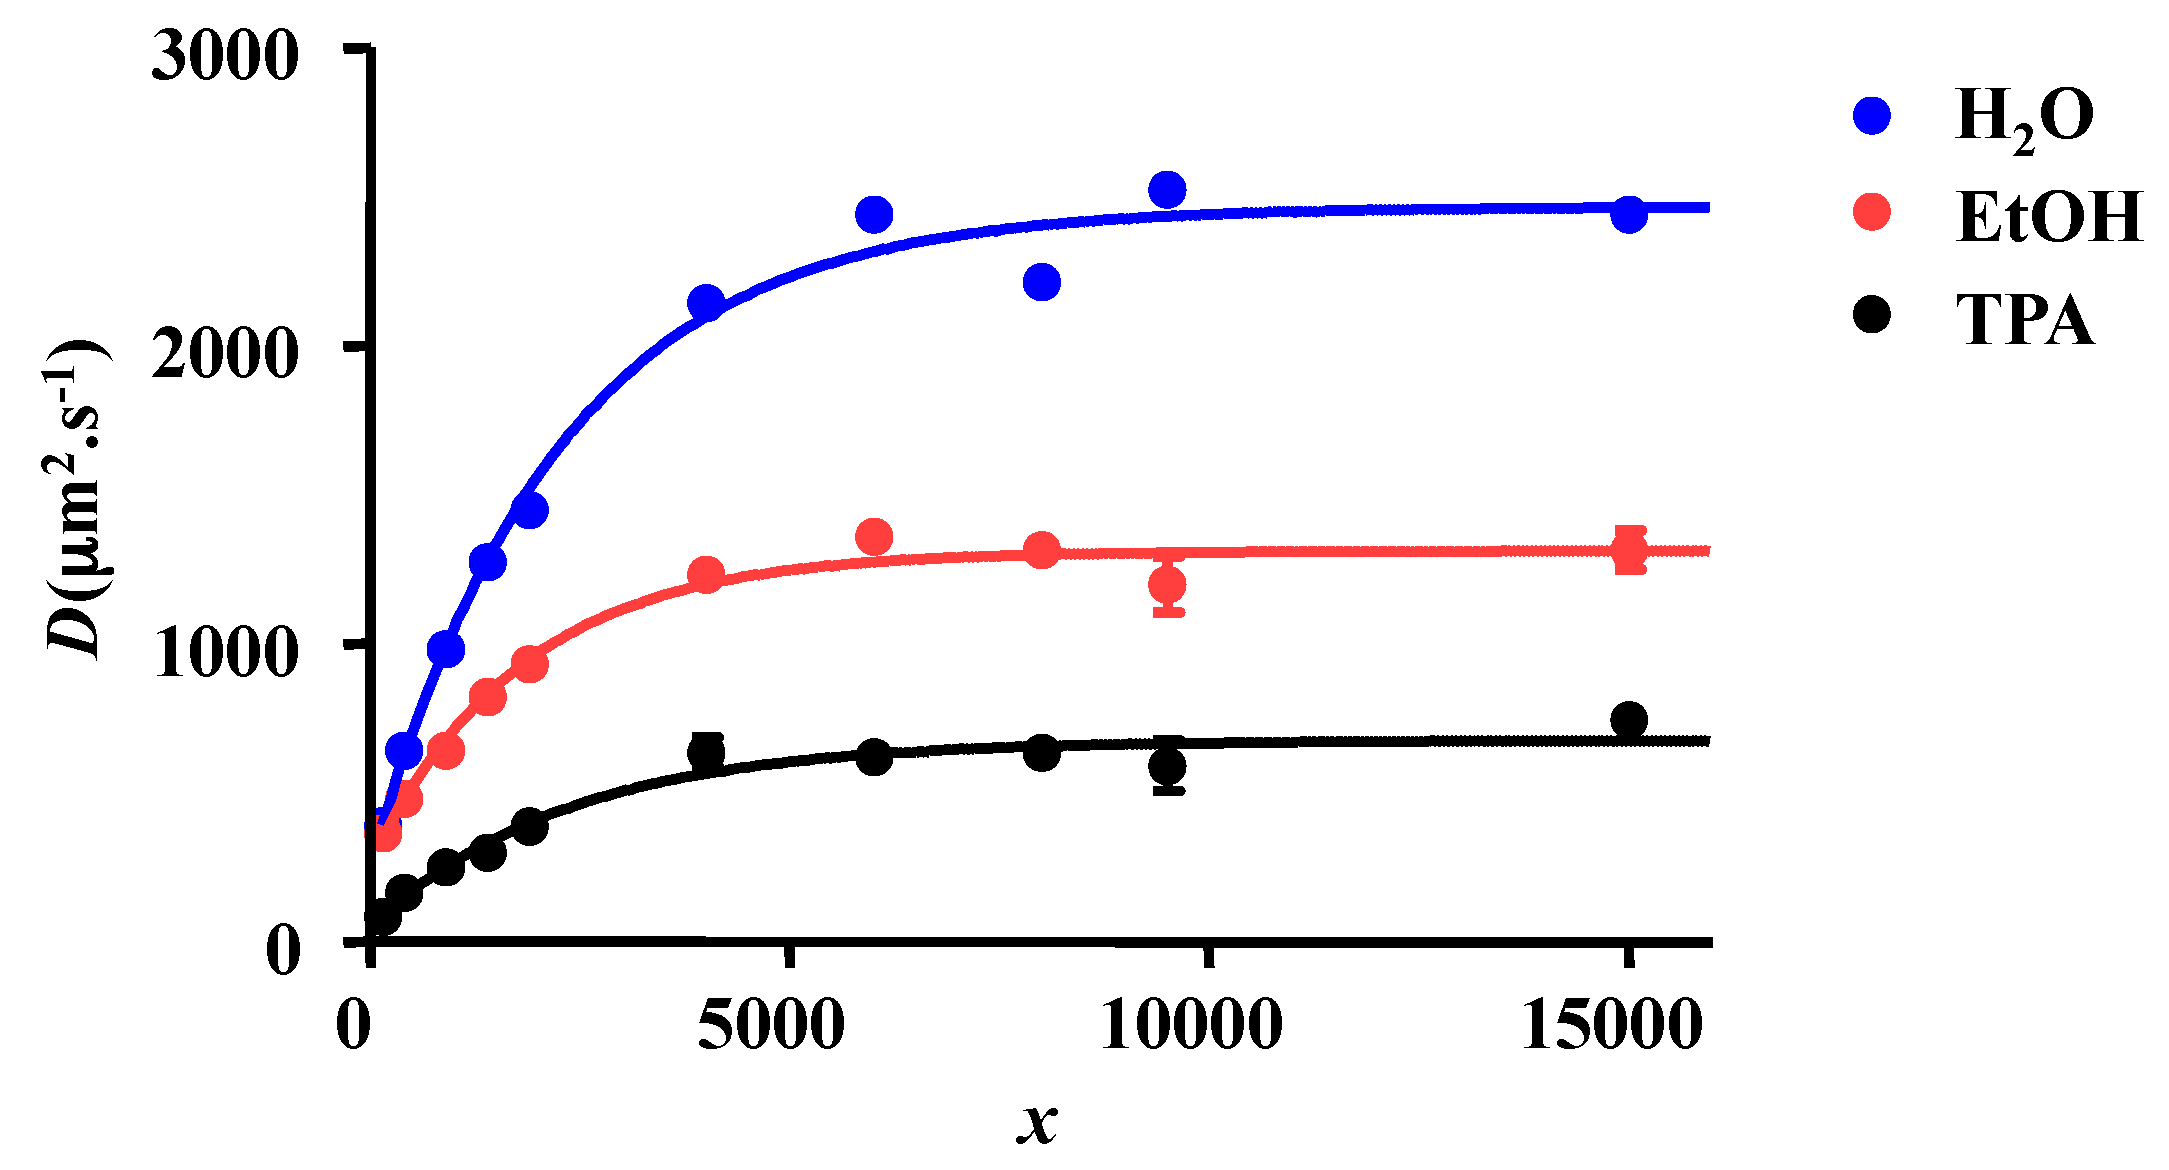
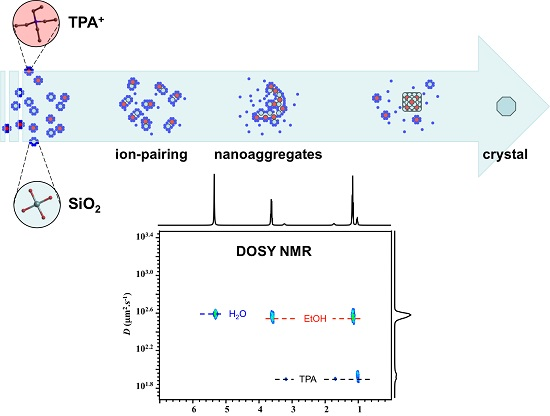
2.1. 1H NMR DOSY
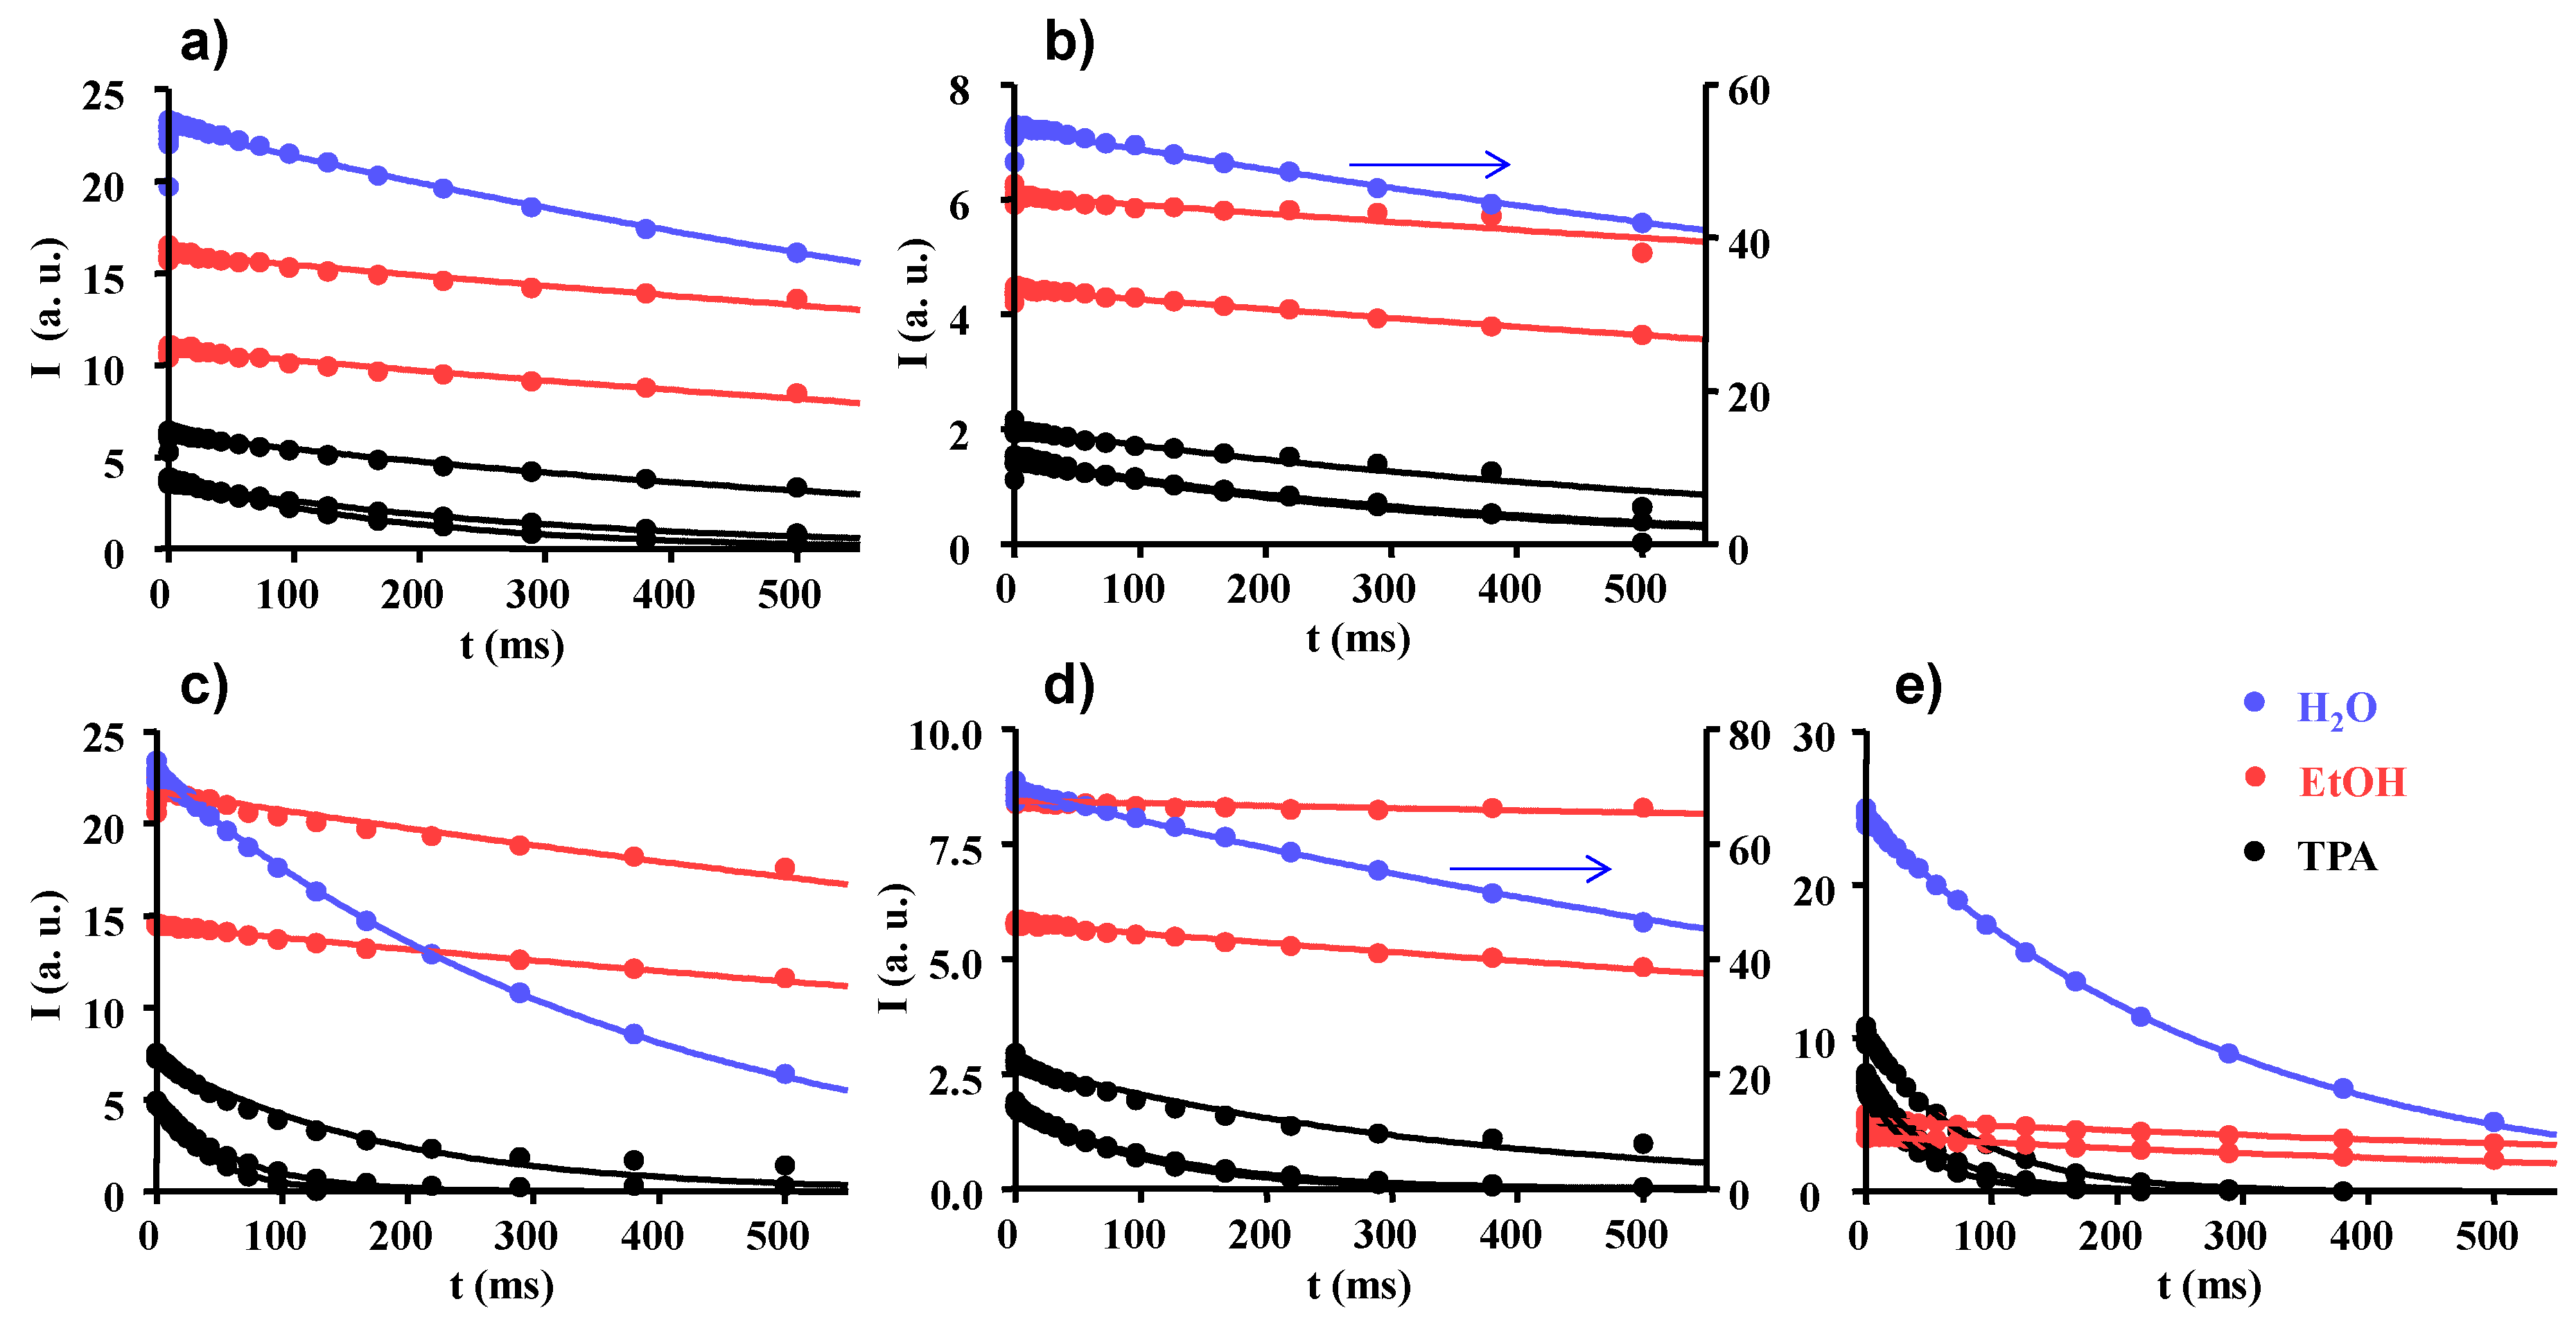
2.2. Longitudinal and Transverse 1H NMR Relaxations
2.3. Proton Spin-Lattice Relaxation in the Rotating Frame
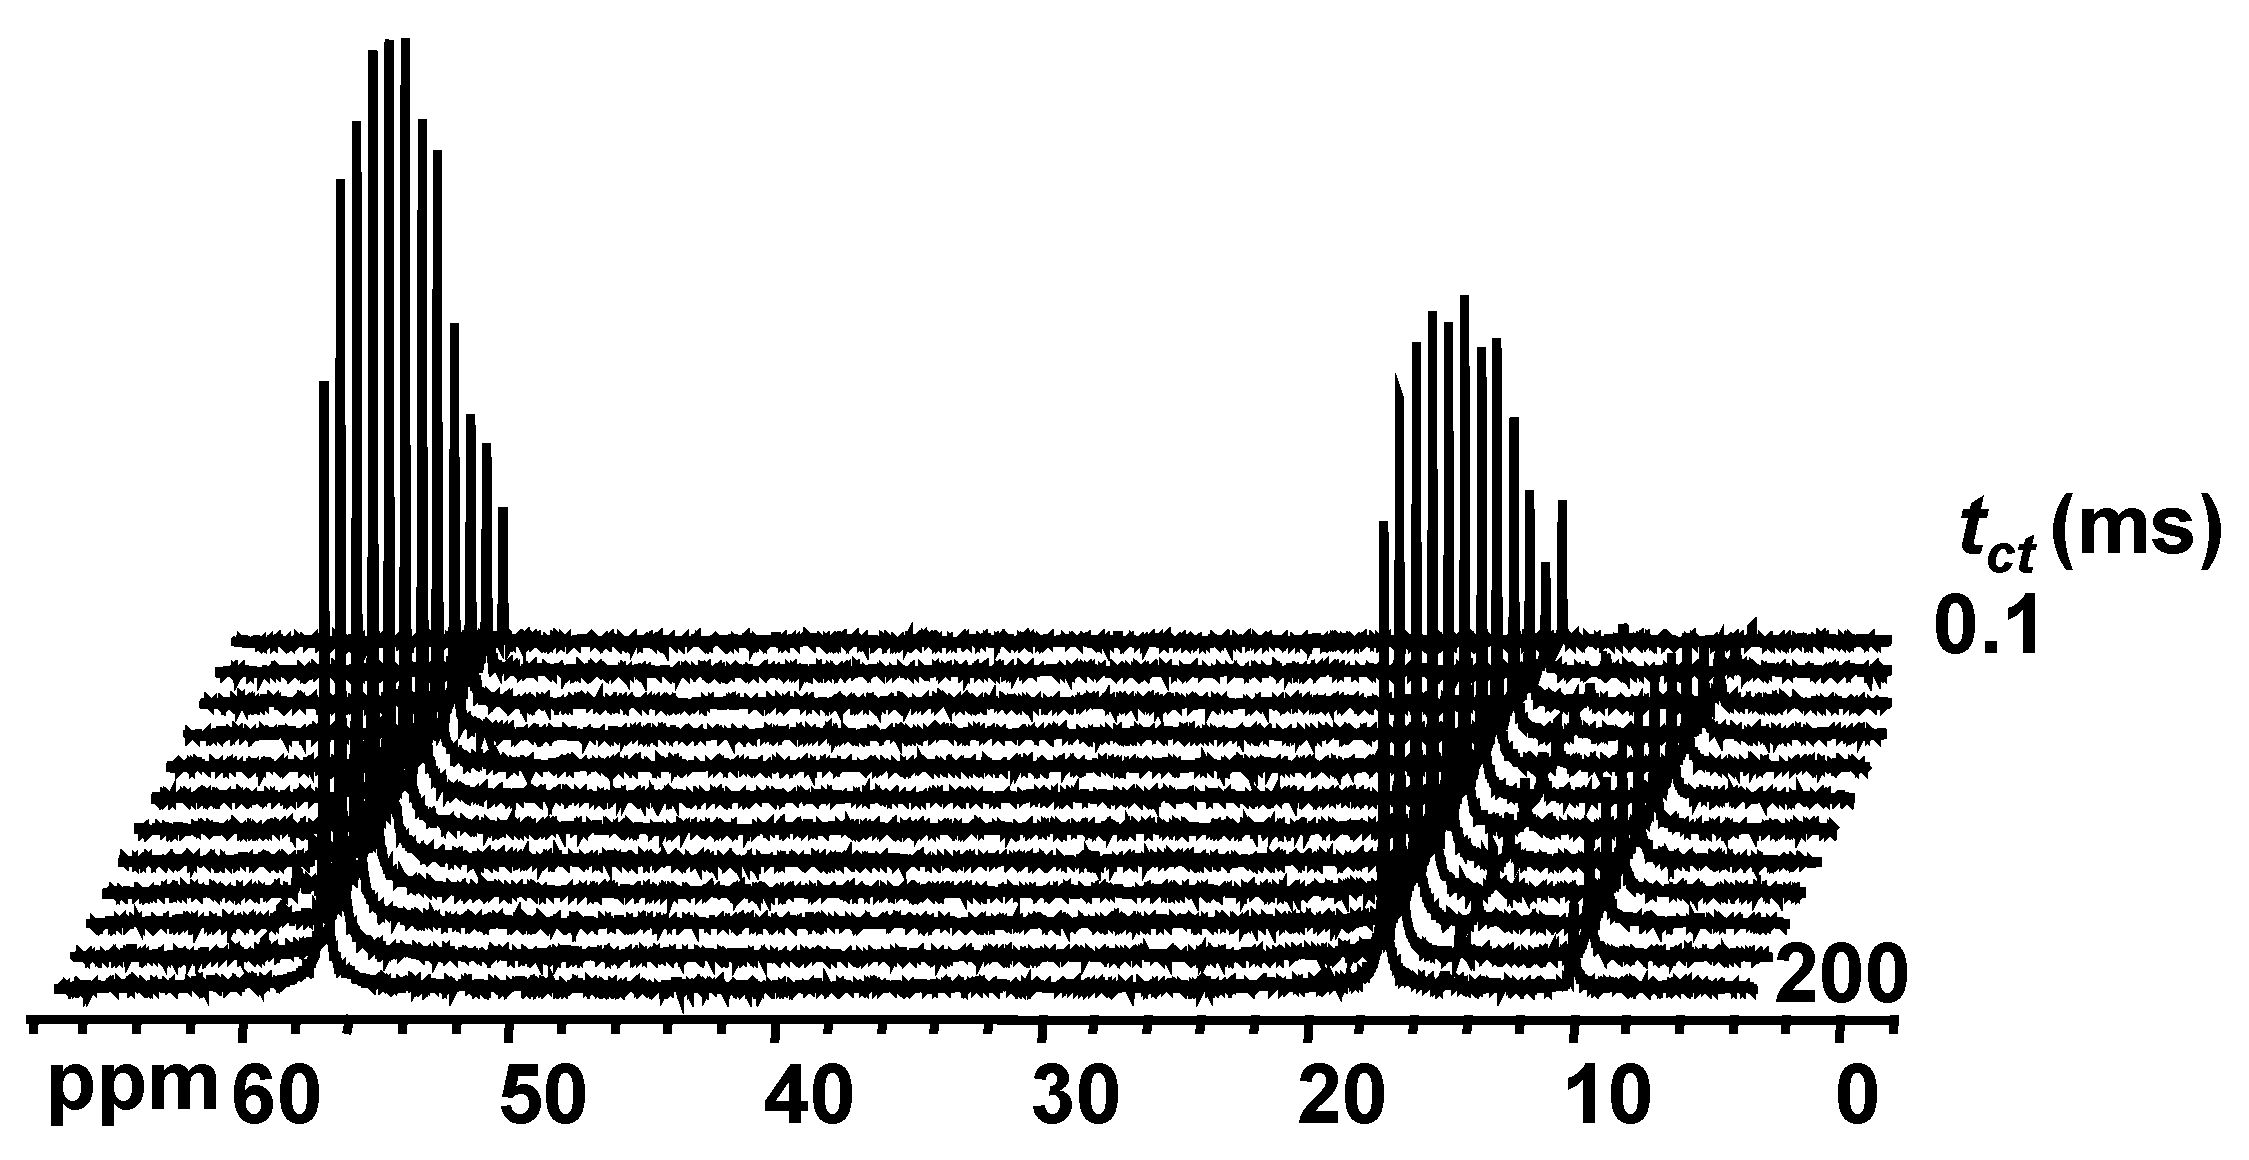
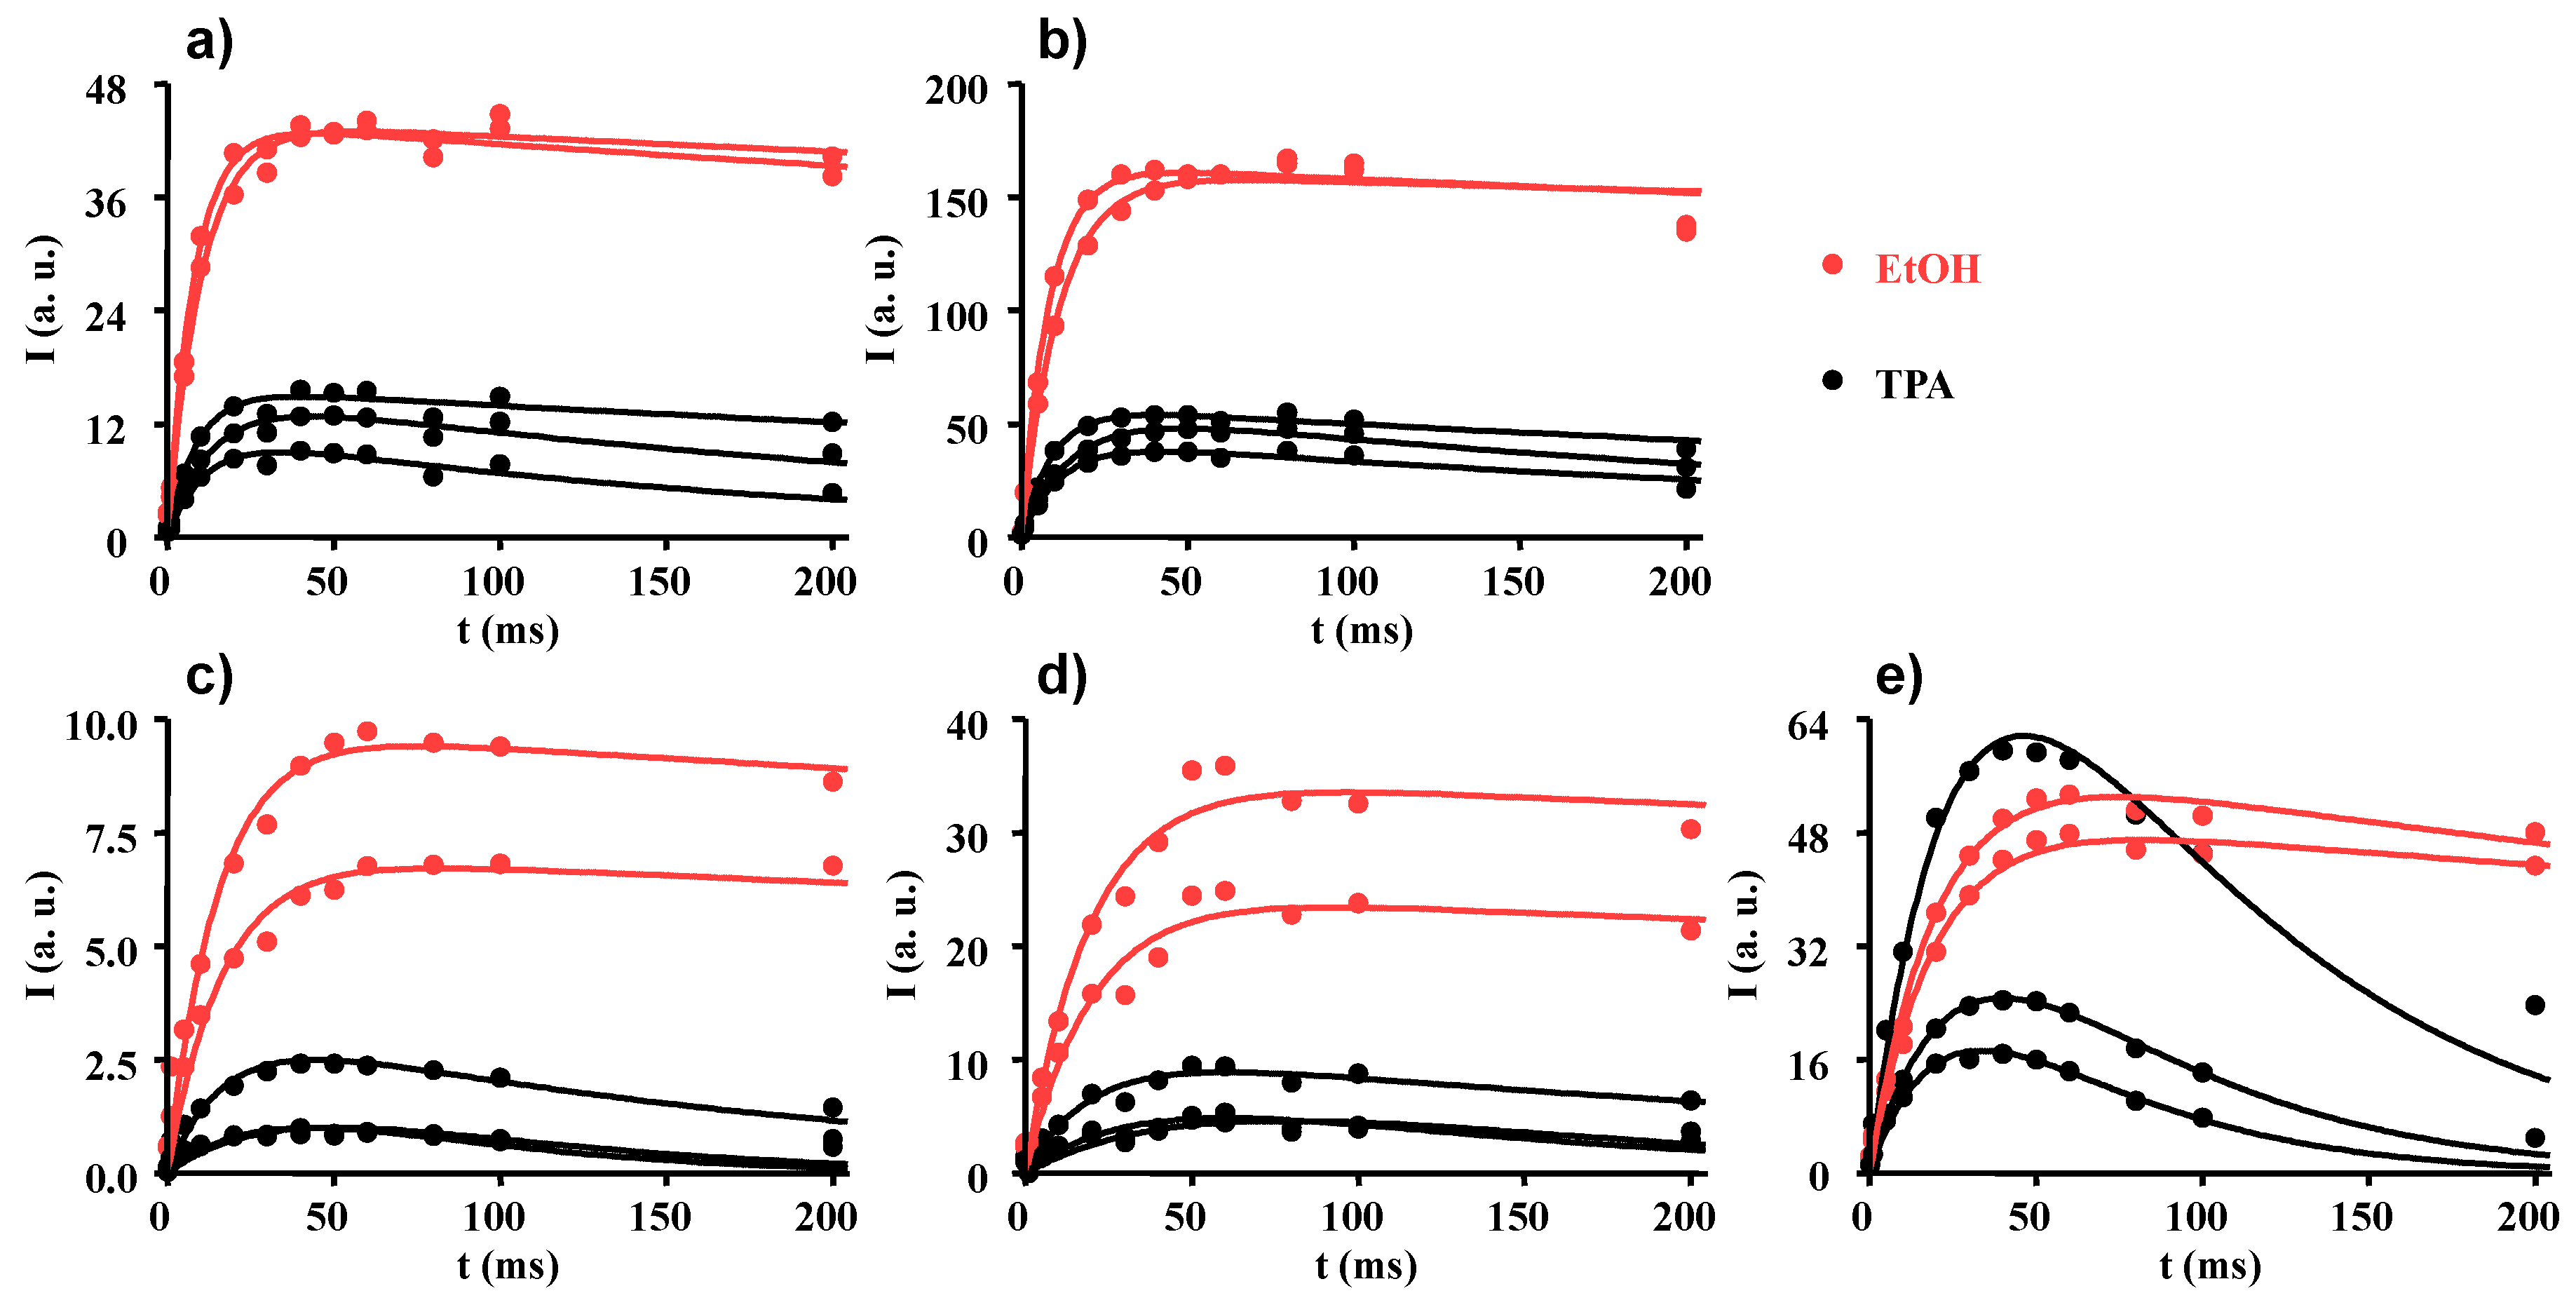
2.4. Proton to Carbon Cross-Polarization
3. Materials and Methods
3.1. Materials
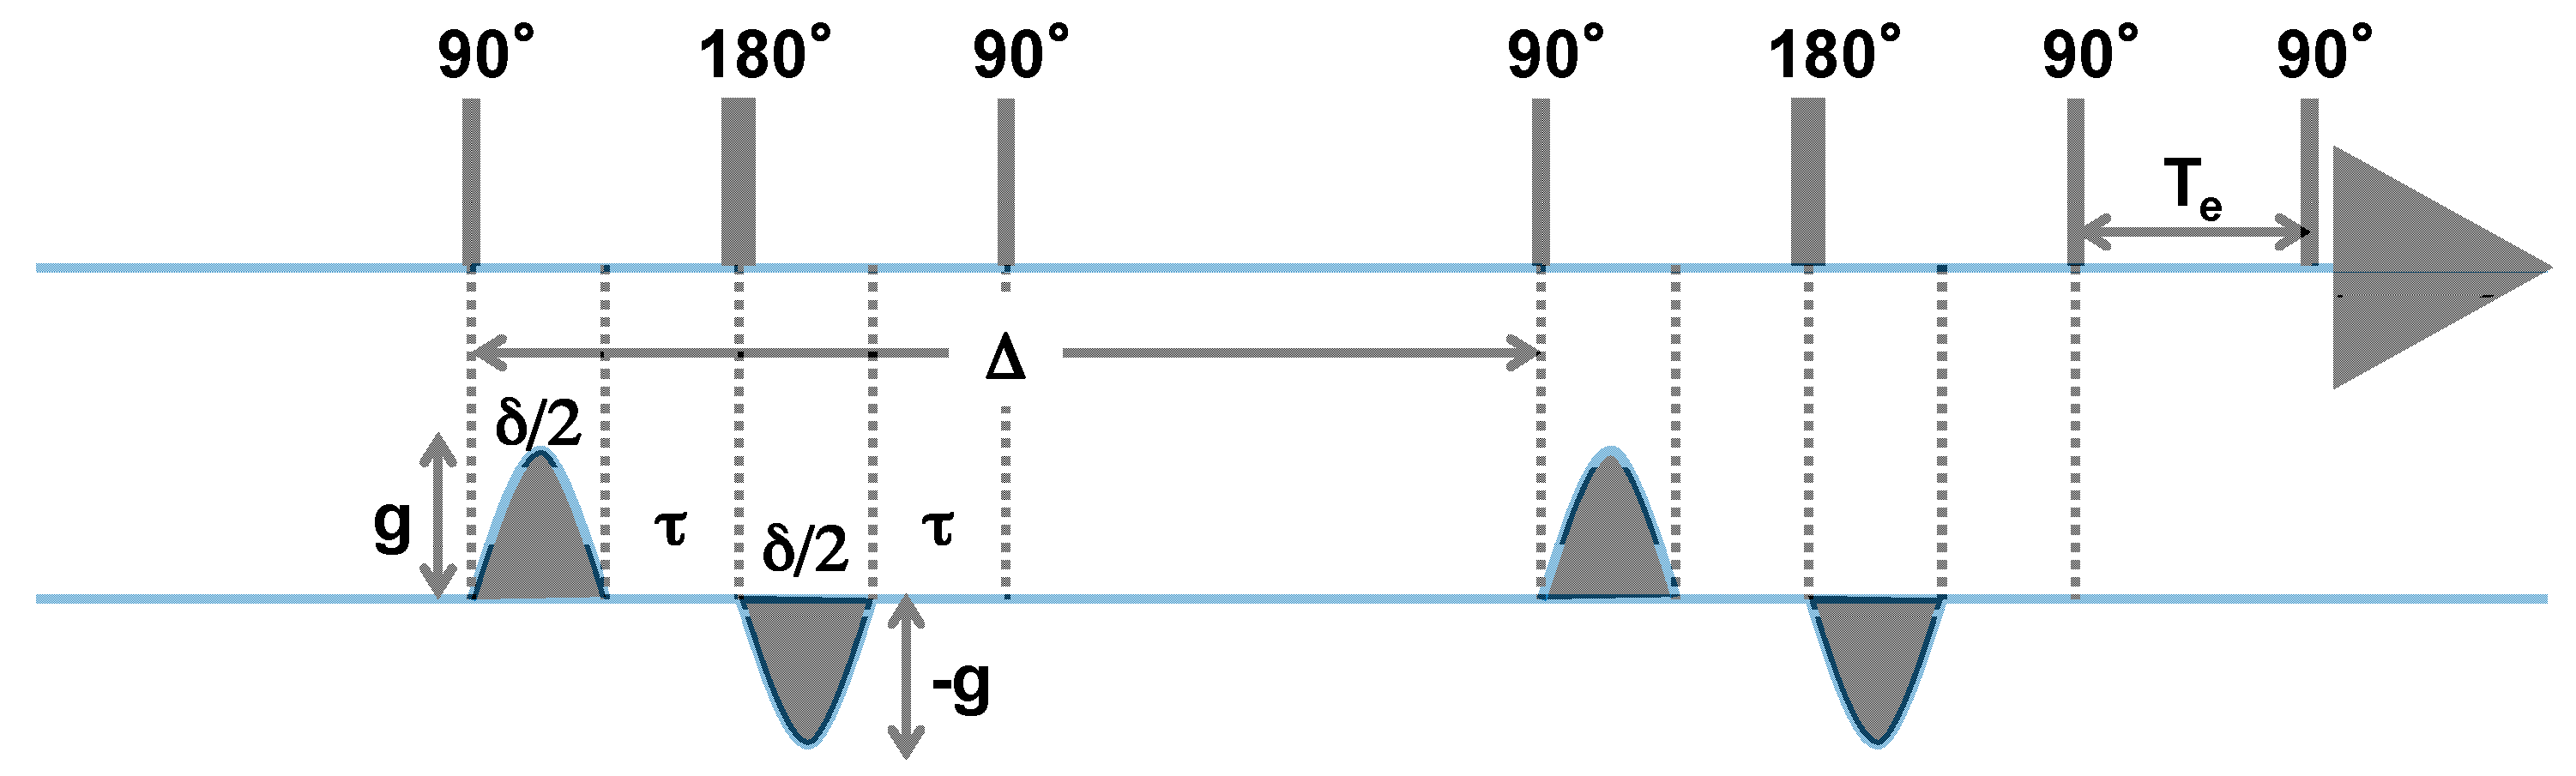
3.2. 1H DOSY NMR
3.3. Relaxation and Cross Polarization Experiments
4. Conclusions
Supplementary Materials
Acknowledgments
Author Contributions
Conflicts of Interest
Abbreviations
| NMR | Nuclear Magnetic Resonance |
| TPA | tetrapropylammonium |
| DOSY | diffusion ordered spectroscopy |
| CP | cross polarization |
| TEOS | tetraethyl orthosilicate |
| PFG | pulsed-field gradient |
| MAS | magic angle spinning |
| PGSE | Pulsed Gradient Spin Echo |
| BP | BiPolar |
| STE | STimulated Echo |
| LED | Longitudinal Eddy current Delay |
| MaxEnt | Maximum Entropy |
| DLS | diffusion light scattering |
| FID | free induction decay |
References
- Aerts, A.; Haouas, M.; Caremans, T.P.; Follens, L.R.A.; van Erp, T.S.; Taulelle, F.; Vermant, J.; Martens, J.A.; Kirschhock, C.E.A. Investigation of the Mechanism of Colloidal Silicalite-1 Crystallization by Using DLS, SAXS, and 29Si NMR Spectroscopy. Chem. Eur. J. 2010, 16, 2764–2774. [Google Scholar] [CrossRef] [PubMed]
- Caremans, T.P.; Loppinet, B.; Follens, L.R.A.; van Erp, T.S.; Vermant, J.; Goderis, B.; Kirschhock, C.E.A.; Martens, J.A.; Aerts, A. Investigation of Nanoparticles Occurring in the Colloidal Silicalite-1 Zeolite Crystallization Process Using Dissolution Experiments. Chem. Mater. 2010, 22, 3619–3629. [Google Scholar] [CrossRef]
- Davis, T.M.; Drews, T.O.; Ramanan, H.; He, C.; Dong, J.S.; Schnablegger, H.; Katsoulakis, M.A.; Kokkoli, E.; McCormick, A.V.; Penn, R.L.; et al. Mechanistic principles of nanoparticle evolution to zeolite crystals. Nat. Mater. 2006, 5, 400–408. [Google Scholar] [CrossRef] [PubMed]
- Petry, D.P.; Haouas, M.; Wong, S.C.C.; Aerts, A.; Kirschhock, C.E.A.; Martens, J.A.; Gaskell, S.J.; Anderson, M.W.; Taulelle, F. Connectivity Analysis of the Clear Sol Precursor of Silicalite: Are Nanoparticles Aggregated Oligomers or Silica Particles? J. Phys. Chem. C 2009, 113, 20827–20836. [Google Scholar] [CrossRef]
- Eilertsen, E.A.; Haouas, M.; Pinar, A.B.; Hould, N.D.; Lobo, R.F.; Lillerud, K.P.; Taulelle, F. NMR and SAXS Analysis of Connectivity of Aluminum and Silicon Atoms in the Clear Sol Precursor of SSZ-13 Zeolite. Chem. Mater. 2012, 24, 571–578. [Google Scholar] [CrossRef]
- Hould, N.; Haouas, M.; Nikolakis, V.; Taulelle, F.; Lobo, R. Mechanisms of Quick Zeolite Beta Crystallization. Chem. Mater. 2012, 24, 3621–3632. [Google Scholar] [CrossRef]
- Hrabanek, P.; Zikanova, A.; Drahokoupil, J.; Prokopova, O.; Brabec, L.; Jirka, I.; Matejkova, M.; Fila, V.; de la Iglesia, O.; Kocirik, M. Combined silica sources to prepare preferentially oriented silicalite-1 layers on various supports. Microporous Mesoporous Mater. 2013, 174, 154–162. [Google Scholar] [CrossRef]
- Castro, M.; Haouas, M.; Taulelle, F.; Lim, I.; Breynaert, E.; Brabants, G.; Kirschhock, C.E.A.; Schmidt, W. Multidiagnostic analysis of silicate speciation in clear solutions/sols for zeolite synthesis. Microporous Mesoporous Mater. 2014, 189, 158–162. [Google Scholar] [CrossRef]
- Fyfe, C.A.; Darton, R.J.; Schneider, C.; Scheffler, F. Solid-state NMR investigation of the possible existence of “Nanoblocks” in the clear solution synthesis of MFI materials. J. Phys. Chem. C 2008, 112, 80–88. [Google Scholar] [CrossRef]
- Kragten, D.D.; Fedeyko, J.M.; Sawant, K.R.; Rimer, J.D.; Vlachos, D.G.; Lobo, R.F.; Tsapatsis, M. Structure of the silica phase extracted from silica/(TPA)OH solutions containing nanoparticles. J. Phys. Chem. B 2003, 107, 10006–10016. [Google Scholar] [CrossRef]
- Majano, G.; Mintova, S.; Ovsitser, O.; Mihailova, B.; Bein, T. Zeolite beta nanosized assemblies. Microporous Mesoporous Mater. 2005, 80, 227–235. [Google Scholar] [CrossRef]
- Corkery, R.W.; Ninham, B.W. Low-temperature synthesis and characterization of a stable colloidal TPA-silicalite-1 suspension. Zeolites 1997, 18, 379–386. [Google Scholar] [CrossRef]
- De Moor, P.; Beelen, T.P.M.; van Santen, R.A. In situ observation of nucleation and crystal growth in zeolite synthesis. A small-angle X-ray scattering investigation on Si-TPA-MFI. J. Phys. Chem. B 1999, 103, 1639–1650. [Google Scholar] [CrossRef]
- Fedeyko, J.M.; Rimer, J.D.; Lobo, R.F.; Vlachos, D.G. Spontaneous formation of silica nanoparticles in basic solutions of small tetraalkylammonium cations. J. Phys. Chem. B 2004, 108, 12271–12275. [Google Scholar] [CrossRef]
- Jin, L.; Auerbach, S.M.; Monson, P.A. Modeling Nanoparticle Formation during Early Stages of Zeolite Growth: A Low-Coordination Lattice Model of Template Penetration. J. Phys. Chem. C 2010, 114, 14393–14401. [Google Scholar] [CrossRef]
- Jorge, M.; Auerbach, S.M.; Monson, P.A. Modeling spontaneous formation of precursor nanoparticles in clear-solution zeolite synthesis. J. Am. Chem. Soc. 2005, 127, 14388–14400. [Google Scholar] [CrossRef] [Green Version]
- Liang, D.; Follens, L.R.A.; Aerts, A.; Martens, J.A.; Van Tendeloo, G.; Kirschhock, C.E.A. TEM observation of aggregation steps in room-temperature silicalite-1 zeolite formation. J. Phys. Chem. C 2007, 111, 14283–14285. [Google Scholar] [CrossRef]
- Liu, S.P.; Chen, L.; Wang, Y.M. The synthesis of mesoporous zeolite beta aggregates without the use of second template and additive. Solid State Sci. 2010, 12, 1070–1075. [Google Scholar] [CrossRef]
- Mortola, V.B.; Ferreira, A.P.; Fedeyko, J.M.; Downing, C.; Bueno, J.M.C.; Kung, M.C.; Kung, H.H. Formation of Al-rich nanocrystalline ZSM-5 via chloride-mediated, abrupt, atypical amorphous-to-crystalline transformation. J. Mater. Chem. 2010, 20, 7517–7525. [Google Scholar] [CrossRef]
- Patis, A.; Dracopoulos, V.; Nikolakis, V. Investigation of silicalite-1 crystallization using attenuated total Reflection/Fourier transform infrared Spectroscopy. J. Phys. Chem. C 2007, 111, 17478–17484. [Google Scholar] [CrossRef]
- Van Tendeloo, L.; Haouas, M.; Martens, J.A.; Kirschhock, C.E.A.; Breynaert, E.; Taulelle, F. Zeolite synthesis in hydrated silicate ionic liquids. Faraday Discuss. 2015, 179, 437–449. [Google Scholar] [CrossRef] [PubMed]
- Burkett, S.L.; Davis, M.E. Mechanisms of structure direction in the synthesis of pure-silica zeolites. 1. Synthesis of TPA/Si-ZSM-5. Chem. Mater. 1995, 7, 920–928. [Google Scholar] [CrossRef]
- Cundy, C.S.; Cox, P.A. The hydrothermal synthesis of zeolites: History and development from the earliest days to the present time. Chem. Rev. 2003, 103, 663–701. [Google Scholar] [CrossRef] [PubMed]
- De Moor, P.; Beelen, T.P.M.; van Santen, R.A.; Tsuji, K.; Davis, M.E. SAXS and USAXS investigation on nanometer-scaled precursors in organic-mediated zeolite crystallization from gelating systems. Chem. Mater. 1999, 11, 36–43. [Google Scholar] [CrossRef]
- Fedeyko, J.M.; Vlachos, D.G.; Lobo, R.F. Formation and structure of self-assembled silica nanoparticles in basic solutions of organic and inorganic cations. Langmuir 2005, 21, 5197–5206. [Google Scholar] [CrossRef] [PubMed]
- Houssin, C.J.Y.; Kirschhock, C.E.A.; Magusin, P.; Mojet, B.L.; Grobet, P.J.; Jacobs, P.A.; Martens, J.A.; van Santen, R.A. Combined in situ Si-29 NMR and small-angle X-ray scattering study of precursors in MFI zeolite formation from silicic acid in TPAOH solutions. Phys. Chem. Chem. Phys. 2003, 5, 3518–3524. [Google Scholar] [CrossRef]
- Li, X.; Shantz, D.F. PFG NMR Investigations of Tetraalkylammonium-Silica Mixtures. J. Phys. Chem. C 2010, 114, 8449–8458. [Google Scholar] [CrossRef]
- Li, X.; Shantz, D.F. PFG NMR Investigations of Heated Tetrapropylammonium-Silica Mixtures. J. Phys. Chem. C 2010, 114, 14561–14570. [Google Scholar] [CrossRef]
- Lutsko, J.F.; Basios, V.; Nicolis, G.; Caremans, T.P.; Aerts, A.; Martens, J.A.; Kirschhock, C.E.A.; van Erp, T.S. Kinetics of intermediate-mediated self-assembly in nanosized materials: A generic model. J. Chem. Phys. 2010, 132, 11. [Google Scholar] [CrossRef] [PubMed]
- Tokay, B.; Karvan, O.; Erdem-Senatalar, A. Nanoparticle silicalite-1 crystallization as monitored by nitrogen adsorption. Microporous Mesoporous Mater. 2010, 131, 230–237. [Google Scholar] [CrossRef]
- Bissert, G.; Liebau, F. Crystal-structure of [N(n-C4H9)4]H7[Si8O20]·5.33H2O—A zeolite A-like double-ring silicate with protonated water clusters [H41O16]9+. Z. Kristallogr. 1987, 179, 357–371. [Google Scholar] [CrossRef]
- Wiebcke, M.; Hoebbel, D. Structural links between zeolite-type and clathrate hydrate-type materials—Synthesis and crystal-structure of [NMe4]16[Si8O20][OH]8·116H2O. Dalton Trans. 1992, 1, 2451–2455. [Google Scholar] [CrossRef]
- Wiebcke, M.; Koller, H. Single-crystal X-ray-diffraction and variable-temperature MAS NMR-study on the heterogeneous network clathrate Na[N(CH3)4]7[Si8O20]·54H2O. Acta Crystallogr. Sect. B Struct. Commun. 1992, 48, 449–458. [Google Scholar] [CrossRef]
- Altieri, A.S.; Hinton, D.P.; Byrd, R.A. Association of biomolecular systems via pulsed-field gradient NMR self-diffusion measurements. J. Am. Chem. Soc. 1995, 117, 7566–7567. [Google Scholar] [CrossRef]
- Auge, S.; Schmit, P.O.; Crutchfield, C.A.; Islam, M.T.; Harris, D.J.; Durand, E.; Clemancey, M.; Quoineaud, A.A.; Lancelin, J.M.; Prigent, Y.; et al. NMR Measure of Translational Diffusion and Fractal Dimension. Application to Molecular Mass Measurement. J. Phys. Chem. B 2009, 113, 1914–1918. [Google Scholar] [CrossRef] [PubMed]
- Floquet, S.; Brun, S.; Lemonnier, J.F.; Henry, M.; Delsuc, M.A.; Prigent, Y.; Cadot, E.; Taulelle, F. Molecular Weights of Cyclic and Hollow Clusters Measured by DOSY NMR Spectroscopy. J. Am. Chem. Soc. 2009, 131, 17254–17259. [Google Scholar] [CrossRef] [PubMed]
- Bahlmann, E.K.F.; Harris, R.K.; Metcalfe, K.; Rockliffe, J.W.; Smith, E.G. Silicon-29 NMR self-diffusion and chemical-exchange studies of concentrated sodium silicate solutions. J. Chem. Soc. Faraday Trans. 1997, 93, 93–98. [Google Scholar] [CrossRef]
- Harris, R.K.; Kinnear, K.A.; Morris, G.A.; Stchedroff, M.J.; Samadi-Maybodi, A.; Azizi, N. Silicon-29 diffusion-ordered NMR spectroscopy (DOSY) as a tool for studying aqueous silicates. Chem. Commun. 2001, 2422–2423. [Google Scholar] [CrossRef]
- Stchedroff, M.J.; Kenwright, A.M.; Morris, G.A.; Nilsson, M.; Harris, R.K. 2D and 3D DOSY methods for studying mixtures of oligomeric dimethylsiloxanes. Phys. Chem. Chem. Phys. 2004, 6, 3221–3227. [Google Scholar] [CrossRef]
- Li, X.; Shantz, D.F. PFG NMR studies of lysine-silica solutions. J. Colloid Interface Sci. 2012, 383, 19–27. [Google Scholar] [CrossRef] [PubMed]
- Li, X.A.; Shantz, D.F. PFG NMR Investigations of TPA-TMA-Silica Mixtures. Langmuir 2011, 27, 3849–3858. [Google Scholar] [CrossRef] [PubMed]
- Rivas-Cardona, A.; Shantz, D.F. In situ PFG NMR of Silicalite-1 Synthesis Mixtures. J. Phys. Chem. C 2011, 115, 13016–13026. [Google Scholar] [CrossRef]
- Balinov, B.; Jonsson, B.; Linse, P.; Soderman, O. The NMR self-diffusion method applied to restricted diffusion—Simulation of echo attenuation from molecules in spheres and between planes. J. Magn. Reson. Ser. A 1993, 104, 17–25. [Google Scholar] [CrossRef]
- Guinebretiere, S.; Briancon, S.; Lieto, J.; Mayer, C.; Fessi, H. Study of the emulsion-diffusion of solvent: Preparation and characterization of nanocapsules. Drug Dev. Res. 2002, 57, 18–33. [Google Scholar] [CrossRef]
- Heald, C.R.; Stolnik, S.; Kujawinski, K.S.; de Matteis, C.; Garnett, M.C.; Illum, L.; Davis, S.S.; Purkiss, S.C.; Barlow, R.J.; Gellert, P.R. Poly(lactic acid)–poly(ethylene oxide) (PLA–PEG) nanoparticles: NMR studies of the central solidlike PLA core and the liquid PEG corona. Langmuir 2002, 18, 3669–3675. [Google Scholar] [CrossRef]
- Hoffmann, D.; Mayer, C. Cross polarization induced by temporary adsorption: NMR investigations on nanocapsule dispersions. J. Chem. Phys. 2000, 112, 4242–4250. [Google Scholar] [CrossRef]
- Huang, H.Y.; Wooley, K.L.; Schaefer, J. REDOR determination of the composition of shell cross-linked amphiphilic core–shell nanoparticles and the partitioning of sequestered fluorinated guests. Macromolecules 2001, 34, 547–551. [Google Scholar] [CrossRef]
- Jenning, V.; Mader, K.; Gohla, S.H. Solid lipid nanoparticles (SLN (TM)) based on binary mixtures of liquid and solid lipids: A 1H-NMR study. Int. J. Pharm. 2000, 205, 15–21. [Google Scholar] [CrossRef]
- Sharma, R.; Holland, G.P.; Solomon, V.C.; Zimmermann, H.; Schiffenhaus, S.; Amin, S.A.; Buttry, D.A.; Yarger, J.L. NMR Characterization of Ligand Binding and Exchange Dynamics in Triphenylphosphine-Capped Gold Nanoparticles. J. Phys. Chem. C 2009, 113, 16387–16393. [Google Scholar] [CrossRef]
- Burkett, S.L.; Davis, M.E. Mechanism of structure direction in the synthesis of Si-ZSM-5—An investigation by intermolecular 1H–29Si CP MAS NMR. J. Phys. Chem. 1994, 98, 4647–4653. [Google Scholar] [CrossRef]
- Burkett, S.L.; Davis, M.E. Mechanism of structure direction in the synthesis of pure-silica zeolites. 2. Hydrophobic hydration and structural specificity. Chem. Mater. 1995, 7, 1453–1463. [Google Scholar] [CrossRef]
- Click, C.A.; Assink, R.A.; Brinker, C.J.; Naik, S.J. An investigation of molecular templating in amorphous silicas by cross-polarization NMR spectroscopy. J. Phys. Chem. B 2000, 104, 233–236. [Google Scholar] [CrossRef]
- Castelijns, H.J.; Huinink, H.P.; Pel, L.; Zitha, P.L.J. The effect of pH on coupled mass transfer and sol-gel reaction in a two-phase system. J. Phys. Chem. B 2007, 111, 12383–12388. [Google Scholar] [CrossRef] [PubMed]
- Mayer, C. Nuclear magnetic resonance on dispersed nanoparticles. Prog. Nucl. Magn. Reson. Spectrosc. 2002, 40, 307–366. [Google Scholar] [CrossRef]
- Storas, T.H.; Gjesdal, K.I.; Gadmar, O.B.; Geitung, J.T.; Klow, N.E. Prostate Magnetic Resonance Imaging: Multiexponential T2 Decay in Prostate Tissue. J. Magn. Reson. Imaging 2008, 28, 1166–1172. [Google Scholar] [CrossRef] [PubMed]
- Storas, T.H.; Gjesdal, K.I.; Gadmar, O.B.; Geitung, J.T.; Klow, N.E. Three-Dimensional Balanced Steady State Free Precession Imaging of the Prostate: Flip Angle Dependency of the Signal Based on a Two Component T2-decay Model. J. Magn. Reson. Imaging 2010, 31, 1124–1131. [Google Scholar] [CrossRef] [PubMed]
- Wissing, S.A.; Muller, R.H.; Manthei, L.; Mayer, C. Structural characterization of Q10-loaded solid lipid nanoparticles by NMR spectroscopy. Pharm. Res. 2004, 21, 400–405. [Google Scholar] [CrossRef] [PubMed]
- Zimmerman, J.R.; Brittin, W.E. Nuclear magnetic resonance studies in multiple-phase system—Lifetime of a water molecules in an adsorbing phase on silica gel. J. Phys. Chem. 1957, 61, 1328–1333. [Google Scholar] [CrossRef]
- Cundy, C.S.; Forrest, J.O.; Plaisted, R.J. Some observations on the preparation and properties of colloidal silicalites. Part 1: Synthesis of colloidal silicalite-1 and titanosilicalite-1 (TS-1). Microporous Mesoporous Mater. 2003, 66, 143–156. [Google Scholar] [CrossRef]
- Kumar, S.; Wang, Z.P.; Penn, R.L.; Tsapatsis, M. A Structural Resolution Cryo-TEM Study of the Early Stages of MFI Growth. J. Am. Chem. Soc. 2008, 130, 17284–17286. [Google Scholar] [CrossRef] [PubMed]
- Nikolakis, V.; Kokkoli, E.; Tirrell, M.; Tsapatsis, M.; Vlachos, D.G. Zeolite growth by addition of subcolloidal particles: Modeling and experimental validation. Chem. Mater. 2000, 12, 845–853. [Google Scholar] [CrossRef]
- Follens, L.R.A.; Aerts, A.; Haouas, M.; Caremans, T.P.; Loppinet, B.; Goderis, B.; Vermant, J.; Taulelle, F.; Martens, J.A.; Kirschhock, C.E.A. Characterization of nanoparticles in diluted clear solutions for Silicalite-1 zeolite synthesis using liquid 29Si NMR, SAXS and DLS. Phys. Chem. Chem. Phys. 2008, 10, 5574–5583. [Google Scholar] [CrossRef] [PubMed]
- Holz, M.; Weingartner, H. Calibration in accurate spin-echo self-diffusion measurements using 1H and less-common nuclei. J. Magn. Reson. 1991, 92, 115–125. [Google Scholar] [CrossRef]
- Romoscanu, A.I.; Fenollosa, A.; Acquistapace, S.; Gunes, D.; Martins-Deuchande, T.; Clausen, P.; Mezzenga, R.; Nyden, M.; Zick, K.; Hughes, E. Structure, Diffusion, and Permeability of Protein-Stabilized Monodispersed Oil in Water Emulsions and Their Gels: A Self-Diffusion NMR Study. Langmuir 2010, 26, 6184–6192. [Google Scholar] [CrossRef] [PubMed]
- Delsuc, M.A.; Malliavin, T.E. Maximum entropy processing of DOSY NMR spectra. Anal. Chem. 1998, 70, 2146–2148. [Google Scholar] [CrossRef]
- Lorenz-Fonfria, V.A.; Kandori, H. Bayesian maximum entropy (two-dimensional) lifetime distribution reconstruction from time-resolved spectroscopic data. Appl. Spectrosc. 2007, 61, 428–443. [Google Scholar] [CrossRef] [PubMed]
- Mills, R. Self-diffusion in normal and heavy-water in range 1–45 degrees. J. Phys. Chem. 1973, 77, 685–688. [Google Scholar] [CrossRef]
- Yoshida, K.; Matubayasi, N.; Uosaki, Y.; Nakahara, M. Scaled Polynomial Expression for Self-Diffusion Coefficients for Water, Benzene, and Cyclohexane over a Wide Range of Temperatures and Densities. J. Chem. Eng. Data 2010, 55, 2815–2823. [Google Scholar] [CrossRef]
- Pratt, K.C.; Wakeham, W.A. Mutual diffusion-coefficient of ethanol–water mixtures—Destribution by a rapid new method. Proc. R. Soc. Lond. Ser. A Math. Phys. Eng. Sci. 1974, 336, 393–406. [Google Scholar] [CrossRef]
- Rahman, M.A.; Doe, H. Ion transfer of tetraalkylammonium cations at an interface between frozen aqueous solution and 1,2-dichloroethane. J. Electroanal. Chem. 1997, 424, 159–164. [Google Scholar] [CrossRef]
- Easteal, A.J. Tracer diffusion of water in organic liquids. J. Chem. Eng. Data 1996, 41, 741–744. [Google Scholar] [CrossRef]
- Easteal, A.J. Tracer diffusion in aqueous sucrose and urea solutions. Can. J. Chem. Rev. Can. Chim. 1990, 68, 1611–1615. [Google Scholar] [CrossRef]
- Hiss, T.G.; Cussler, E.L. Dffusion in high-viscosity liquids. AIChE J. 1973, 19, 698–703. [Google Scholar] [CrossRef]
- Wiebcke, M. Structural links between zeolite-type and clathrate hydrate-type materials. Chem. Commun. 1991, 1507–1508. [Google Scholar] [CrossRef]
- Ernst, M.; Griesinger, C.; Ernst, R.R.; Bermel, W. Optimized heteronuclear cross polarization in liquids. Mol. Phys. 1991, 74, 219–252. [Google Scholar] [CrossRef]
- Mehring, M. Principles of High Resolution NMR in Solids, 2nd ed.; Springer-Verlag: Berlin, Germany, 1983. [Google Scholar]
- Johnson, C.S. Diffusion ordered nuclear magnetic resonance spectroscopy: Principles and applications. Prog. Nucl. Magn. Reson. Spectrosc. 1999, 34, 203–256. [Google Scholar] [CrossRef]
- Pons, J.L.; Malliavin, T.E.; Delsuc, M.A. Gifa V 4: A complete package for NMR data set processing. J. Biomol. NMR 1996, 8, 445–452. [Google Scholar] [CrossRef] [PubMed]
- Assemat, O.; Coutouly, M.A.; Hajjar, R.; Delsuc, M.A. Validation of molecular mass measurements by means of diffusion-ordered NMR spectroscopy: Application to oligosaccharides. C. R. Chim. 2010, 13, 412–415. [Google Scholar] [CrossRef]
- Meiboom, S.; Gill, D. Modified spin-echo method for measuring nuclear relaxation times. Rev. Sci. Instrum. 1958, 29, 688–691. [Google Scholar] [CrossRef]


| Sample | Molar Composition | Post Synthesis Treatment | General Aspect |
|---|---|---|---|
| S | 25 SiO2:9 TPAOH:400 H2O/D2O: 100 EtOH | No | Transparent and uncolored |
| S0 | 9 TPAOH:400 H2O/D2O: 100 EtOH | No | Transparent and uncolored |
| SD | 25 SiO2:9 TPAOH:1600 H2O/D2O: 100 EtOH | No | Transparent and uncolored |
| SD0 | 9 TPAOH:1600 H2O/D2O: 100 EtOH | No | Transparent and uncolored |
| SH | 25 SiO2:9 TPAOH:400 H2O/D2O: 100 EtOH | 95 °C/24 h | Milky slurry |
| Sample | T1 (s) 1 | T2 (s) 1 | ||||||||||
|---|---|---|---|---|---|---|---|---|---|---|---|---|
| TPA | EtOH | H2O | TPA | EtOH | H2O | |||||||
| CH3 | CH2 | NCH2 | CH3 | CH2 | H2O | CH3 | CH2 | NCH2 | CH3 | CH2 | ||
| S | 0.68 | 0.39 | 0.33 | 2.2 | 2.4 | 1.5 | 0.17 | 0.082 | 0.057 | 1.6 | 1.5 | 0.33 |
| S0 | 0.62 | 0.30 | 0.23 | 2.5 | 2.3 | - 2 | 0.36 | 0.22 | 0.13 | 1.9 | 1.5 | 1.5 |
| SD | 0.79 | 0.45 | 0.37 | 3.0 | 3.1 | 1.6 | 0.26 | 0.13 | 0.10 | 2.4 | 2.0 | 1.0 |
| SD0 | 0.80 | 0.51 | 0.41 | 3.1 | 3.2 | - 2 | 0.49 | 0.26 | 0.17 | 3.2 | 2.4 | 1.8 |
| SH | 0.53 | 0.40 | 0.36 | 2.1 | 2.2 | 1.4 | 0.064 | 0.042 | 0.033 | 0.26 | 0.19 | 0.19 |
| Sample | TPA | EtOH | H2O | |||
|---|---|---|---|---|---|---|
| CH3 | CH2 | NCH2 | CH3 | CH2 | H2O | |
| S | 0.18 | 0.062 | 0.043 | 2.1 | 2.1 | 0.39 |
| S0 | 0.75 | 0.30 | 0.19 | 2.6 | 1.8 | 1.4 |
| SD | 0.35 | 0.12 | 0.10 | 1.9 | 2.6 | 1.3 |
| SD0 | 0.65 | 0.34 | 0.37 | 3.9 | 2.5 | 2.0 |
| SH | 0.079 | 0.054 | 0.044 | 1.3 | 0.81 | 0.29 |
| Sample | TPA | EtOH | |||
|---|---|---|---|---|---|
| CH3 | CH2 | NCH2 | CH3 | CH2 | |
| S | 0.017 | 0.041 | 0.043 | 0.017 | 0.015 |
| S0 | 0.009 | 0.013 | 0.012 | 0.010 | 0.008 |
| SD | 0.020 | 0.036 | 0.063 | 0.020 | 0.020 |
| SD0 | 0.010 | 0.015 | 0.012 | 0.012 | 0.009 |
| SH | 0.029 | 0.031 | 0.027 | 0.019 | 0.020 |
© 2016 by the authors; licensee MDPI, Basel, Switzerland. This article is an open access article distributed under the terms and conditions of the Creative Commons Attribution (CC-BY) license (http://creativecommons.org/licenses/by/4.0/).
Share and Cite
Haouas, M.; Petry, D.P.; Anderson, M.W.; Taulelle, F. Tetrapropylammonium Occlusion in Nanoaggregates of Precursor of Silicalite-1 Zeolite Studied by 1H and 13C NMR. Inorganics 2016, 4, 18. https://doi.org/10.3390/inorganics4020018
Haouas M, Petry DP, Anderson MW, Taulelle F. Tetrapropylammonium Occlusion in Nanoaggregates of Precursor of Silicalite-1 Zeolite Studied by 1H and 13C NMR. Inorganics. 2016; 4(2):18. https://doi.org/10.3390/inorganics4020018
Chicago/Turabian StyleHaouas, Mohamed, David P. Petry, Michael W. Anderson, and Francis Taulelle. 2016. "Tetrapropylammonium Occlusion in Nanoaggregates of Precursor of Silicalite-1 Zeolite Studied by 1H and 13C NMR" Inorganics 4, no. 2: 18. https://doi.org/10.3390/inorganics4020018
APA StyleHaouas, M., Petry, D. P., Anderson, M. W., & Taulelle, F. (2016). Tetrapropylammonium Occlusion in Nanoaggregates of Precursor of Silicalite-1 Zeolite Studied by 1H and 13C NMR. Inorganics, 4(2), 18. https://doi.org/10.3390/inorganics4020018