
Article

Photovoltaic-Relevant Optical and Dielectric Behavior of the Azo-Oxime Ligand and Its VO2+-, Cu2+-, and Fe3+-Based Complexes Films

Applied College at Khulais, University of Jeddah, Jeddah 21589, Saudi Arabia
*
Author to whom correspondence should be addressed.
Inorganics 2026, 14(9), 244; https://doi.org/10.3390/inorganics14090244 (registering DOI)
Submission received: 9 August 2026 / Revised: 8 September 2026 / Accepted: 13 September 2026 / Published: 18 September 2026
(This article belongs to the Special Issue Advanced Inorganic Semiconductor Materials, 4th Edition)

Abstract

Cu2+, VO22+, and Fe3+ mononuclear complexes of the oxime-based ligand, 2-hydroxy-5-(p-tolyldiazenyl)benzaldehyde oxime (H2L, 1), have been synthesized and structurally characterized by analytical, thermal, and spectral tools. They have been characterized by microanalyses (C, H, and N), 1H and 13C-NMR, FT-IR, UV-Vis, and/or ESR spectral measurements. The various analytics data indicate that the oxime-based ligand behaved as a neutral bidentate chelator binding Cu2+, VO2+, and Fe3+ cations via the nitrogen atom of the protonated oximatic group and protonated phenolic hydroxyl oxygen atom, adopting a distorted octahedral geometry. Furthermore, computational studies utilizing DFT/B3LYP/6-311(pd) include assessment of dipole moment, global reactivity descriptors, optimized geometry, LUMO-HOMO energy gaps, and molecular electrostatic potential image (MEP), which were estimated to support the geometrical structure of Cu2+, VO2+, and Fe3+ complexes. Furthermore, the optical parameters, viz. the refractive index (n) and extinction coefficient of azo-oxime ligand and its complexes, have been precisely estimated within a 300–1100 nm wavelength. The values of optical gap (Egap) for the azo-oxime ligand and its complex films diminished from 2.96 eV for H2L to 1.83 eV for the Fe3+ film; however; the n values follow an opposite behavior. The obtained n and Eg values are comparable to those reported for various semiconducting materials, suggesting the potential suitability of the investigated films for future semiconductor and optoelectronic applications. Although practical device performance remains to be evaluated, these low-cost and easily prepared materials could serve as promising candidates in these fields. Furthermore, the dielectric and nonlinear optical parameters have been thoroughly evaluated and comprehensively discussed.

1. Introduction

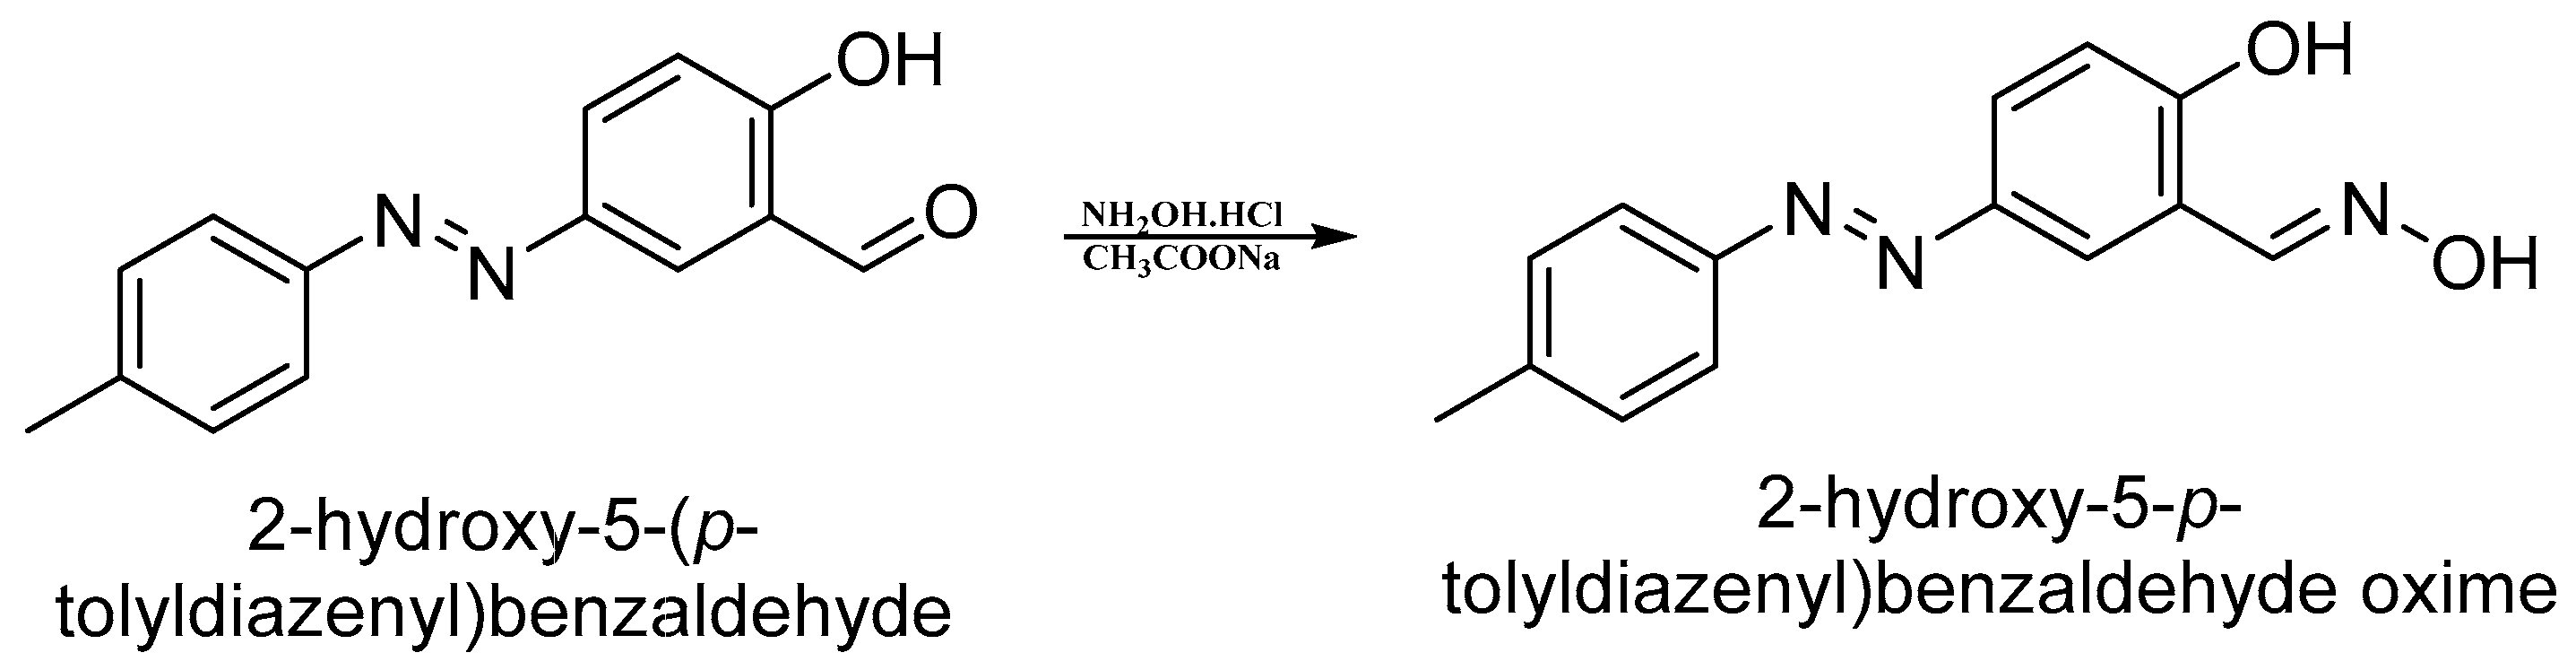
The growing global demand for alternative and renewable energy sources in the modern era of green energy has driven rapid advancements in the creation of economical and effective technologies for energy conversion and storage [1]. Among these technologies, solar cells are of particular importance as they convert solar radiation into electrical energy. Although maximizing power conversion efficiency remains a key goal, overcoming challenges related to energy storage and transport is equally critical. In this context, electrochemical energy storage systems—such as supercapacitors and batteries—have demonstrated highly effectiveness in storing electricity created from alternative and renewable energy sources. Consequently, extensive study has been devoted to the development of storage devices characterized by high energy and power densities, rapid charge–discharge rates, and long-term stability under optimal operational conditions. To further enhance the efficiency of energy conversion and storage systems, many approaches have been projected for the creation of photosensitive materials with superior properties [2]. Recently, coordination compounds and Metal–Organic Frameworks have attracted considerable attention as a new class of functional substances exhibiting distinct structural, electronic, and optical characteristics, making them suitable for advanced energy-related applications [3,4,5,6]. Coordination chemistry has experienced remarkable growth over the past decades, producing a broad diversity of metal-chelated complexes that find applications in electronic [7], optical [8], analytical [9], sensing [10,11], catalytic [12], biological [13], clinical [14], and industrial [15] fields. Current research efforts are increasingly directed toward the design of new organic chelating agents that act as molecular scaffolds for the creation of metallic complexes with desirable physicochemical properties. These metallic complexes have demonstrated potential in supercapacitors, solar cells, sensors, and electrochemical energy storage systems [16,17]. Among these ligands, oxime-based ligands occupy a distinctive position in coordination chemistry owing to the versatile donor character of their >C=N–OH functional group, which enables coordination to transition-metallic ions via the imine nitrogen, the oximato oxygen, or both, depending on the degree of deprotonation and the nature of the metal center [18,19]. This dual donor capability, combined with the ease of introducing additional functional groups (phenolic, azo, or aromatic substituents) onto the oxime backbone, has made oxime and azo-oxime ligands a widely exploited scaffold for constructing stable mononuclear and polynuclear metal complexes. Their strong chelating ability, structural tunability, and straightforward synthetic accessibility have established oxime-derived complexes as important targets across sensing, catalytic, biological, and materials-chemistry applications [20,21]. While the ultimate electrochemical and optoelectronic performance of devices depends heavily on the practical optimization of electrode and active layer materials, exploring the fundamental optical and electronic properties of novel organometallic complexes is a crucial preliminary step [22]. In this context, a series of VO2+, Cu2+, and Fe3+ complexes derived from the azo-oxime ligand, 2-hydroxy-5-(p-tolyldiazenyl)benzaldehyde oxime (H2L, 1) were synthesized via a simple and efficient method. These complexes were investigated to assess their fundamental optical parameters and evaluate their preliminary suitability as potential candidates for prospective optical switching, signal processing, and modulator applications. Their physicochemical properties were comprehensively characterized using analytical and spectral tools, including FT-IR, UV–Vis, NMR, and ESR Furthermore, Density Functional Theory (DFT) calculations at the B3LYP level employing the 6-311G(d,p) basis set were conducted to investigate the chemical reactivity, charge distribution, and molecular electrostatic potential (MEP) parameters. In addition, the energy loss functions and optical constants of the prepared thin films were thoroughly examined to elucidate their electronic and optical behaviors, thereby providing a foundational baseline for their potential future integration into semiconductor and photovoltaic devices.

2. Results and Discussion

2.1. Exploration of the Structure of Azo-Oxime and Its Cu2+, VO2+, and Fe3+ Complexes

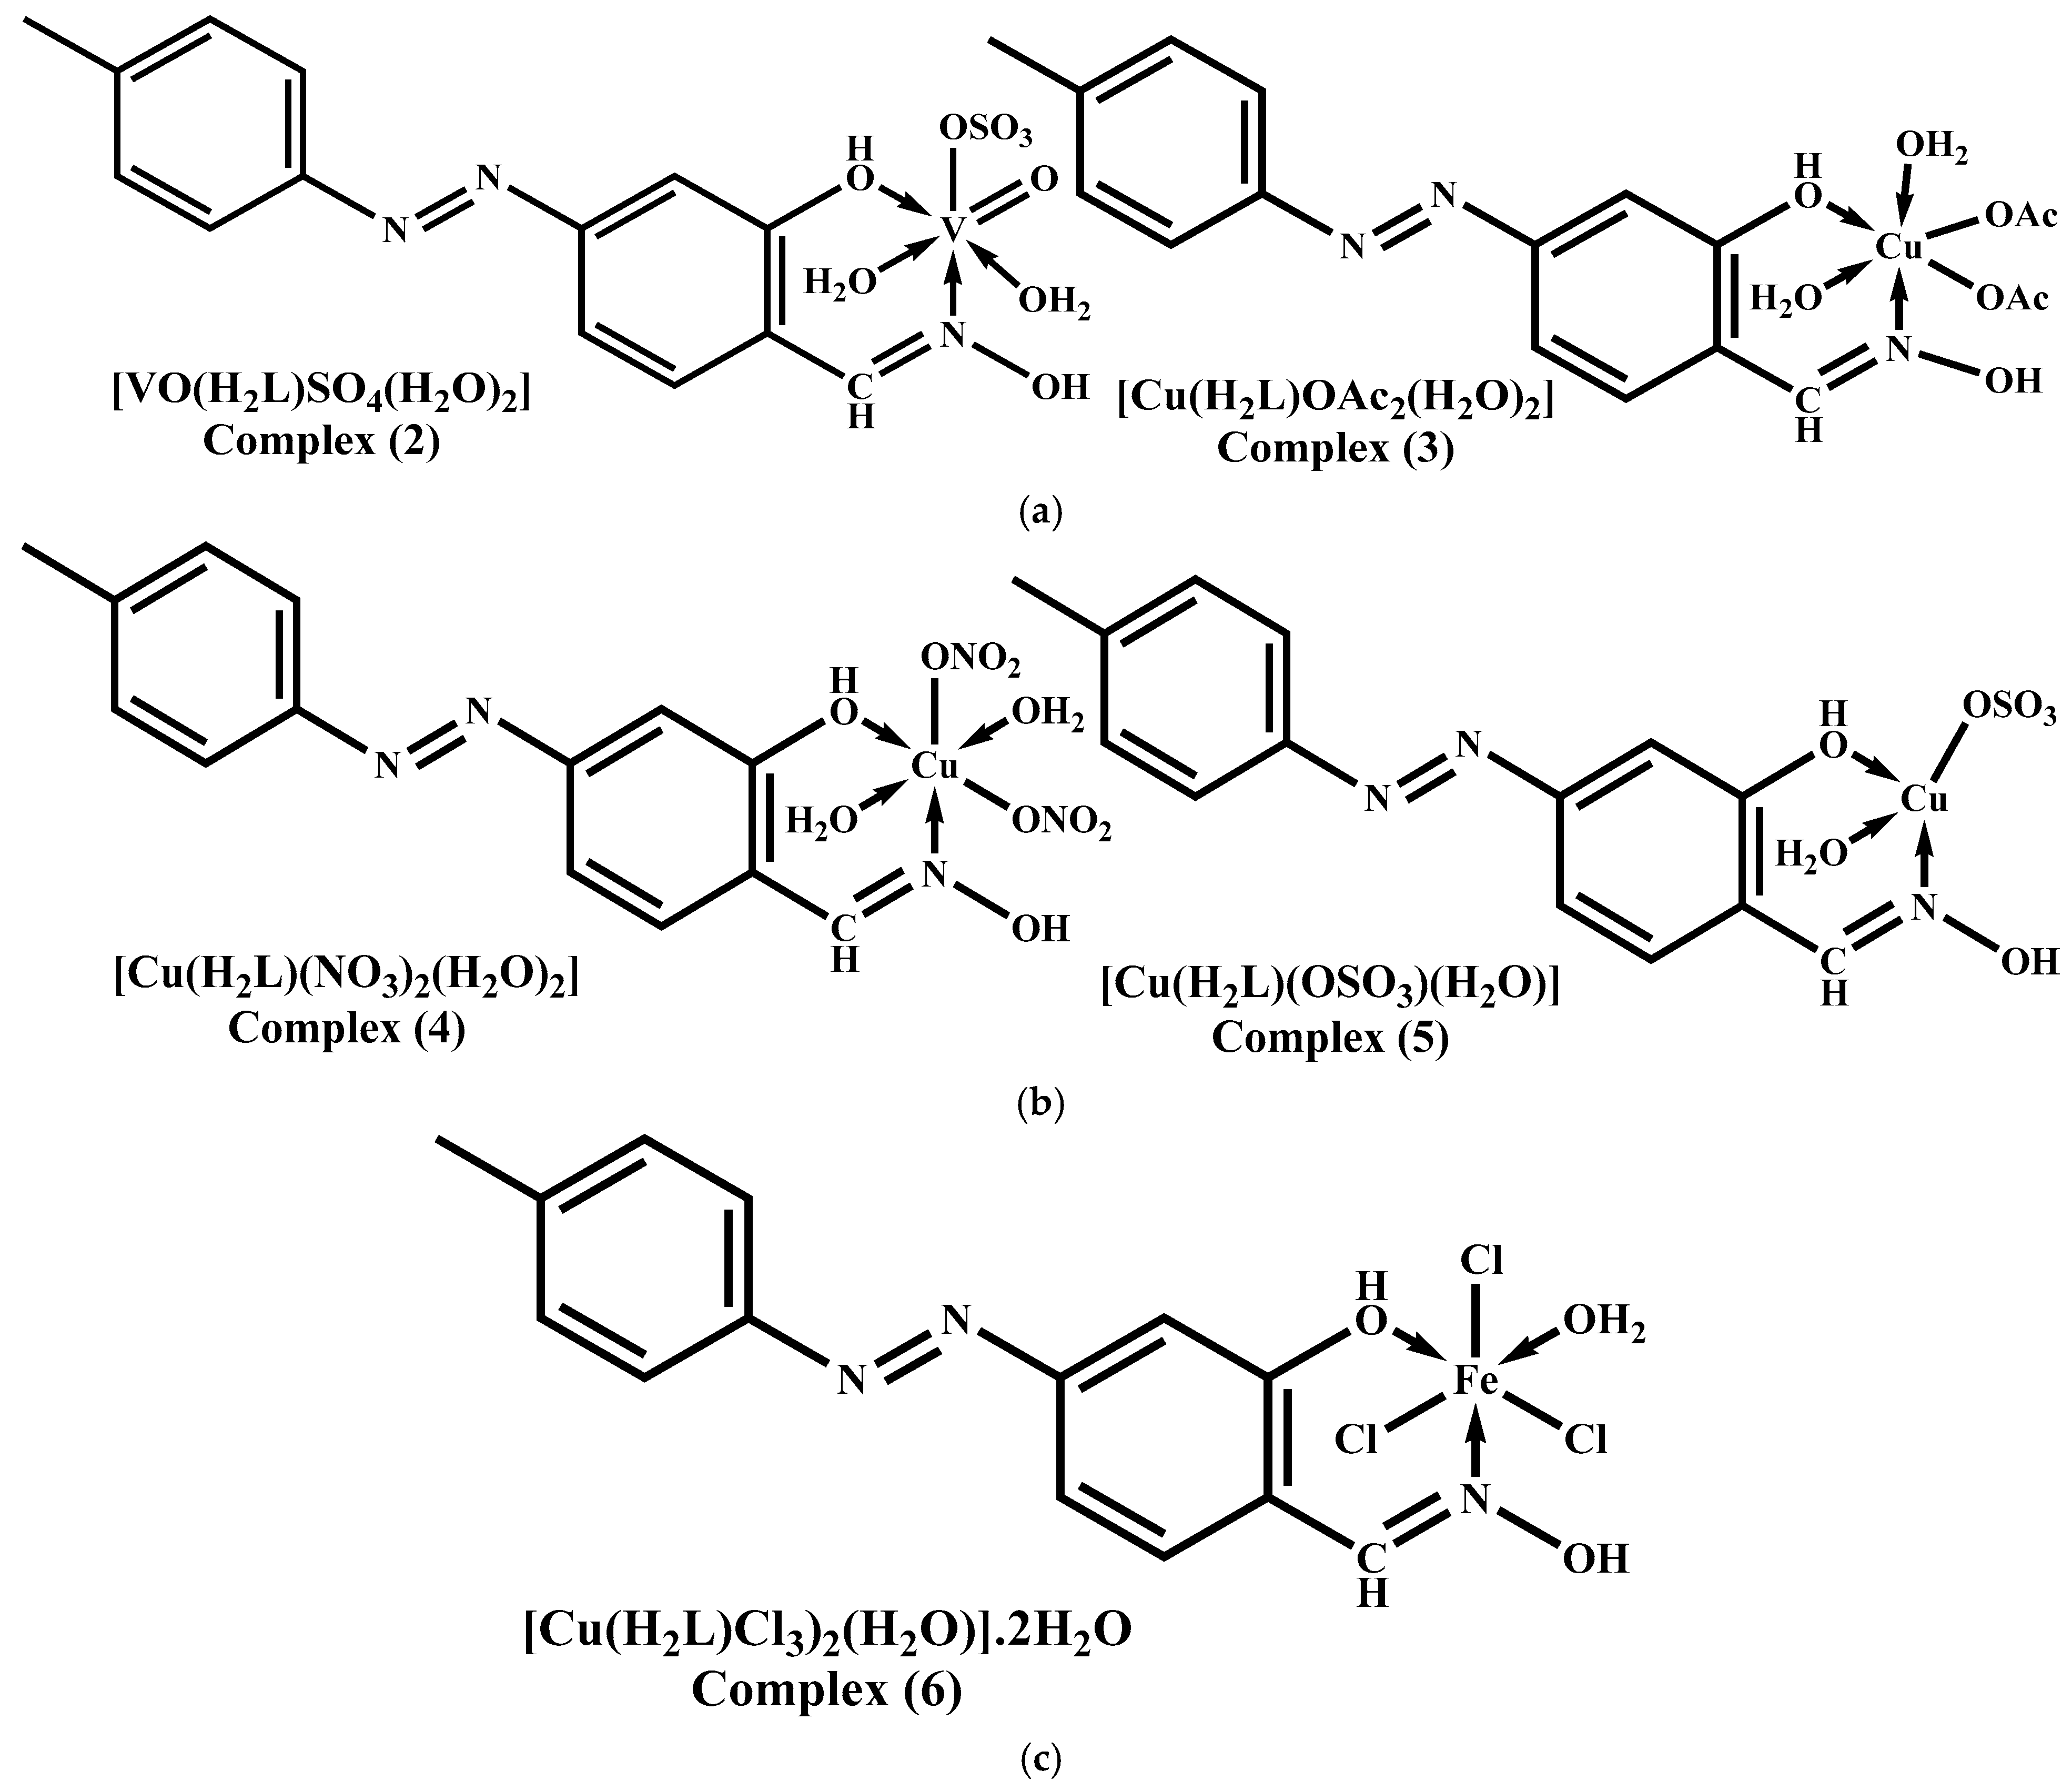
The physical, analytical, and spectral properties of the synthetics were collected in the experimental part. The ligand 2-hydroxy-5-(p-tolyldiazenyl)benzaldehyde oxime ligand (H2L, 1) was reacted with the salts of Cu2+, VO2+, and Fe3+ forming mononuclear complexes with general formulae [M(H2L)XYZ2].nH2O (M = Cu2+, X = Y = OAc or NO3, Z = H2O, X = SO42−,Y = H2O, Z = 0; M = VO2+, X = SO42−, Z = H2O, Y = 0; and M = Fe3+, X = Z = Cl, Y = H2O) as displayed in Figure 1a–c. The structures of the synthesized compounds were elucidated using analytical, theoretical, thermal, and various spectroscopic techniques, including 1H NMR, 13C NMR, UV–Vis, and FT-IR. The results obtained from experimental measurements and theoretical calculations are presented in the experimental section and Table 1, Table 2, Table 3, Table 4 and Table 5 and Tables S1 and S2. The synthesized compounds are non-hygroscopic solids and remain stable at ambient temperature. The solubility test showed that the ligand is soluble in polar organic solvents, while the complexes are slightly soluble in well-known organic solvents but soluble in DMF and DMSO. Crystals suitable for X-ray diffraction studies were, unfortunately, not obtained. Elemental analysis confirmed the proposed molecular formulas and indicated that all chelated compounds (26) were formed in a 1:1 ligand-to-metal (L:M) molar ratio (Figure 1a–c).

Molar Conductivity

The values of molar conductance of complexes’ solution (10−3 M, DMSO/25 °C) demonstrate a non-electrolytic nature, as evidenced by their relatively low molar conductance values in DMSO solution (ΛM = 13.1–24.1 Ω−1cm2mol−1). This suggests a direct connection between the acetate, nitrate, sulphate, or chloride ions and the metallic cations [23]. The significantly high value may be due to the partial solvolysis by the solvent molecule [23].

2.2. Spectroscopic Studies

2.2.1. FT-IR Spectra

The main FT-IR data of synthetics is recorded in experimental parts and shown in Figures S1–S4. The chelation centers’, (OH and C=N-OH), vibrational stretching is accountable for the significant bands seen in the synthetics’ spectrum. In the free azo-oxime (H2L, 1) spectrum, the band observed at 1280, and 3400 cm−1 could be attributed to the bending δ(OH) and stretching v(OH) bands successively [24,25]. Meanwhile, the stretching vibration at 1620 and 1010 cm−1 could be attributed to imine ν(C=N) and oximato ν(N-O) groups successively [24,25,26]. Additionally, the vibrational stretching of aliphatic and aromatic hydrogens was shown as weak bands at 3060, 3023, 2920, and 2849 cm−1 [25]. The chelation behavior of azo-oxime (H2L, 1) with VO2+, Cu2+, and Fe3+ has been recognizable by contrasting the IR spectra of VO2+, Cu2+, and Fe3+ complexes with that of unchelated azo-oxime. The chelation mode of azo-oxime with VO2+, Cu2+, and Fe3+ cations can be determined by comparing the complexes FT-IR with that of the free azo-oxime. It explained that the azo oxime (H2L, 1) interacts with VO2+, Cu2+, and Fe3+ cations as a neutral ON bidentate chelator chelated via the oxygen atom of the phenolic hydroxyl oxygen and the oximatic nitrogen of the imine groups. This mode was confirmed by several remarks as follows.
(i)
The stretching frequency of the imine group was negatively shifted by 25–47 cm−1.
(ii)
The stretching band of the oximatic hydroxyl group appears at nearly the same position and the stretching band of the oximatic linkage (N-OH) shifts positively by 40–100 cm−1, indicating that the oximatic moiety participates in chelation in its protonated form through the nitrogen atom rather than the oxygen atom [27].
(iii)
The stretching band of the phenolic hydroxyl group appears at nearly the same position. This conclusion is underscored by the positive shift in the position of the bending υ(C-OH) band by 15–38 cm−1 [28].
(iv)
The new stretching frequencies in the ranges 510–580 and 473–483 cm−1 may be inductively related to the ν(Mš←O) and ν(M←N) successively [29].
According to the literature, aromatic C–H stretching vibrations generally appear around 3000 cm−1, whereas aliphatic C–H vibrations occur in the 2990–2800 cm−1 region. In the present study, the symmetric aromatic C–H stretching bands are observed in the 3000–3060 cm−1 range, whereas the asymmetric and symmetric aliphatic C–H stretching bands appear in the 2916–2980 cm−1 and 2850–2873 cm−1 regions, respectively [30]. Infrared spectra of the vanadyl and complex disclosed a medium band at 963 cm−1 attributed to ν(V=O) [31].

Anions Investigation

In the free acetate, there are two stretching vibrations at ca 1560 and 1416 cm−1, attributed to νs(CO22−) and νas(CO22−) respectively. The aetate anions can be bound to a metallic cation in one of three modes: unidentate, bidentate, or bridging. In an unidentate manner, νs(C=O) is larger than νs(CO22−) while ν(C-O) is lesser than νas(CO22−). In turn, the separation between the two νas(CO22−) and νs(CO2) is significantly greater in unidentate than in free acetate anion, but bidentate has less separation than in the free ion; however, in the bridging bidentate the two νas(CO22−) and νs(CO22−) are close to the free anion [31,32]. In the acetate complex (3), the symmetric and asymmetric stretching of the acetate anion is seen at 1540, and 1350 cm−1. The difference (190 cm−1) specifies that the acetate bonded to Cu2+ cation in a unidentate fashion [31,32]. The ands at ν5(1409), ν1(1345), and ν2(920) in the IR spectrum of nitrato complex (4) signify that the nitrate anion was directly attached to the metallic ion. The difference (ν5–ν1) is 64 cm−1, signifying that nitrate anion acts as a unidentate chelator. The sulfato complex (5) has two bands at 1190 and 1055 cm−1 in its infrared spectra, attributed to the mono-chelated sulfate group, as seen by their low conductivity value [31,33].

2.2.2. Nuclear Magnetic Resonance (NMR)

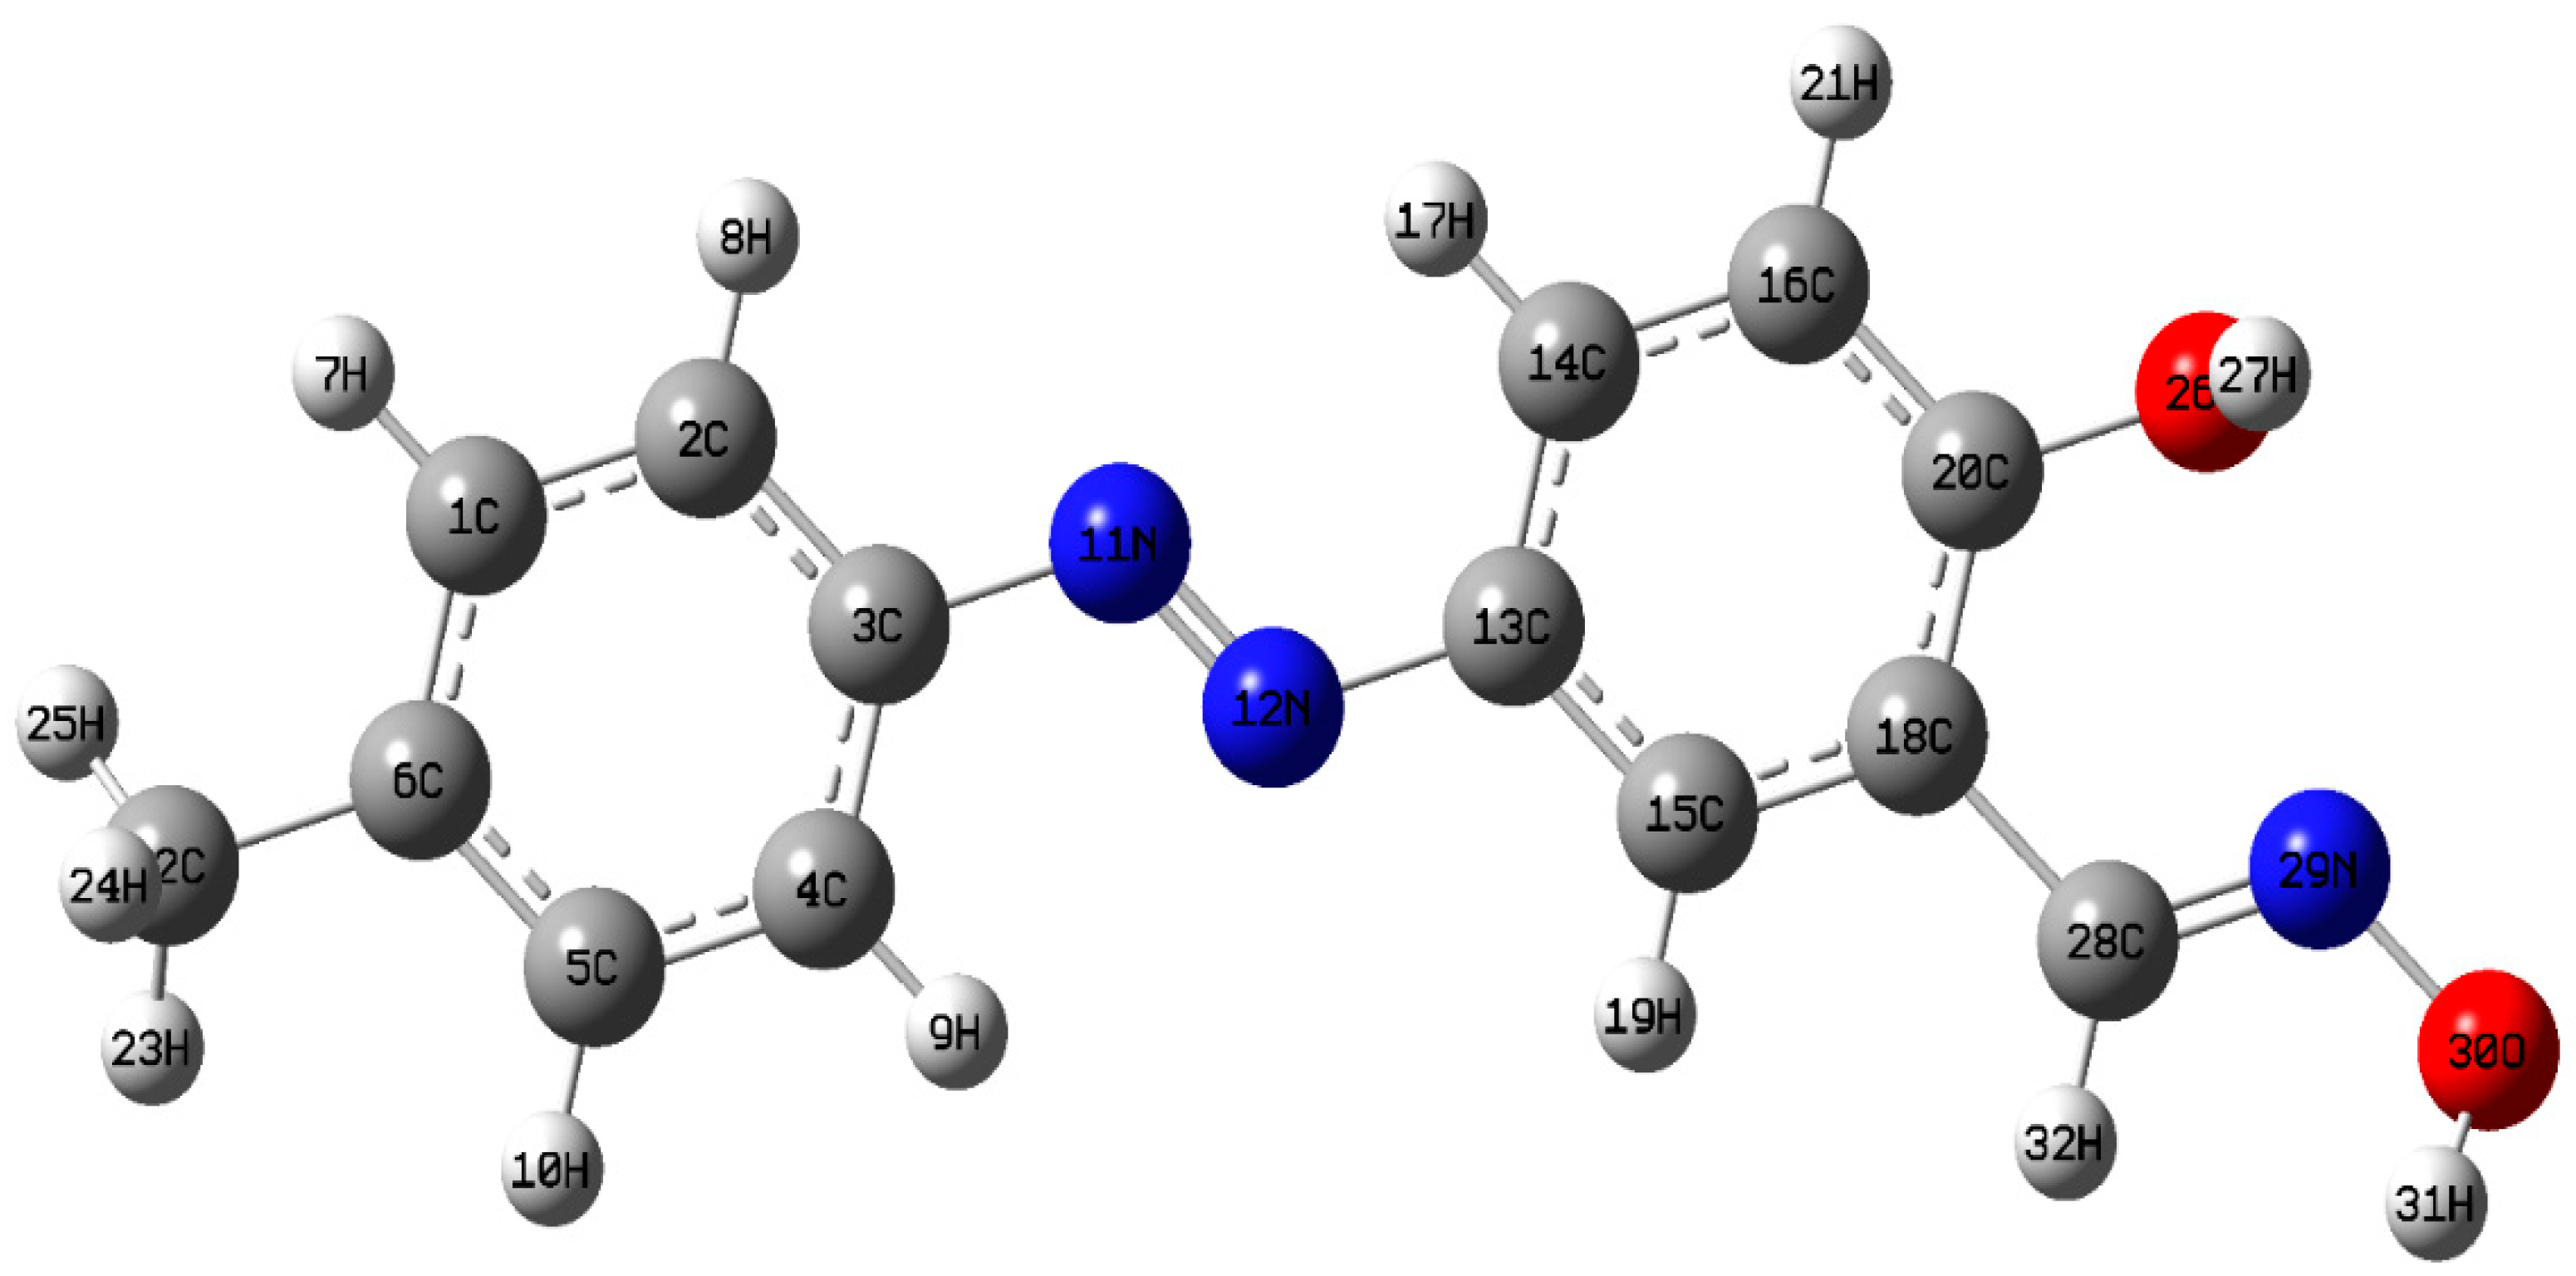
To identify the azo-oxime ligand’s coordination mode with the metallic cations and to obtain valuable insights about its structure, the azo-oxime’s NMR spectrum was measured in DMSO-d6, and its chemical shifts are explained and summarized in the experimental parts based on the atomic labeling shown in Figure 2. The azo-oxime’s 1H NMR spectrum (Figure S5) unveiled two slightly broad singlets at 11.54 and 11.06 ppm, corresponding to the protons of the phenolic and oximatic hydroxyl groups, respectively; both signals disappeared upon the addition of D2O. A downfield signal observed at 8.40 ppm was assigned to the imine proton. The overlapping CH signals appearing in the 8.11–7.16 ppm range were attributed to the aromatic protons of the two phenyl rings. The chemical shifts of H17, H8, and H9 (δ = 7.82 and 7.60 ppm) represent characteristic downfield values of protons positioned ortho to the diazinyl moiety. Furthermore, the downfield shift of the singlet for H21 (7.18 ppm) and the upfield shift for H19 (8.11 ppm) indicate the presence of a hydroxyl group at the meta and ortho positions relative to these protons, respectively [34,35]. Finally, the resonance observed at 3.41 ppm was assigned to the methyl protons. The 13C NMR spectrum of the azo-oxime ligand (H2L, 1) (Figure S6) displayed a range of distinct chemical shifts, supporting the proposed molecular structure. A resonance at 159.50 ppm was attributed to the carbon atom (C20) bonded to a hydroxyl group, while the oximatic carbon (C28) appeared at 145.46 ppm. The signals corresponding to carbons C2, C4, C14, and C15 (δ = 122.82, 122.71, 125.75, and 121.76 ppm) are characteristic of aromatic carbons linked to the azo (N=N) group, which is connected to C3 (δ = 150.50 ppm) and C13 (δ = 146.10 ppm). Additional peaks observed at 130.36, 141.37, 119.76, and 117.31 ppm were assigned to the aromatic carbons C1, C5, C6, C16, and C18, respectively. The signal at 21.46 ppm was attributed to the methyl carbon attached to the benzene ring.

2.2.3. Magnetic Moment and Electronic Absorption Spectroscopic (EAS) Measurements

The structure of the azo-oxime molecule contains multiple electron-donating sites, primarily the azo group (–N=N–), the oxime group (–CH=NOH), and the phenolic hydroxyl group (–OH). These functional groups possess lone pairs of electrons that can participate in chelation with metallic ions. The EAS of the ligand and its complexes in DMSO, along with the magnetic moment data of its solid complexes, are summarized in Table 1. The ligand spectrum exhibits three distinct absorption regions in the UV–visible range. The first set of bands, appearing at 265 and 287 nm, can be attributed to π → π* electronic transitions within the benzene ring and intra-ligand charge transfer transitions [36,37]. The second set of absorptions, observed at 297 nm and 341 nm, corresponds to n → π* transitions related to the oxime moiety [37]. The third prominent band at 359 nm is attributed to a π → π* transition involving the azo group electrons [36]. Additionally, a broader absorption band detected at 442 nm is allotted to a π → π* transition that extends over the entire conjugated system, predominantly representing a charge transfer process from the phenolic moiety to the azo-oxime framework [36]. The spectra of the metallic complexes revealed a noticeable shift in the n–π* transitions, which is likely attributed to the coordination of the phenolic and oximatic groups with the metallic cations. The VO2+ cation has a single electron in the d orbital, corresponding to the term symbol 2D. In an ideal octahedral crystal field, this electron occupies the t2g, resulting in a 2T2g ground state. Upon excitation this electron transferred to eg orbital, giving rise to a single absorption band associated with the 2T2g2Eg transition. However, because of the asymmetrical orientation of the V=O bond along one axis, the ideal octahedrally symmetry is reduced to rhombic (C2v) or tetragonal (C4v) symmetries, as the symmetry is further reduced. In the C4v symmetry, the 2T2g level undergoes splitting into 2B2 and 2E states, while 2Eg splits into 2B1 and 2A1. As a result, three electronic transitions are anticipated corresponding to bands in the ranges 900–725, 690–525, and 500–320 nm, which originate from 2B2 ground state to the excited states (2E, 2B1, and 2A1). If the symmetry is further reduced to C2v, the 2E level undergoes additional splitting into 2B1 and 2B2 sublevels, resulting in four observable bands [38,39]. For VO2+ complex (2), the EAS show off two characteristic bands at 686 and 944 nm ascribing to the transitions 2B2g2B1g(dxy → dx2y2) and 2B2g2Eg(dxy→dxz,dyz) correspondingly which is coherent with a tetragonal structure for the VO2+ ion (Figure 1a) [38,39,40]. The absence of additional observable transitions may be interfered with or overlapped by the intense bands associated with the azo groups, which correspond to π → π* and charge-transfer transitions. The calculated magnetic moment (μeff of 1.65 BM) agrees well with the expected spin-only value for a single unpaired electron [40].
In an octahedral crystal field, the ground state of six-coordinated Cu2+ cation (d9) is t2g6eg3 with 2Eg term, while the excited state is t2g5eg4 with 2T2g term. Therefore, the 2Eg2T2g is the expected electronic transition. However, the Jahn–Teller effect distorts the octahedral arrangement by either elongation or compression of the octahedron, leading to tetragonal symmetry where the 2T2g also splits into 2B2g(dxy) and 2Eg(dxz,dyz) levels, while the 2Eg is split into 2B1g(dx2−y2) and 2A1g(dz2) levels. Therefore, for tetragonal (D4h) symmetry, three bands are expected viz. 2B1g2A1g, 2B1g2B2g, 2B1g2Eg, which may appear around 1000, 650, and 500 nm sequentially [38,39,41]. Observing these theoretical effects in practice is often challenging because interference and the small energy differences between d-orbital levels make resolving discrete peaks difficult. In the case of Cu2+ complexes (3,4) spectra disclosed a very broad band centered at 922 and 900 nm ascribable to 2B1g2A1gdz2 (ν1) transitions and a shoulder at 485, 560 and 500, 575 nm ascribable to 2B1g2B2g(ν1) and 2B1g2Eg, transitions [39,42]. But for the Cu2+ complex (5) there are two weak bands at 457 and 550 nm allocated to 2B1g2A1g, 2B1g2B2g transitions, and a shoulder centered at 940 nm ascribable to 2B1g2B2g(ν1), transition. These data indicate that they have distorted octahedral or square planer geometries (Figure 1a,b). The magnetic moment values of the solid Cu2+ complexes (35) at room temperature ranged from 1.67 to 1.88 BM, which is compatible with one unpaired electron system. The Fe3+ cation with 3d5 configuration has 6S term symbol (S = 5/2, L = 0). In an ideal octahedral crystal field, these electrons occupy the t2g and eg orbitals in a high-spin configuration (t2g3eg2), resulting in a 6A1g ground state. Upon excitation, d-d electronic transitions happen from the 6A1g ground state to higher quartet states (S = 3/2) derived from electron within the d-manifold (t2g3eg2→t2g4eg1). The lowest such exciting states are 4T1g and 4T2g both of which in a strict symmetry are spin-forbidden (ΔS ≠ 0) and thus weak; however, coupling, spin–orbit effects, and symmetry distortion may render them noticeable. For the Fe3+ complex (6), the EAS displays two weak broad bands at 565 and 850 nm, which can be allotted to the transitions (ν1)6A1g(S)→4T1g(G) and (ν2)6A1g(S)→4T2g(G). These observations are coherent with a distorted octahedral geometry for Fe3+ ion (Figure 1c). The measured magnetic moment (μeff = 5.90 BM) matches well with the spin-only value expected for a high-spin Fe3+ ion containing five unpaired electrons.
Table 1. EAS of the azo-oxime ligand (H2L, 1) and its VO2+, Cu2+, and Fe3+ complexes (16).
CompoundBands (nm) in DMSOElectronic Transitionμeff
(BM)
Geometry
Azo-oxime 254, 265, 287, 298, 341, 359, 442π → π*, n → π*
VO2+ complex (2)260, 281, 384, 455, 686, 9442B2g(dxy) → 2Eg(dxz,dyz)(ν1),
2B2g(dxy) → 2B1g(dx2−y2)(ν2)
1.65Distorted
octahedral
Cu2+ complex (3)255, 284, 335, 417, 440, 485, 560, 9222B1g2Eg (dx2−y2 ← dyzdxz)
2B1g2A1g (dx2−y2 ← dz2)
2B1g2B2g (dx2−y2 ← dxy)
1.67Distorted
octahedral
Cu2+ complex (4)256, 287, 332, 382, 439, 500, 575, 9001.71
Cu2+ complex (5)262, 280, 336, 376, 425, 457, 550, 9401.88Square
planar
Fe3+ complex (6)260, 365, 412, 456, 565, 8502)6A1g(S) → 4T2g(G)
1)6A1g(S) → 4T1g(G)
5.91Distorted
octahedral

2.2.4. Electron Spin Resonance (ESR) Spectrum of VO2+ and Cu2+ Complexes

Further details regarding the geometries of polycrystalline VO2+ and Cu2+ complexes are provided by their ESR spectra at 25 °C on the X-band (9.8 GHz). The data is recorded in Table 2.
VO2+ Complex ESR
The VO2+ complex (d1, 51V, I = 7/2) ESR shows eight hyperfine lines, which correspond to the expected 2I + 1 = 8 splitting from the 51V nucleus confirming a mononuclear V4+ species with an axially anisotropic pattern (g > g|| and A|| >> A) consistent with a distorted octahedral structure and a dxy ground state [43]. Two sets of resonance components, parallel (g||) and perpendicular (g), indicate axial symmetry. The absence of nitrogen super-hyperfine splitting suggests the interaction occurs mainly between the electron spin and the ligand [44]. These findings support a deformed octahedral structure for VO2+ [45,46]. The molecular orbital coefficients, α2 and β2, were calculated using standard equations (Equations (1) and (2)) [40].
α 2 = 2.0023 g E x y 8 λ β 2
β 2 = 7 6 [ A P + A P + g 5 14 g 9 14 g e ]
where P = 128 × 10−4 cm−1, λ = 135 cm−1 and E is the electronic transition energy of 2B22E. The higher β2 value compared to α2 indicates that in-plane π-bonding is less covalent than in-plane σ-bonding [40,47]. The β2 value for the VO2+ complex is consistent with previously reported data for VO2+ complexes [46,47,48,49,50].
Cu2+ Complex ESR
The ESR spectra of Cu2+ complexes (35) exhibit anisotropic signals with g values of 2.232, 2.239, and 2.218; g values of 2.037, 2.031, and 2.025; and giso values of 2.102, 2.100, and 2.090. These values are characteristic of d9 systems with an axial symmetry corresponding to a d(x2y2) ground state, which is typical for Cu2+ complexes [51,52]. The observed g-values suggest that complexes (35) adopt either octahedral or square-planar geometries [53,54]. The ESR data show g > g > 2.0023, indicating a distorted environment around the Cu2+ ion [55]. The parameter G, defined as G = (g − 2)/(g − 2), provides information about exchange interactions [56]. When G < 4.0, significant exchange coupling occurs; when G > 4.0, the tetragonal axes are aligned parallel or only partially misaligned. For complexes (35), G values are 6.61, 8.27, and 9.32, indicating the presence of tetragonal axes. The ratio g/A serves as a stereochemical diagnostic: values between 105 and 135 indicate a square-planar geometry, while values between 150 and 250 cm−1 suggest a tetragonally distorted octahedral geometry [57]. For complexes (3) and (4), g/A values of 171.3 and 152.8 confirm tetragonally distorted octahedral structures, whereas complex (5) has a g/A value of 133.8, consistent with a square-planar geometry [56,58]. According to Kivelson and Neiman, the g value also reflects the nature of the metal–ligand bonding: g > 2.3 corresponds to predominantly ionic bonds, while g < 2.3 indicates primarily covalent bonding [59]. Since all Cu2+ complexes (35) exhibit g < 2.3, their Cu–ligand bonds are mainly covalent. Moreover, the g-values can be related to the parallel (k) and perpendicular (k⊥) components of the orbital reduction factor (k) using established equations (Equations (3)–(5)) [60,61,62,63].
k 2 = g 2.0023 Δ E x y / 8 λ °
k 2 = g 2.0023 Δ E x z / 2 λ °
k 2 = k 2 + 2 k 2 / 3
Here, λ0 is the spin–orbit coupling constant for the free Cu2+ ion (−828 cm−1), while ΔExy and ΔExz correspond to the electronic transitions 2B1g2Eg and 2B1g2B2g, respectively. The values of k2, k2, and k2 indicate that k2 < k2, confirming that the ground state of complexes (3) and (4) is 2B1g. Furthermore, the orbital reduction factor k reflects the covalent or ionic nature of the Cu2+ environment: k < 1 corresponds to a predominantly covalent environment, whereas k > 1 indicates an ionic character. The K values for complexes (35) are 0.70, 0.662, and 0.634, respectively, all below unity, indicating a covalent environment consistent with the g-value data [62,63,64]. The in-plane σ-bonding parameter, α2, can be evaluated using the following equation (Equation (6)) [51,54].
α 2 = g 2.0023 + 3 7 g 2.0023 A P + 0.04
Here, P represents the free-ion dipolar parameter, equal to 0.036 cm−1. If α2 = 1, the bond is purely ionic, whereas α2 = 0.5 corresponds to a purely covalent bond, assuming P = 0.036 cm−1 and K = 0.43 [51,54]. For Cu2+ complexes (35), the calculated α2 values are 0.647, 0.696, and 0.726, indicating a predominantly covalent character for the in-plane σ-bonding [65]. The γ and β coefficients, which describe the out-of-plane and in-plane π-bonding contributions, respectively, can be evaluated using the following equations (Equations (7) and (8)) [60].
α2γ2 = K2
α2β2 = K2
The Cu2+ complexes’ (35) γ2 values are 0.96, 0.89 and 0.82, while the β2 values are 0.67, 0.50 and 0.42 successively, suggesting that the out-of-plane and in-plane π-bonding are covalency in natura [58,60].
Table 2. ESR parameters of VO2+ and Cu2+ complexes.
Complex No.VO2+Cu2+(3)Cu2+(4)Cu2+(5)
g1.9152.2322.2392.218
g1.9742.0372.0312.025
giso (a)1.9542.1022.1002.090
A × 10−4 (cm−1)143.0136146166
A × 10−4 (cm−1)46.138.128.137.3
Aiso × 10−4 (cm−1)79.168.765.478.1
g/A (cm) -171.3152.8133.8
G (b) -6.628.279.32
ΔExy (cm−1) 10,59317,85717,39118,181
ΔExz (cm−1) -20,61820,00021,881
K 2-0.6200.6220.593
K 2-0.4330.3460.306
K2 0.4960.4380.402
K2-0.6580.5880.554
K --0.7000.6620.634
α20.8840.6470.6960.726
β20.9740.670.500.42
γ -0.960.890.82
a giso = (2g + g)/3, b G = (g − 2)/(g − 2).

2.2.5. Thermogravimetric Analysis

The thermogram showed several stages of breakdown between 30 and 523 °C, culminating in the formation of residues made of metal oxide. Table 3 illustrates the mass loss correlation between the calculated and recommended formulae. The TG behaviors confirmed that the complexes of VO2+, Cu2+, and Fe3+ disintegrate in three or four phases, which are explained as follows:
(i)
The initial stage observed in the TGA curve of the Fe3+ complex occurred between the temper 50 and 130 °C, showing a loss of mass equal to 7.40% (calcd. 7.64%). This weight reduction is attributed to the removal of two hydrated water molecules.
(ii)
The elimination of coordinated water molecules between 130 and 260 °C is the second stage shown in the TGA curves of VO2+, Cu2+ and Fe3+ complexes. This is accompanied by a mass loss that ranges from 4.33% (calcd. 4.16%) to 7.99% (calcd. 7.93%). As indicated in Table 3, this weight reduction is ascribed to the release of one or two coordinated water molecules.
(iii)
The third stage detected in the TGA curves of VO2+, Cu2+ and Fe3+ complexes corresponds to the elimination of anions between 225 and 360 °C, accompanied by a loss of mass ranges from 21.44% (calcd. 21.32%) to 25,98% (calcd. 25.89%). This weight reduction is ascribed to the release of Cl, NO3, OAc or SO42− anions, as presented in Table 3.
(iv)
The final stage represents the complete decomposition of VO2+, Cu2+ and Fe3+ complexes through the removal of the organic moiety, leading to the creation of metal oxide residues. This process happens between 360 and 523 °C accompanied by a mass loss ranging from 48.44% (calcd. 49.07%) to 54.81% (calcd. 55.29%).
Table 3. The thermogravimetric analysis (TG) of VO2+, Cu2+, and Fe3+ complexes.
No.StepTemp. Range
°C
Weight Loss
Found (Calcd)
AssignmentComposition of
the Residue
VO2+ complex (2)1st155–2507.99 (7.93)Lose two molecules of coordinated water[(H|2L)VO(SO4)]
2nd250–35021.44 (21.13)Lose one sulphate ion (H2SO4)[(H|2L)VO]
3rd350–43549.39 (50.92)Breakdown of the complex forming V2O5V2O5
Cu2+ complex (3)1st155–2457.73 (7.62)Lose two molecules of coordinated water[(H|2L Cu(OAc)2]
2nd255–33024.66 (25.14)Lose two acetate ions (CH3COO)[(H|2L Cu]
3rd330–50549.58 (50.43)Breakdown the complex forming CuOCuO
Cu2+ complex (4)1st145–2307.14 (7.52)Lose two molecules of coordinated water[(H2L)Cu(NO3)2]
2nd260–30025.98 (25.89)Lose two nitrate ions (HNO3)[(H2L)Cu]
3rd310–41049.11 (49.97)Breakdown the complex forming CuOCuO
Cu2+ complex (5)1st165–2254.31 (4.16)Lose one molecule of coordinated water[(H2L)Cu(SO4)]
2nd235–32022.24 (22.18)Lose one sulphate ion (H2SO4)[(H2L)Cu]
3rd320–47554.81 (55.29)Breakdown the complex forming CuOCuO
Fe3+ complex (6)1st50–1307.40 (7.64)Lose two molecules of hydrated water[(L)FeCl3(H2O)]
2nd130–2253.33 (3.82)Lose one molecule of coordinated water[(L)FeCl3]
3rd225–36022.01 (22.56)Lose three chloride ions (3HCl)[(L)Fe]
4th360–52348.44 (49.05)Breakdown of the complex forming Fe2O3Fe2O3

2.3. Molecular Modeling

2.3.1. Optimization of Geometry

Figure 2 and Figures S7 and S8 showed the ideal geometries of the azo-oxime (H2L, 1) and its VO2+, Cu2+, and Fe3+ complexes. The selected bond lengths and angle values for azo-oxime (H2L, 1) and its VO2+, Cu2+, and Fe3+ complexes (Table S1) verified that the VO2+, Cu2+, and Fe3+ complexes have a hexa-chelated arrangement, where the azo-oxime chelator (H2L, 1) connects the VO2+, Cu2+, and Fe3+ ions via oximatic nitrogen of protonated oxime group and protonated phenolic oxygen atoms. The data on bond lengths discovered a slight shortening in the length of the 28C=N29 bond and an elongation of the bond lengths 30C-O26 in complexes, confirming that these bonds participate in linking with VO2+, Cu2+, and Fe3+ centers. In the optimum structures of VO2+, Cu2+, and Fe3+ complexes, the bond length between the oximatic nitrogen and the phenolic oxygen atoms with VO2+, Cu2+, and Fe3+ cations is found to range from 2.75 to 2.80 A°. The bond length between protonated phenolic oxygen atoms with VO2+, Cu2+, and Fe3+ cations is found to range from 2.71 to 2.77 A°. In hexa-coordinated Cu2+(3,4) complexes, the four equatorial positions were populated by phenolic oxygen, oximatic nitrogen atoms, and water molecules, while the two axial locations were inhabited by two acetate or nitrate anions. In the case of VO2+, the complex has four equatorial sites, which are occupied by an oximatic nitrogen atom, a phenolic oxygen atom, a water molecule, and sulfate anions, while the two axial locations were occupied by the water molecule and the vanadyl oxygen. In the Fe3+ complex, the four equatorial sites were occupied by oximatic nitrogen atoms, a phenolic oxygen atom, a water molecule, and a chloride anion, whereas the two axial locations were occupied by chloride ions. In the tetra-coordinated Cu2+ complex (5), the four-square sites are occupied by a oximatic nitrogen atom, phenolic oxygen atom, water molecule, and sulfate anion. The geometry of this four-coordinate complex was evaluated using the geometric index τ4 estimated by τ4 = 360° − (a + b)/141°, whereas b and α are the two largest valence angles of the chelation center. The literature states that the τ4 values equal 0 for square planar geometry and the τ4 values equal 1 for tetrahedral geometry. In contrast, the range for intermediate geometry, which includes seesaw and trigonal pyramidal shapes, is 0 to 1. The τ4 value for the tetra-coordinate Cu2+ complex (5) is equal to 0.0497. This conclusion proves that the Cu2+ complex (5) has a predominantly square planar structure [66,67].

2.3.2. Molecular Parameters

The quantum chemical properties of the organic and organometallic compounds, such as the energies of the lowest unoccupied molecular orbital (ELUMO) and the highest occupied molecular orbital (EHOMO), were ascertained using computational computations. These parameters were computed using the following formulas (Equations (9)–(15)), and Table 4 presents the findings [68,69,70].
Ionization potential (I) = −EHOMO
Electron affinity (A) = −ELUMO
ΔEgap (Energy gap) = ELUMO − EHOMO
( Electronegativity )   χ = E L U M O + E H O M O 2
η ( h a r d n e s s ) = E L U M O E H O M O 2
σ ( s o f t n e s s ) = 1 η
( Reactivity   index )   Δ N max = μ η
A molecule’s ability to donate and take electrons is reflected in the EHOMO and ELUMO quantum chemical descriptors, respectively. Frontier molecular orbital (FMO) theory states that interactions between the HOMO and LUMO of interacting species have a major role in determining chemical reactivity. Larger electron-donating capacity toward acceptors, such as metal cations with empty orbitals, is indicated by a larger EHOMO, whereas higher electron-accepting potential is indicated by a lower ELUMO. For the azo-oxime (H2L, 1), the calculated EHOMO is comparatively high, signifying a substantial electron donation to the empty d-orbitals of Cu2+, VO2+ and Fe3+, and accordingly favorable chelation. The intrinsic stability of the compounds is confirmed by the negative orbital energies of the HOMO, LUMO, and nearby orbitals. According to orbital analysis, the LUMO is widely delocalized over the whole molecule, whereas the HOMO is primarily localized on the azo group with little contributions from the phenyl and toluene carbon atoms (Figure 3). The distribution of LUMO and HOMO iso-densities VO2+, Cu2+, and Fe3+ complexes is nearly identical in all complexes. HOMO is dispersed on the azo linkage, involving some carbon atoms of toluene and phenyl or on a coordination center involving coordinated atoms, while LUMO is spread on the azo moiety, involving the phenyl and toluene carbon atoms or on chelation sites (Figures S7–S12). The HOMO-LUMO energy gap (ΔEgap), a crucial molecular stability indicator, can be used to build a theoretical model for evaluating structural and conformational stability in molecular systems. The comparatively high energy gap of azo-oxime (H2L), (ΔEgap = 3.66) signifies a strong inherent stability and a favorable tendency to chelate with Cu2+, VO2+ and Fe3+ cations. On the other hand, compared to the free ligand, the resultant Cu2+, VO2+ and Fe3+ complexes show lower energy gaps (ΔEgap = 2.10–3.06 eV, Table 4), indicating higher chemical reactivity and decreased stability. These findings are corroborated by global reactivity descriptors. Among the compounds under study, azo-oxime has the highest ionization potential (IP) and lowest electron affinity (EA), which are derived from HOMO and LUMO energies. This indicates greater resistance to oxidation and a lesser propensity to take electrons. On the other hand, the Cu2+, VO2+ and Fe3+ complexes show higher EAs and lower IPs, which are in line with increased reactivity. The chemical stability and reactivity can also correlate to absolute hardness (η) and absolute softness (σ). The free ligand is the hardest species (1.83 eV) while the Cu2+, VO2+ and Fe3+ complexes are softer (η = 1.80–1.01 eV, σ = 0.56–0.99 eV (Table 4), proving that metallic chelation improves the reactivity of azo-oxime (H2L) and reduces its hardness. These results are completely in line with the patterns shown in the global reactivity descriptors and HOMO-LUMO gaps.
η   ( hardness ) = E L U M O E H O M O 2
σ   ( softness ) = 1 η
In complexation systems, the metal cation is a Lewis acid and the chelator is a Lewis base. Chelators with soft base character are very good at creating stable complexes because metal cations are regarded as soft acids. As a result, chelators with appropriate global softness (σ) values have a strong tendency to coordinate effectively with metal cations. The ligand’s chemical potential (µ) provides more evidence for this behavior. As illustrated in Table 4, The azo-oxime has the largest chemical potential (µ = −4.13 eV), suggesting a strong propensity to interact with metallic cations.
μ (Chemical potentials) = −χ
The stabilizing energy that a system obtains when it receives an extra electronic charge from its environment is measured by ΔNmax. The chemical potential (µ) of the molecule determines the strength and direction of this charge transfer. When an electrophile acquires an electronic charge, it stabilizes itself by reducing its energy. As a result, an electrophilic species’ chemical potential is negative, which is in line with the values shown in Table 4.
( Reactivity   index )   Δ N max = μ η
Based on μ and η, Parr et al. proposed the concept of electrophilicity index (ω, Equation (20)) [71,72], where a lower ω reflects greater nucleophilic character. The azo-oxime ligand H2L shows the lowest ω (4.65 eV) among the series, consistent with its nucleophilic character, while the VO2+, Cu2+, and Fe3+ complexes show markedly higher values (4.87–14.29 eV, Table 4), indicating that metal coordination substantially reduces the ligand’s nucleophilicity.
( Electrophilicity   index )   ω = μ 2 2 η = ( IP + IA ) 2 4 ( IP IA )
In order to provide a more thorough assessment of a system’s electrophilic behavior, Gázquez et al. developed the parameters of electro-donating power (ω, Equation (21)) and electro-accepting power (ω+, Equation (22)), which are comparable to the electrophilic index (ω) [73]. Chattaraj et al. [74]] followed by comparing ω and ω+ using the notion of net electrophilicity (ω±, Equation (23)) [74]. These parameters reflect the overall tendency of a system to accept electrons in relative to its capability to provide them. The electrophilic and nucleophilic descriptors obtained from DFT can be used to evaluate the reactivity trends of the azo-oxime (H2L) and its Cu2+, VO2+ and Fe3+ complexes based on the quantum chemical parameters in Table 4. The HOMO and LUMO energies illustrate that coordination with metallic ions typically results in lower orbital energies than those of the free ligand, indicating less reactivity and increased molecule stability. The energy gap (ΔE) gradually dropped from 3.66 eV for azo-oxime to 2.01 eV for the Fe3+ complex, recommending that Fe3+ improves electron delocalization and charge transfer interactions, which can increase the reactivity of substance. This trend is further supported by the electrophilic index (ω) and associated parameters (ω+ and ω). The azo-oxime (H2L, 1) has the lowest ω± value (9.77 eV), whereas the Fe3+ complex has the highest ω± value (28.84 eV), implying the most electrophilic property. This suggests that the molecules’ capacity to receive electrons is much improved by metal coordination, especially with Fe3+. Additionally, the electro-accepting power (ω+) increases remarkably from 2.82 eV (H2L) to 11.74 eV (Fe3+). Concurrently, the electro-donating power (ω) rises from 6.95 eV to 17.10 eV, implying that chelation improves both electron donation and acceptance capacities.
( Electron   accepting   power )   ω + = ( IP + 3 EA ) 2 16 ( IP EA ) = ( E H O M O + 3 E L U M O ) 2 16 ( E L U M O E H O M O )
( Electron   donating   power )   ω = ( 3 IP + EA ) 2 16 ( IP EA ) = ( 3 E H O M O + E L U M O ) 2 16 ( E L U M O E H O M O )
(Net Electrophilicity) ω± = ω + ω+
Domingo et al. [75] developed the nucleophilic index (NNu, Equation (24)), which quantifies a system’s nucleophilic ability based on the energy of the highest occupied molecular orbital (HOMO) obtained from DFT calculations, as opposed to the electrophilic index (ω). Here, E HOMO TCE and E HOMO Nu denote to the HOMO energies of the tetracyanoethylene (TCE, −8 eV) and nucleophile correspondingly. The estimated quantum chemical parameters in Table 4 offer important information about the electrophilic and nucleophilic properties of azo-oxime and its VO2+, Cu2+, and Fe3+ complexes. According to Kiyooka’s intrinsic reactivity index (IRI), Domingo’s nucleophilic index (NNu) and related electrophilicity index (ω), discrete tendencies in reactivity can be noted on chelation. The free azo-oxime (H2L) has EHOMO of 5.96 eV, with a moderate nucleophilic index (NNu) equal to 2.04 eV and IRI of 2.25 eV, implying balanced electron-accepting and -donating capabilities. Upon chelation with metallic ions, the energy gap (ΔE) gradually decreases (from 3.66 eV for azo-oxime (H2L) to 2.01 eV for Fe3+ complex), and reflects improved electronic delocalization and increased chemical softness (σ). The VO2+, Cu2+, and Fe3+ complexes show comparable electronic characteristics, with EHOMO ranged from −5.98 to −6.37 eV and NNu ranged from 2.02 to 1.63 eV correspondingly, signifying comparatively stable and moderately nucleophilic species. The Cu2+ complex shows higher IRI (5.33 eV) and a lower NNu (1.63 eV), implying improved electrophilic character due to intense ligand–metal interactions. Among all synthetics, the Fe3+ complex exhibits the lowest ΔE (2.01 eV), the highest IRI (5.33), and the highest electrophilicity index (ω = 14.29 eV), signifying strong chemical reactivity and electrophilic behavior.
N Nu = E HOMO Nu E HOMO TCE
The high softness (σ) and chemical potential (μ) values for Fe3+ complex are further confirmed by its strong electron-accepting tendency. This is coherent with concept of Ayers electrofugality, which states that the enhanced leaving-group capability is correlated with higher electron affinity (EA) and ionization potential (IP). Overall, it is evident from the trend of NNu (Fe3+ < Cu2+(5) < Cu2+(4) < Cu2+(3) < VO2+ < H2L) and the inverse trend of ω Fe3+ > Cu2+(5) > Cu2+(4) > Cu2+(3) > VO2+ > H2L clearly demonstrate that metallic chelation significantly increases the azo-oxime’s electrophilic nature, with Fe3+ complex being the most reactive and electron-deficient species.
To simultaneously describe the nucleophilic and electrophilic behaviors with a single parameter, Kiyooka et al. [76] suggested the intrinsic reactivity index (IRI) as a standard measure of chemical activity. Moreover, Ayers et al. [77] suggested additional two reactivity indices nucleofugality (ΔEn) and electrofugality (ΔEe) that can be employed to forecast the leaving groups’ behavior through chemical reactions. These indices show that a leaving group’s electron-donating (escape) and electron-accepting properties can be assessed using its ionization potential (IP) and electron affinity (EA) (Equations (25)–(27)). According to the information shown in Table 4, the electron affinity (EA) values rise from 2.30 to 4.36 eV, while the ionization potential (IP) values range from 5.96 to 6.37 eV.
Computational analysis identifies the Fe3+ complex as the most chemically active species among the studied compounds. Specifically, it exhibits the highest ionization potential (I) and electron affinity (A), which, according to Ayers’ interpretation, characterizes it as both an exceptional nucleofuge (exhibiting extreme electron-accepting capability) and a strong electrofuge (exhibiting higher electron-donating ability on detachable). This behavior is further substantiated by its significantly high electrophilicity index ω = 14.29 eV) and intrinsic reactivity index (IRI = 5.33 eV), highlighting a pronounced propensity for electron transfer processes. In contrast, the free azo-oxime ligand displays the lowest values for I, A, and ΔEe, reflecting its weaker leaving-group character and greater kinetic stability. The established trend for ionization potential, electron affinity, and electrophilicity follows the order: Fe3+ > Cu2+(5) > Cu2+(4) > Cu2+(3) > VO2+ > H2L. This hierarchy confirms that metal coordination—particularly with Fe3+ —drastically reduces the energy gap (ΔE = 2.01 eV), thereby transforming the azo-oxime into a highly reactive and electron-responsive system.
The reactivity descriptors derived from the data disclose a consistent pattern in electrical behavior throughout the azo-oxime and its metallic complexes. The IRI rises noticeably on metallic coordination, going from 2.25 eV for azo-oxime to remarkably higher values in the complexes, especially the Fe3+ complex, which has the greatest IRI (5.33 eV), indicating stronger electronic polarization and increased overall reactivity on metallic binding. The ΔEe displays a similar upward pattern, rising from 8.29 eV for azo-oxime to 13.51 eV for the Fe3+ complex, demonstrating that the chelation of Fe3+ notably stabilizes electron removal operations. On the other hand, the ΔEn still relatively low for azo-oxime and its VO2+ and Cu2+ complexes (0.030, 0.048, 0.059, 0.097 and 0.396 eV) while increasing to 2.79 eV for the Fe3+ complex. This sharply enhancement reveals that Fe3+complex has a great resistance to nuclear attacks in comparison to other ions. Overall, the data show that metallic coordination increases both nucleophilic and electrophilic stability, with Fe3+ creating the least reactive and most electronically robust and complex in the series.
Δ E e = ( 3 IP EA ) 2 8 ( I A ) = ( 2 η + μ ) 2 4 η  
Δ E n = ( 3 EA IP ) 2 8 ( IP EA ) = ( 2 η μ ) 2 4 η
I R I = I + A IP EA
Table 4. The calculated quantum chemical parameters of azo-oxime and its VO2+, Cu2+, and Fe3+ complexes by DFT/B3LYP/(6-311G(d,p)).
CompoundsH2LVO2+(2)Cu2+(3)Cu2+(4)Cu2+(5)Fe3+(6)
EHOMO (eV) −5.96−5.98−5.99−6.11−6.31−6.37
IP (eV)5.965.985.996.116.316.37
ELUMO (eV)−2.30−2.38−2.43−2.51−3.16−4.36
EA (eV)2.302.382.432.513.164.36
ΔE (eV)3.663.603.563.603.152.01
c (eV)4.134.184.214.314.735.36
η (eV)1.831.801.781.801.581.01
σ (eV−1)0.550.560.560.560.630.99
µ (eV)−4.13−4.18−4.21−4.31−4.73−5.36
ω (eV)4.654.874.985.177.1114.29
s (eV−1)0.270.280.280.280.320.50
Nmax2.252.332.372.403.005.33
ω+ (eV)2.823.003.093.404.9411.74
ω (eV)6.957.187.307.729.6717.10
ω± (eV)9.7710.1810.4011.1214.6028.84
NNu (eV)2.042.022.011.921.691.63
IRI (eV)2.252.332.372.473.005.33
ΔEe (eV)8.298.418.478.749.8613.51
ΔEn (eV)0.0300.0480.0590.0970.3962.790
Total energy (a.u.)−856.1−2727.3−3106.5−3210.03272.13576.9
Dipole moment 4.3726.346.134.8919.8012.58
In addition, the energetic properties of synthesized compounds were estimated using DFT calculations at the B3LYP/6-311G(d,p) level, and the results are presented in Table 4. The calculated total energies clearly demonstrate that the predicted metallic complexes are energetically more stable than the parent azo-oxime (H2L), indicating that complex formation is thermodynamically favorable. This enhanced stability can be attributed to strong metal–ligand interactions arising from effective coordination between the donor sites of the azo-oxime ligand and the metal cations. Moreover, the dipole moments of the complexes (6.13 and 26.34 Debye) are significantly higher than that of the parent azo-oxime (4.37 Debye), reflecting substantial charge redistribution and increased polarization upon chelation. These results highlight the pronounced effect of metallic coordination on the stability and electronic structure of the resulting complexes.

2.3.3. Molecular Electrostatic Potential (MEP)

MEP maps (Figure 3 and Figures S15–S19) were generated using DFT calculations to analyze the charge distribution and regions of variable electrostatic potential in the ground state. The molecular electrostatic potential, V ( r ) , is defined by the following expression.
V r = A Z A R A r ρ ( r ) ( r r ) d ( r )
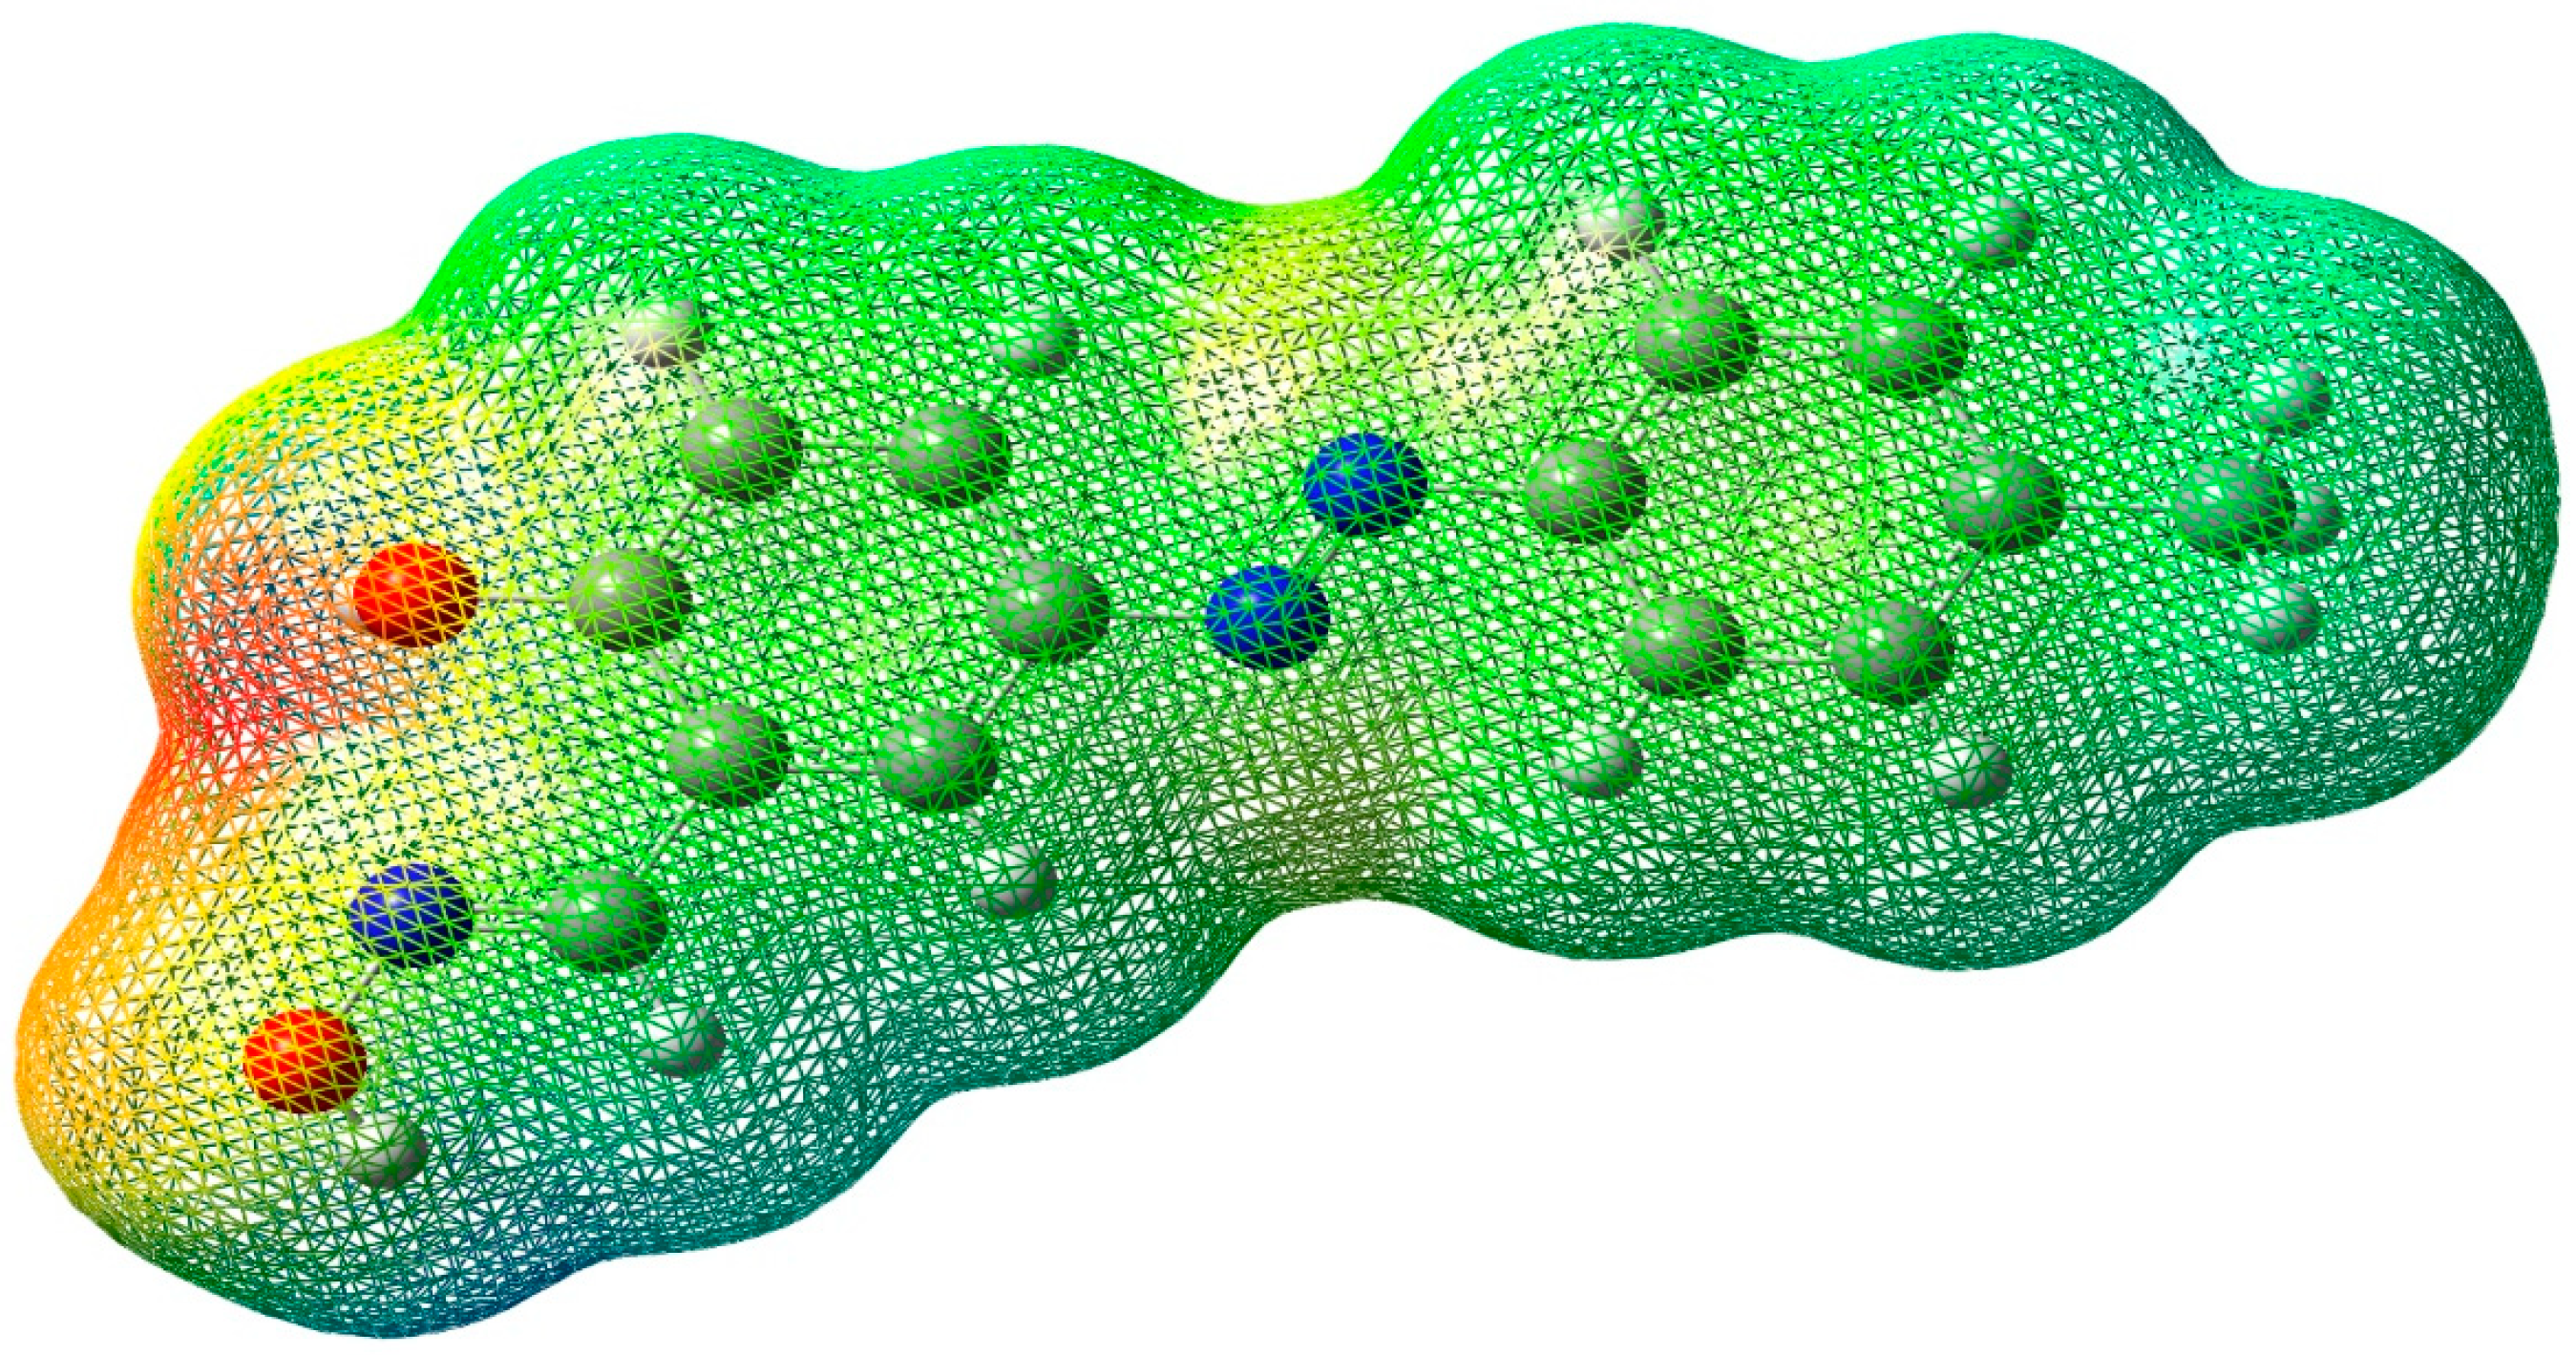
where Z A is the nuclear charge of an atom A , R A represents the position of the nucleus A , and r denotes the point in space at which the potential is evaluated. The function ρ r corresponds to the electron density at the point r , which serves as a dummy integration variable over the entire molecular electron density [78]. This expression enables simultaneous consideration of nuclear attraction and electronic repulsion effects, providing a comprehensive description of the molecular charge environment. The resulting MEP surfaces were visualized using color-coded maps (Figure 4 and Figures S15–S19), in which the electrostatic potential varies from negative (red, orange, and yellow) to positive (blue), with green regions corresponding to near-neutral potential. Regions of negative potential indicate high electron density and are therefore associated with nucleophilic behavior, while positive potential regions represent electron-deficient sites susceptible to electrophilic attack. As such, MEP analysis serves as a reliable predictor of reactive sites and preferred coordination centers within the molecular structure.
For the azo-oxime (H2L), the MEP map (Figure 4) reveals that the most negative electrostatic potential is localized around the oxygen atoms of the phenolic and oximatic functionalities, reflecting their strong electron-donating character. In contrast, carbon and hydrogen atoms predominantly exhibit neutral to positive potential regions. The accumulation of negative charge density on these oxygen atoms identifies them as the most favorable coordination sites for metal ions [79,80]. This electronic distribution supports the experimentally observed coordination behavior toward VO2+, Cu2+, and Fe3+ cations and significantly influences charge redistribution, polarization, and charge-transfer processes, thereby modulating the optical absorption characteristics and dielectric properties of the ligand and its metal complex films relevant to photovoltaic performance. From an electronic-structure perspective, the MEP distribution is closely correlated with the frontier molecular orbital (FMO) characteristics and optical response of the system. Electron-rich regions contribute significantly to nonbonding (n) and π orbitals, which participate in ππ* and nπ* transitions observed in the UV–Vis spectra. Upon complexation, the negative potential regions—particularly those associated with oxygen donor atoms—facilitate efficient charge-transfer interactions between the ligand and metal centers. These interactions lead to enhanced electronic delocalization and reduced HOMO–LUMO energy gaps, which are commonly manifested as bathochromic (red) shifts in absorption maxima. Conversely, electron-deficient (blue) regions indicate sites that may stabilize excited-state electron density, impacting the molecule’s light absorption intensity and optical band gap. In the VO2+, Cu2+, and Fe3+ complexes, the overall positive electrostatic potential favors metal-to-ligand charge transfer (MLCT), in agreement with the optical transitions observed in the UV–Vis spectra. The correspondence between molecular electrostatic potential (MEP) regions and electron-donating and electron-accepting sites accounts for the enhanced electronic delocalization within these systems, which in turn induces shifts in absorption wavelengths and modifies the optical response. Accordingly, MEP analysis serves not only to identify reactive regions but also to elucidate the relationship between molecular charge distribution and optical behavior, thereby linking quantum chemical features with spectroscopic properties.

2.3.4. Natural Bond Orbital (NBO) Analysis

NBO analysis offers a practical framework for researching charge transfer and conjugative effects in molecular systems and is a useful tool for analyzing intra- and intermolecular bonding as well as interactions between bonds [79,81,82,83]. Different donor–acceptor interactions and the accompanying stabilization energies inside the NBO basis were assessed using the second-order Fock matrix [79,84]. In these interactions, the electron density delocalizes from a donor (filled) NBO, which corresponds to the localized orbitals of the idealized Lewis structure, into an acceptor (empty) non-Lewis orbital. The stabilization energy, E(2), linked to electron delocalization between each acceptor NBO(j) and donor NBO(i) is computed as:
E ( 2 ) =   Δ E i j   = q i F 2 ( i j ) ε j ε i
where Fij is the Fock matrix element between the natural bonding orbitals, qi is the donor-orbital occupancy, and εj and εi are diagonal elements of orbital energies. The magnitude of the stabilization energy E(2) reflects the strength of interaction between electron donors and acceptors: higher E(2) values signify strong donor-to-acceptor interactions and a greater degree of conjugation in the system. The NBO 3.1 program developed in Gaussian 09 was used to calculate the azo-oxime’s NBO at the DFT/B3LYP/6-311G(d,p) level of theory [85]. This analysis was achieved to examine electron-density delocalization, rehybridization, and intramolecular interactions within the molecule, with the results summarized in Table S3. Second-order perturbation theory was used to calculate stabilization energies in order to investigate intramolecular interactions in more detail. Table S4 displays the specific findings from this second-order perturbation analysis of the Fock matrix at the B3LYP/6-311G(d,p) level for azo-oxime. Stabilization energies greater than 3 kcal/mol have been selected for Table S4. The main hyper-conjugative and π → π* interactions stabilizing the ligand are highlighted by this second-order perturbation analysis (Table S4). The substantial delocalization within the ring is reflected in the usual contribution of 15–25 kcal/mol from the aromatic π → π* interactions between adjacent C–C bonds. Strong intramolecular hyper-conjugative interactions between electrons in the azo-oxime molecule result in higher energy contributions from C2-C3→C1-C6 (17.43 kcal/mol), C4-C5 (20.73 kcal/mol); C1-C6→C2-C3 (22.81 kcal/mol) C4-C5(17.56 kcal/mol); C4-C5→C1-C6 (23.42 kcal/mol), C2-C3 (19.33 kcal/mol); C13-C15→N11-N12(15.03 kcal/mol), C14-C16(20.40 kcal/mol), C18-C20(19.29 kcal/mol); C18-C20→C13-C15(21.76 kcal/mol), C14-C16(17.12 kcal/mol), C28-N29(11.47 kcal/mol); C14-C16→C13-C15 (19.67 kcal/mol), C18-C20 (22.70 kcal/mol). These interactions strengthen the aromatic system’s conjugated structure. Remarkably, the π orbitals of the azo group (N11=N12) and the π* orbitals of the nearby C-N and aromatic bonds exhibit the strongest hyper-conjugative effects, with stabilization energies as high as 30–36 kcal/mol, suggesting widespread resonance delocalization throughout the N=N and nearby π systems. Significantly, N11-N12 contribute to the antibonding orbitals of nearby π-bonds of C13–C15p* and C2–C3p* with stabilization energies 36.51 and 30.07 kcal/mol, correspondingly denoting to considerable resonance delocalization through the azo linkage 11N=N12 and nearby π bonds. The electron richness of the oxime moiety is further enhanced by lone-pair→π* interactions of O26 and O30 donating into π*-orbitals of adjacent 18C=C20 and 28C=N29 bonds, which contribute significantly by 4.37 and 20.56 kcal/mol. Additionally, lone-pair→π* interactions of O26 and O30 donating into π*-orbitals of adjacent 16C=C20, 18C=C20, and 28C=N29 bonds. The strong electronic connection between the oxime moiety and the aromatic moiety is confirmed by the very substantial stabilization of πC28–N29→π*C18–C20, which was equal to 72.18 kcal/mol.
The azo-oxime chelator’s delocalization patterns and electronic structure are deeply revealed by the NBO analysis. The analysis of the σ-bond framework reveals that the aromatic C-C bonds are characterized by nearly symmetrical electron sharing between the two bonded carbons, with each atom contributing between 48.63 and 51.37% to the σ-bond and corresponding hybridizations ranging from sp1.63 to sp1.85 consistent with planar aromatic systems. This approves that the phenyl ring retains a high degree of resonance stabilization. The aromatic C–H bonds show the expected sp2-carbon/high-s-character-hydrogen pattern, consistent with the σ-framework described above. The strong dominated p-nature of the N11=N12 bond which is necessary for charge delocalization through the chelator molecule, is confirmed by the substantial p character on both nitrogen atoms in the azo-linkage (99.76% p in the π component). Moreover, the adjacent C-N bonds (C3–N11 and N12–C13) display hybridizations equal to sp2.79, sp2.18, sp2.21, and sp2.76 for the four atoms respectively, signifying partial double-bond character because of π-electron donation from the phenyl ring and back-donation toward the azo unit. This delocalization is furthest demonstrated by the σ-framework polarization, in which the nitrogen atoms tend to have a greater contribution percentage (~59–60%) in the σ-bonds, reflective to its larger electronegativity and role as an electron-dense center.
The phenolic and oxime functional groups exhibit strong donor ability and electronic localization. The phenolic O–H bond on O26 displays highly p-character (80.76%) on oxygen. The O26 lone pairs show markedly unlike hybridization: LP1 is almost purely p-type (99.88% p-character, only 0.07% s), while LP2 is far more hybridized, with 50.90% s-character and 49.06% p-character. On the oxime oxygen O30, the O–H bond likewise shows strong p-character on oxygen (78.82%), consistent with a highly polarized O–H σ-bond. The lone pairs on O30 display a hybridization pattern opposite that of O26: LP1 is the more hybridized lone pair (51.46% s, 48.51% p), while LP2 is almost purely p-type (97.43% p, only 2.52% s). Second-order perturbation analysis shows that O30’s resonance-active lone pair coincides with its p-rich lone pair: LP2 donates strongly into the C28–N29 π* orbital (E(2) = 20.56 kcal/mol), while the hybridized LP1 donates only weakly into the C28–N29 σ* orbital (E(2) = 6.09 kcal/mol), confirming LP2 as the dominant source of π-delocalization and donor strength for the oxime moiety. O26 behaves differently: its p-rich lone pair (LP1) is oriented for σ-type hyperconjugation, donating into the C16–C20 and C18–C20 σ* orbitals (E(2) = 5.94 and 6.35 kcal/mol), whereas it is the more hybridized LP2 that donates into the aromatic ring π* system (C18–C20 π*, E(2) = 4.37 kcal/mol). It is a comparatively weak interaction next to O30’s. The two oxygens therefore do not share a single “p-rich lone pair drives resonance” rule: the identity of the resonance-active lone pair is swapped along with the hybridization pattern, with O30’s p-rich LP2 acting as the stronger π-donor overall.

2.3.5. Natural Charges

NBO charges of the azo-oxime molecule (H2L, 1) were computed utilizing the B3LYP functional 6-311G(d,p) basis set. The computed charge distribution is listed in Table 5 and pictured in Figure S20. As listed in Table 5, atoms O26, O30, N11, N12, and N29 carry considerable negative charges of −0.69848, −0.50540, −0.20361, −0.21116, and −0.08894 a.u., correspondingly, with electronic configurations of [core]2s(1.68)2p(5.01), [core]2s(1.69)2p(4.81), [core]2s(1.39)2p(3.78), [core]2s(1.39)2p(3.79), and [core]2s(1.43)2p(3.63).
Table 5. The NOB charges of azo-oxime (H2L, 1) atoms by DFT/B3LYP//(6-311G(d,p).
AtomNOB
Charges
AtomNOB
Charges
AtomNOB
Charges
C22−0.57547C30.10627H210.21448
C16−0.22402C130.11620H90.21860
C1−0.21108C200.34916H170.22309
C5−0.20565H320.15490H310.42469
C14−0.17796H100.19898H270.46778
C4−0.17741H250.20041N12−0.21116
C15−0.17591H230.20058N11−0.20361
C2−0.17141H70.20140N29−0.08894
C18−0.11589H240.20716O26−0.69848
C60.01510H80.21046O30−0.50540
C280.02192H190.21389
These results indicate that these atoms serve as major electron-accepting centers and has a key role in facilitating intra-molecular charge transfer (ICT), with electron density flowing predominantly toward them rather than away. Overall, the NBO charges of the azo-oxime framework range from −0.69848 to 0.46778 a.u. The hydrogen atoms H27 and H31 exhibit the largest positive charges (0.46778 and 0.42469 a.u.), which can be attributed to their connection to greatly electronegatively oxygen atoms. Conversely, the heteroatoms O26 and O30, along with C22, possess the most negative charges, confirming their strong electron-withdrawing character and their contribution to charge delocalization within the molecule.

3. Optical Properties

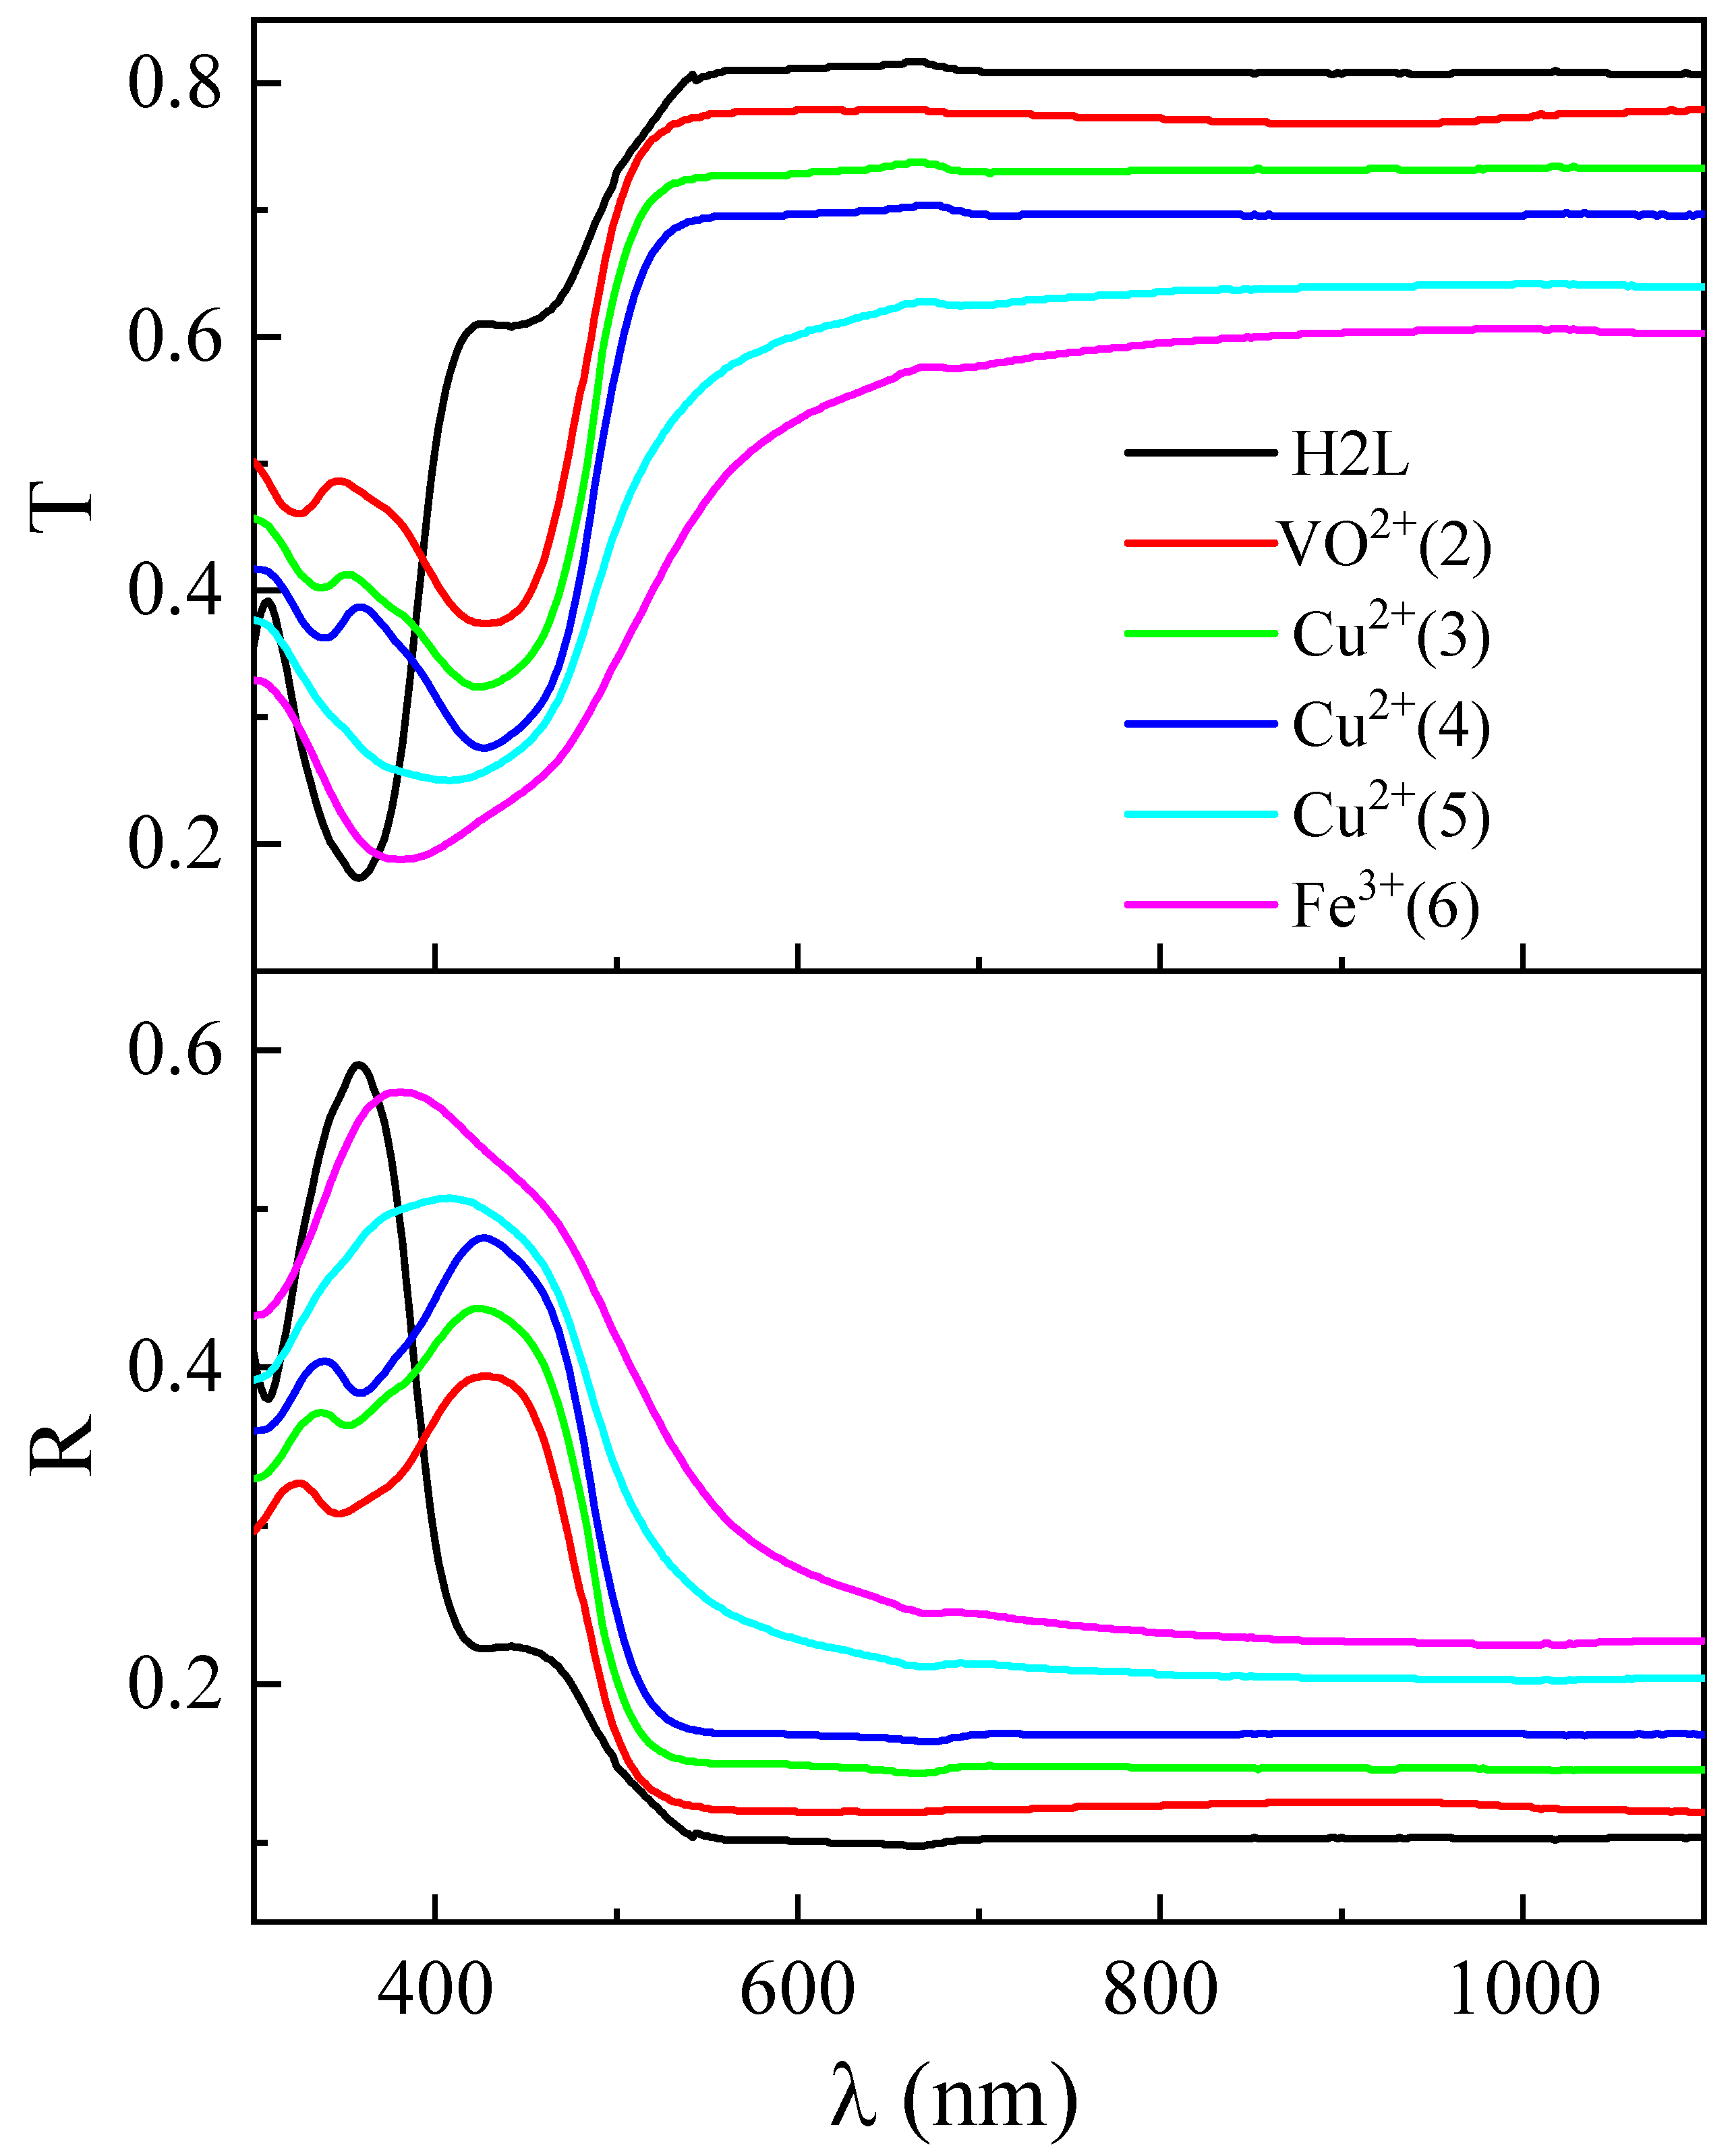
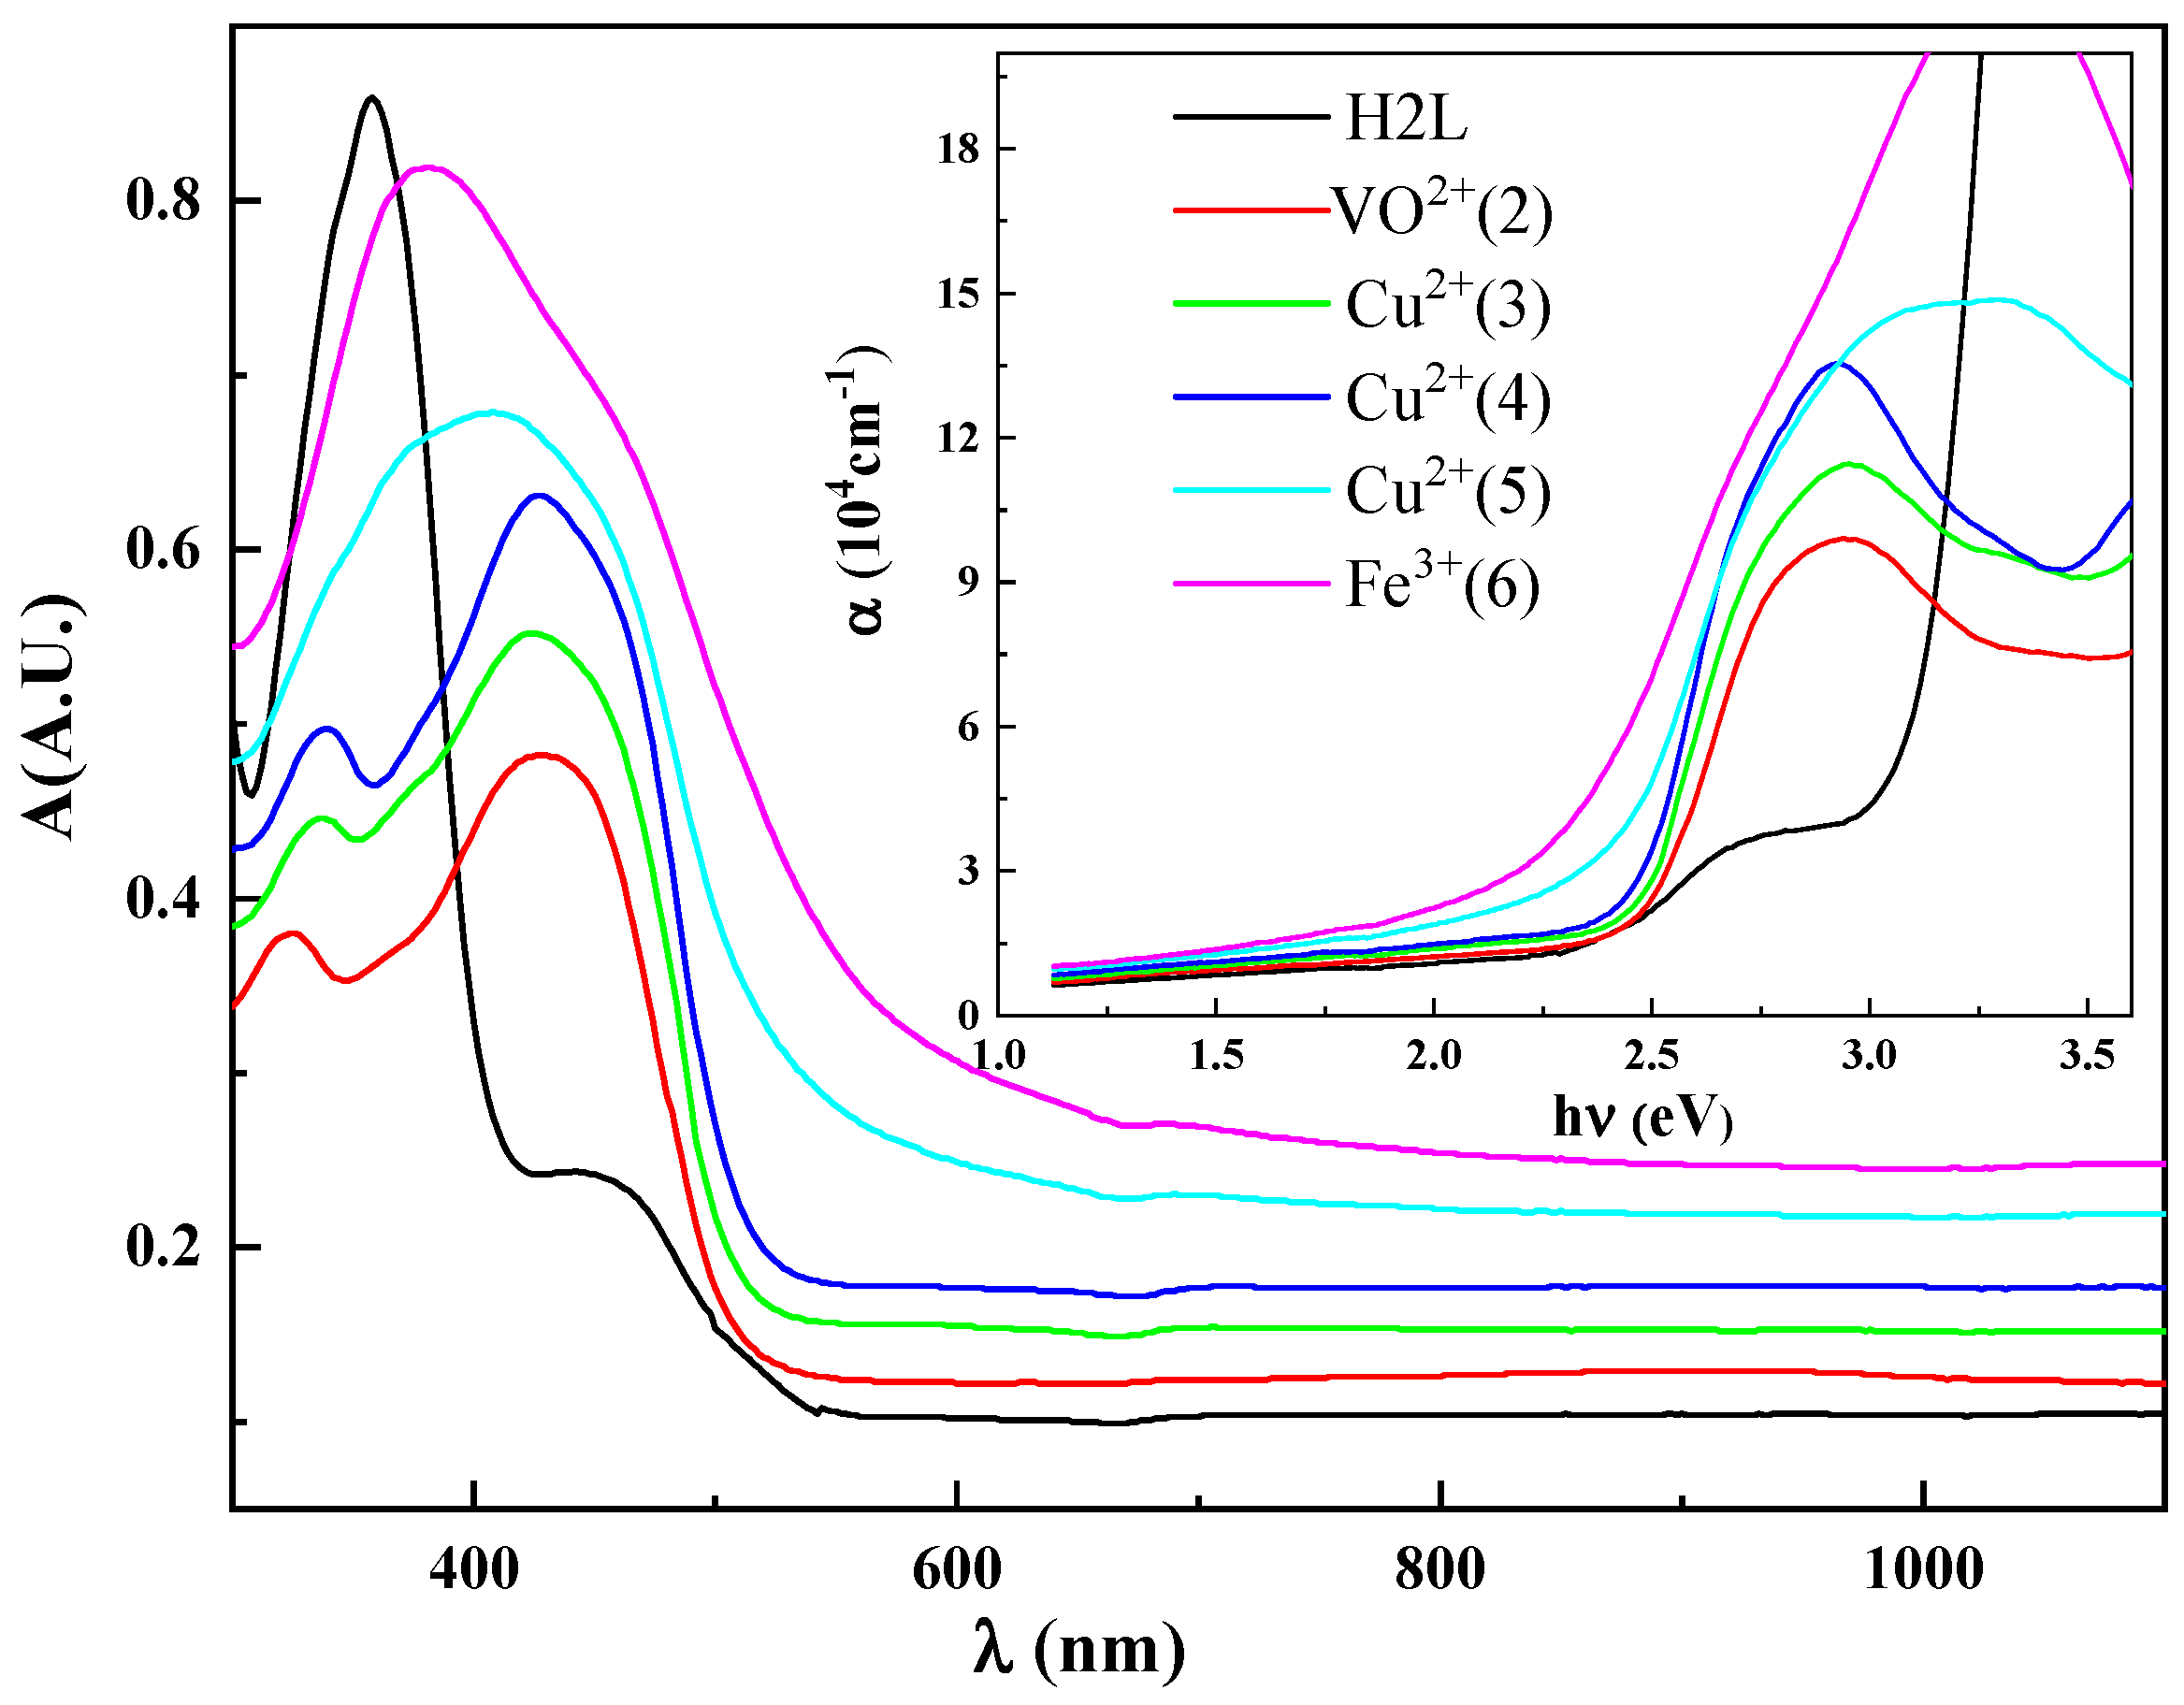
Figure 4 shows the measured transmittance (T) and reflection (R) spectra for the azo-oxime ligand (H2L) and its complex films. The films are found to be absorbing in the 355–580 nm spectral range while they are transparent for wavelengths larger than 580 nm. Within the absorbance range, there is an absorption edge due to the electron innervation from the supreme filled orbital to the minimal blank one. As shown in Figure 4, the film of azo-oxime ligand (H2L film) has the greatest transmission; accordingly, it has the lowest reflection. So, the H2L and it is complex films may be arranged according to their transmission as H2L > VO2+(2) > Cu2+(3) > Cu2+(4) > Cu2+(5) > Fe3+(6). This implies that a lesser amount of light may pass through the film. As a result, the index of the film’s refraction index generally increases, leading to the reduced of light as it goes through the film. The light fraction that is decelerated or twisted as it moves within the film is known as the film refraction. When a film has a greater refractive index, light moves through it more slowly than it would in a vacuum. Interactions with the atoms or molecules in the film enable light to move more slowly, lowering its velocity. Accordingly, a decrease in film transmittance signifies a decrease in the speed of light as it passes through the film and an increase in the refractive index (Figure 5). Where the n values have been estimated by using R ( λ ) or T ( λ ) values in the following relationships:
n λ = 1   +   R ( λ ) 1     R ( λ )   4 R ( λ ) ( 1     R λ ) 2 0.5
n λ = 1 T ( λ )   1 ( T λ ) 2 1 0.5
In addition, the film absorbance (A) was linked to the film transmittance (T) through this expression:
A λ = 2 l o g ( T λ % )
Hence, the film with the highest T values (H2L film) has the smallest A values (Figure 4 and Figure 6).
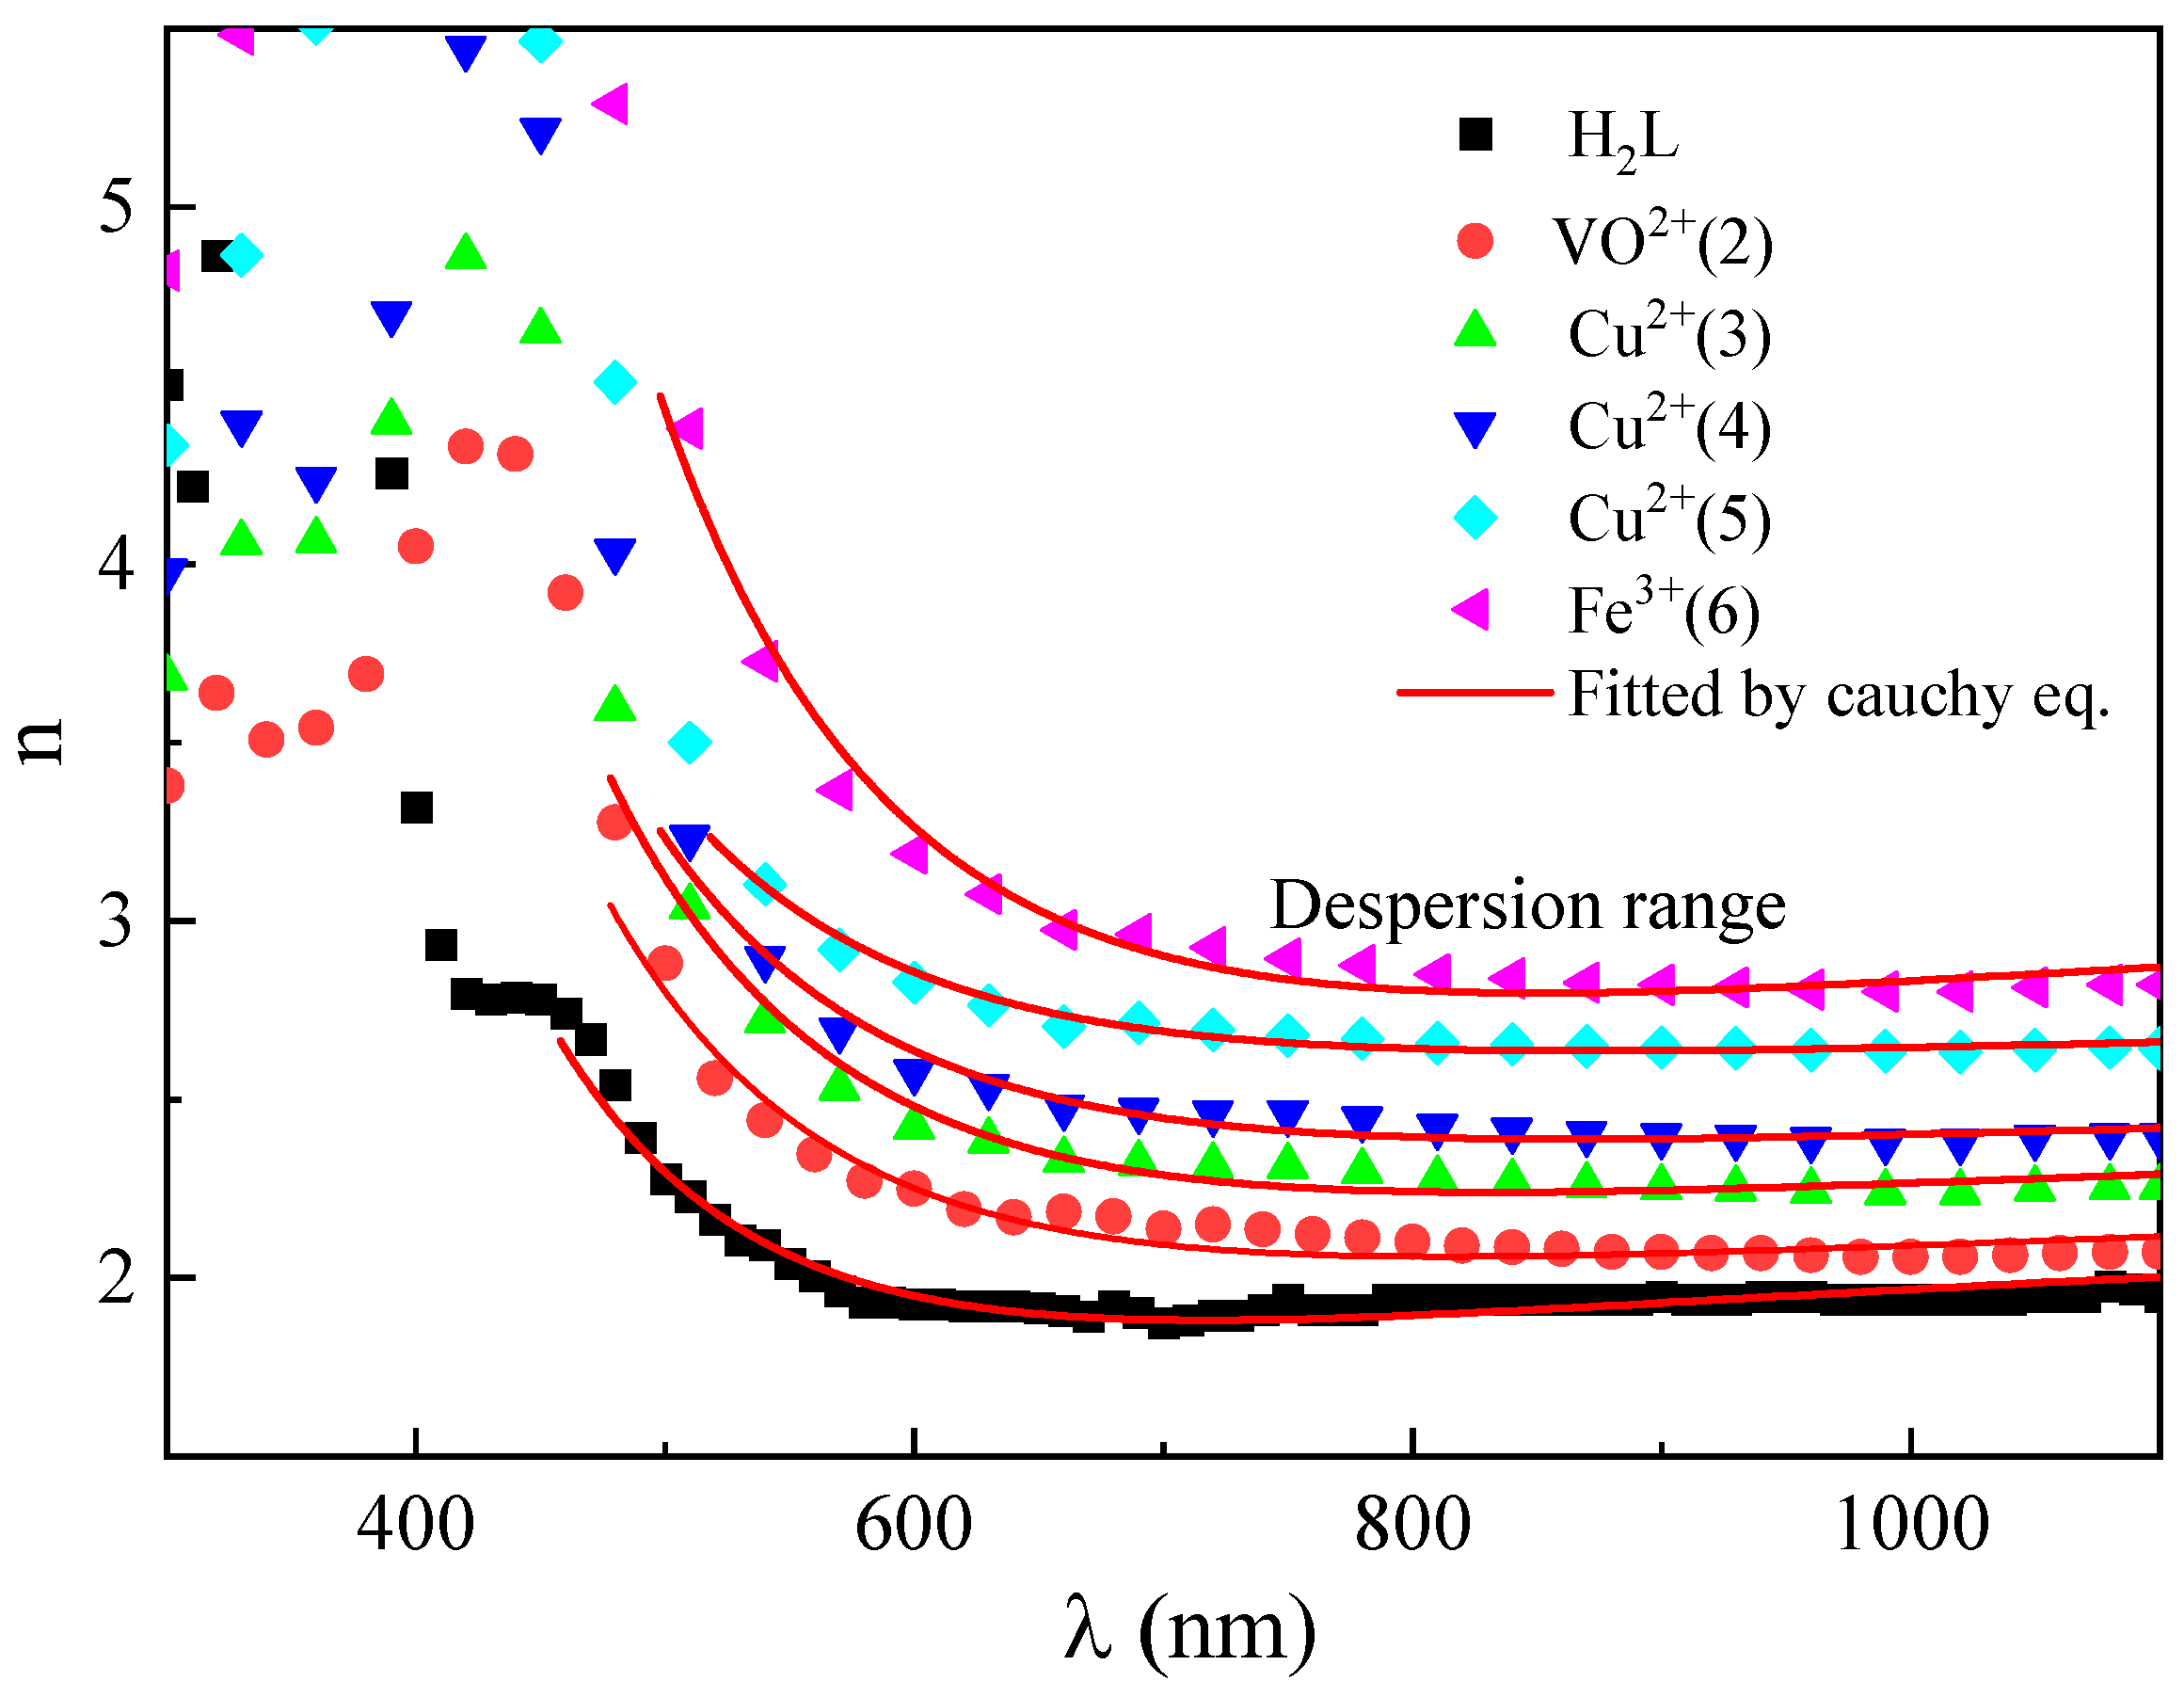
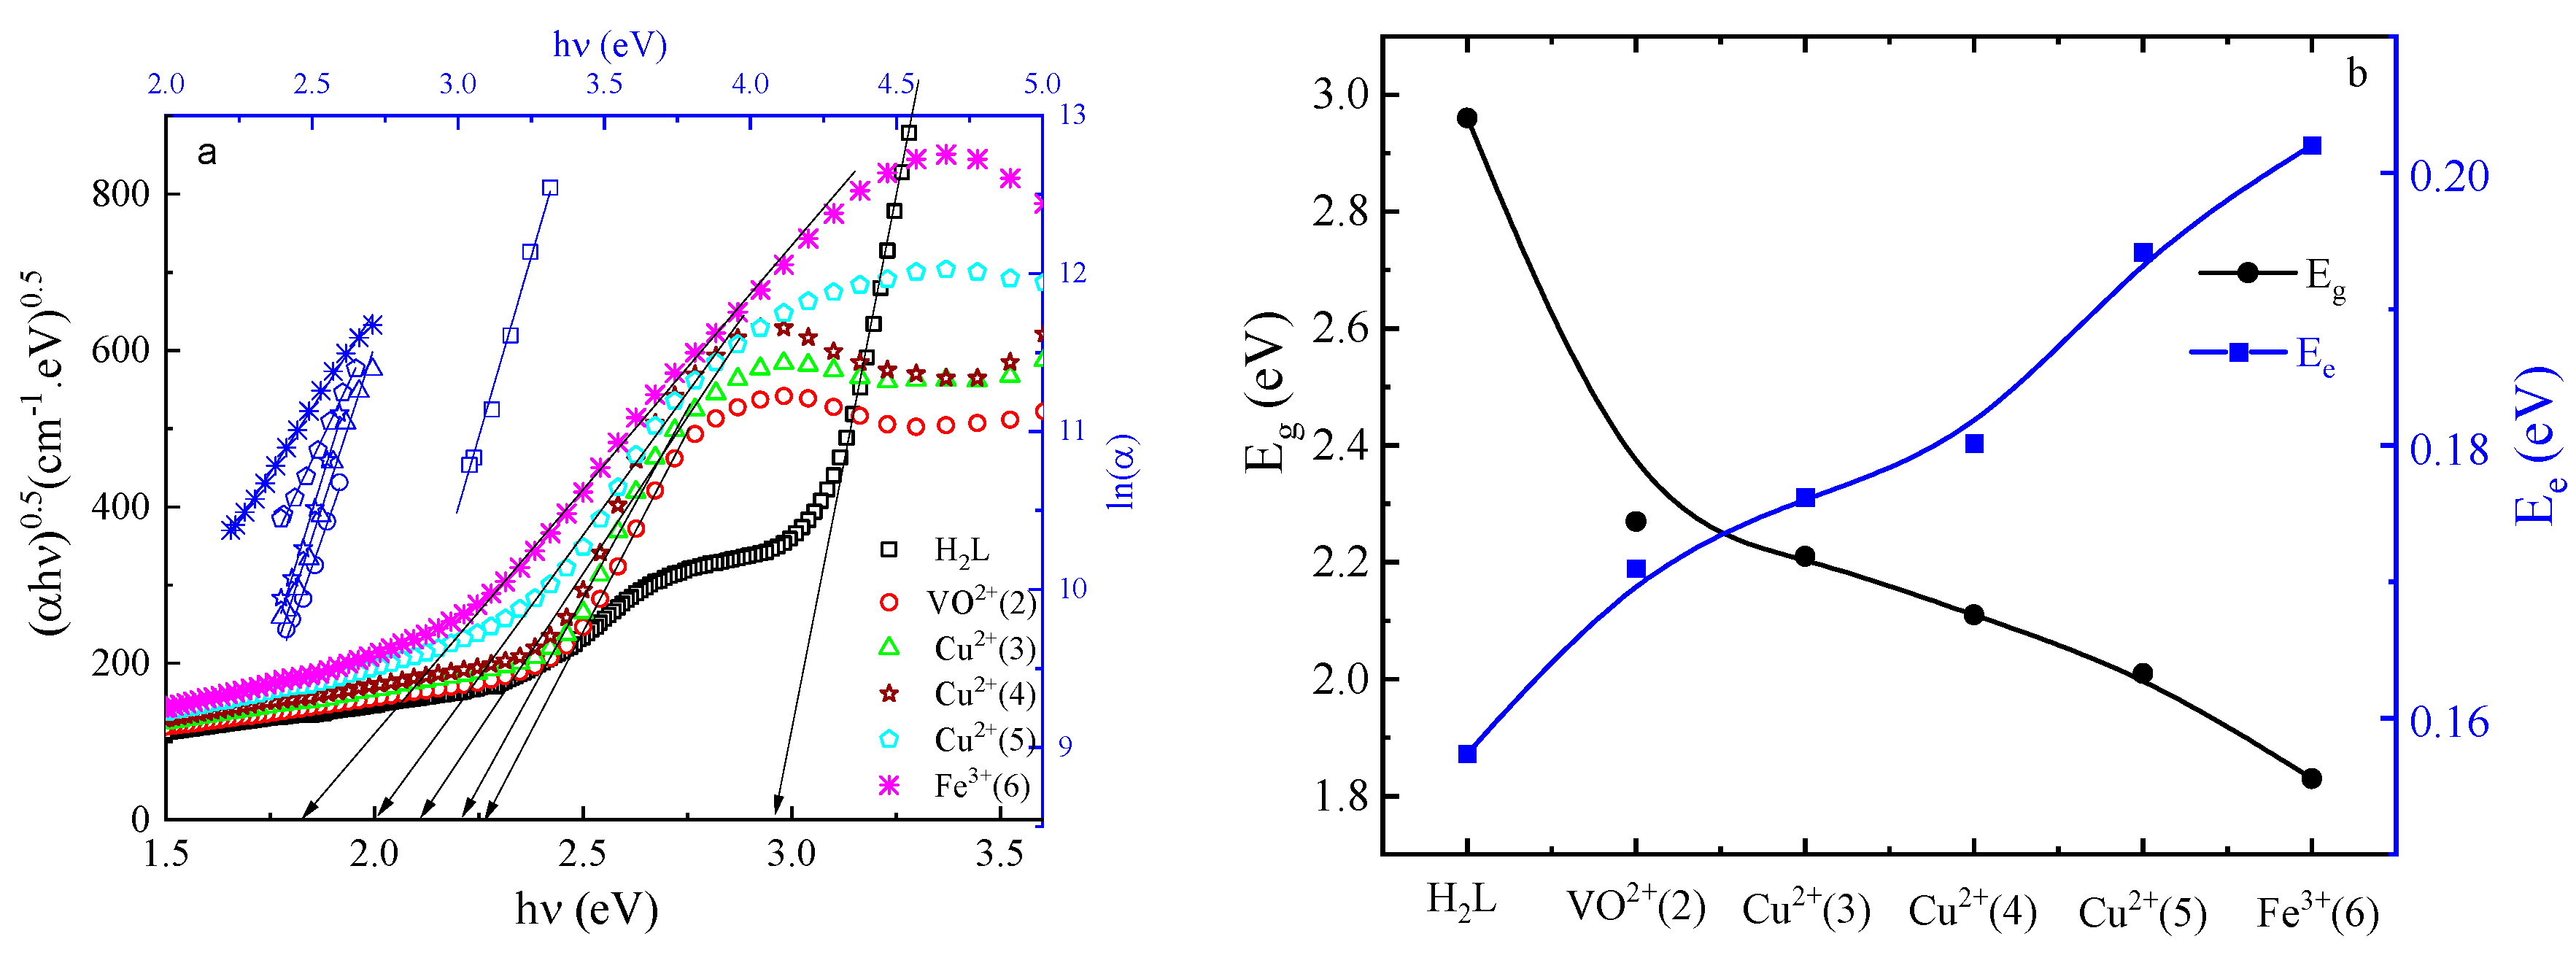
However, the absorption edge of the H2L film is in the 390–550 nm spectral range, while the absorption edges of various complex films were shifted at large wavelengths, i.e., redshift, as listed in Table 6. Fe3+(6) film was shown to have a noteworthy impact. There are two noticeable ranges the spectra: Figure 7a shows the absorbance range where T λ + R ( λ ) < 1.0 , where the extinction coefficient ( k λ = α λ λ / ( 4 π ) and/or the absorption coefficient ( α λ ) were related with the film absorption A through the formula A ( λ ) =   α ( λ ) . d . The α λ λ dependance azo-methine ligand (H2L) and its complex films are shown in Figure 7b. The non-absorbing/transparent range where T λ + R ( λ ) 1.0 , the film becomes transparent and stops actively absorbing light. The optical properties of different films were inspected by means of Tauc’s model, which helps to evaluate the value of the optical gap ( E g ) using the α-hν dependence in the following form [86]:
α h ν = β z ( h ν   E g ) z
where β is the band-tail factor, z is Tauc’s parameter which states the optical transitions kind ( z = 0.5   a n d   2.0 for direct and indirect transitions, respectively) [87]. The optical transition mechanism and the precise evaluation of the indirect optical band gap (Eg) for the H2L ligand and its metal complex films were systematically investigated using Tauc’s formulation (Equation (33). To ensure high precision in the fitting procedure, the experimental absorption coefficient (α) was first computed across the absorption edge region. Subsequently, α h ν was plotted as a function of the incident photon energy ( h ν ), as illustrated in Figure 7a. The fitting and evaluation procedure was executed via the following consecutive steps: (1) The fundamental absorption edge region where α h ν exhibits a strictly linear dependence on h ν was identified for each film sample. (2) A rigorous linear regression analysis (least-squares fitting method) was applied exclusively to this linear domain of the curve to determine the slope and intercept. (3) The resulting straight-line fit was mathematically extrapolated down to the photon energy axis where the absorption condition satisfies α h ν = 0 . The point of intersection on the horizontal h ν -axis directly yields the value of the indirect optical band gap ( E g i n ) as listed in Table 6. The excellent linearity observed in the absorption region (R2 > 0.99) confirms that the indirect allowed transition model appropriately and accurately governs the optical absorption process within these synthesized thin films. In the short absorption range α-hν dependance obeys the following expression:
α =   α o e h ν / E e
where E e is localized state width and αo is constant. According to the above expression, ln α h ν dependance are illustrated in Figure 7a where the E e value was estimated as the reciprocal slope. The addition of some complexes, viz. VO2+(2), Cu2+(3), Cu2+(4), Cu2+(5), and Fe3+(6) to the H2L films, leads to rise in the E e values (Table 6) which explains the observed decrease in Eg values as represented in Figure 7b. The obtained results are in excellent agreement with the Mott and Davis model, which states that the AC conductivity is inversely proportional to the optical band gap (Eg) value. The Ee values were correlated to β and n through E e   i n the following relationship ( β = c o n ( β = 2.653 × 10 3 σ m / ( n . E e ) ) where σ m is the smallest metallic conductivity. The σ m values have been boosted due to VO2+(2), Cu2+(3), Cu2+(4), Cu2+(5), and Fe3+(6) complexes which are reliable to the observed decrease in E g values.

4. Dispersion Parameters

In the high transparent area the refractive index n variation due to λ obeys Cauchy’s dispersion relationship [88]:
n λ =   a + b / λ 2
where a and b , Cauchy’s parameters which are given in Table 6, are the best fitting of the n values shown as a solid red line in Figure 6. Where λ tends to infinity, the second term of the above Equation (35) tends to zero. As a result, the static refractive index n 0 =   a . Then Equation (35) takes the following form ( n λ =   a ). Then the oscillator wavelength ( λ o ) can be estimated with the help of the constant b ( b = n 0 λ o 2 ) . The rise in λo values due to different complexes confirm the noted redshift in absorbance spectra as represented in Figure 7, i.e., decreases the values of Eg and the energy of single oscillator (Eo) ( E o = 1240 / λ o ) [89]. The Eg value for the indirect transition scales the E0 value (E0 ≈ 2Eg) [90] see Table 6). With the help of λ o and n 0 the oscillator strength ( S o ) can be estimated as ( s o = ( n 0 2 1 ) / λ o 2 ). Then using So and Eo values the oscillator dispersion energy E d can be estimated through the following expression E d =   S o ( h c ) 2 / E o [91]. The Ed values have been listed in Table 6 and found to rise due to different complexes. Such rise indicates a more polarized medium, which naturally slows down light, thus increasing the refractive index. An two important parameters, viz. the plasma frequency ( ω p ) and the ratio of free carriers (N)/active electron mass (m*), can be estimated by using both E g and n 0 values in the following relationship [92]:
ω p = ( n 0 ) 2 1 ) E g 2 / 2
N m * = ε 0 ( n 0 ) 2 1 ) 2 E g 4 4 π 4 e 2 ,
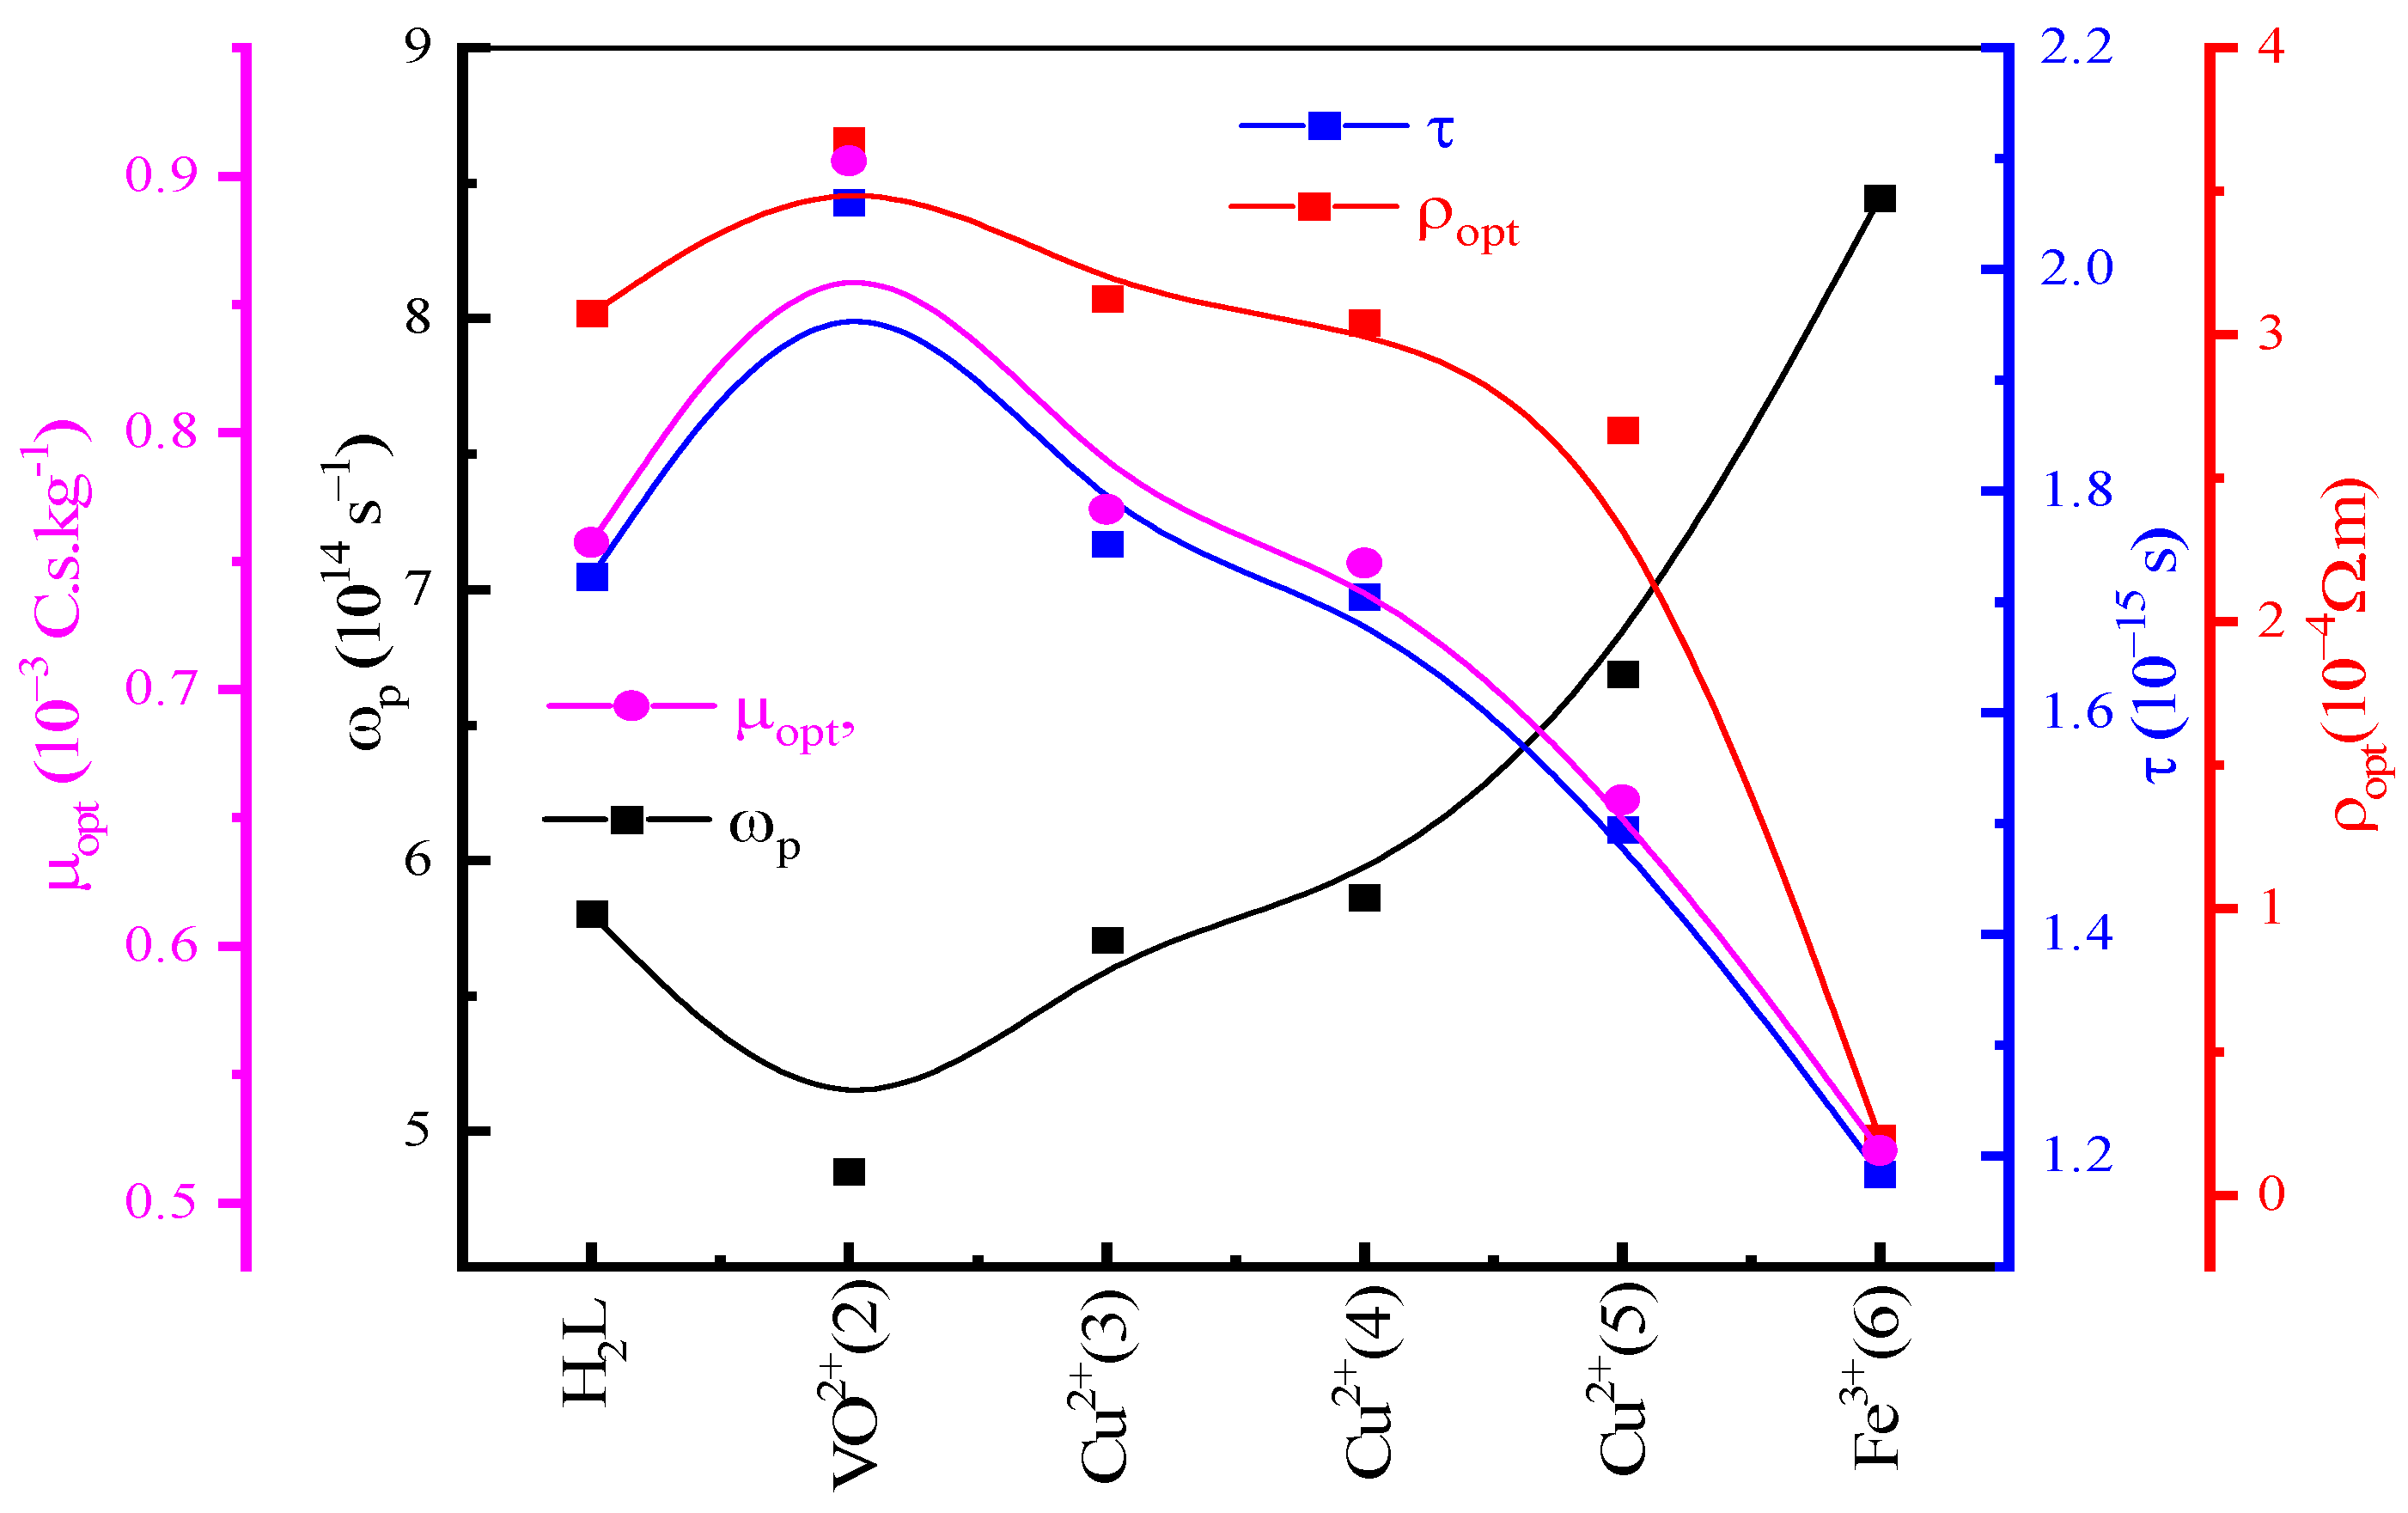
The values of ω p   a n d plasma energy ( E p = ω p ) were found to increase alongside the dispersion energy for the complexes studied. This rise is primarily attributed to the increase in the N / m * ratio, suggesting that the complexation process enhances the density of free charge carriers ( N ) or modifies the effective mass ( m * ). Physically, the higher E p reflects a stronger interaction between the electromagnetic field and the free electron gas within the complexes, which is consistent with the observed modulation in the refractive index and increased electronic polarizability of the samples. In other words, the simultaneous increase in E d is associated with high polarity while the rise in E p values is associated with free carrier density. This indicates that the prepared complexes have improved the linear and nonlinear optical properties of the material by enhancing the total electron density (bound and free). The semiconductor scattering time ( τ ) is the time undertaken by the charge to be defused and is known as the reciprocal of ω P . A decrease in the value of τ occurs for the films with different metallic complexes. The semiconductor optical mobility ( μ o p ) is associated with the electronic bands’ inherent dispersion, and it can be estimated with the help of m* values using the following relationship [93]:
μ o p = e τ / m *
Then the optical resistance is given by [93]:
ρ o p = e 2 τ N o p / m * 1
All the calculated values are tabulated in Table 6. Both the μ o p and ρ o p values decrease with the increase in metal complexes. The related relationship between optical parameters and metal complexes is shown in Figure 8. The observed changes in τ ,   μ o p , and ρ o p values are the same as observed for the optical band gap while the ω P take the opposite behavior.
As a metal complex is added to the azo-oxime films, the decrease in ρ o p values reflects a rise in optical conductivity which is consistent with the reduction in the energy gap, thereby facilitating electron transitions across the material. While the evaluation of practical device performance is required to confirm actual utility, these enhanced fundamental electronic and optical properties suggest that the films could serve as prospective baseline materials for future exploration in optoelectronic components, photoelectric devices, or flexible electronic research.

5. Nonlinear Optical Parameters

The prospective design of nonlinear optical systems, such as optical switches, modulators, and signal processing devices, fundamentally relies on a comprehensive understanding of the foundational nonlinear behavior of light-responsive materials [94]. The current study considers the nonlinear susceptibilities X ( 1 ) and X ( 3 ) and the nonlinear index of refraction ( n 2 ) can be estimated by inserting the n values into the following expressions [20]:
X ( 1 ) =   ( n 2 1 ) / 4 π
X ( 3 ) = 1.7 × 10 10 ( ( n 2 1 ) ( 4 π ) ) 4
n 2 = 12   π X ( 3 ) / n
Table 6 lists the estimated values of χ(1), χ(3), and n 2 and shows their changes due to the complex additions to H2L films. In optical thin films, the nonlinear refractive index ( n 2 ) serves as an important parameter for understanding a material’s fundamental response to high-intensity light, offering preliminary insights into its electronic polarizability. As shown in Table 6, ( n 2 ) is closely related to the third-order nonlinear susceptibility (χ(3)) value. The variations in the estimated nonlinear optical constants between H2L and its complex films can be attributed to structural differences induced by the metal centers. Although practical device architecture and operational performance were not evaluated in this study, examining these fundamental parameters provides foundational data regarding the films’ nonlinear optical characteristics, indicating their theoretical interest for potential future investigations in nonlinear optical fields. Parameters of the prepared azo-oxime complex films were compared with several recently reported metal complexes and related optical materials from the literature, as summarized in Table 7. As revealed in Table 7, the Fe3+ and Cu2+ complexes synthesized in this study exhibit exceptionally narrow optical band gaps (1.83–2.01 eV) and significantly enhanced third-order nonlinear susceptibilities (χ(3)) compared to several other oxime- and azo-based transition metal complexes. This noticeable enhancement in the nonlinear parameters indicates a highly polarizable electronic medium, thereby confirming the high significance and potential value of these films for future optimization in nonlinear optical applications. Measuring a film’s optical conductivity ( σ ) is a useful method for examining its optical behavior and fully understanding how it responds to light. It is a broader concept that is significantly influenced by the electronic states present in the material, as opposed to electrical conductivity in the presence of alternating fields. The optical conductivity parts (real ( σ r ) and imaginary ( σ i )) can be estimated with the help of n and k values using the following expressions [89]:
σ 1 = 0.17 ( 2 n k ) λ 1 , σ 2 = 0.17 ( n 2 k 2 ) λ 1
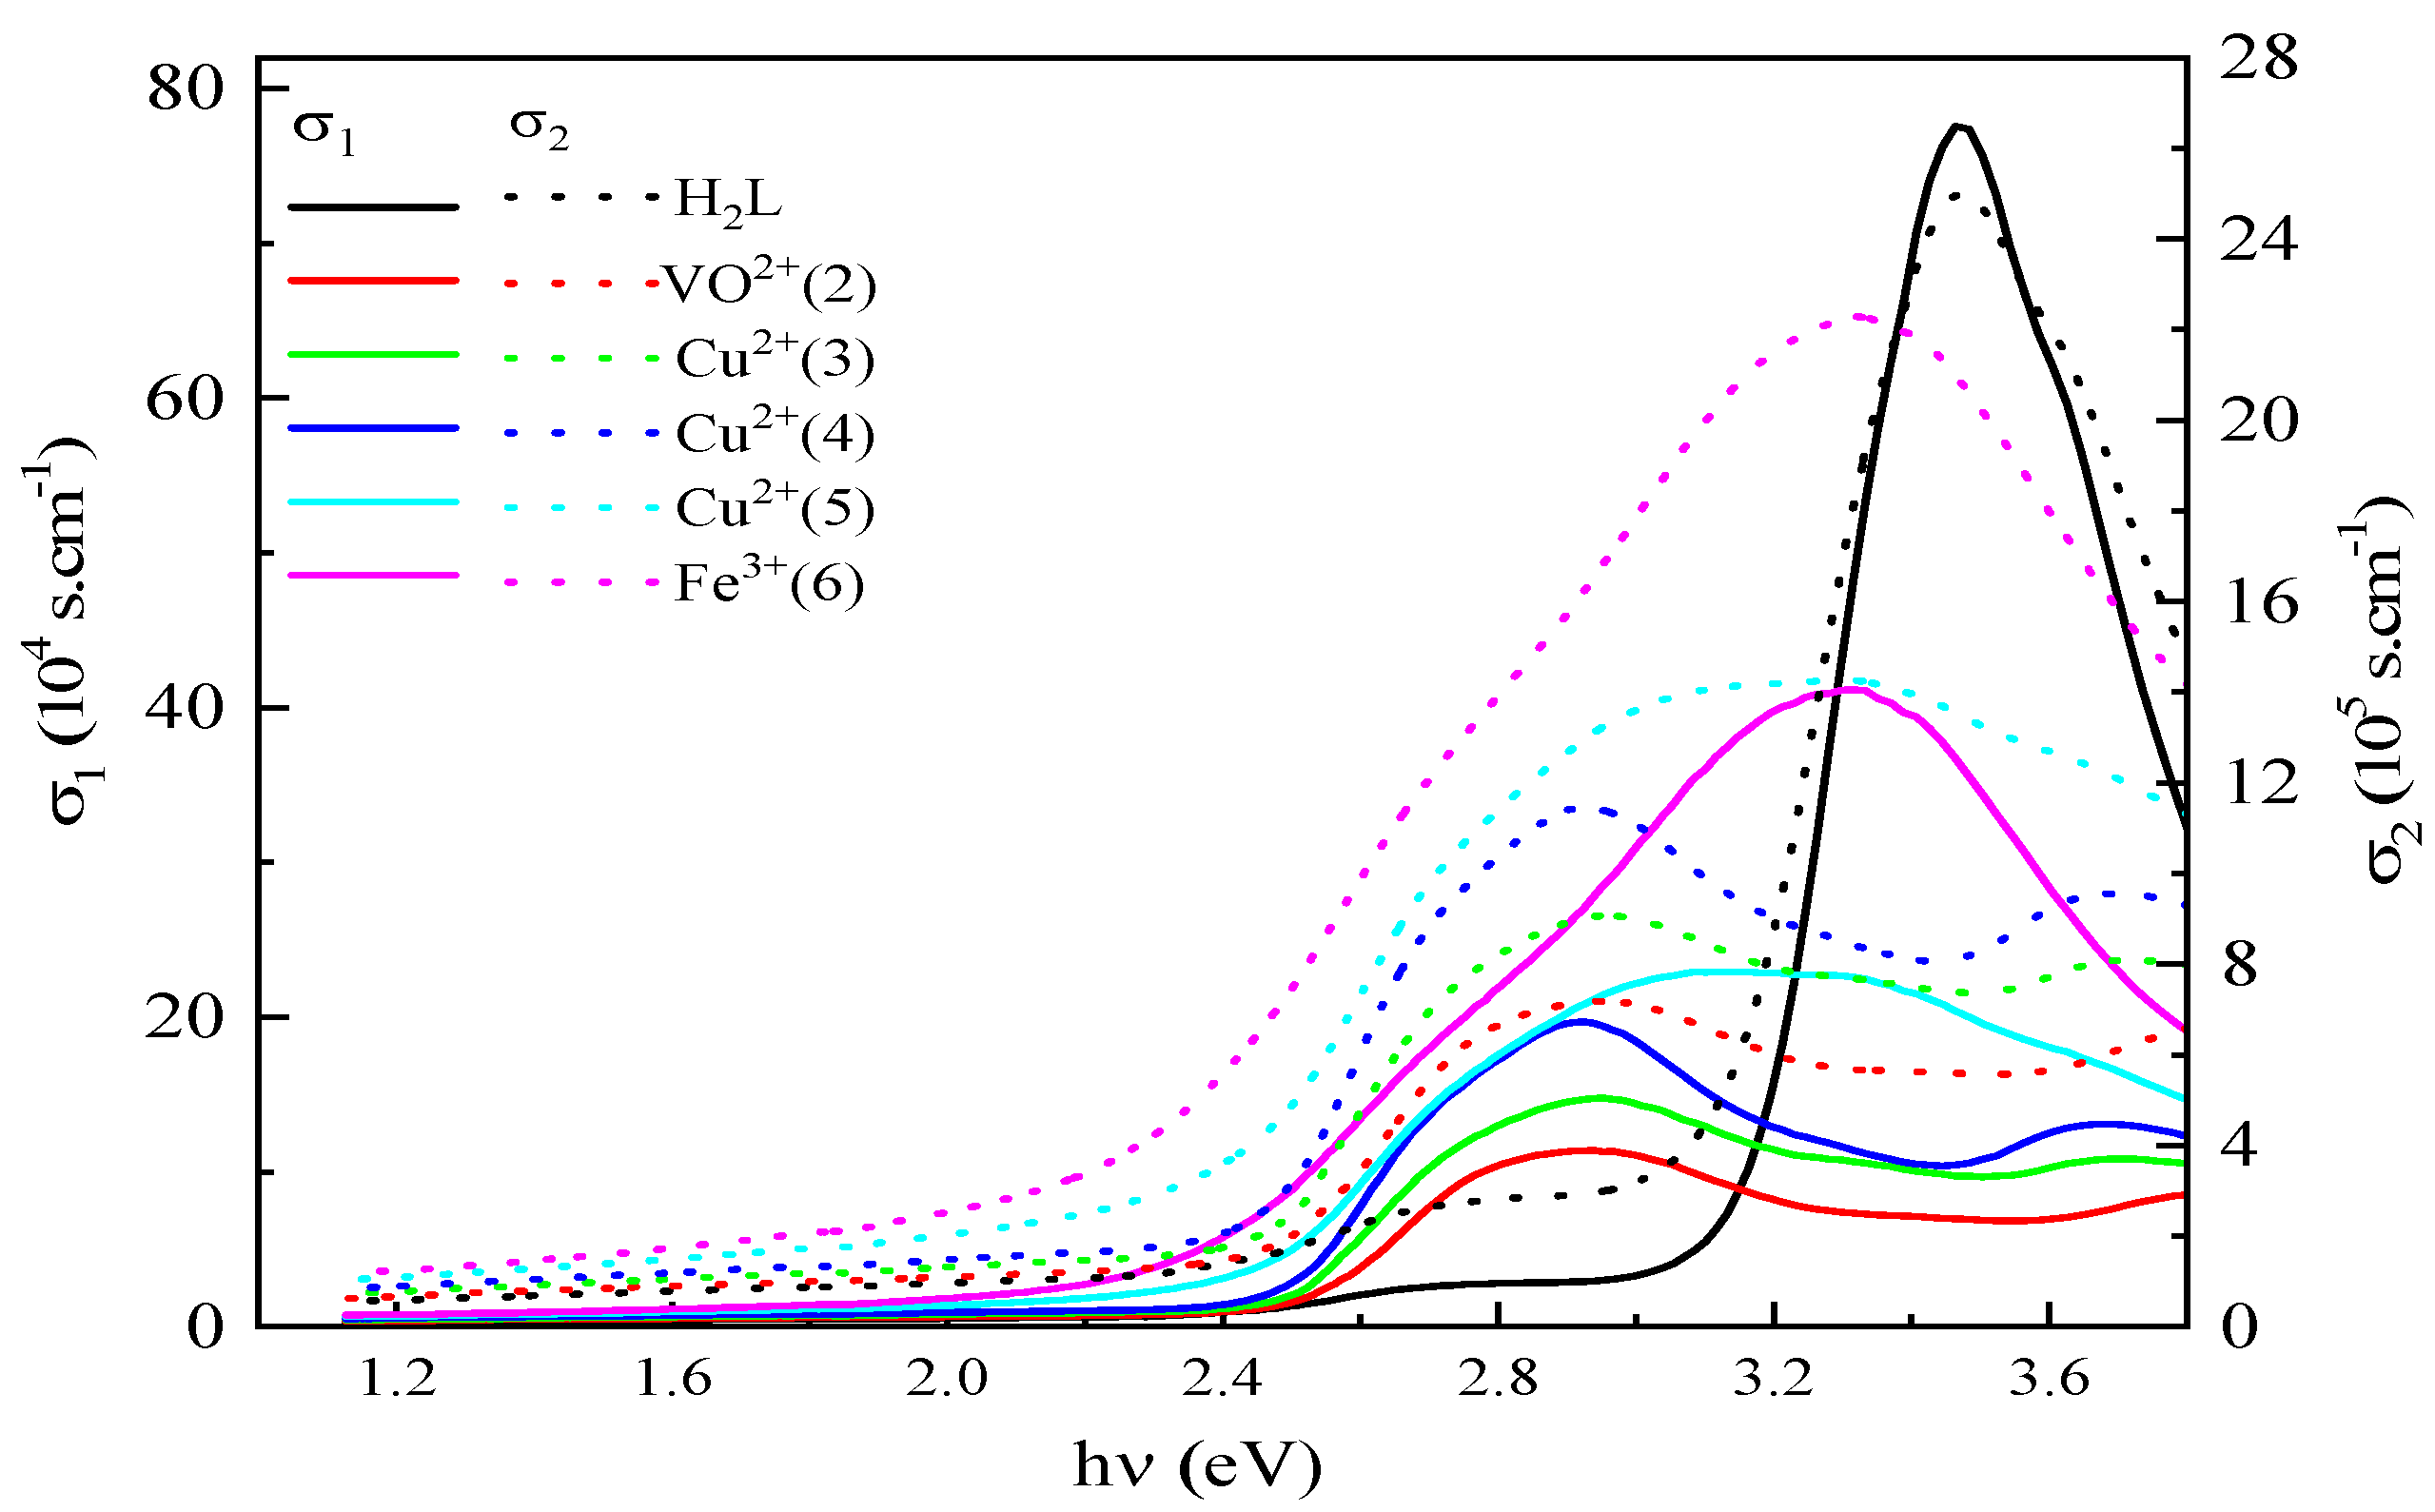
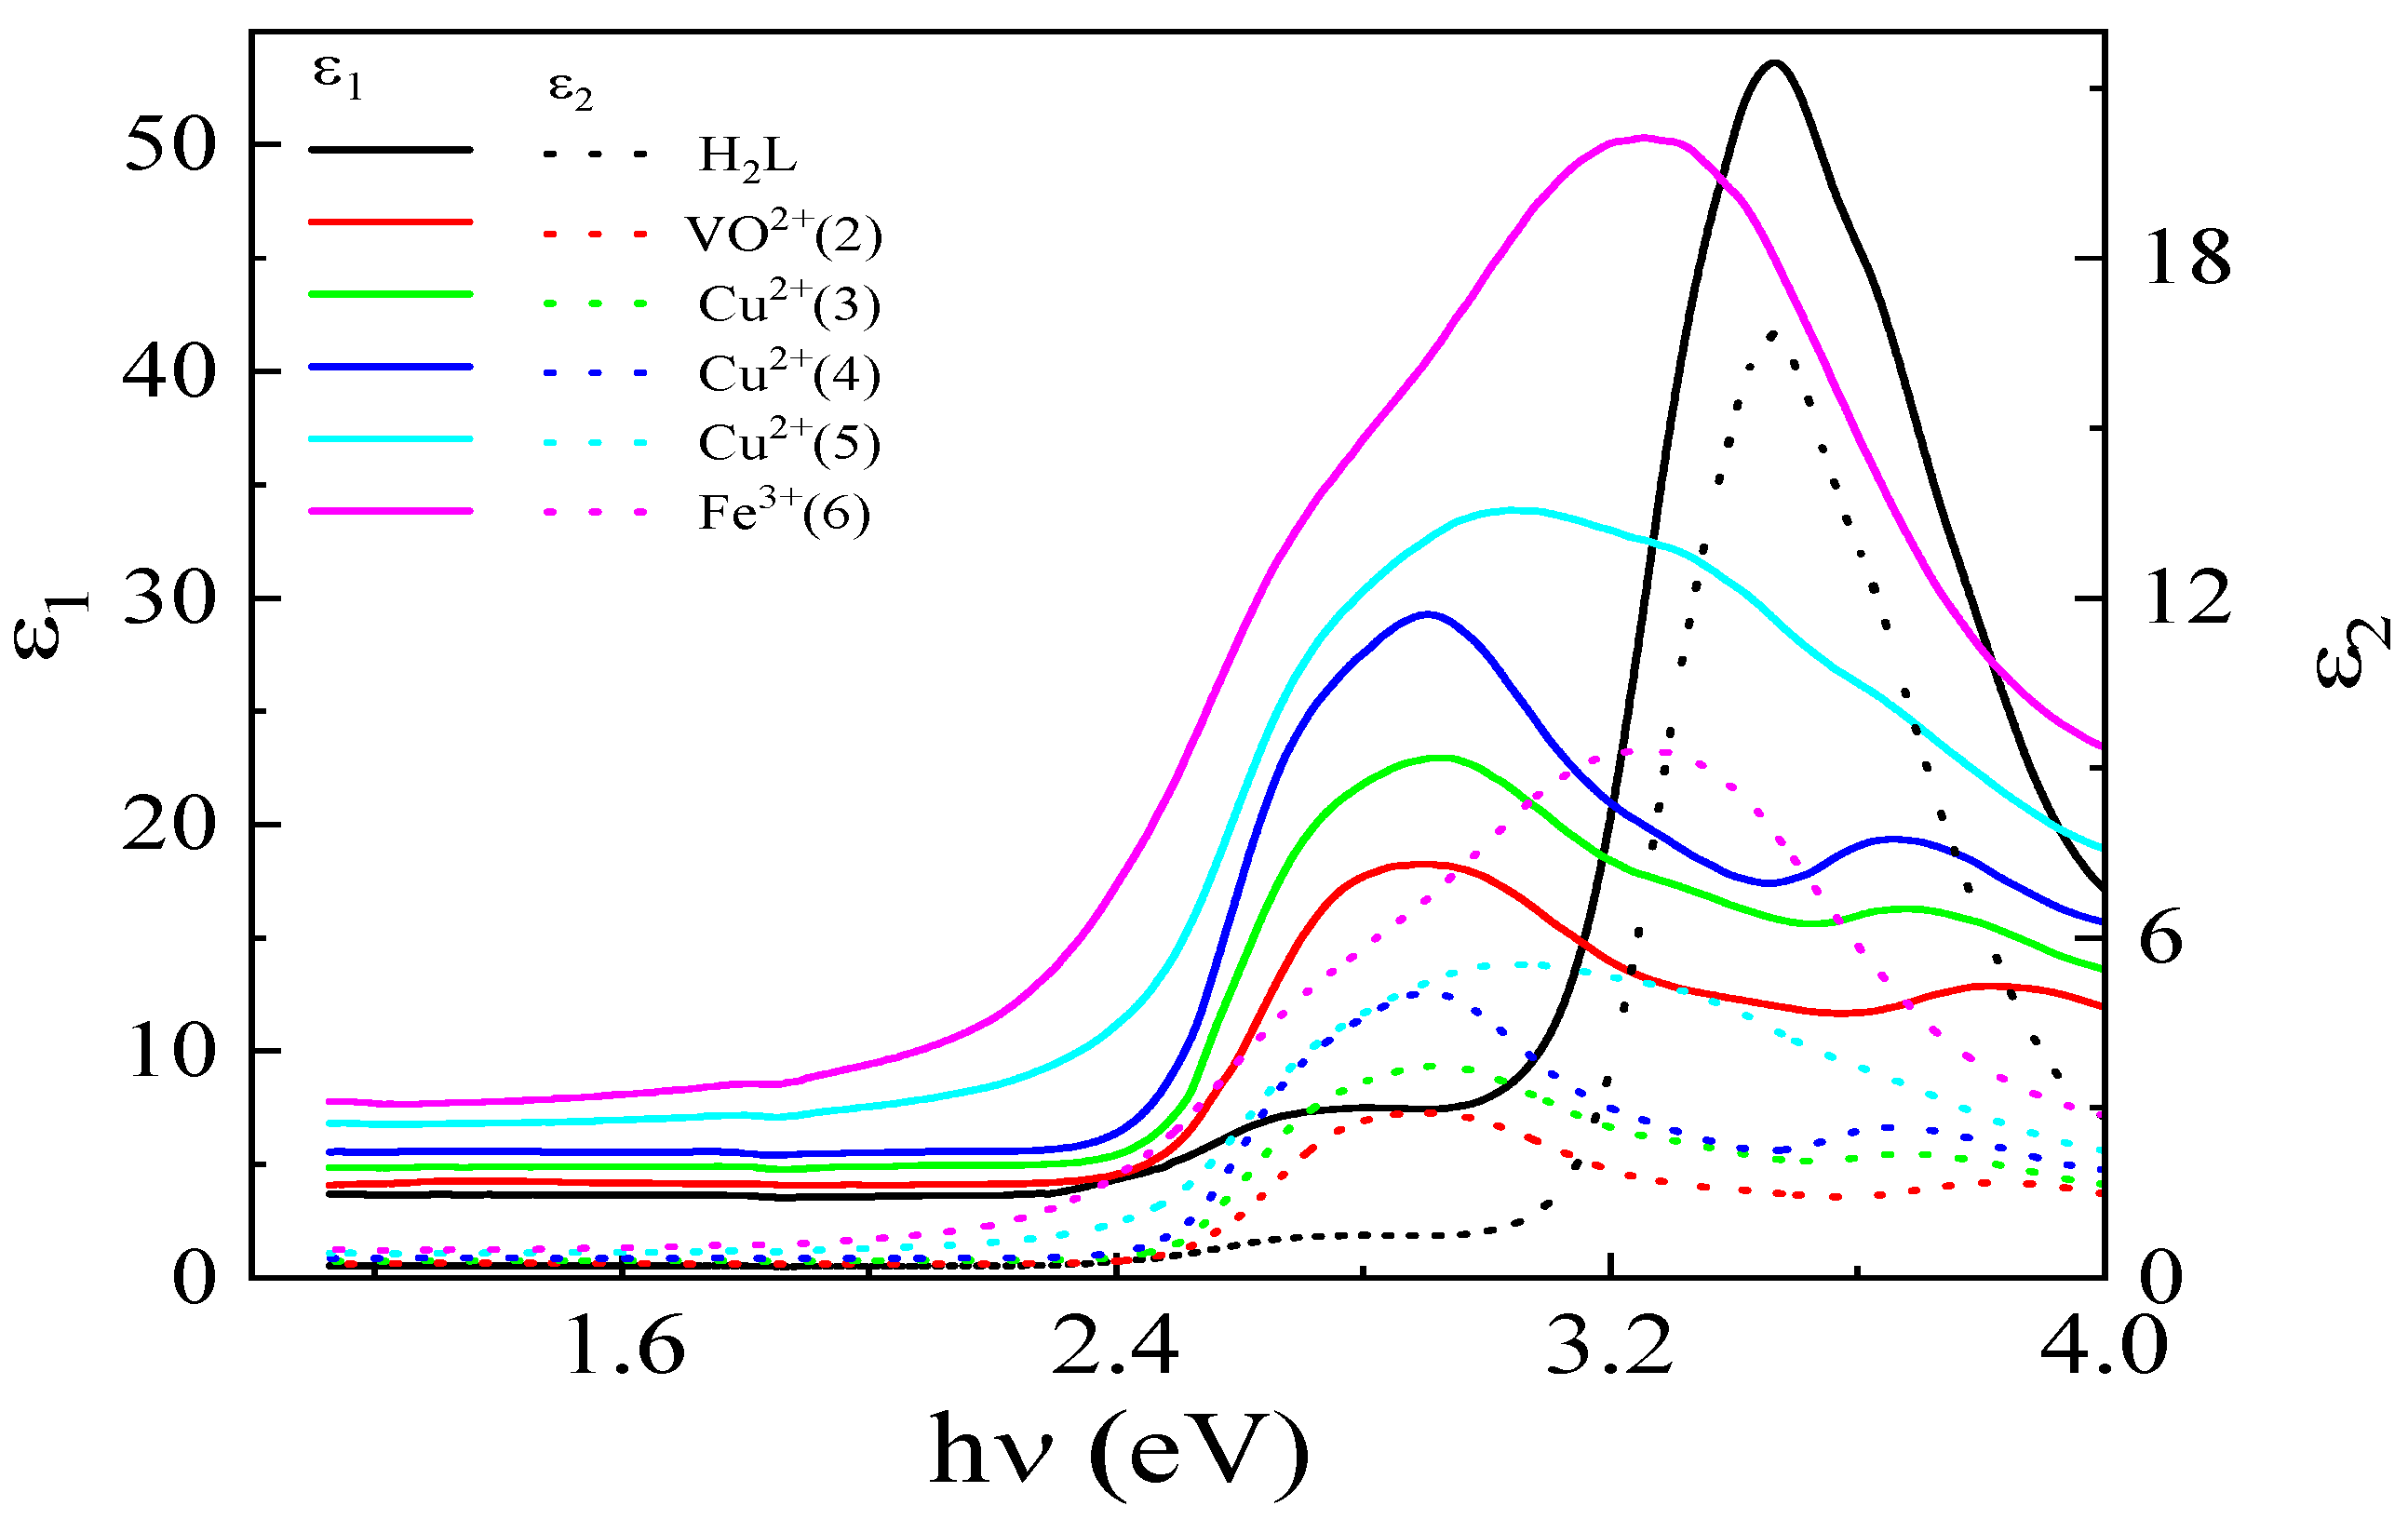
Both of σ 1 and σ 2 were raised by raising hν or adding different complexes as shown in Figure 9. This raise in σ 1 and σ 2 is as a direct result of decreasing the Eg values, which is well discussed by Aly [95]. Apparently, that σ 2   >   σ 1 values due to σ 2 is directly proportional to the real part of the dielectric constant ( ε 1 = n 2 k 2 ) while σ 1 is directly proportional to the imaginary part of the dielectric constant ( ε 2 = 2 n k ). The Eg value of the Fe3+ complex film is the smallest value; therefore, it has the greatest σ 1 and σ 2   v a l u e s . The energy dependence of ε 1 and ε 2 for azo-oxime ligand (H2L) and its complex films is shown in Figure 10. As we see, the changes in ε 1 values due to energy are the same as the changes in n values. This is due to the real part of dielectric constant being linked to the dispersion of electromagnetic waves propagating in the film which advocates to reduce the speed of wave propagation within the film. On the other hand, the imaginary part of dielectric constant is responsible for the energy absorbed from the electric field due to the dipole moving. Accordingly, the rate of waves attenuated and/or disturbed within the film is specified by ε 2 [96,97]. Consequently, the E g value is showed by the fitting line that crosses the x-axis.
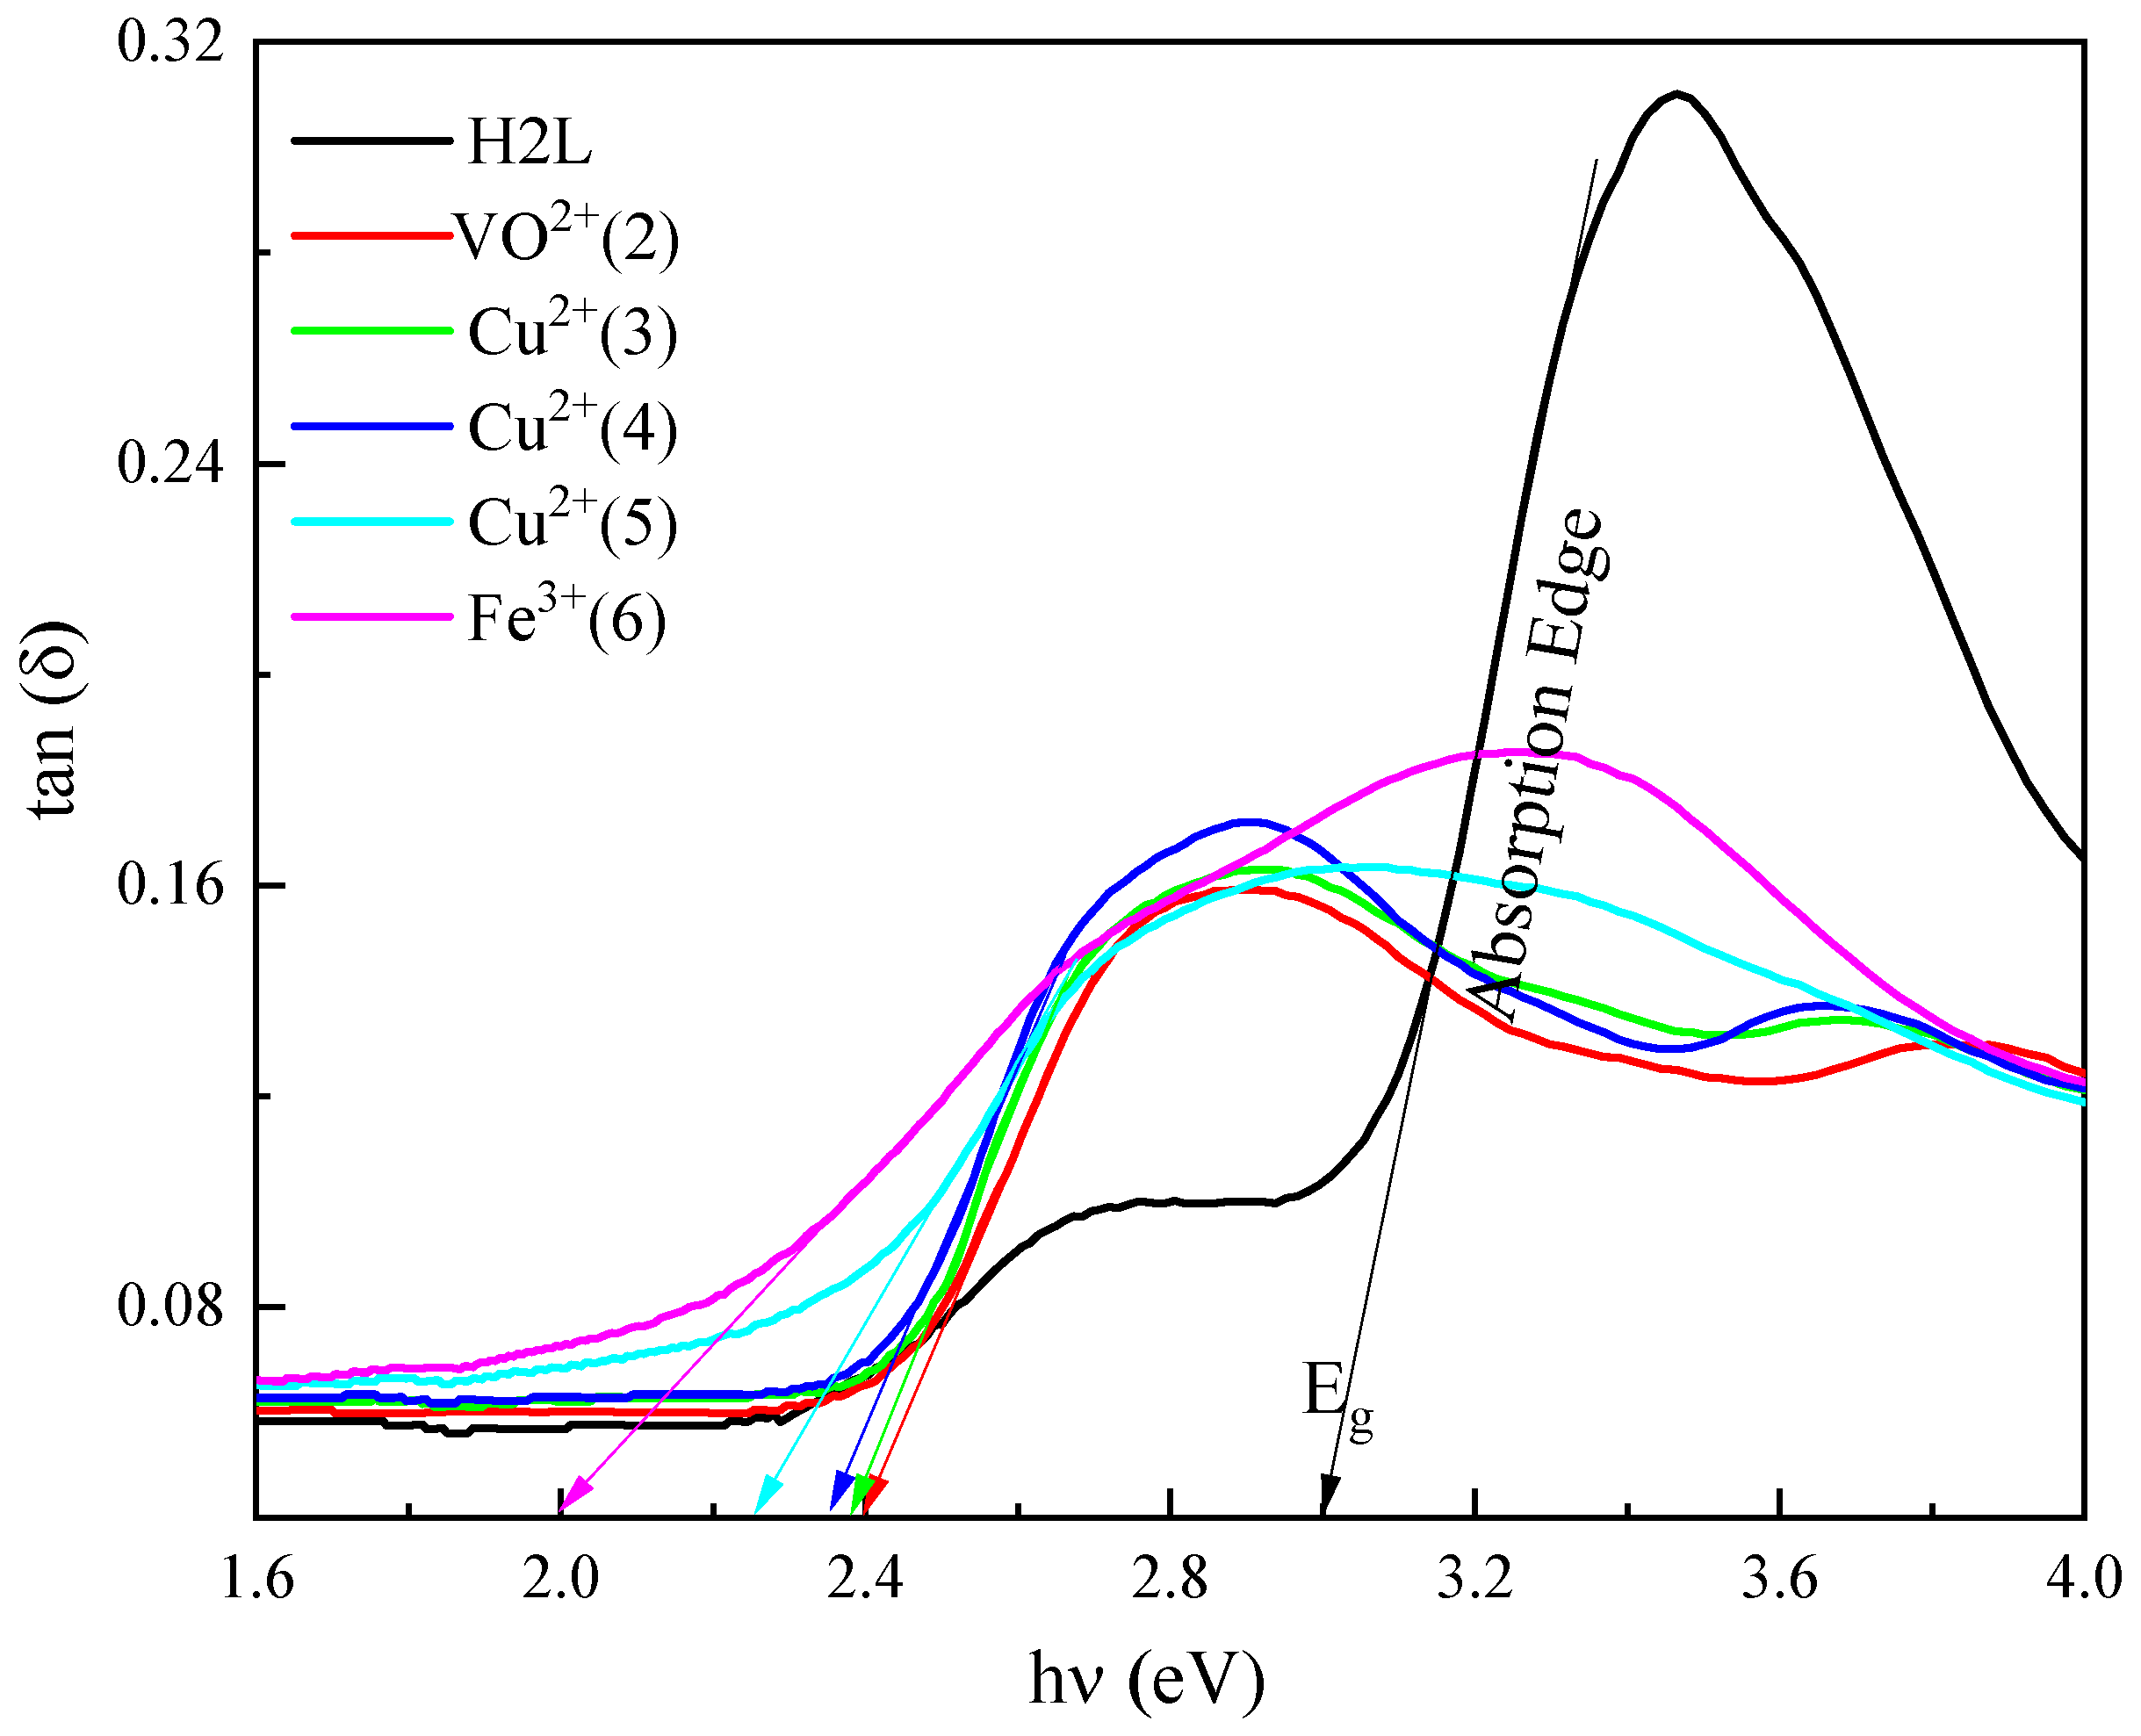
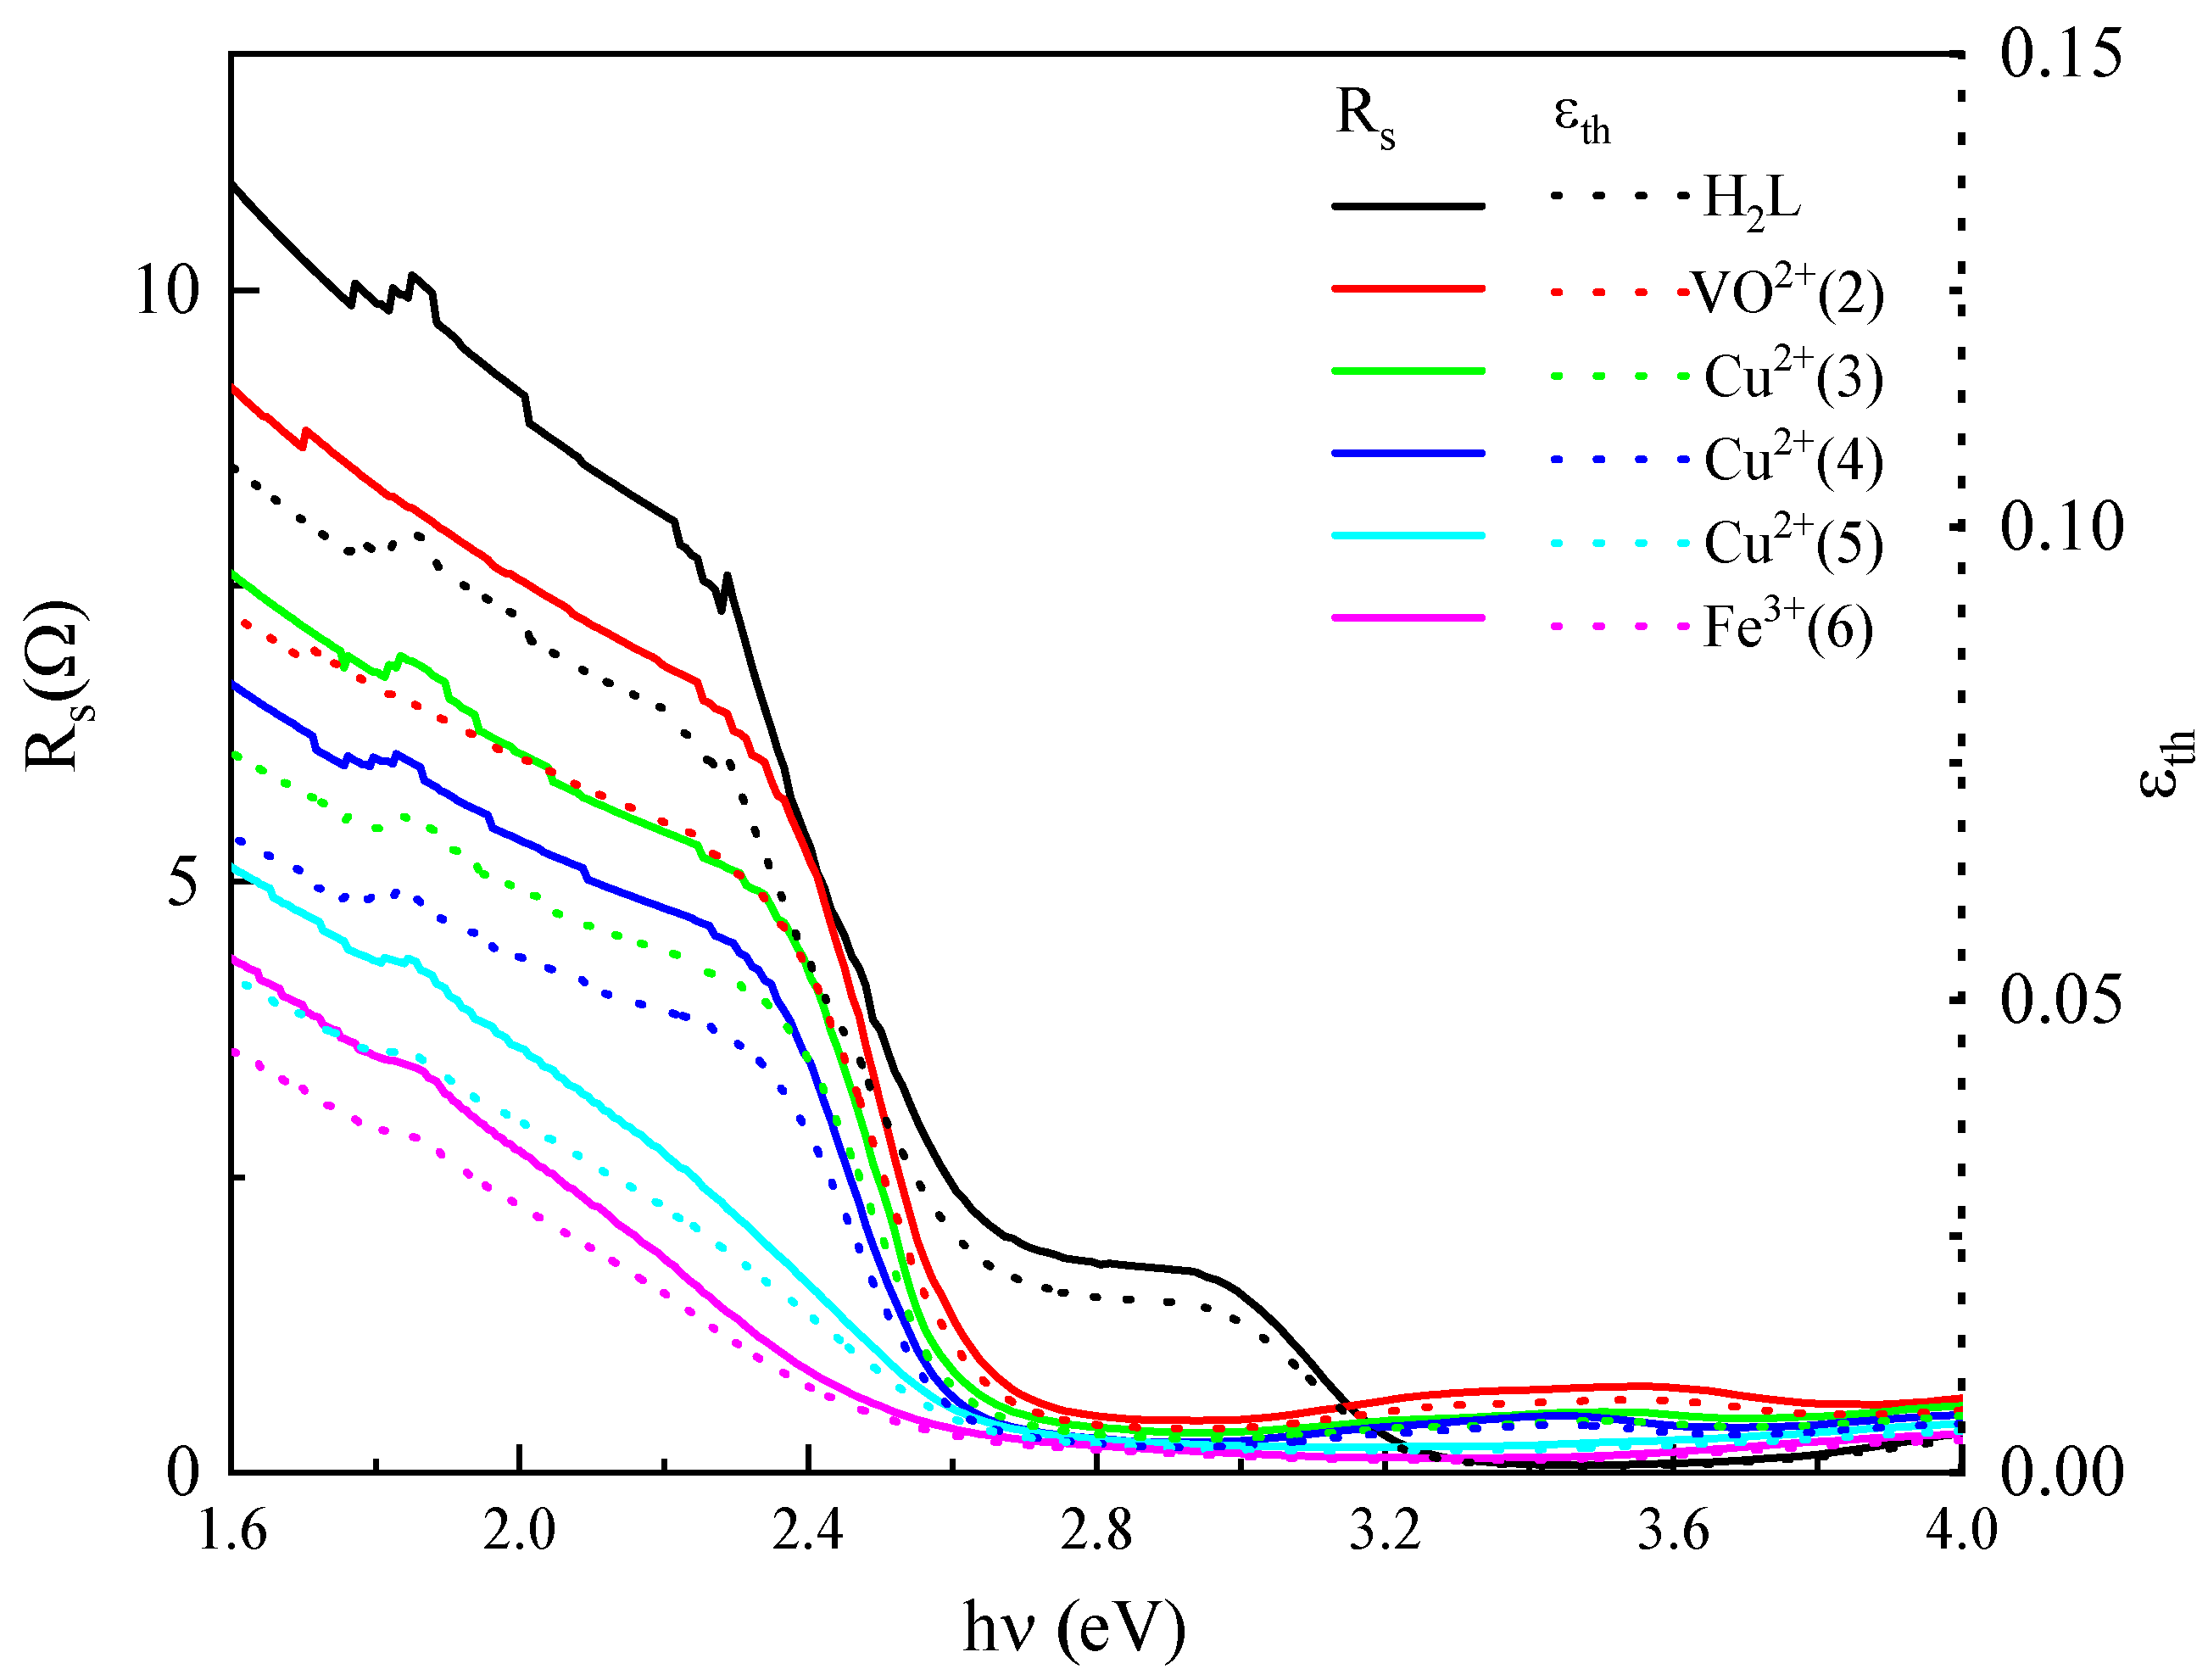
The dielectric loss factor ( t a n δ = ε 2 / ε 1 ) is the energy missing due to the phase-change at a certain frequency. Thermally produced relaxations, which are the only source of thermal energy removal and fully spinning dipoles, are the main cause of this loss. Ion hops that occur during electrical conduction at higher temperatures are the cause of this propensity [64]. The tan(δ) changes due to the photon energy are shown in Figure 11. The addition of different metal complexes leads to the rise in tan(δ) values. At shorter energies ( h ν 2.1   e V ) no significant changeover is seen. Conversely, when h ν > 2.1   eV there is a rapid rise in tan(δ) values with the rise in h ν . This indicates the onset of the absorption edge (Figure 6) which was shifted to the shorter energies (redshift) due to the addition of different metal complexes. The Fe3+ film has a great shift occur. Such behavior of tan(δ) was previously noted for many films [20,98,99]. For amorphous materials, the density of states in the gap that limits the change in the tan(δ) values is denoted by the ε 1 values. A rise in the defect states in the complexes’ films is indicated by such increasing tan(δ) values which also explain the observed decrease in the Eg values. An important parameter is the optical surface resistance ( R s ) which is inversely proportional to the real part of conductivity ( R s = ρ / t = 1 / σ 1 t ). Another crucial parameter, namely thermal emissivity ( ε t h ), is affected by h ν or λ and it can be estimated with the help of R s values as follows [100]:
ε t h = 1 ( 1 + 2 ε o c R s ) 2
Both the R s and ε t h values were plotted versus h ν for H2L and its complex films (Figure 12). The change in Rs and ε t h due to h ν is opposing to the change in the optical conductivity ( σ r ) which is consistent with the above Equation (44). For h ν less than the absorption edge begins (Table 6), both R s and ε t h are approximately constant then quickly lowered to be constant again for h ν values larger than the absorption edge end. Moreover, the H2L film has the greatest R s and ε t h values. This is normally due to H2L film having the largest value of Eg. The ε t h values are too small in comparison to the blackbody (~1). Obviously, the ε t h value is affected by temperature, measurement direction, and other factors.

6. Influence of the Metal Ion on Structural, Electronic, and Optical Properties

Comparing VO2+, Cu2+, and Fe3+ complexes reveals a consistent, metal-dependent trend that links their structural, electronic, and optical behavior. Structurally, the d1 VO2+ and d9 Cu2+ complexes retain a distorted octahedral geometry arising from Jahn–Teller distortion (Cu2+) or the asymmetric V=O bond (VO2+), whereas complex (5) adopts a square-planar geometry, and the high-spin d5 Fe3+ complex (6) shows the most pronounced octahedral distortion, consistent with its larger number of unpaired electrons (S = 5/2) and weaker ligand-field stabilization. Electronically, this structural progression is mirrored in the DFT-derived HOMO–LUMO gap (Table 4), which narrows steadily from the free ligand (ΔE = 3.66 eV) to the VO2+ and Cu2+ complexes (ΔE = 3.15–3.60 eV) and drops sharply for the Fe3+ complex (ΔE = 2.01 eV), indicating that the Fe3+ center induces the greatest degree of electronic delocalization and reactivity, consistent with its higher global electrophilicity index (ω) and lower chemical hardness (η) relative to the other complexes (Table 4). This same trend is reproduced experimentally in the optical band gap of the thin films (Table 6): Eg decreases from 2.96 eV (H2L) to 2.27, 2.21–2.01, and 1.83 eV for the VO2+, Cu2+, and Fe3+ complexes, respectively, closely paralleling the computed ΔE gap ordering. The agreement between the DFT-predicted electronic trend and the experimentally measured optical band gap trend across the series confirms that the identity of the coordinated metal ion through its d-electron configuration, ionic radius, and resulting coordination geometry is the primary factor governing the extent of electronic delocalization and optical response in these azo-oxime complexes, with Fe3+ producing the strongest narrowing effect, followed by Cu2+, then VO2+.
The computed HOMO-LUMO energy gap (ΔE, Table 4) and the experimentally determined optical band gap (e.g., from the α-hν analysis of the thin films, Table 6) are now compared directly across the series. Both quantities follow the same decreasing trend on going from the free ligand to the metal complexes: ΔE decreases from 3.66 eV (H2L) to 3.60–3.15 eV (VO2+/Cu2+ complexes) and 2.01 eV (Fe3+ complex), while the experimental Eg decreases correspondingly from 2.96 eV (H2L) to 2.27–2.01 eV (VO2+/Cu2+ complexes) and 1.83 eV (Fe3+ complex). Although the absolute values differ, as expected since DFT gas-phase HOMO–LUMO gaps and solid-state optical gaps derived from thin-film absorption edges are not numerically equivalent quantities, the two data sets track the same qualitative ordering (Fe3+ < Cu2+ < VO2+ < H2L), and this agreement is now stated explicitly in the text rather than left for the reader to infer by comparing two separate tables. We further link this shared trend to the same underlying cause discussed in that subsection: increasing metal-induced electronic delocalization narrows both the calculated frontier-orbital gap and the measured optical absorption edge in parallel, which we use as mutual validation between the computational and experimental results.
To clearly establish the correlation between the investigated complexes and their prospective photo-related applications, it is essential to analyze how their fundamental physical constants meet the specific requirements of optoelectronic and photovoltaic technologies.
For photovoltaic and solar cell absorber applications, an ideal material must possess an optical band gap that matches the solar spectrum to maximize photon harvesting. The experimental results demonstrate that upon complexation, the optical band gap (Eg) narrows significantly from 2.96 eV for the free ligand down to 1.83 eV for the Fe3+ complex film. This strong redshift shifts the absorption edge deeper into the visible light region, which is highly favorable for effective solar energy conversion. Furthermore, this reduction in (Eg) closely correlates with the observed increase in the free charge carrier density-to-effective mass ratio ((N/m*), which enhances the material’s optical conductivity (σ1 and σ2) under light illumination, thereby facilitating smoother electronic transitions across the transport gap.
For nonlinear optical (NLO) and switching applications, devices such as optical modulators and switches strictly rely on materials that exhibit strong light–matter interactions and fast electronic polarization under intense laser fields. The computational DFT and Molecular Electrostatic Potential (MEP) maps reveal that metal coordination induces substantial charge redistribution, leading to a dramatic rise in the dipole moments (up to 26.34 Debye). This highly asymmetric charge distribution creates a highly polarized electronic cloud. Experimentally, this structural polarization is verified by the exceptionally high values of third-order nonlinear optical susceptibility ( X ( 3 ) ) reaching 33.61 × 10⁻¹² esu for the Fe3+ film) and the nonlinear refractive index (n2). Consequently, these findings provide a direct physical correlation showing that the strong electronic delocalization and high nonlinear parameters render these thin films promising candidates for future testing and optimization in optical signal processing and photonic switching layouts.

7. Measurements and Equipment

7.1. Materials

All the chemicals utilized are analytical grade and were employed without additional purifying. The cupric acetate dihydrate Cu(CH3COO)2·2H2O (assay ≥ 99%), vanadyl sulphate trihydrate (VOSO4·3H2O), cupric nitrate trihydrate Cu(NO3)2·3H2O (assay ≥ 99.99%), cupric sulfate pentahydrate CuSO4·5H2O (assay ≥ 98%), and ferric chloride hexahydrate (FeCl3·6H2O), p-Toluidine (99.6%), absolute ethanol (assay = 99.5%), HCl (37%), NaNO2 (97%), 2-hydroxy benzaldehyde (99%), glacial acetic acid (assay = 99.7%), Hydroxylamine hydrochloride (assay = 99.0%) and DMSO (assay = 99.9%) were obtained from Merck (Merck KGaA, Darmstadt, Germany) or Sigma-Aldrich (Inc., St. Louis, MO, USA) Company. 2-hydroxy-5-(p-tolyldiazenyl)benzaldehyde was prepared by a previously reported method [101].

7.2. Physical Measurements and Analytical Techniques

At the Microanalytical Laboratory, Faculty of Science, Cairo University, Egypt, the contents of C, H, and N were examined. The complexes’ metallic and chloride ion contents are identified by the earlier descripted methods [102,103]. The synthetics’ IR spectrum (400–4000 cm−1) was recorded by KBr plates on Perkin–Elmer-1430 (Perkin-Elmer, Waltham, MA, USA) (infrared spectrophotometer). The UV–Vis spectrum was measured in a 1 cm quartz cell (200–1100 nm) on a Shimadzu UV-Vis 1650-PC spectrophotometer (Shimadzu Corporation, Kyoto, Japan). On a JEOL ECA-400 spectrometer (JEOL Ltd., Tokyo, Japan), the ligand’s NMR spectrum was recorded in DMSO-d6. On a Perkin Elmer 7 thermal analyzer (Perkin-Elmer, Waltham, MA, USA), the complexes’ thermogravimetric analysis (TGA) was measured under a nitrogen (N2) atmosphere (25 to 800 °C/HR 10 °C/min). A Gouy balance (Matthey’s Balance)(Johnson Matthey, London, UK.) was used to measure the magnetic susceptibility at 298 K [104]. A Tacussel CD6NG conductivity bridge (Tacussel, Chelmsford, UK.) was used to test the complexes’ molar conductance (10−3 M in DMSO at 25 °C), which was then computed using a standard formula [105]. On a Varian E-109 spectrophotometer (Varian Associates, Palo Alto, CA, USA) the solid complexes’ Electron Spin Resonance (ESR) spectrum was recorded at room temperature using DPPH as a standard. Repeated attempts to get single crystals of the Cu2+, VO2+, and Fe3+ complexes suitable for single-crystal X-ray diffraction were unsuccessful. Using several mobile phases, thin-layer chromatography (TLC) was used to verify the synthetic chemicals’ purity.

7.3. Synthesis of the Ligand (H2L, 1)

The azo-oxime, 2-hydroxy-5-(p-tolyldiazenyl) benzaldehyde oxime (H2L, 1) was synthesized by refluxing in the presence of sodium acetate a mixture of ethanolic solution of 2-hydroxy-5-(p-tolyldiazenyl)benzaldehyde (1 mmol, 240 mg) and hydroxylamine hydrochloride (1 mmol, 69.5 mg). After three hours, a colored solid that started to appear was removed and washed with hot ethanol, then dried over P4O10 (Figure 13). Color: yellowish brown, m.p. 220 °C, (255 mg, 0.233 mmol, 91.3%). Elemental analysis (Anal.) for C14H13N3O2 (255.28 g /mol): Found (calc.) %C 65.45 (65.87), %H 4.89 (5.13), %N 16.09 (16.46). FT-IR (KBr, cm−1), 3400 ν(OH), 3060w, 3023w, 2920w, 2850 ν(C-H), 1620 ν(C=N), 1480 ν(N=N), 1270 ν(C-O), 1010 ν(N-O). 1H-NMR (DMSO-d6, 300 MHz): δ(ppm) = 11.54, (s, 1H, OH27), 11.06 (s, 1H, OH31), 8.40 (s, 1H, CH32), 8.11 (s, 1H, C-H19), 7.82 (s, 1H, CH17), 7.16 (d, 1H, CH21), 7.60 (d, 1H, CH8&9), 7.32 (d, 1H, CH7&10), 2.39 (s, 3H, CH23–25). 13C-NMR (DMSO-d6/90 Mhz): δ(ppm) = 150.50 (C3), 130.36 (C1&5), 122.82 (C2&4), 141.37 (C6), 146.10 (C13), 125.75 (C14), 121.76 (C15), 119.76 (C16), 1217.39 (C18), 159.24 (C20), 21.46 (C22), 145.46 (C28).

7.4. Procedure for Preparing the Complexes

The Cu2+, VO2+ and Fe3+ complexes were prepared by refluxing an equimolar quantity of 2-hydroxy-5-(p-tolyldiazenyl) benzaldehyde oxime ligand (H2L, 1) (255 mg, 30 mL/EtOH) with the solution (EtOH/30 mL) of the following salts: VOSO4.3H2O (217 mg), Cu(CH3COO)2·2H2O (199.7 mg), Cu(NO3)2.3H2O (241.6 mg), and CuSO4·5H2O (249.7 mg) and FeCl3·6H2O (271.3 mg) in presence/absence of triethyl amine. After refluxing for 4 h, the resulting-colored precipitates were collected, washed with hot ethanol, and dried over P4O10.

7.4.1. VO2+-Complex (2)

[VO(H2L)(SO4)(H2O)2]; Color: olive, yield (63.8%), m.p. > 300 °C, Λm = 21.3 ohm−1 cm2 mol−1. The elemental formula (C14H17VN3SO9, 454.30 g/mol): Found (calcd.) %C 36.68 (37.01), %H 3.87 (3.77), %N 9.00 (9.25), %VO 10.90 (11.21), %S 6.90 (7.06). FT-IR (KBr, cm−1), 3445, 3200 ν(OH), 3060w, 3025, 2916w, 2873 ν(C-H), 1573 ν(C=N), 1480 ν(N=N), 1285 ν(C-OH), 1110 ν(N-OH), 963 ν(V=O), 580 ν(V←O), 473 ν(V←N).

7.4.2. Cu2+-Complex (3)

[Cu(H2L)(OAc)2(H2O)2]; Color: olive, yield (63.8%), m.p. > 300 °C, Λm = 13.1 ohm−1 cm2 mol−1. The elemental formula C18H23CuN3O8, 472.94 g/mol): Found (calcd.) %C 45.49 (45.71), %H 4.87 (4.90), %N 9.61 (9.89), %Cu 13.00 (13.44). FT-IR (KBr, cm−1), 3440, 3330 ν(OH), 3020w, 2930w, 2850 ν(C-H), 1595 ν(C=N), 1465 ν(N=N), 1305 ν(C-OH), 1050 ν(N-OH), 510 ν(Cu←O), 478 ν(Cu←N), 1540/1350(190) νs(CH3COO)/νas(CH3COO)(Δ).

7.4.3. Cu2+-Complex (4)

[Cu(H2L)(NO3)2(H2O)2]; Color: olive, yield (63.8%), m.p. > 300 °C, Λm = 17.3 ohm−1 cm2 mol−1. The elemental formula C14H17CuN5O8, 478.86 g/mol): Found (calcd.) %C 34.88 (35.12), %H 3.17 (3.58), %N 14.22 (14.63), %Cu 12.93 (13.27). FT-IR (KBr, cm−1), 3545, 3330, 3440, 3350 ν(OH), 3022w, 2980w, 2930, 2850 ν(C-H), 1593 ν(C=N), 1475ν(N=N), 1308 ν(C-OH), 1077 ν(N-O), 512 ν(Cu←O), 479 ν(Cu←N), 1409, 1345, 920 ν (NO3)(Δ = 64).

7.4.4. Cu2+-Complex (5)

[Cu(H2L)(SO4)(H2O)]; Color: olive, yield (63.8%), m.p. > 300 °C, Λm = 14.9 ohm−1cm2mol−1. The elemental formula C14H15CuN3SO7, 432.89 g/mol): Found (calcd.) %C 38.55 (38.84), %H 3.09 (3.49), %N 9.44 (9.71), %Cu 14.77 (14.68), %S 6.99 (7.41). FT-IR (KBr, cm−1), 3440, 3335 ν(OH), 3019w, 2990w, 2927 ν(C-H), 1590 ν(C=N), 1474 ν(N=N), 1290 ν(C-OH), 1055 ν(N-OH), 523 ν(Cu←O), 478 ν(Cu←N), 1190, 1055 ν(SO4).

7.4.5. Fe3+-Complex (6)

[Fe(L)Cl3(H2O)].2H2O; Color: brown, yield (66.7%), m.p. > 300 °C, Λm = 24.1 ohm−1cm2mol−1. The elemental formula (C14H19FeN3O5Cl3, 471.52 g/mol): Found (calcd.) %C 35.31 (35.66), %H 3.79 (4.06), %N 8.91 (8.91), %Fe 11.58 (11.84), %Cl 22.11 (22.55). FT-IR (KBr, cm−1), 3360, 3200 ν(OH), 3000w, 2960w, 2855 ν(C-H), 1575 ν(C=N), 1470 ν(N=N), 1301 ν(C-O), 1105 ν(N-O), 578 ν(Fe←O), 483 ν(Fe←N).

7.5. Density Functional Theory (DFT) Studies

To gain deeper insight into the molecular structure of the azo–oxime ligand and its Cu2+, VO2+, and Fe3+ complexes, geometry optimization and quantum chemical calculations were performed using Density Functional Theory (DFT) as implemented in the Gaussian 09 software package, with GaussView employed for visualization and analysis of the optimized geometries and associated molecular parameters. All calculations were carried out at the B3LYP hybrid exchange-correlation functional level, using the all-electron 6-311G(d, p) basis set for all atoms, including the Cu, V, and Fe metal centers, without the use of an effective core potential. Geometry optimizations were performed in the gas phase, with no symmetry constraints imposed on the starting geometries. Given the open-shell nature of the metal complexes, calculations were carried out using the unrestricted (UB3LYP) formalism, with spin multiplicities assigned consistent with the experimentally determined magnetic moments: a doublet ground state (S = 1/2, one unpaired electron) for the d9 Cu2+ complexes and the d1 VO2+ complex, and a high-spin sextet ground state (S = 5/2, five unpaired electrons) for the d5 of Fe3+ complex, in agreement with the 6A1g term symbol derived from the electronic spectral analysis [68].

7.6. Preparation of Synthetic Films

Synthetic films were thermally deposited using a coating machine (Edward model E 306 A, Crawley, UK) onto cleaned quartz substrates under ambient temperature and vacuum pressure of ~2.5 10−4 Pa. The powder of H2L and its complex metals were put in a Mo-boat that was gradually heated. The distance between the Mo-boat and substrates is 20 cm. The film thickness was ~200 nm, and the deposition rate (8 nm/s) was controlled by using a TM-350 MAXTEK, Inc., Cypress, CA, USA thickness monitor. For certainty, Tolansky’s interferometric method was used to check the film thickness [106]. Both the film transmittance (T) and reflection (R) spectra were measured using a JASCO model V-570 UV-VIS-NIR spectrophotometer (JASCO Corporation, Tokyo, Japan) through the 300–1100 nm range.

8. Conclusions

Mononuclear complexes of Cu2+, VO2+, and Fe3+ with the oxime-based azo ligand 2-hydroxy-5-(p-tolyldiazenyl) benzaldehyde oxime (H2L) were successfully synthesized via a straightforward equimolar reaction method. The obtained complexes were thoroughly characterized using elemental analysis, thermal techniques, and various spectroscopic tools, and the experimental findings were further supported by density functional theory (DFT) calculations. Spectral investigations revealed that azo oxime acts as a neutral bidentate chelating ligand, coordinating to the metal ions through the nitrogen atom of the protonated oxime group and the oxygen atom of the protonated phenolic hydroxyl group. The ESR spectra of Cu2+, VO2+ complexes are typical to d9 configuration with an axial symmetry type of a d(x2−y2) ground state and a significantly covalent environment. The metal centers adopt distorted octahedral geometries in all complexes. Computational studies performed at the DFT/B3LYP/6-311(pd) level provided valuable insight into the optimized geometries, dipole moments, frontier molecular orbitals (HOMO-LUMO), global reactivity descriptors, and molecular electrostatic potential (MEP) maps. The theoretical results strongly supported the proposed structural features of the Cu2+, VO2+, and Fe3+ complexes. Moreover, the linear and nonlinear optical constants for H2L and its complex films have been estimated and well discussed. Many different techniques are used to evaluate the optical bandgap value (Eg). The Fe3+ complex film has the smallest value of Eg value (1.83 eV), which is remarkably close to the Eg value of many semiconductors, viz. CdSxSe1−x alloys, Cu(In,Ga)Se, and CdSe. This renders the investigated films potential candidates for prospective exploration in various technological fields, such as solar cells, photo detectors, optical sensors, and infrared optics. Although the actual evaluation of device performance was not within the scope of this study, the obtained values indicate that the Eg value of H2L and its VO2+, Cu2+(3), Cu2+(5), and Fe3+(6) complex films change between 2.96 and 1.83 eV, making them promising materials for further testing as an absorbance layer in solar cells, light-emitting diodes, photo detectors, and fiber optics. Based on n and k values, the complex dielectric constant and conductivity have been estimated. Also, the nonlinear refractive index ( n 2 ) , the first (χ(1)) and third (χ(3)) orders of nonlinear susceptibilities have been investigated. Based on these preliminary optical investigations, the ligand and its complex films exhibit encouraging fundamental constants that justify further research as potential future contenders for integration into signal processing, optical modulators, and switching designs, provided that practical device performance is thoroughly evaluated.

Supplementary Materials

The following supporting information can be downloaded at: https://www.mdpi.com/article/10.3390/inorganics14090244/s1.

Author Contributions

K.A.A.: Funding Acquisition, Methodology, Formal Analysis, Investigation, Supervisor, Project Administration, Resources. M.M.E.: Conceptualization, Data Curation, Formal Analysis, Funding Acquisition, Investigation, Methodology, Software, Supervision, Validation, Visualization, Writing—Original Draft Preparation, Writing—Review and Editing. T.M.S.: Formal Analysis, Funding Acquisition, Investigation, Methodology, Project Administration, Resources. All authors have read and agreed to the published version of the manuscript.

Funding

This work was funded by the University of Jeddah, Jeddah, Saudi Arabia, under grant No. (UJ-25-DR-20144). The authors, therefore, thank the University of Jeddah for technical and financial support.

Data Availability Statement

The original contributions presented in this study are included in the article/Supplementary Material. Further inquiries can be directed to the corresponding author.

Conflicts of Interest

The authors declare that they have no conflicts of interest.

References

  1. Rahman, M.M.; Oni, A.O.; Gemechu, E.; Kumar, A. Assessment of energy storage technologies: A review. En. Conv. Manag. 2020, 223, 113295. [Google Scholar] [CrossRef] [Scilit]
  2. Cheong, K.Y.; Impellizzeri, G.; Fraga, M.A. Emerging Materials for Energy Conversion and Storage; Elsevier: Amsterdam, The Netherlands, 2018. [Google Scholar]
  3. Zhou, J.; Yu, X.; Zhou, J.; Lu, B. Polyimide/metal-organic framework hybrid for high performance Al–Organic battery. Energy Storage Mater. 2020, 31, 58–63. [Google Scholar] [CrossRef] [Scilit]
  4. Ryoo, G.; Kim, S.K.; Lee, D.K.; Kim, Y.J.; Han, Y.S.; Jung, K.H. Energy Storage Performance of Electrode Materials Derived from Manganese Metal-Organic Frameworks. Nanomaterials 2024, 14, 503. [Google Scholar] [CrossRef] [Scilit] [PubMed]
  5. Chettiannan, B.; Dhandapani, E.; Arumugam, G.; Rajendran, R.; Selvaraj, M. Metal-organic frameworks: A comprehensive review on common approaches to enhance the energy storage capacity in supercapacitor. Coord. Chem. Rev. 2024, 518, 216048. [Google Scholar] [CrossRef] [Scilit]
  6. Sandhu, Z.A.; Raza, M.A.; Awwad, N.S.; Ibrahium, H.A.; Farwa, U.; Ashraf, S.; Dildar, A.; Fatima, E.; Ashraf, S.; Ali, F. Metal–organic frameworks for next-generation energy storage devices; a systematic review. Mater. Adv. 2024, 5, 30–50. [Google Scholar] [CrossRef] [Scilit]
  7. Mirica, L.M.; Khusnutdinova, J.R. Structure and electronic properties of Pd(III) complexes. Coord. Chem. Rev. 2013, 257, 299–314. [Google Scholar] [CrossRef] [Scilit]
  8. Xu, C.; Zhang, Z.-Y.; Ren, Z.-G.; Zhou, L.-K.; Li, H.-X.; Wang, H.-F.; Sun, Z.-R.; Lang, J.-P. Novel [Tp*WS3Cu2]-Based Coordination Compounds: Assembly, Crystal Structures, and Third-Order Nonlinear Optical Properties. Cryst. Growth Des. 2013, 13, 2530–2539. [Google Scholar] [CrossRef] [Scilit]
  9. Irving, H.M.N.H. Coordination compounds in analytical chemistry. Pure Appl. Chem. 1978, 50, 1129–1146. [Google Scholar] [CrossRef] [Scilit]
  10. Chen, C.-C.; Cai, Y.; Wang, L.-F.; Wu, Y.-D.; Yin, H.-J.; Zhou, J.-R.; Ni, C.-L.; Liu, W. Three Silver(I) Coordination Polymers Based on Pyridyl Ligands and Auxiliary Carboxylic Ligands: Luminescence and Efficient Sensing Properties. Inorg. Chem. 2021, 60, 5463–5473. [Google Scholar] [CrossRef] [Scilit] [PubMed]
  11. Zhang, X.; Hu, J.; Li, J.; Liu, T.; Wang, J.; Ma, X. A bifunctional luminescent coordination polymer as recyclable sensor for detecting TNP and Fe3+ with high selectivity and sensitivity. Inorg. Chim. Acta 2019, 486, 556–561. [Google Scholar] [CrossRef] [Scilit]
  12. Mingalev, P.G.; Olenin, A.Y.; Lisichkin, G.V. Partial Catalytic Oxidation of Alcohols: 2. Catalysts Based on Transition Metal Compounds (a Review). Pet. Chem. 2019, 59, 1–10. [Google Scholar] [CrossRef] [Scilit]
  13. Ali, M.S.; El-Saied, F.A.; Shakdofa, M.M.E.; Karnik, S.; Jaragh-Alhadad, L.A. Synthesis and characterization of thiosemicarbazone metal complexes: Crystal structure, and antiproliferation activity against breast (MCF7) and lung (A549) cancers. J. Mol. Struct. 2023, 1274, 134485. [Google Scholar] [CrossRef] [Scilit]
  14. Medici, S.; Peana, M.; Crisponi, G.; Nurchi, V.M.; Lachowicz, J.I.; Remelli, M.; Zoroddu, M.A. Silver coordination compounds: A new horizon in medicine. Coord. Chem. Rev. 2016, 327–328, 349–359. [Google Scholar] [CrossRef] [Scilit]
  15. Malinowski, J.; Zych, D.; Jacewicz, D.; Gawdzik, B.; Drzeżdżon, J. Application of Coordination Compounds with Transition Metal Ions in the Chemical Industry—A Review. Int. J. Mol. Sci. 2020, 21, 5443. [Google Scholar] [CrossRef] [Scilit] [PubMed]
  16. Wang, Y.; Tian, J.; Sun, Z.; Wang, L.; Xu, R.; Li, M.; Chen, Z. A comprehensive review of battery modeling and state estimation approaches for advanced battery management systems. Renew. Sustain. Energy Rev. 2020, 131, 110015. [Google Scholar] [CrossRef] [Scilit]
  17. Liu, S.; Wei, L.; Wang, H. Review on reliability of supercapacitors in energy storage applications. Appl. Energy 2020, 278, 115436. [Google Scholar] [CrossRef] [Scilit]
  18. Shakdofa, M.M.E.; El-Saied, F.A.; Rasras, A.J.; Al-Hakimi, A.N. Transition metal complexes of a hydrazone–oxime ligand containing the isonicotinoyl moiety: Synthesis, characterization and microbicide activities. Appl. Organomet. Chem. 2018, 32, e4376. [Google Scholar] [CrossRef] [Scilit]
  19. Morsy, N.A.; Aly, K.A.; Mohery, M.; Ebrahium, M.M.; Kumar, E.R. Optical characteristics of synthetic Cu2+ complex films derived from 4-chloro-N-(3-(hydroxyimino) butan-2-ylidene) benzohydrazide for optoelectronic and photovoltaic applications. J. Mol. Struct. 2024, 1316, 138820. [Google Scholar] [CrossRef] [Scilit]
  20. Saleem, Q.M.; Ebrahium, M.M.; Aly, K.A.; Saddeek, Y.B. Optical properties of transition metals complex films derived from hydrazone oxime for optoelectronic devices. J. Mol. Struct. 2025, 1321, 140196. [Google Scholar] [CrossRef] [Scilit]
  21. Shatir, T.M.; Aly, K.A.; Ebrahium, M.M.; Saddeek, Y.B.; Ranjith Kumar, E. Linear and non-linear optical and dielectric properties of transition metals complexes films derived from Azo-Schiff base for photovoltaic applications. J. Mol. Liq. 2024, 401, 124636. [Google Scholar] [CrossRef] [Scilit]
  22. Zhang, Q.; Liu, Z.; Zhao, B.; Cheng, Y.; Zhang, L.; Wu, H.-H.; Wang, M.-S.; Dai, S.; Zhang, K.; Ding, D.; et al. Design and understanding of dendritic mixed-metal hydroxide nanosheets@N-doped carbon nanotube array electrode for high-performance asymmetric supercapacitors. Energy Storage Mater. 2019, 16, 632–645. [Google Scholar] [CrossRef] [Scilit]
  23. Geary, W.J. The use of conductivity measurements in organic solvents for the characterisation of coordination compounds. Coord. Chem. Rev. 1971, 7, 81–122. [Google Scholar] [CrossRef] [Scilit]
  24. Serbest, K.; Dural, T.; Emirik, M.; Zengin, A.; Faiz, Ö. Heteroligand bivalent transition metal complexes with an azo-oxime ligand and 1,10-phenanthroline: Synthesis, spectroscopy, thermal analysis, DFT calculations and SOD-mimetic activities. J. Mol. Struct. 2021, 1229, 129579. [Google Scholar] [CrossRef] [Scilit]
  25. Korkmaz, Ü.; Findik, B.T.; Dede, B.; Karipcin, F. Synthesis, structural elucidation, in vitro antibacterial activity, DFT calculations, and molecular docking aspects of mixed-ligand complexes of a novel oxime and phenylalanine. Bioorg. Chem. 2022, 121, 105685. [Google Scholar] [CrossRef] [Scilit] [PubMed]
  26. Chitrapriya, N.; Mahalingam, V.; Zeller, M.; Lee, H.; Natarajan, K. Synthesis, characterization, DNA binding and cleavage studies of Ru(II) complexes containing oxime ligands. J. Mol. Struct. 2010, 984, 30–38. [Google Scholar] [CrossRef] [Scilit]
  27. El-Aarag, B.; El-Saied, F.; Salem, T.; Khedr, N.; Khalifa, S.A.M.; El-Seedi, H.R. New metal complexes derived from diacetylmonoxime-n(4)antipyrinylthiosemicarbazone: Synthesis, characterization and evaluation of antitumor activity against Ehrlich solid tumors induced in mice. Arab. J. Chem. 2021, 14, 102993. [Google Scholar] [CrossRef] [Scilit]
  28. Aslan, H.G.; Özcan, S.; Karacan, N. Synthesis, characterization and antimicrobial activity of salicylaldehyde benzenesulfonylhydrazone (Hsalbsmh)and its Nickel(II), Palladium(II), Platinum(II), Copper(II), Cobalt(II) complexes. Inorg. Chem. Commun. 2011, 14, 1550–1553. [Google Scholar] [CrossRef] [Scilit]
  29. El-Wahab, Z.H.A.; Mashaly, M.M.; Salman, A.A.; El-Shetary, B.A.; Faheim, A.A. Co(II), Ce(III) and UO2(VI) bis-salicylatothiosemicarbazide complexes: Binary and ternary complexes, thermal studies and antimicrobial activity. Spectrochim. Acta Part A Mol. Biomol. Spectrosc. 2004, 60, 2861–2873. [Google Scholar] [CrossRef] [Scilit] [PubMed]
  30. Pavia, D.L.; Lampman, G.M.; Kriz, G.S.; Vyvyan, J.R. Introduction to Spectroscopy, 5th ed.; Cengage Learning: Independence, KY, USA, 2013. [Google Scholar]
  31. Shakdofa, M.M.E.; Morsy, N.A.; Rasras, A.J.; Al-Hakimi, A.N.; Shakdofa, A.M.E. Synthesis, characterization, and density functional theory studies of hydrazone–oxime ligand derived from 2,4,6-trichlorophenyl hydrazine and its metal complexes searching for new antimicrobial drugs. Appl. Organomet. Chem. 2021, 35, e6111. [Google Scholar] [CrossRef] [Scilit]
  32. Nakamoto, K. Infrared and Raman Spectra of Inorganic and Coordination Compounds Part B: Applications in Coordination, Organometallic, and Bioinorganic Chemistry, 6th ed.; John Wiley & Sons INC: Hoboken, NJ, USA, 2009; p. 424. [Google Scholar]
  33. Saleem, Q.M.; Ebrahium, M.M.; Al-Hakimi, A.N.; Shakdofa, A.M. Ligational behavior of bidentate NO-donor, 2-(((1H-1,2,4-triazol-5-yl)imino)methyl)-4-(o-tolyldiazenyl)phenol towards VO2+, Fe3+, Ru3+, Co2+, Mn2+, Ni2+, Cu2+ Zn2+ and ions preparation, experimental, theoretical characterization, and microbicidal investigation. J. Taibah Univ. Sci. 2024, 18, 2289692. [Google Scholar] [CrossRef] [Scilit]
  34. Pandhurnekar, C.P.; Meshram, E.M.; Chopde, H.N.; Batra, R.J. Synthesis, Characterization, and Biological Activity of 4-(2-Hydroxy-5-(aryl-diazenyl)phenyl)-6-(aryl)pyrimidin-2-ols Derivatives. Org. Chem. Inter. 2013, 2013, 582079. [Google Scholar] [CrossRef] [Scilit]
  35. Baeva, L.A.; Biktasheva, L.F.; Fatykhov, A.A.; Lyapina, N.K. Condensation of acetylacetone with formaldehyde and thiols. Russ. J. Org. Chem. 2013, 49, 1283–1286. [Google Scholar] [CrossRef] [Scilit]
  36. Rageh, N.M.; Mawgoud, A.M.A.; Mostafa, H.M. Electronic spectra, solvatochromic behaviour, and acidity constants of some new azocoumarin derivatives. Chem. Pap. 1999, 53, 107–113. [Google Scholar]
  37. Gup, R.; Kirkan, B. Synthesis and spectroscopic studies of copper(II) and nickel(II) complexes containing hydrazonic ligands and heterocyclic coligand. Spectrochim. Acta–Part A Mol. Biomol. Spectrosc. 2005, 62, 1188–1195. [Google Scholar] [CrossRef] [Scilit] [PubMed]
  38. Reddy, S.L.; Endo, T.; Reddy, G.S. Electronic (Absorption) Spectra of 3d Transition Metal Complexes, Advanced Aspects of Spectroscopy; InTech: Rijeka, UK, 2012. [Google Scholar]
  39. Lever, A.B.P. Inorganic Electronic Spectroscopy; Elsevier Science: Amsterdam, The Netherlands, 1984; p. 863. [Google Scholar]
  40. Sreeja, P.B.; Kurup, M.R.P. Synthesis and spectral characterization of ternary complexes of oxovanadium(IV) containing some acid hydrazones and 2,2′-bipyridine. Spectrochim. Acta Part A Mol. Biomol. Spectrosc. 2005, 61, 331–336. [Google Scholar] [CrossRef] [Scilit] [PubMed]
  41. Sathyanarayana, D.N. Electronic Absorption Spectroscopy and Related Techniques; Universities Press: Hyderabad, India, 2001; p. 526. [Google Scholar]
  42. El-Saied, F.A.; Shakdofa, M.M.E.; El-Tabl, A.S.; Abd-Elzaher, M.M.A. Coordination behaviour of N′1,N′4-bis((1, 5-dimethyl-3-oxo-2-phenyl-2,3-dihydro-1H-pyrazol-4-yl)methylene) succinohydrazide toward transition metal ions and their antimicrobial activities. Main Group Chem. 2014, 13, 87–103. [Google Scholar] [CrossRef] [Scilit]
  43. Hanson, G.R.; Kabanos, T.A.; Keramidas, A.D.; Mentzafos, D.; Terzis, A. Oxovanadium(IV)-amide binding. Synthetic, structural, and physical studies of {N-[2-(4-oxopent-2-en-2-ylamino)phenyl]pyridine-2-carboxamido}oxovanadium(IV) and {N-[2-(4-phenyl-4-oxobut-2-en-2-ylamino)phenyl]pyridine-2-carboxamido}oxo- vanadium(IV). Inorg. Chem. 1992, 31, 2587–2594. [Google Scholar] [CrossRef] [Scilit]
  44. El-Tabl, A.S.; Shakdofa, M.M.E.; Shakdofa, A.M.E. Metal complexes of N′-[2-hydroxy-5-(phenyldiazenyl)-benzylidene] isonicotinohydrazide. Synthesis, spectroscopic characterization and antimicrobial activity. J. Serb. Chem. Soc. 2013, 78, 39–55. [Google Scholar] [CrossRef] [Scilit]
  45. Dong, Y.; Narla, R.K.; Sudbeck, E.; Uckun, F.M. Synthesis, X-ray structure, and anti-leukemic activity of oxovanadium(IV) complexes. J. Inorg. Biochem. 2000, 78, 321–330. [Google Scholar] [CrossRef] [Scilit] [PubMed]
  46. Dodwad, S.S.; Dhamnaskar, R.S.; Prabhu, P.S. Electron spin resonance spectral studies of vanadyl complexes with some schiff bases. Polyhedron 1989, 8, 1748–1750. [Google Scholar] [CrossRef] [Scilit]
  47. Raman, N.; Pitchaikani Raja, Y.; Kulandaisamy, A. Synthesis and characterisation of Cu(II), Ni(II), Mn(II), Zn(II) and VO(II) Schiff base complexes derived from o-phenylenediamine and acetoacetanilide. Proc. Indian Acad. Sci. (Chem. Sci.) 2001, 113, 183–189. [Google Scholar] [CrossRef] [Scilit]
  48. Patron, M.; Kivelson, D.; Schwartz, R.N. Electron spin resonance spectra of vanadyl acetylacetonate in n-alkanes. A study of rotational relaxation. J. Phys. Chem. 1982, 86, 518–524. [Google Scholar] [CrossRef] [Scilit]
  49. Walker, F.A.; Carlin, R.L.; Rieger, P.H. ESR Studies of Coordination to the Sixth Position of Vanadyl Acetylacetonate. J. Chem. Phys. 1966, 45, 4181–4189. [Google Scholar] [CrossRef] [Scilit]
  50. McGarvey, B.R.; Tepper, E.L. Paramagnetic resonance absorption studies in the autoxidation of titanium(III) and vanadium(III) trisacetylacetonates. Inorg. Chem. 1969, 8, 498–505. [Google Scholar] [CrossRef] [Scilit]
  51. Zaky, R.R.; Ibrahim, K.M.; Gabr, I.M. Bivalent transition metal complexes of o-hydroxyacetophenone [N-(3-hydroxy-2-naphthoyl)] hydrazone: Spectroscopic, antibacterial, antifungal activity and thermogravimetric studies. Spectrochim. Acta Part A Mol. Biomol. Spectrosc. 2011, 81, 28–34. [Google Scholar] [CrossRef] [Scilit] [PubMed]
  52. Hathaway, B.J.; Billing, D.E. The electronic properties and stereochemistry of mono-nuclear complexes of the copper(II) ion. Coord. Chem. Rev. 1970, 5, 143–207. [Google Scholar] [CrossRef] [Scilit]
  53. Brown, D.R.; West, D.X. An ESR study of addition species formed between bis(2-thiopyridine N-oxide)Cu(II) and heterocyclic and aliphatic amines. J. Inorg. Nucl. Chem. 1981, 43, 1017–1021. [Google Scholar] [CrossRef] [Scilit]
  54. Nagashri, K.; Joseph, J.; Dhanaraj, C.J. Copper(II) complexes of hydroxyflavone derivatives as potential bioactive molecule to combat antioxidants: Synthesis, characterization and pharmacological activities. Appl. Organomet. Chem. 2011, 25, 704–717. [Google Scholar] [CrossRef] [Scilit]
  55. Tomlinson, A.A.G.; Hathaway, B.J. The electronic properties and stereochemistry of the copper(II) ion. Part II. The monoamine adducts of bisethylenediaminecopper(II) complexes. J. Chem. Soc. A Inorg. Phys. Theo. 1968, 3, 1685–1688. [Google Scholar] [CrossRef] [Scilit]
  56. El-Tabl, A.S.; Aly, F.A.; Shakdofa, M.M.E.; Shakdofa, A.M.E. Synthesis, characterization, and biological activity of metal complexes of azohydrazone ligand. J. Coord. Chem. 2010, 63, 700–712. [Google Scholar] [CrossRef] [Scilit]
  57. Al-Hakimi, A.N.; El-Tabl, A.S.; Shakdofa, M.M.E. Coordination and biological behaviour of 2-(p-toluidino)-N’-(3-oxo-1,3- diphenylpropylidene) acetohydrazide and its metal complexes. J. Chem. Res. 2009, 2009, 770–774. [Google Scholar] [CrossRef] [Scilit]
  58. El-Tabl, A.S.; Shakdofa, M.M.E.; Whaba, M.A. Synthesis, characterization and fungicidal activity of binary and ternary metal(II) complexes derived from 4,4′-((4-nitro-1,2-phenylene) bis(azanylylidene))bis(3-(hydroxyimino)pentan-2-one). Spectrochim. Acta Part A Mol. Biomol. Spectrosc. 2015, 136, 1941–1949. [Google Scholar] [CrossRef] [Scilit] [PubMed]
  59. Kivelson, D.; Neiman, R. ESR Studies on the Bonding in Copper Complexes. J. Chem. Phys. 1961, 35, 149–155. [Google Scholar] [CrossRef] [Scilit]
  60. Mangalam, N.A.; Prathapachandra Kurup, M.R. Versatile binding properties of a di-2-pyridyl ketone nicotinoylhydrazone ligand: Crystal structure of a Cu(II) complex. Spectrochim. Acta Part A Mol. Biomol. Spectrosc. 2011, 78, 926–934. [Google Scholar] [CrossRef] [Scilit] [PubMed]
  61. Shauib, N.M.; Elassar, A.Z.A.; El-Dissouky, A. Synthesis and spectroscopic characterization of copper(II) complexes with the polydentate chelating ligand 4,4′-[1,4-phenylenedi(nitrilo)dipente-2-one. Spectrochim. Acta Part A Mol. Biomol. Spectrosc. 2006, 63, 714–722. [Google Scholar] [CrossRef] [Scilit] [PubMed]
  62. Ray, R.K.; Kauffmann, G.B. An EPR study of copper(II)-substituted biguanide complexes. Part III. Inorg. Chim. Acta 1990, 174, 237–244. [Google Scholar] [CrossRef] [Scilit]
  63. Ray, R.K.; Kauffman, G.B. An EPR study of some copper(II) coordination compounds of substituted biguanides. Part IV. Inorg. Chim. Acta 1990, 174, 257–262. [Google Scholar] [CrossRef] [Scilit]
  64. El-Tabl, A.S. Synthesis and spectral studies on mononuclear copper(II) complexes of isonitrosoacetylacetone ligand. Pol. J. Chem. 1997, 71, 1213–1222. [Google Scholar]
  65. Swamy, B.; Swamy, J.R. Preparation and characterization of some transition metal complexes of benzoic acid hydrazones of 2-aminonicotinaldehyde. Transit. Met. Chem. 1991, 16, 35–38. [Google Scholar] [CrossRef] [Scilit]
  66. Yang, L.; Powell, D.R.; Houser, R.P. Structural variation in copper(i) complexes with pyridylmethylamide ligands: Structural analysis with a new four-coordinate geometry index, τ4. Dalton Trans. 2007, 955–964. [Google Scholar] [CrossRef] [Scilit] [PubMed]
  67. Ismael, M.; Abdou, A.; Abdel-Mawgoud, A.-M. Synthesis, Characterization, Modeling, and Antimicrobial Activity of FeIII, CoII, NiII, CuII, and ZnII Complexes Based on Tri-substituted Imidazole Ligand. Z. Anorg. Allg. Chem. 2018, 644, 1203–1214. [Google Scholar] [CrossRef] [Scilit]
  68. Frisch, M.J.; Trucks, G.W.; Schlegel, H.B.; Scuseria, G.E.; Robb, M.A.; Cheeseman, J.R.; Scalmani, G.; Barone, V.; Petersson, G.A.; Nakatsuji, H.; et al. Gaussian 09, Revision A02; Gaussian, Inc: Wallingford CT, USA, 2016. [Google Scholar]
  69. Waheeb, A.S.; Awad, M.A.; Kyhoiesh, H.A.K.; Kadhum, A.M.; Thabit, J.A.; Lazam, S.A. Synthesis, and characterization of Ni(II), and Cu(II) metal complexes containing new azo dye ligand (N,N,N) and evaluation of their biological activities supported by DFT studies, molecular docking, ADMET profiling, drug-likeness analysis and toxicity prediction. J. Mol. Struct. 2025, 1321, 139867. [Google Scholar] [CrossRef] [Scilit]
  70. Güleryüz, C.; Hasan, D.M.; Awad, M.A.; Waheeb, A.S.; Hassan, A.U.; Mohyuddin, A.; Kyhoiesh, H.A.K.; Alotaibi, M.T. Molecular engineering on tyrian puprle natural dye as TiO2 based fined tuned photovoltaic dye material: DFT molecular analysis. J. Mol. Graph. Model. 2025, 134, 108894. [Google Scholar] [CrossRef] [Scilit] [PubMed]
  71. Parr, R.G.; Szentpály, L.v.; Liu, S. Electrophilicity Index. J. Am. Chem. Soc. 1999, 121, 1922–1924. [Google Scholar] [CrossRef] [Scilit]
  72. Wang, L.; Ding, J.; Pan, L.; Cao, D.; Jiang, H.; Ding, X. Quantum chemical descriptors in quantitative structure–activity relationship models and their applications. Chemom. Intell. Lab. Syst. 2021, 217, 104384. [Google Scholar] [CrossRef] [Scilit]
  73. Gázquez, J.L.; Cedillo, A.; Vela, A. Electrodonating and Electroaccepting Powers. J. Phys. Chem. A 2007, 111, 1966–1970. [Google Scholar] [CrossRef] [Scilit] [PubMed]
  74. Chattaraj, P.K.; Chakraborty, A.; Giri, S. Net Electrophilicity. J. Phys. Chem. A 2009, 113, 10068–10074. [Google Scholar] [CrossRef] [Scilit] [PubMed]
  75. Domingo, L.R.; Chamorro, E.; Pérez, P. Understanding the Reactivity of Captodative Ethylenes in Polar Cycloaddition Reactions. A Theoretical Study. J. Org. Chem. 2008, 73, 4615–4624. [Google Scholar] [CrossRef] [Scilit] [PubMed]
  76. Kiyooka, S.-i.; Kaneno, D.; Fujiyama, R. Intrinsic reactivity index as a single scale directed toward both electrophilicity and nucleophilicity using frontier molecular orbitals. Tetrahedron 2013, 69, 4247–4258. [Google Scholar] [CrossRef] [Scilit]
  77. Ayers, P.W.; Anderson, J.S.M.; Rodriguez, J.I.; Jawed, Z. Indices for predicting the quality of leaving groups. Phys. Chem. Chem. Phys. 2005, 7, 1918–1925. [Google Scholar] [CrossRef] [Scilit] [PubMed]
  78. Politzer, P.; Murray, J.S. The fundamental nature and role of the electrostatic potential in atoms and molecules. Theor. Chem. Acc. 2002, 108, 134–142. [Google Scholar] [CrossRef] [Scilit]
  79. Eşme, A.; Sağdınç, S.G. Spectroscopic (FT–IR, FT–Raman, UV–Vis) analysis, conformational, HOMO-LUMO, NBO and NLO calculations on monomeric and dimeric structures of 4–pyridazinecarboxylic acid by HF and DFT methods. J. Mol. Struct. 2017, 1147, 322–334. [Google Scholar] [CrossRef] [Scilit]
  80. Politzer, P.; Truhlar, D.G. Chemical Applications of Atomic and Molecular Electrostatic Potentials: Reactivity, Structure, Scattering, and Energetics of Organic, Inorganic, and Biological Systems, 1st ed.; Springer: New York, NY, USA, 1981. [Google Scholar] [CrossRef]
  81. Snehalatha, M.; Ravikumar, C.; Hubert Joe, I.; Sekar, N.; Jayakumar, V.S. Spectroscopic analysis and DFT calculations of a food additive Carmoisine. Spectrochim. Acta Part A Mol. Biomol. Spectrosc. 2009, 72, 654–662. [Google Scholar] [CrossRef] [Scilit] [PubMed]
  82. Wojciechowski, P.; Płoszaj, P. Structural, vibrational, NBO and quantum chemical analysis of two novel antimycobacterial compounds. J. Mol. Struct. 2020, 1218, 128409. [Google Scholar] [CrossRef] [Scilit]
  83. Glendening, E.D.; Landis, C.R.; Weinhold, F. NBO 6.0: Natural bond orbital analysis program. J. Comput. Chem. 2013, 34, 1429–1437. [Google Scholar] [CrossRef] [Scilit] [PubMed]
  84. Kaur, M.; Sheena Mary, Y.; Varghese, H.T.; Yohannan Panicker, C.; Yathirajan, H.S.; Siddegowda, M.S.; Alsenoy, C.V. Vibrational spectroscopic, molecular structure, first hyperpolarizability and NBO studies of 4′-methylbiphenyl-2-carbonitrile. Spectrochim. Acta Part A Mol. Biomol. Spectrosc. 2012, 98, 91–99. [Google Scholar] [CrossRef] [Scilit] [PubMed]
  85. Glendening, E.; Reed, A.; Carpenter, J.; Weinhold, F. Nbo Version 3.1, Tci; University of Wisconsin: Madison, WI, USA, 1998; Volume 65. [Google Scholar]
  86. Tauc, J.; Grigorovici, R.; Vancu, A. Optical Properties and Electronic Structure of Amorphous Germanium. Phys. Status Solidi (B) 1966, 15, 627–637. [Google Scholar] [CrossRef] [Scilit]
  87. Aly, K.A.; Dahshan, A.; Saddeek, Y. Optical properties of as-prepared and irradiated In–Cd–Se thin films. J. Mater. Sci. Mater. Electron. 2022, 33, 12663–12673. [Google Scholar] [CrossRef] [Scilit]
  88. DrDomenico, M., Jr.; Wemple, S.H. Oxygen-Octahedra Ferroelectrics. I. Theory of Electro-optical and Nonlinear optical Effects. J. Appl. Phys. 2003, 40, 720–734. [Google Scholar] [CrossRef] [Scilit]
  89. Aly, K.A. Comment on the relationship between electrical and optical conductivity used in several recent papers published in the journal of materials science: Materials in electronics. J. Mater. Sci. Mater. Electron. 2022, 33, 2889–2898. [Google Scholar] [CrossRef] [Scilit]
  90. Aly, K.A. On the study of the optical constants for different compositions of Snx(GeSe)100−x thin films in terms of the electronic polarizability, electronegativity and bulk modulus. Appl. Phys. A Mater. Sci. Process. 2015, 120, 293–299. [Google Scholar] [CrossRef] [Scilit]
  91. Sharda, S.; Sharma, E.; Aly, K.A.; Dahshan, A.; Sharma, P. High refractive index (Dy) doped (GeTe2)80(In2Te3)20 thin films for sub-THz and millimeter-wave applications. Ceram. Int. 2021, 47, 34501–34507. [Google Scholar] [CrossRef] [Scilit]
  92. Minkov, D.; Vateva, E.; Skordeva, E.; Arsova, D.; Nikiforova, M. Optical properties of Ge-As-S thin films. J. Non-Cryst. Solids 1987, 90, 481–484. [Google Scholar] [CrossRef] [Scilit]
  93. Ding, G.; Clavero, C.; Schweigert, D.; Le, M. Thickness and microstructure effects in the optical and electrical properties of silver thin films. AIP Adv. 2015, 5, 117234. [Google Scholar] [CrossRef] [Scilit]
  94. Sıdır, İ.; Sıdır, Y.G.; Berber, H.; Demiray, F. Electronic structure and optical properties of Schiff base hydrazone derivatives by solution technique for optoelectronic devices: Synthesis, experiment and quantum chemical investigation. J. Mol. Struct. 2019, 1176, 31–46. [Google Scholar] [CrossRef] [Scilit]
  95. Aly, K.A. Optical band gap and refractive index dispersion parameters of AsxSe70Te30-x (0 ≤ x ≤ 30 at.%) amorphous films. Appl. Phys. A 2010, 99, 913–919. [Google Scholar] [CrossRef] [Scilit]
  96. Shen, Q.; Katayama, K.; Sawada, T.; Toyoda, T. Characterization of electron transfer from CdSe quantum dots to nanostructured TiO2 electrode using a near-field heterodyne transient grating technique. Thin Solid Films 2008, 516, 5927–5930. [Google Scholar] [CrossRef] [Scilit]
  97. Hassanien, A.S. Studies on dielectric properties, opto-electrical parameters and electronic polarizability of thermally evaporated amorphous Cd50S50−xSex thin films. J. Alloys Compd. 2016, 671, 566–578. [Google Scholar] [CrossRef] [Scilit]
  98. Hamam, K.A.; Mohery, M.; Aly, K.A. New quaternary Ge3S6Ag1-xSnx (0.0≤x≤1) chalcogenide glasses for optical devices. Ceram. Int. 2025, 51, 2880–2890. [Google Scholar] [CrossRef] [Scilit]
  99. Alsaif, N.A.M.; Aly, K.A.; Ibraheem, A.A. Linear and non-linear optical properties of (Ge1S2)100-X(As2Te3)X (0 ≤ x ≤ 100) films. Opt. Mater. 2024, 149, 114972. [Google Scholar] [CrossRef] [Scilit]
  100. Ahmed, M.; Bakry, A.; Qasem, A.; Dalir, H. The main role of thermal annealing in controlling the structural and optical properties of ITO thin film layer. Opt. Mater. 2021, 113, 110866. [Google Scholar] [CrossRef] [Scilit]
  101. Liu, J.N.; Wu, B.W.; Zhang, B.; Liu, Y. Synthesis and characterization of metal complexes of Cu(II), Ni(II), Zn(II), Co(II), Mn(II) and Cd(II) with tetradentate schiff bases. Turk. J. Chem. 2006, 30, 41–48. [Google Scholar]
  102. Vogel, A.I. Vogle’s Text Book of Quantitative Chemical Analysis, 5th ed.; John Wiely & Sons New York, NY, USA, 1989; p. 906. [Google Scholar]
  103. Svehla, G. Vogel’s Textbook of Macro and Semi Micro Quantitative Inorganic Analysis, 5th ed.; Longman Inc.: New York, NY, USA, 1979; p. 617. [Google Scholar]
  104. Lewis, J.; Wilkins, R.G. Modern Coordination Chemistry: Principles and Methods; Interscience Publishers: Geneva, Switzerland, 1960; p. 487. [Google Scholar]
  105. Boggess, R.K.; Zatko, D.A. The use of conductivity data for the structure determination of metal complexes. J. Chem. Educ. 1975, 52, 649–651. [Google Scholar] [CrossRef] [Scilit]
  106. Richardson, J.H. Multiple-beam interference microscopy of metals by S. Tolansky. J. Appl. Crystallogr. 1972, 5, 442. [Google Scholar] [CrossRef] [Scilit]
Figure 1. (a) Structure representation of VO2+ and Cu2+, complexes (2,3). (b) Structure representation of Cu2+ complexes (4,5). (c) Structure representation of Fe3+ complexes (6).
Inorganics 14 00244 g001
Figure 2. The optimized structure obtained for azo-oxime (H2L, 1) by DFT/B3LYP/(6-311G(d,p)).
Inorganics 14 00244 g002
Figure 3. Molecular electrostatic potential of the azo-oxime (H2L, 1) by DFT/B3LYP/(6-311G(d,p)).
Inorganics 14 00244 g003
Figure 4. T and R spectra for the azo-oxime and its complex films.
Inorganics 14 00244 g004
Figure 5. n versus λ for the film of azo-oxime and its complexes.
Inorganics 14 00244 g005
Figure 6. Absorbance spectrum and the inset shows α -λ dependence on the azo-oxime and its complex films.
Inorganics 14 00244 g006
Figure 7. (a) The energy dependence of (αE)0.5 and ln α , (b) E g and E e values for the azo-oxime and its complex films.
Inorganics 14 00244 g007
Figure 8. ωp, τp, μopt and ρopt values for azo-oxime and its complex films.
Inorganics 14 00244 g008
Figure 9. σ 1 and σ 2 vs. E for azo-oxime and its complex films.
Inorganics 14 00244 g009
Figure 10. The energy dependence of ε 1 and ε 2 for azo-oxime and its complexes’ films.
Inorganics 14 00244 g010
Figure 11. tan (δ) vs. hν for azo-oxime and its complexes’ films.
Inorganics 14 00244 g011
Figure 12. R s vs. E and ε t h vs. E for azo-oxime and its complex films.
Inorganics 14 00244 g012
Figure 13. Synthesis of 2-hydroxy-5-(p-tolyldiazenyl)benzaldehyde oxime ligand (H2L, 1).
Inorganics 14 00244 g013
Table 6. Optical parameters of azo-oxime and its complex films.
CompoundsH2LVO2+(2)Cu2+(3)Cu2+(4)Cu2+(5)Fe3+(6)
Absorption edge
range (nm)
360–410440–480460–500440–510450–520460–540
E g i n d (eV)2.962.272.212.112.011.83
A ( c m . e V )2279.031023.001079.97967.00864.94663.93
σ m (104 Ω 1 m 1 )21.875.106.606.056.1521.87
λo (nm)223.99273.21289.10296.69316.32343.40
So (1014) m−28.105.936.406.546.898.11
Eo (eV)5.554.554.304.193.933.62
Ed (eV)22.5520.1523.0124.1327.1034.62
no2.252.332.522.602.813.25
ε5.065.436.356.767.9010.56
ω p (1015) Hz5.804.855.715.876.698.45
Ep (eV)3.823.193.763.864.405.56
t p (s)1.722.061.751.701.491.18
N/m* (1053 kg−1 m−3)7.375.157.127.539.79164.82
Nop (1026 m−3)2.691.882.602.743.5760.06
μ o p (C.s.kg−1)7.579.067.707.496.575.20
ρ o p ( Ω . m )3.083.683.133.042.670.20
X ( 3 ) (10−12 esu)1.0951.5473.2944.4259.09233.613
n 2 (10−12 esu)1.832.504.936.4112.1938.97
Table 7. Comparison of optical and third-order nonlinear optical parameters of the synthesized films with related materials in the literature.
Material/Film E g i n d (eV) X ( 3 ) (10−12 esu) n 2 (10−12 esu)Ref.
Fe3+(6)1.8333.61338.97This work
Cu2+ (5)2.019.09212.19This work
Cu2+ complex film of hydrazone oxime2.112.55.37[20]
Cu2+ complex film of hydrazone oxime2.151.832.94[19]
Transition metal complex film of Azo-Schiff base1.9512.1415.3[21]
Disclaimer/Publisher’s Note: The statements, opinions and data contained in all publications are solely those of the individual author(s) and contributor(s) and not of MDPI and/or the editor(s). MDPI and/or the editor(s) disclaim responsibility for any injury to people or property resulting from any ideas, methods, instructions or products referred to in the content.