Article

Mechanochemical Synthesis and Luminescent Properties of Pure and Dy-Doped SrMoO4 Crystalline Phases


1
Institute of General and Inorganic Chemistry, Bulgarian Academy of Sciences, Acad. G. Bonchev, Bl. 11, 1113 Sofia, Bulgaria
2
Institute of Physical Chemistry, “Acad. Rostislaw Kaischew”, Bulgarian Academy of Sciences, Acad. G. Bonchev, Str., Bl. 11, 1113 Sofia, Bulgaria
3
Institute of Optical Materials and Technologies, “Acad. Jordan Malinowski”, Bulgarian Academy of Sciences, Acad. G. Bonchev, Str., Bl. 109, 1113 Sofia, Bulgaria
*
Author to whom correspondence should be addressed.
Inorganics 2026, 14(5), 133; https://doi.org/10.3390/inorganics14050133
Submission received: 31 March 2026 / Revised: 3 May 2026 / Accepted: 7 May 2026 / Published: 12 May 2026

Abstract

The pure and xDy3+-doped SrMoO4 series (x = 0.5, 1.0, 1.5 and 2.0 at.%) were synthesized using a direct mechanochemical route. We found that a milling speed of 850 rpm and a milling time of 30 min result in a complete chemical reaction at different concentrations of dopant ions. The phase formation, structural units, and optical properties of the obtained samples were investigated by XRD, IR, UV-Vis and PL analyses. It has been established that Dy2O3 mainly influences the lattice parameters, unit cell volumes, crystallite sizes, and microstrains. The symmetry of MoO4 groups was investigated using IR spectroscopy, and it showed that pure and Dy3+-doped SrMoO4 samples are built up of deformed structural units. The calculated optical band gap of the obtained crystal phases decreases with increasing concentrations of Dy3+ ions. The host SrMoO4 matrix shows broad blue emission centered at 430 nm under an excitation wavelength of 230 nm. All doped samples display a strong yellow emission at 570 nm, belonging to the 4F9/26H13/2 transition of Dy3+ ions. The highest luminescence intensity was observed when the concentration of the Dy3+ ion was 0.5 at.%. The mechanism of concentration quenching was mainly caused by the electric dipole–dipole interaction. The calculated CIE chromaticity coordinates of the doped samples fall in the yellow range. This study demonstrates that mechanochemical treatment is an appropriate route for the fast preparation of yellow phosphors.

1. Introduction

The metal molybdate compounds (AmoO4, A = Ca, Ba, Sr, etc.) with scheelite-type structures possess an intriguing luminescence property due to their good chemical and physical characteristics. Investigations reported that these materials exhibit blue or green emission at room temperature due to charge transfer from oxygen to metal ions in the near-UV region [1,2,3,4,5,6,7]. The emissions depend on several factors such as the type of crystal structure, structural groups, defects, the size and morphology of the particles, and the method of preparation. The metal molybdate oxides serve as effective host materials for lanthanide ions due to high energy transfer between them and the host lattice. Among different trivalent rare-earth (RE) ions, Eu3+, Dy3+ and Tb3+ are widely employed for the preparation of red, yellow-to-white, or green light-emitting diodes. The trivalent rare-earth ions exhibit characteristic electronic transitions within the 4f-4f or 5d-4f configurations, showing sharp and distinct emission lines above 400 nm.
Among inorganic metal molybdates, SrMoO4 is the most extensively studied material with excellent photoluminescent [5,6,8,9], scintillating [10], electrochemical [11], dielectric [12] and catalytic properties [13]. The RE-doped SrMoO4 can also be used in optical temperature sensors, biological labeling, bioimaging agents, flexible composites for LED filters, anti-counterfeiting applications, etc. [14,15,16,17]. The photoluminescence properties of pure and doped crystal phases are strongly dependent on the type of host materials, structural units, and the possibility for doping by rare-earth ions, as well as the concentration of these ions. From a structural point of view, SrMoO4 is formed by corner-sharing SrO8 octahedra and MoO4 tetrahedral units [18]. On the other hand, the MoO4 configuration is stable, which is effectively absorbed in the ultraviolet (UV) or in the blue–green range due to the charge transfer from oxygen to molybdenum. It is known that Sr ions are partially substituted by rare-earth ions, which makes SrMoO4 a good candidate for matrix material [15].
Among the different RE ions, Dy3+ ions possess three emissions in the blue, yellow and red regions attributed to 4F9/26H15/2, 4F9/26H13/2, and 4F9/26H11/2 transitions, respectively. Transitions with yellow emissions depend on the coordination environment of the Dy3+ ion, while those in the blue area are less impacted [19]. The change in the ratio between yellow and blue emissions depends on the type of host matrix (crystal phase, glass, and glass ceramic). Generating white light is a decisive factor for a broad range of lighting applications. In the literature, there are reports that Dy3+-doped SrMoO4 exhibits white-light emission at room temperature. These materials were synthesized by different preparation methods such as the sonochemical route [20], sol–gel [21], solid-state reactions [22], co-precipitation [23], and the solution combustion technique [24]. But some investigations reported that Dy3+-doped SrMoO4 displays yellow or green–yellow emissions [25,26]. The investigation shows that doping with different Dy3+ concentrations leads to tuning of the emission color of the host matrix. Therefore, it is important to choose a suitable approach and concentration of the dopant ion in order to obtain white-light-emitting materials. Our previous research has been primarily related to the direct mechanochemical synthesis of various crystalline phases (AMO4, where A = Sr, Ca, and Ba, and M = Mo and W) with scheelite-type structures [1,4,6,27]. We also found that higher ball-milling speed results in defect formation and improves the luminescent properties of the obtained crystalline phases. Our previous research demonstrated that mechanochemically synthesized pure and Dy3+-doped CaMoO4 possess yellow and white-light emissions under different excitation wavelengths [4]. Mechanochemical treatment allows synthesis at room temperature, modification of the crystal phase, reduction in particle size, and incorporation of dopants [28,29]. The advantages of this approach are that the use of voluminous solutions (hazardous organic solvents) and additional operations, as well as the filtration, washing or sintering of the final product, can be avoided. For example, in the preparation of the Dy3+-SrMoO4 sample by the sonochemical route, solutions of more reagents, such as Sr(NO3)2, Na2MoO4·2H2O, and HNO3 or NH3·2H2O for adjusting pH, were ultrasound-irradiated at ambient temperature for 30 min. After centrifugation, the solution was washed and dried under vacuum at 80 °C for 12 h [20]. Similar experimental steps are applied to other wet solution methods in the synthesis and production of Dy3+-doped SrMoO4 [20,25]. P. Jena et al. reported that obtaining a nanocrystalline of the same crystal phase using the acrylamide-assisted sol–gel combustion process included stirring at 80 °C, followed by heat treatment at 900 °C [21]. The temperature range of the solid-state reaction and combustion method for the synthesis of Dy-doped SrMoO4 ranges from 700 to 750 °C [22,24,26]. In contrast, the advantage of ball milling is the capacity to remove the necessity for solvents, reduce reaction times, have a rapid synthesis process, and minimize energy consumption. On the other hand, this method produces good crystalline materials without the formation of secondary phases. The chemical or physical properties of the final product can be controlled by the kind of mill, activation speeds, the ball-to-powder weight ratio, the milling atmosphere, the kind of precursors, etc.
The choice of suitable preparation methods and host matrix is very important in the preparation of the rare-earth-doped phosphors. We obtained a nanopowder of SrMoO4 with strong blue emission and applied a high milling speed of 850 rpm [6]. This motivates us to select this phase as a host matrix to check the possibility for the preparation of Dy3+-doped materials using a mechanochemical treatment. The XRD and PL analyses were applied in this study to examine and explain the effect of the Dy3+ doping content on the structural and luminescence properties in detail.

2. Results and Discussion

2.1. XRD Analysis

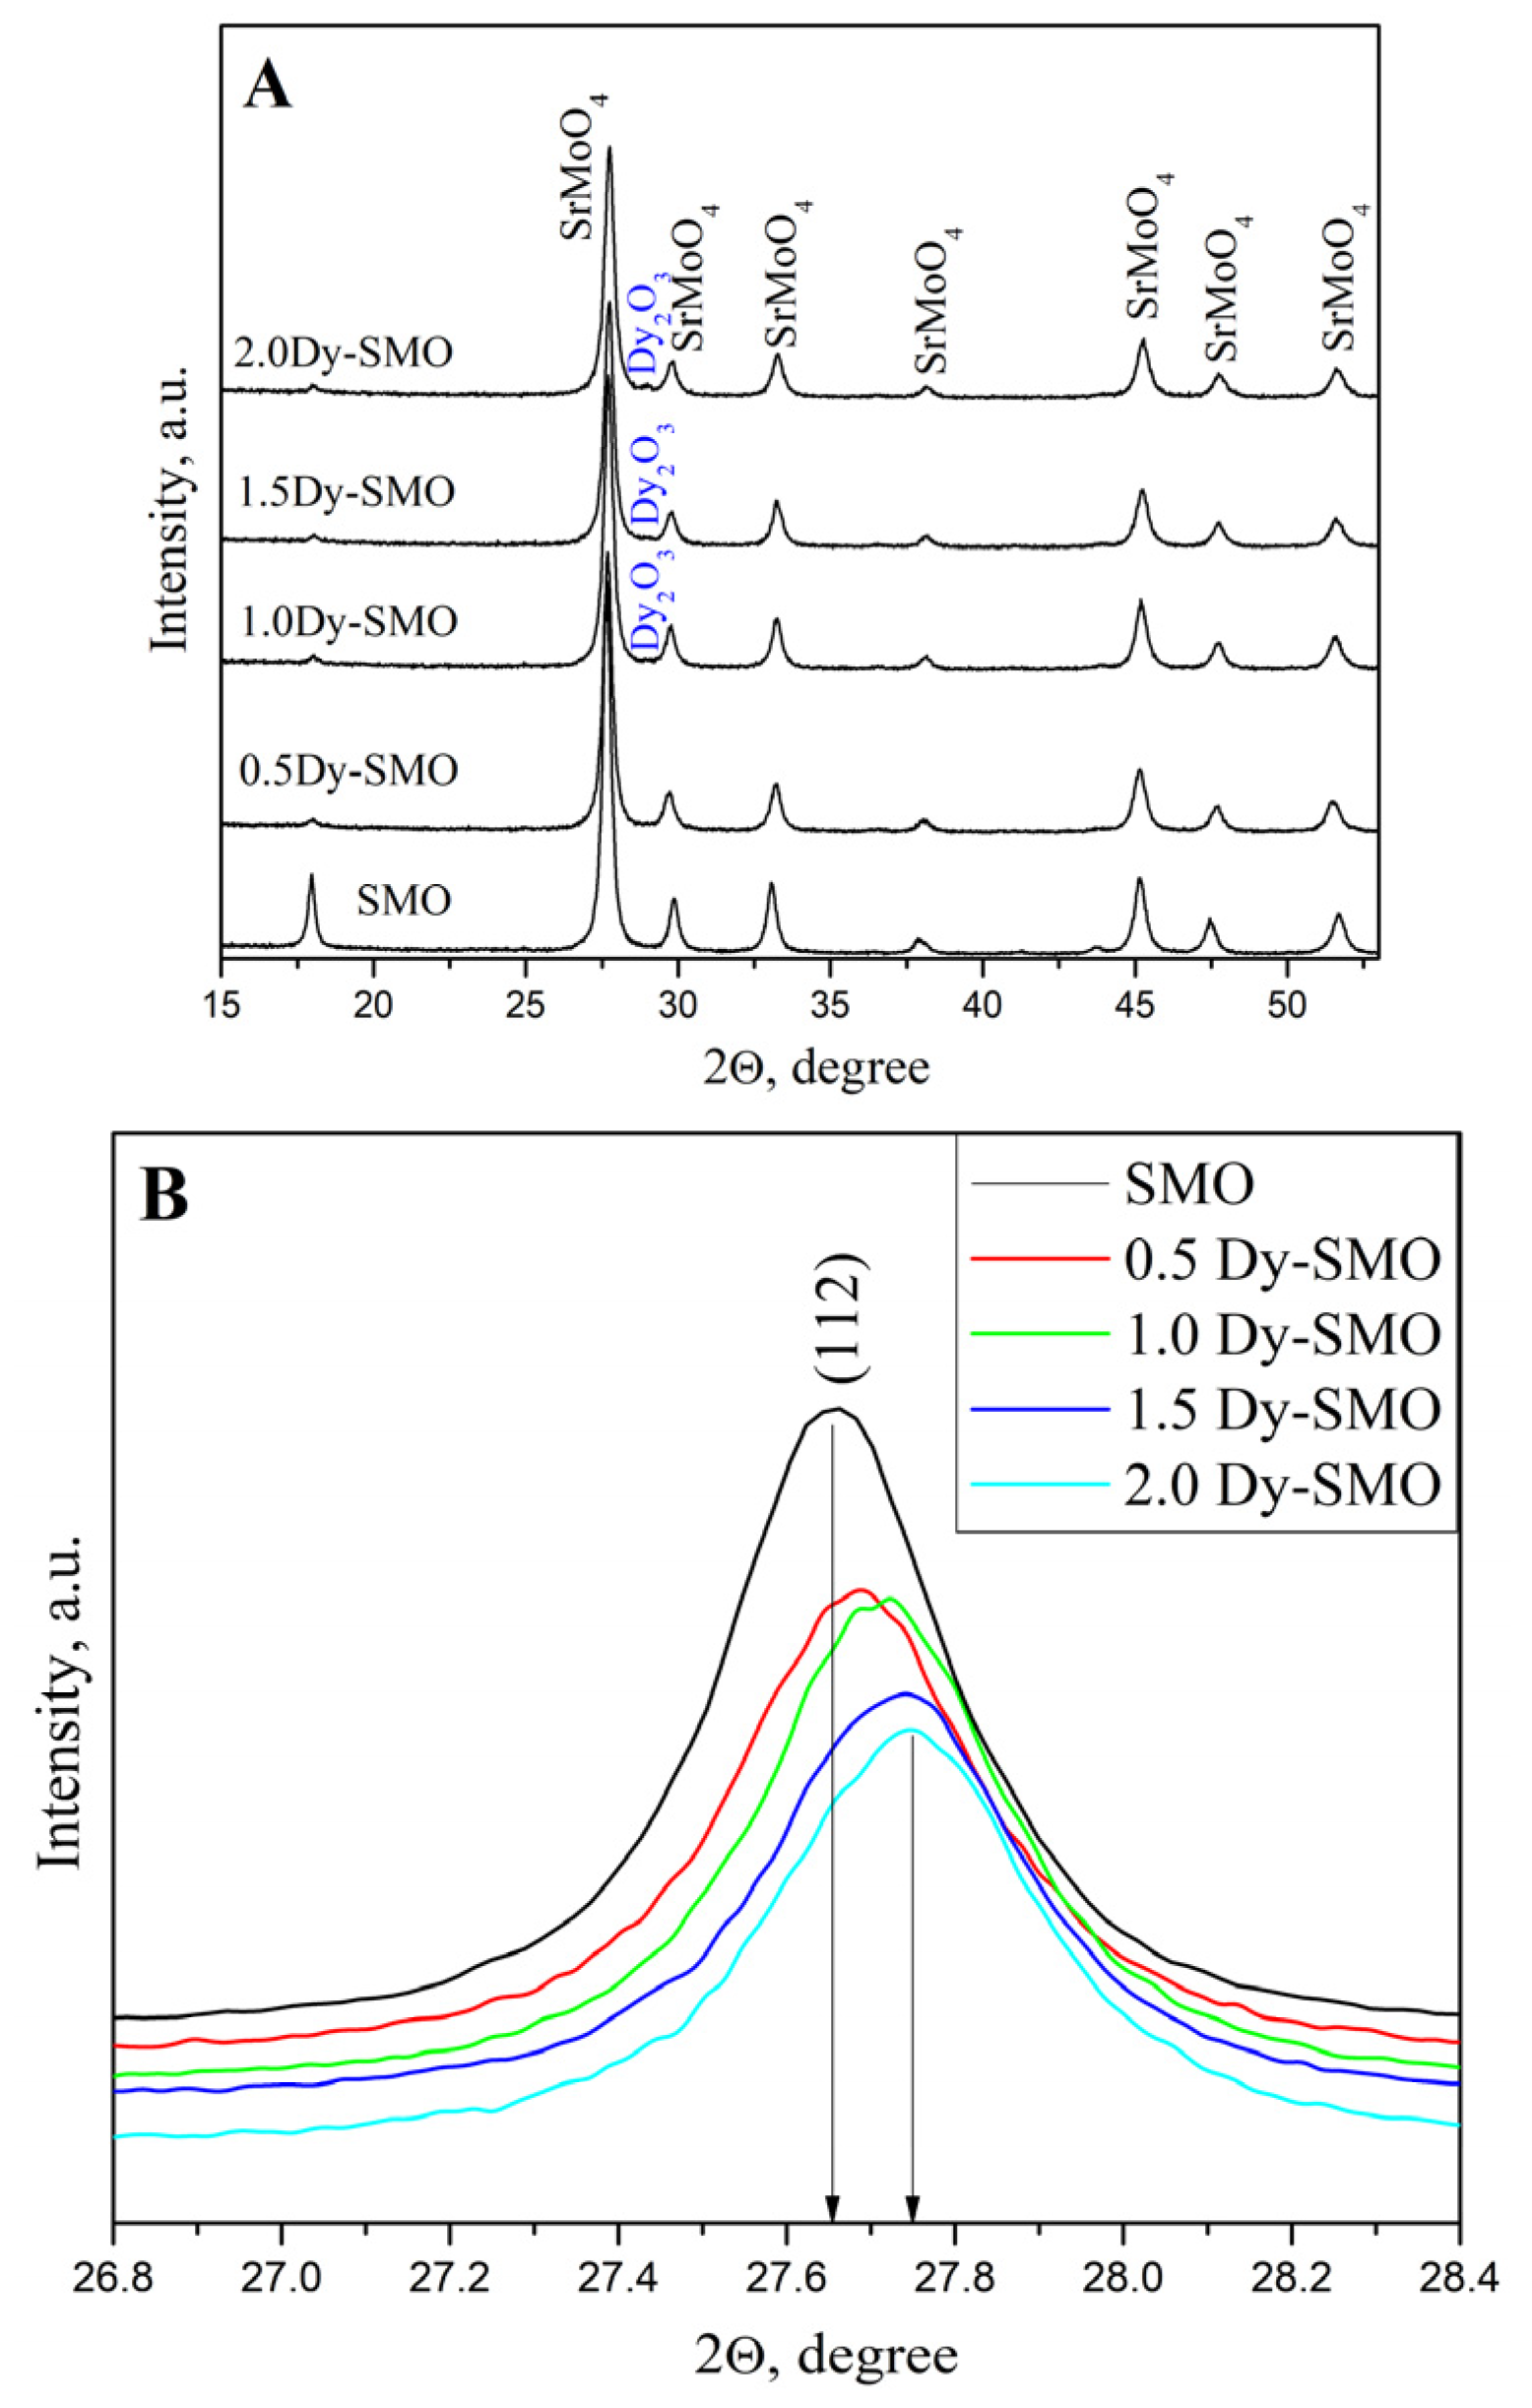
The phase formation of pure and xDy3+-doped SrMoO4 (x = 0.5, 1.0, 1.5 and 2.0 at.%) crystal phases was confirmed by X-ray diffraction analysis, and the results are shown in Figure 1A. The obtained samples are labeled according to the atomic % Dy3+ ions as follows:
SMO–host matrix–SrMoO4;
0.5Dy-SMO–host matrix SrMoO4 + 0.5 at.% Dy2O3;
1.0Dy-SMO–host matrix SrMoO4 + 1.0 at.% Dy2O3;
1.5Dy-SMO–host matrix SrMoO4 + 1.5 at.% Dy2O3;
2.0Dy-SMO–host matrix SrMoO4 + 2.0 at.% Dy2O3.
The chemical reaction between the initial oxides was finished for the SMO and 0.5Dy-SMO samples after 15 min of milling time. However, a minor quantity of unreacted Dy2O3 (ICSD 98-018-4538) was observed in samples that contained 1.0, 1.5, and 2.0 at.% Dy2O3. This is why we performed mechanochemical treatment for more than 15 min to ensure the full introduction of the doped ion into the structure of the host material. After 30 min of milling time, all diffraction lines were indexed to the tetragonal SrMoO4 (ICSD 98-017-3120) at all mentioned concentrations of Dy2O3 (Figure 1A). In addition, the weak diffraction signal, probably due to Dy2O3, was still visible. The Rietveld refinement of these patterns indicates the presence of a tetragonal SrMoO4 phase, along with a minor impurity phase of Dy2O3, which is below 1 wt%. We can conclude that the crystal structure has not changed, despite the addition of Dy3+ ions. One reasonable explanation for this fact can be the ionic radius difference value (Dr) between the doped (Rd) and substituted ions (Rs). According to literature data, when the percentage of ionic radius differences (Dr) is below 30%, the substitution is carried out without changes in the crystal structure [30,31,32]. The equation Dr = Rs − Rd/Rs is used to calculate the percentage difference (Dr) in ionic radius, where Rd and Rs represent the ionic radii of the dopant and the substituted ion, respectively. In our case, the dopant ion Dy3+ has an ionic radius of 1.09 Å, while the substituted ion Sr2+ has an ionic radius of 1.12 Å [33]. The calculated value of the ionic radius difference is 18%, which means that Dy3+ ions replaced Sr2+ ions in SrMoO4 without phase transformation. Rietveld refinement on the XRD patterns of pure and Dy3+-doped SrMoO4 phases was carried out, and the results are presented in Table 1.
The lower content of the Dy3+ ion (0.5 at.%) leads to an increase in the c lattice parameter and microstrains in the structure of the host material, while a decrease in the lattice parameter and unit cell occurs. The reduction in the lattice parameters (a and c), unit cell volume, crystallite size, and microstrains was observed at a concentration of Dy3+ ions above 0.5 at.%. The tendency of the above-mentioned parameters to decrease indicates that the lattice modification is a result of the presence of the dopant ion. The lower microstrain value of SrMoO4 doped with 2.0Dy3+ is probably a result of the relaxed lattice due to strain release in the lattice. The same trend is observed in the size of the crystallites. For pure SrMoO4, their size is approximately 30 nm, and during the synthesis with maximum substitution with Dy2O3, the size decreases to 21 nm. These results are in good agreement with literature data for doped Dy3+-SrMoO4 materials [22,25,26]. The refinement quality indicator, goodness of fit, i.e., GOF (χ2), in the range from 1.63 to 1.95 shows a good agreement between the experimental and calculated values. The shifts in the diffraction peak corresponding to the 112 plane toward larger 2θ values were observed in the XRD patterns when increasing the Dy2O3 content, which is related to the contraction of the unit cell. This is correlated with refinement data from an X-ray analysis (Table 1 and Figure 1B) [30].

2.2. Infrared Spectroscopy

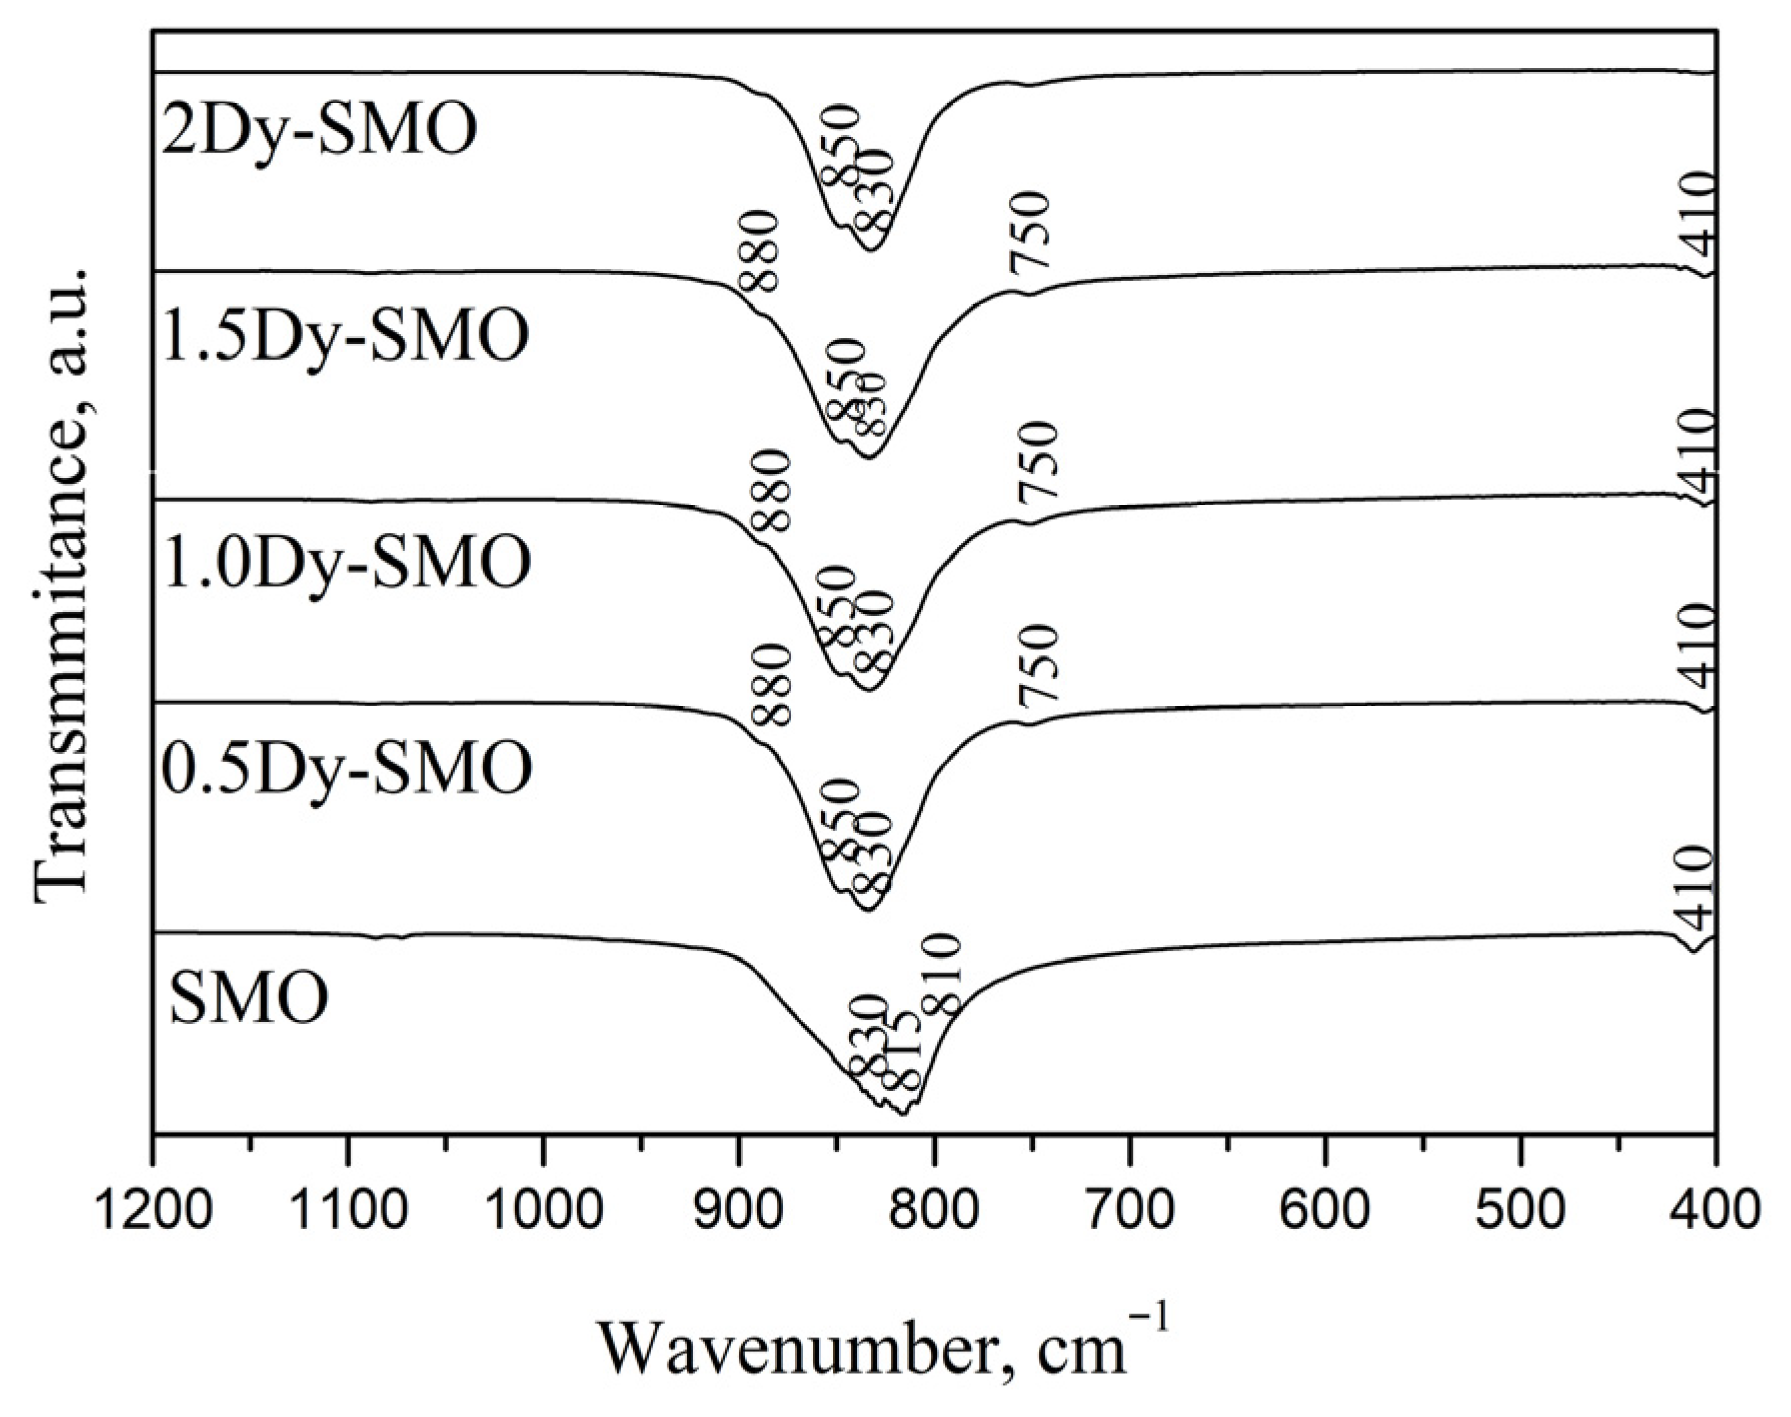
Information about the vibrations of the main structural units in the crystal phases is provided by IR spectroscopy. Figure 2 shows the IR spectra of pure and Dy3+-doped SMO samples prepared after 30 min of milling time using a milling speed of 850 rpm. The IR spectrum of pure SMO exhibits a wide absorption band in the range from 830 to 810 cm−1, which is ascribed to the ν3 vibration of the MoO4 structural units, building the crystalline structure of SrMoO4 [6,21,23]. This band is assembled from two weak bands at 830 and 810 cm−1 and one intense band centered at 815 cm−1. It is well known that a more symmetrical MoO4 entity is characterized by one vibration mode around 830 cm−1 [34]. In our case, the presence of three absorption bands is due to the formation of MoO4 units with low symmetry. We observed similar results for other crystal phases obtained by mechanochemical treatment [6,27]. The absorption band at 410 cm−1 is due to the bending vibration of the Mo-O bond from MoO4 units [23]. The following changes were observed in the IR spectra of the Dy3+-doped SMO samples: the position of the bands of the MoO4 units was shifted to higher wavelengths (830 → 850 cm−1 and 815 → 830 cm−1); there was an appearance of a shoulder at 880 and a very weak band at 750 cm−1 and the disappearance of the band at 410 cm−1 when the concentration of Dy3+ ions was 2.0 at.%. The observed changes in the IR spectra of Dy-doped SMO samples are probably the result of the formation of MoO4 with higher asymmetry due to the presence of Dy3+ ions.

2.3. Optical Properties

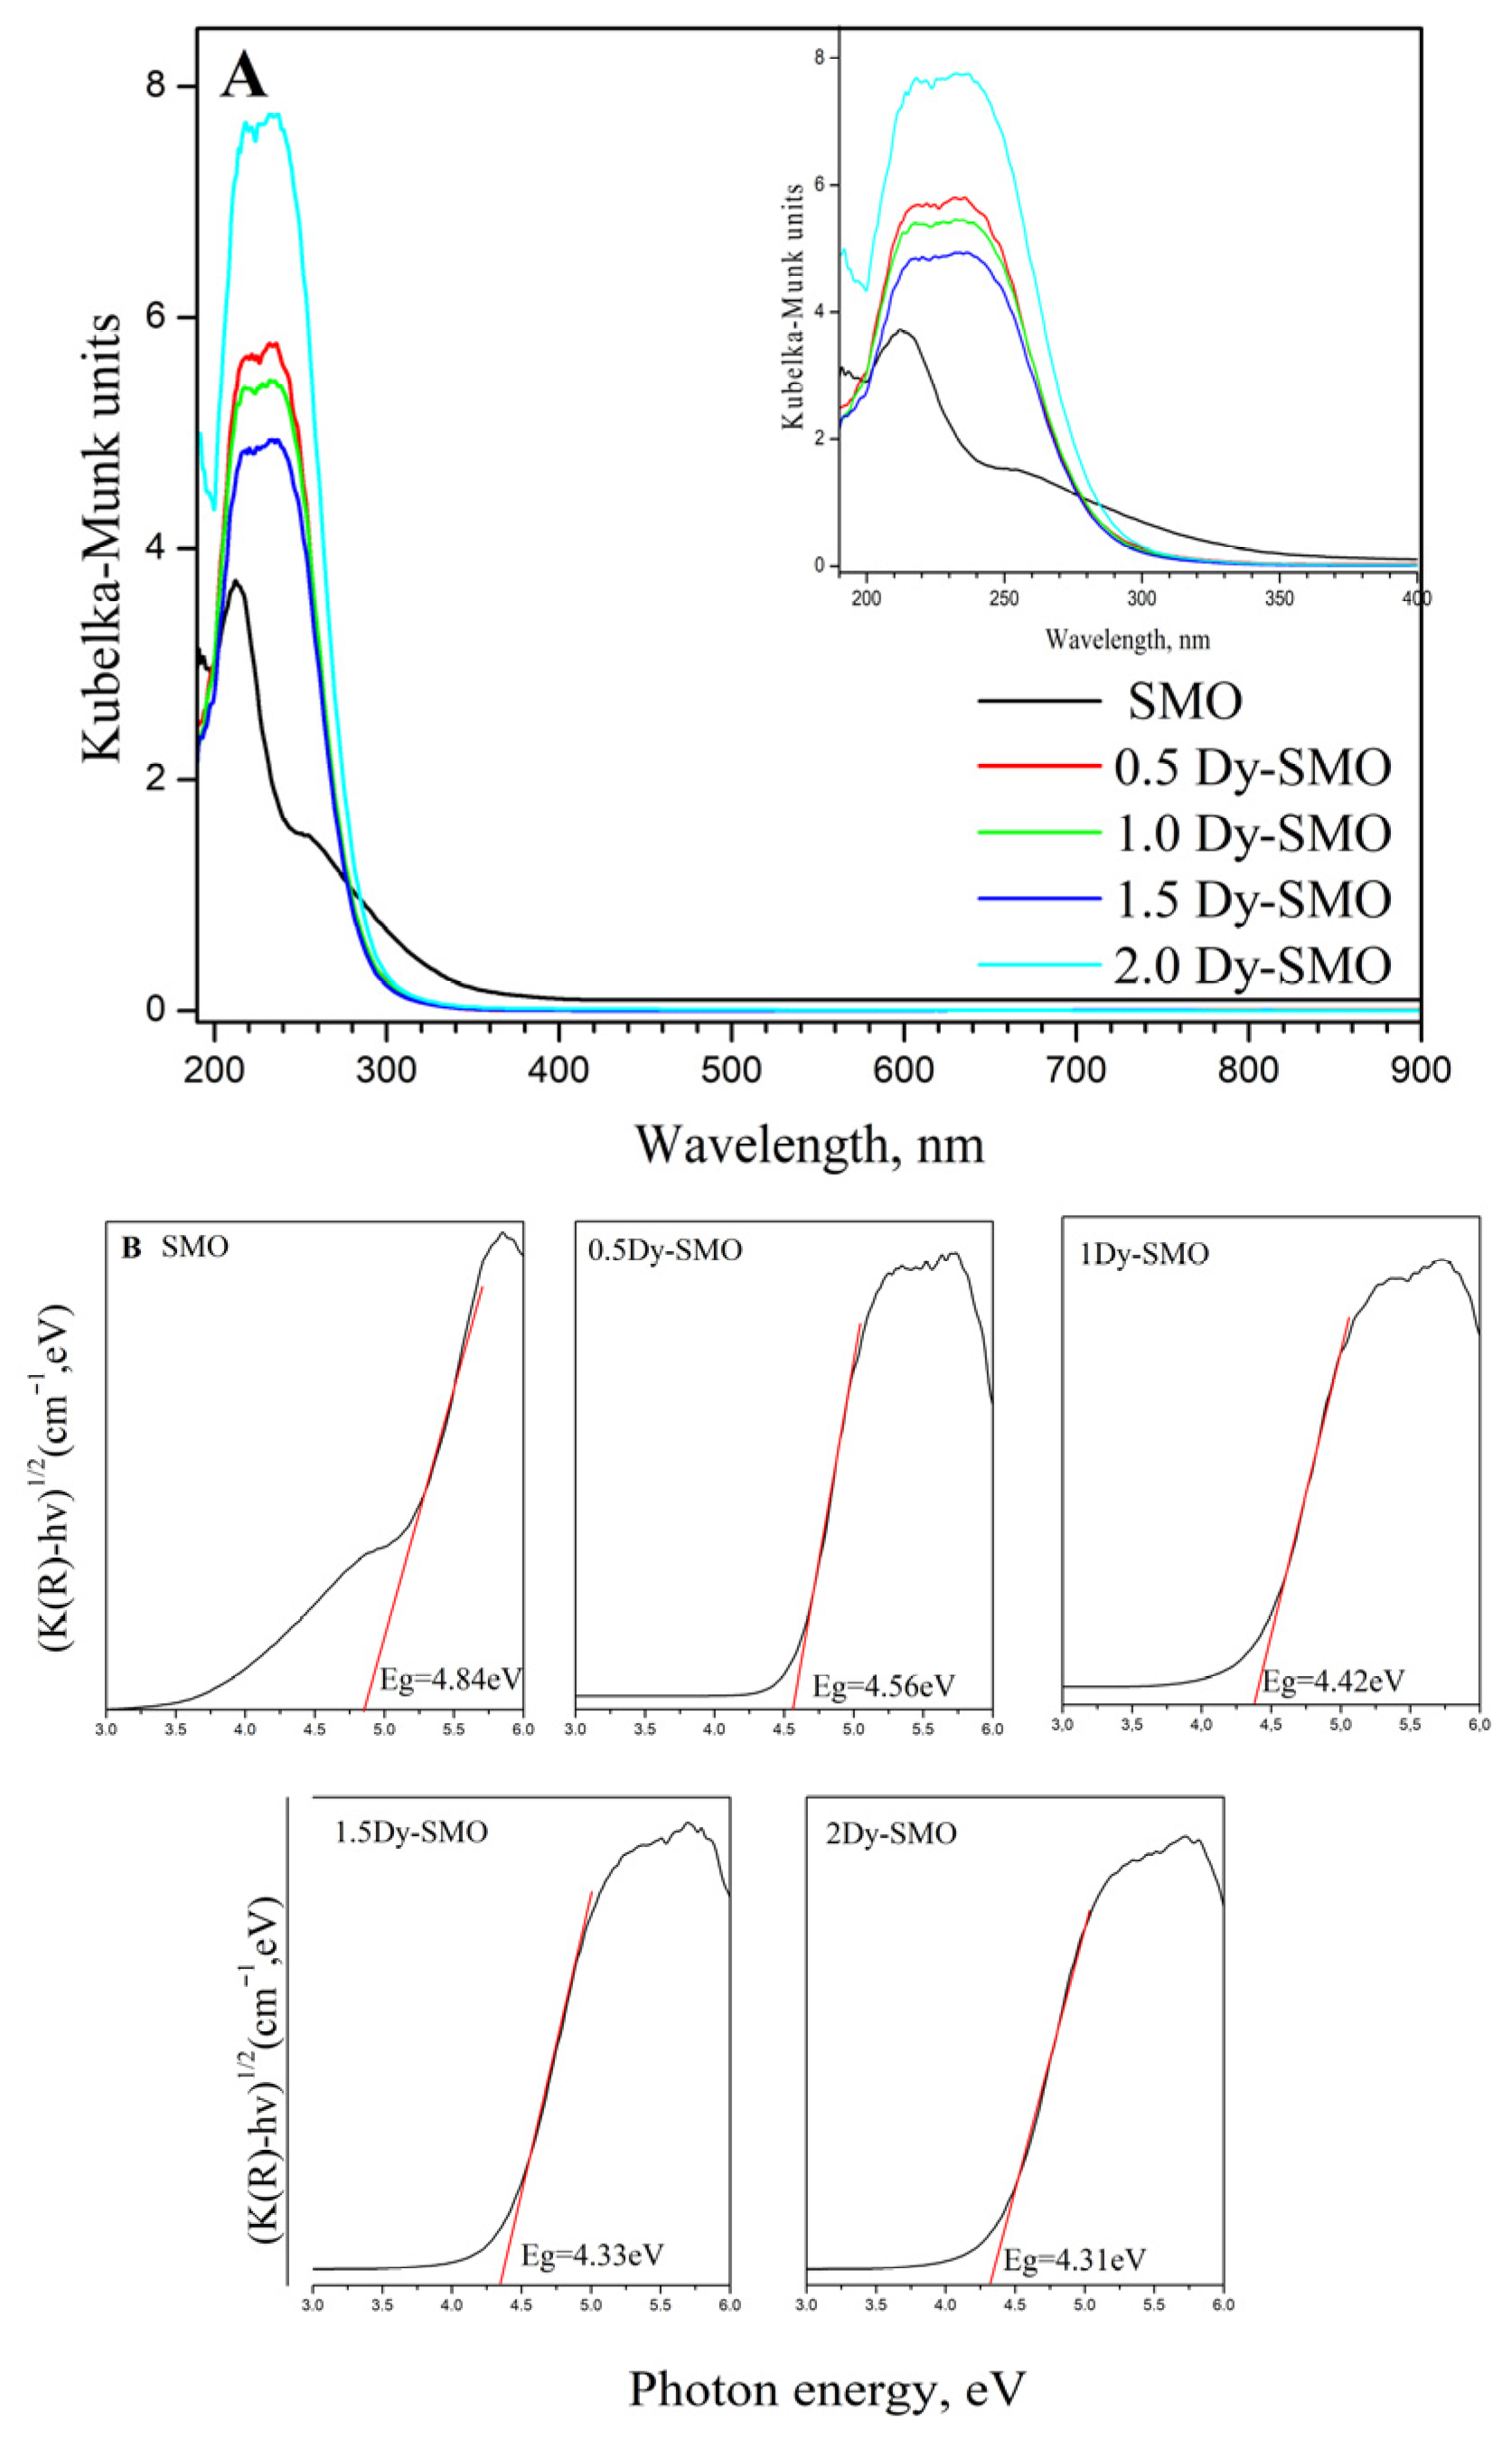
UV–vis diffuse reflectance (UV-DR) and photoluminescence (PL) studies were performed at room temperature on as-prepared samples in order to predict their optical properties. Kubelka–Munk spectra of pure and Dy3+-doped SMO compounds are present in Figure 3A. The narrow absorption band at 215 nm, together with a shoulder at 350 nm, was observed in the spectrum of the pure sample. This absorption behavior is related to the charge transfer from the 2p states of oxygen to the 4 d states of the molybdenum ion [6,8,35]. A notable change in absorption characteristics after doping with Dy3+ ions was clearly visible. The broad absorption with distinct peaks at 215 and 235 nm was observed, as well as the disappearance of the shoulder at 250 nm. This can be attributed to the internal electronic transition between the dopant ion and the host lattice (SrMoO4). A similar optical result was reported by M. Muralidharan et al. [36]. The intensity of absorption peaks of the Dy3+-doped SMO samples is higher than that of the pure sample, which can be due to their ability to absorb more in the ultraviolet region [13]. The band gap (Eg) of the pure and Dy3+-doped SMO samples was calculated using the Tauc relation of αhν = A(Eg)n, where α is the absorption coefficient, A is the absorption constant, h is Planck’s constant, and n is the photon frequency [37]. In the mentioned relation, n represents the type of semiconductor charge transition. The value of n is related to the characteristics of the electronic transition type in the semiconductors: n = 0.5 for a direct allowed transition; n = 2 for an indirect allowed transition; n = 3 for an indirect forbidden transition; and n = 3/2 for a direct forbidden transition. It is well known that the metal molybdates with scheelite-type tetragonal structure have direct or indirect allowed transition depending on divalent metal cations (A = Sr and Pb) [35,36,38]. In our case, n = 0.5 is typical of the direct allowed transition of SrMoO4. The calculated optical band gap of the pure SrMoO4 is 4.84 eV and decreases up to 4.31 eV with an increase in Dy3+ concentration. A similar tendency for reduction in the optical band gap of SrMoO4 doped with Dy3+ and other modification ions was reported in the literature [4,13,21,39,40].

2.4. Photoluminescence Properties

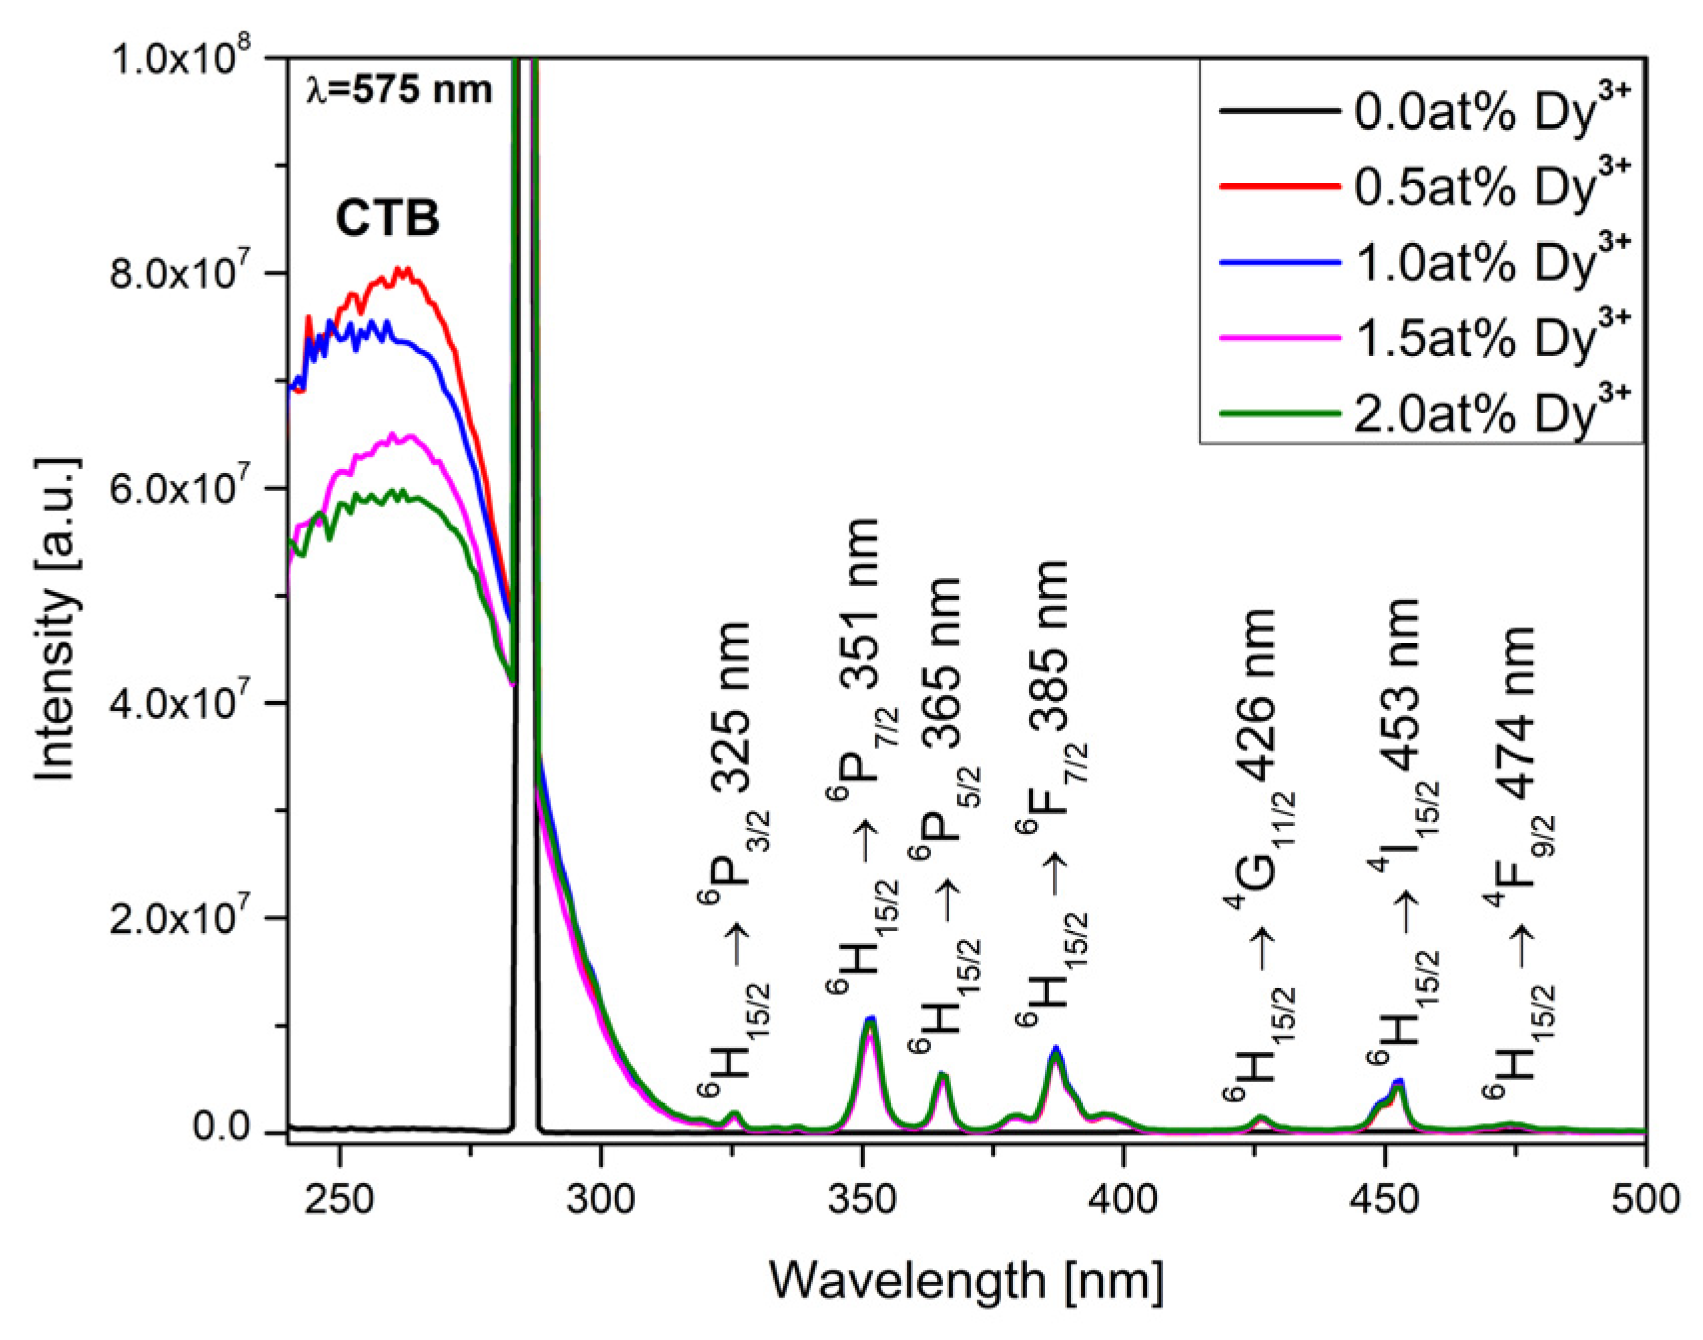
The impact of active ion concentration on the photoluminescence characteristics of the obtained samples was investigated by PL excitation and emission analysis. The excitation spectra of pure and Dy3+-doped SrMoO4 monitored under a 575 nm emission could be divided into two parts (Figure 4). The first part (230–320 nm) is a broad peak centered at 260 nm, connected with charge transfer between the oxygen and molybdenum in the matrix [8,23]. The second part consists of sharp peaks at 325, 351, 365, 426, 453 and 474 nm, characteristic of the f-f transitions of the dysprosium ion from the 6H15/2 ground states to the different excited states, which is indicated in the figure below [19,23,41]. It can be seen that the different Dy3+ concentrations did not affect the excitation line profiles. The peak intensity at 353 nm (6H15/26P7/2) is slightly higher than the others.
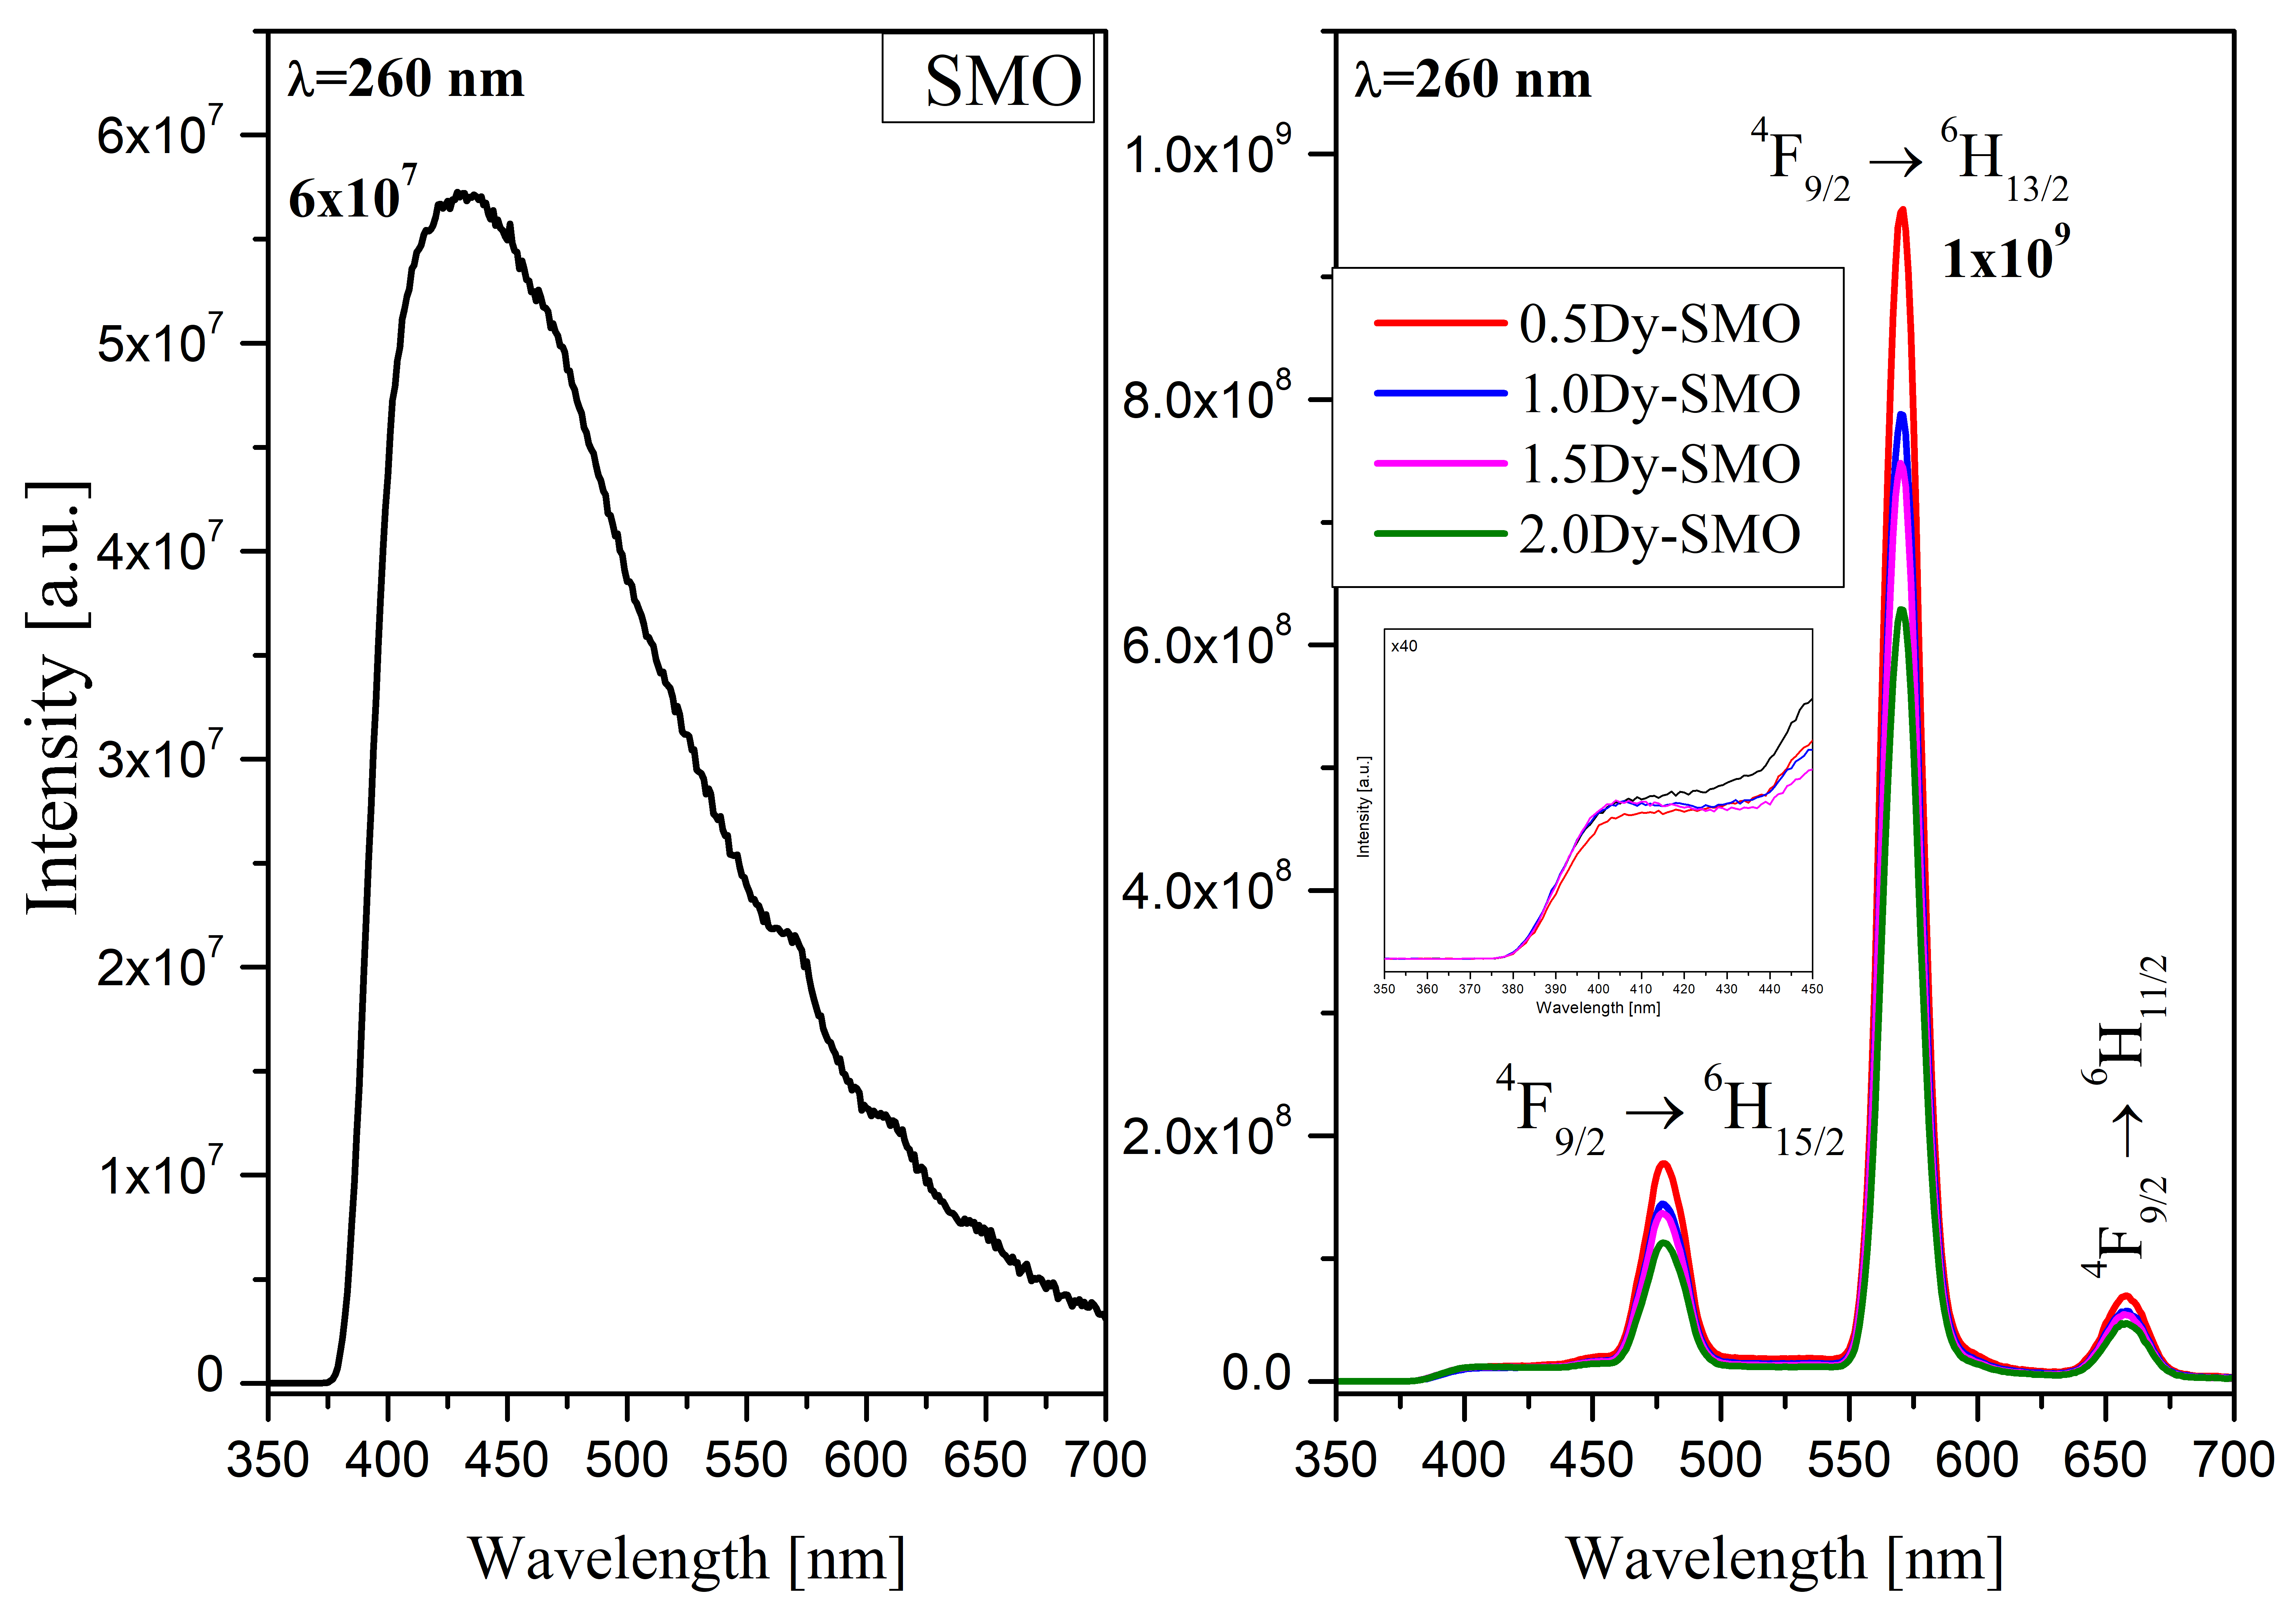
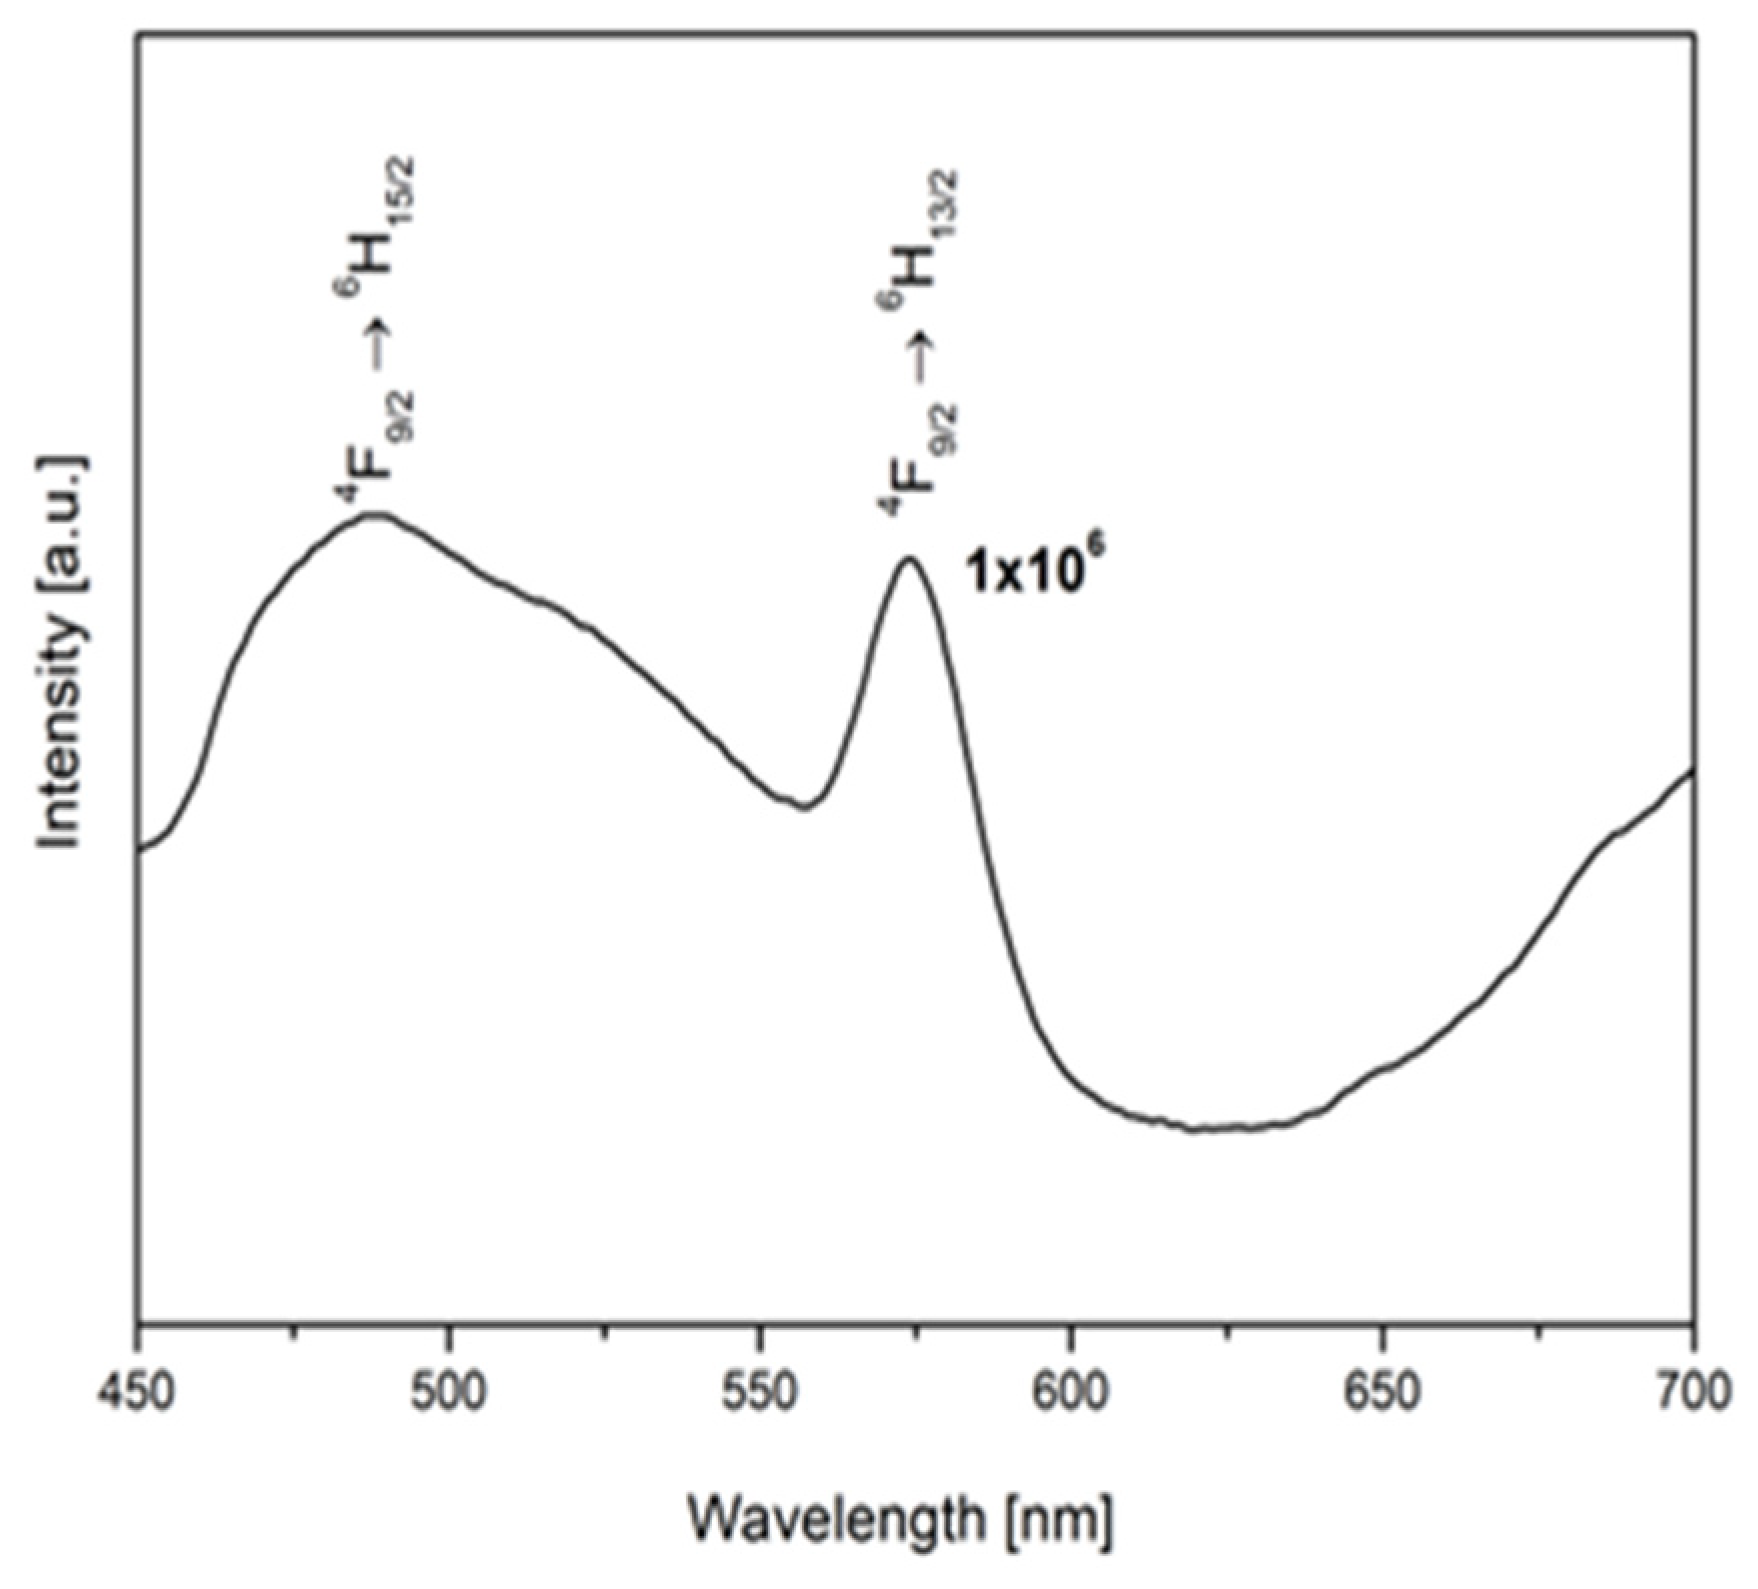
Photoluminescence (PL) emission spectra of pure and Dy3+-doped SMO were recorded in the range of 350–700 nm at room temperature under an excitation wavelength of 230 nm (Figure 5). The spectrum of the pure phase consists of one wide peak with a maximum at around 430 nm and three barely noticeable peaks at 570, 610 and 650 nm. The emission peak at 430 nm is typical for SrMoO4 and due to the electronic charge transfer within the (MoO4) units [8,25,36]. The weak signals above 550 nm are probably due to the light scattered from the excitation source during the measurement. As is well known, the emission spectrum of the dysprosium ion contains three lines in the blue, yellow and red regions of the visible spectrum [4,19,20,21,22,41]. The first line is assigned to the magnetic dipole transition (4F9/26H15/2). It is dominant when the Dy3+ ion is placed in the site with an inversion center. The second line is assigned to the electric dipole transition (4F9/26H13/2), which is hyper-sensitive to the crystal field of the host. It is often dominant when the Dy3+ ion is in a low-symmetry site. Usually, the transition in the red region (4F9/26H11/2) is weak. In the emission spectra of all doped SMO samples, well-defined peaks typical of Dy3+ ions are registered (Figure 5). The host material has a tetragonal phase structure without an inversion center, so the dominance of the yellow peak in the doped samples is not surprising [21]. This indicates that the active ions exhibit low local symmetry in SrMoO4, as supported by literature data [42]. The slight rise at the beginning of the spectrum between 350 and 430 nm is due to the luminescence of the matrix (represented as an inset in Figure 5). The intensity of the host emission decreased, which relates to the energy transfer process from MoO4 units to Dy3+ ions [43]. Since some of the peaks of the dysprosium excitation spectrum coincide with the emission of the matrix, this leads to energy transfer and an enhancement in the intensity of the dysprosium ion emission. The maximum emission is observed when the active ion concentration is 0.5 at.%. At higher values of the Dy3+ ion, concentration quenching occurs due to a decrease in the distance between two adjacent dopant ions in the crystal lattice [44]. Figure 6 presents the emission spectrum of the initial Dy2O3. It can be seen that the emission lines (peaks at 487 and 574 nm) typical of 4F9/26H15/2 and 4F9/26H13/2 transitions are broader and of low intensity. On the other hand, the emission line (peak at 662 nm) due to the 4F9/26H11/2 transition was not visible. The weak emission peaks of the pure Dy2O3 are a result of the concentration quenching phenomenon. The stronger emission lines, as well as the appearance of the peak at 662 nm in the emission spectra of all doped SMO samples, are evidence of the introduction of active ions in the crystal lattice of the host matrix. The major difference in the intensities of pure Dy2O3 (i.e., which we use in this study) from Dy3+-doped SrMoO4 phases may be attributed to a higher crystallite size and crystal system (cubic) of the initial Dy2O3. It is well known that the luminescence intensity of the Dy2O3-doped crystal phase is higher than that of the matrix (SrMoO4). This is due to the low phonon energy of the nanocrystal phase with scheelite structures, which reduces the non-radiative relaxation probability of rare-earth ions and thus increases the luminescence intensity. The minor doping of activator ions influences the optical characteristics of the host matrix.
Several optical parameters, such as the yellow-to-blue ratio (Y/B), critical average distance of Dy3+ ions, type of phonon interaction, and chromaticity color coordinates, were calculated by the emission spectra of Dy3+-doped SMO samples. The ratio between the intensities of the yellow and blue peaks (Y/B) can be used as a measure of the degree of distortion around the dysprosium ion when increasing its concentration. Table 2 presents the values of blue and yellow peak intensities and the Y/B ratios. As can be seen, the change in values is too small, so doping to concentrations of 2 at.% does not have a significant impact on the matrix structure. This was also confirmed by X-ray analyses (Table 1). On the other hand, the value of the Y/B ratio for the synthesized samples is above 1. According to the literature, this means that the Dy-O band is mainly covalent, and the strength of the band does not change significantly [45]. The branching ratios of the yellow transition (4F9/26H13/2) for all samples are about 66%; therefore, these matrices doped by dysprosium are promising for LED application as a yellow light source.
According to Blasse’s investigations [46], the critical average distance can be calculated using the following formula:
Rc = 2[3V/4πXcN]1/3
where V is the volume of the unit cell of the host, Xc is a critical concentration of the active ion, and N is the number of center cations in the matrix cell. In the case of SrMoO4 (ICSD file 98-009-9089), V is 349.24 Å, N is 4, and Xc is 0.005; the critical average distance is about 32.2 Å, which is about eight times the Sr-Sr distance (4.04 Å) in the host. According to the same author [32,46], if Rc is larger than 5 Å, the electric multipolar interaction leads to concentration quenching, but the exchange interaction appears otherwise. In our case, the critical average distance is much larger than 5 Å, so concentration quenching is caused by electric multipolar interactions. The nature of such an interaction can be verified by Dexter’s theory. According to this theory, the type of phonon interaction can be revealed by the following equation:
lg(I/x) = −Q/3 lg(x) + A
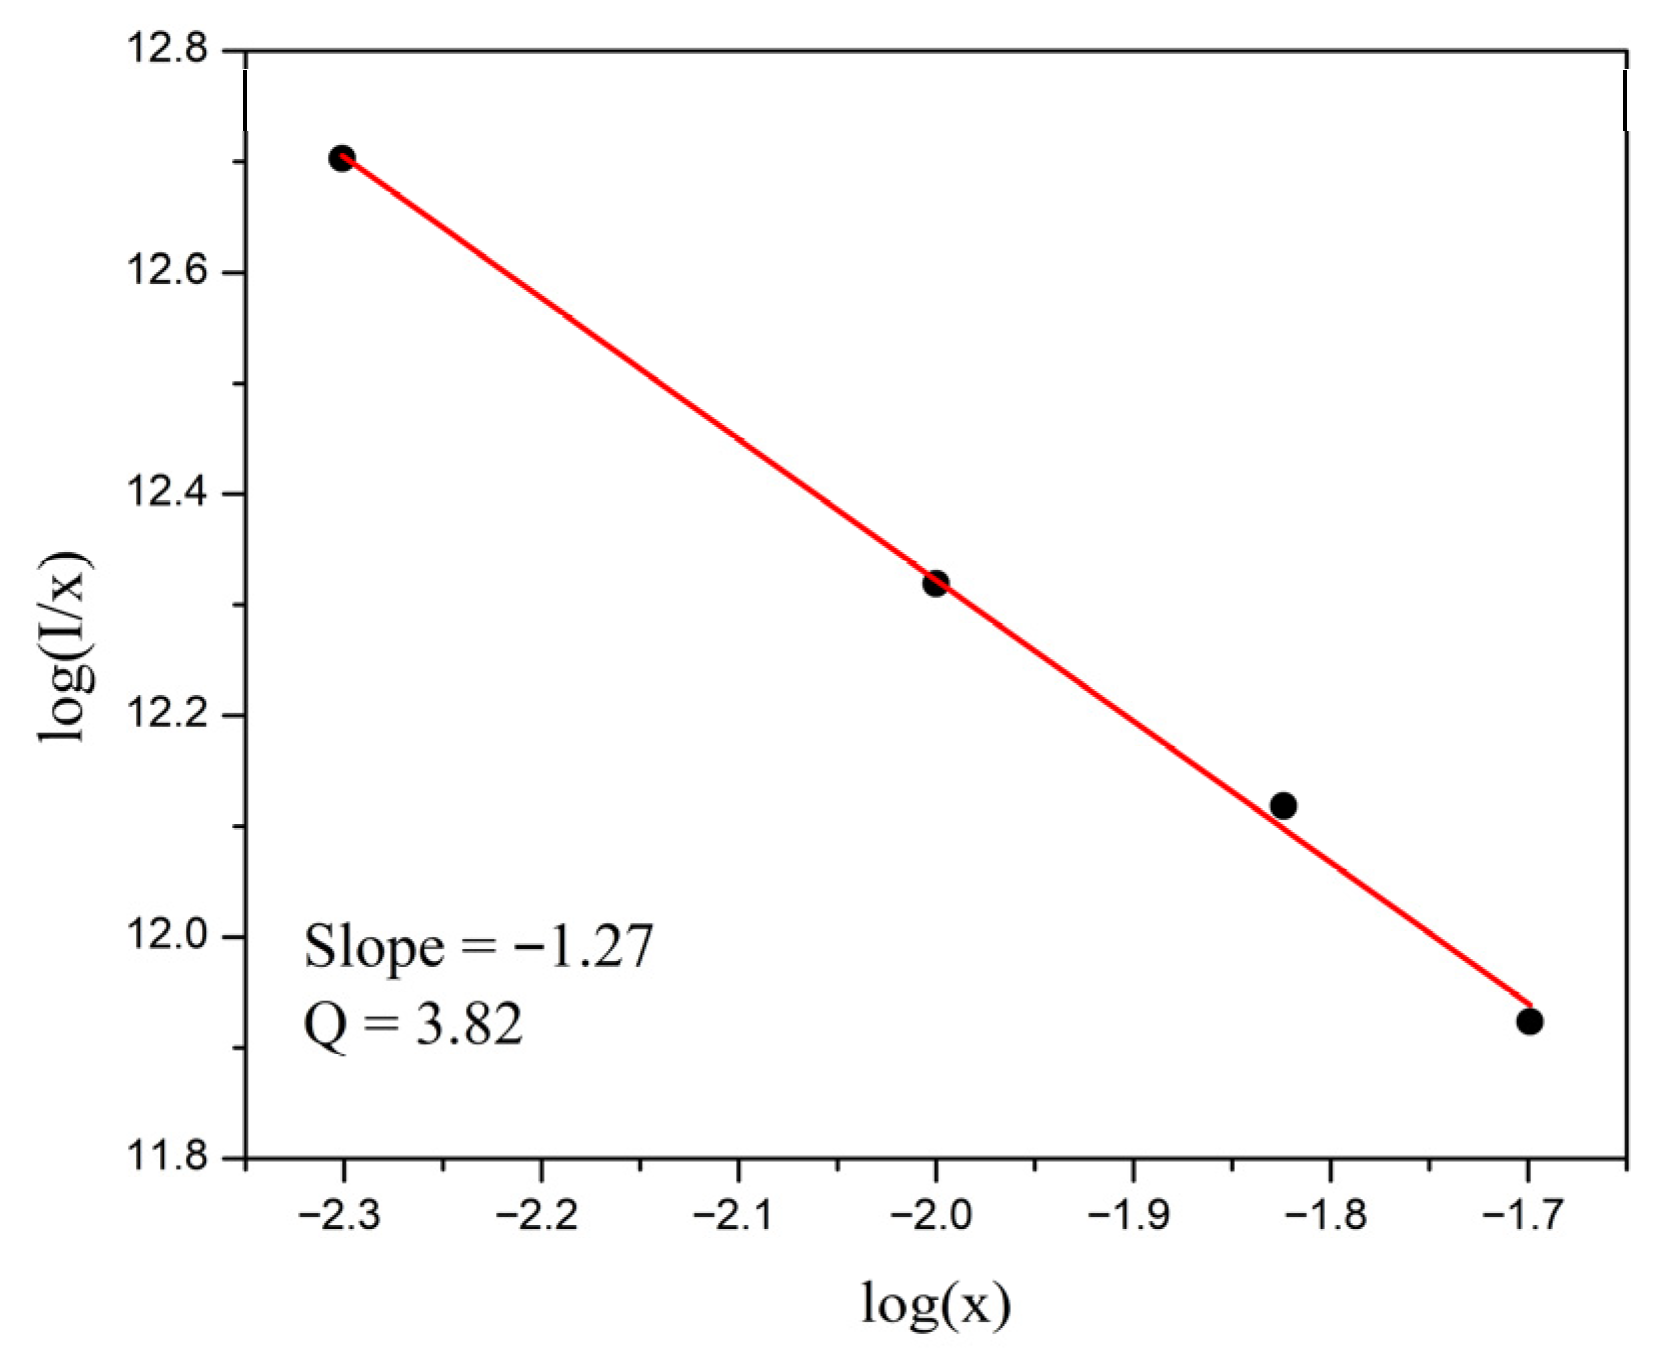
where A signifies a constant, I is the luminescence intensity, x is the doping amount of the active ion, and the Q value is estimated by the slope of the fitted line of the formula, indicating the interaction effect of the luminescence center. When the Q value is close to 6, 8 and 10, it corresponds to the dipole–dipole (d-d), dipole–quadrupole (d-q) and quadrupole–quadrupole (q-q) interactions, respectively [47,48]. In Figure 7, the lg(x)/lg(I/x) for the sample doped by 0.5 at.% Dy3+ is presented. It is shown that the Q value is 3.82, which is less than 6, so the dipole–dipole (d-d) interaction is responsible for concentration quenching. This is probably one of the factors causing the large value of the critical average distance. The dipole–dipole (d-d) interaction of concentration quenching was also reported for CaTiO3:Dy3+ nanophosphors [49].
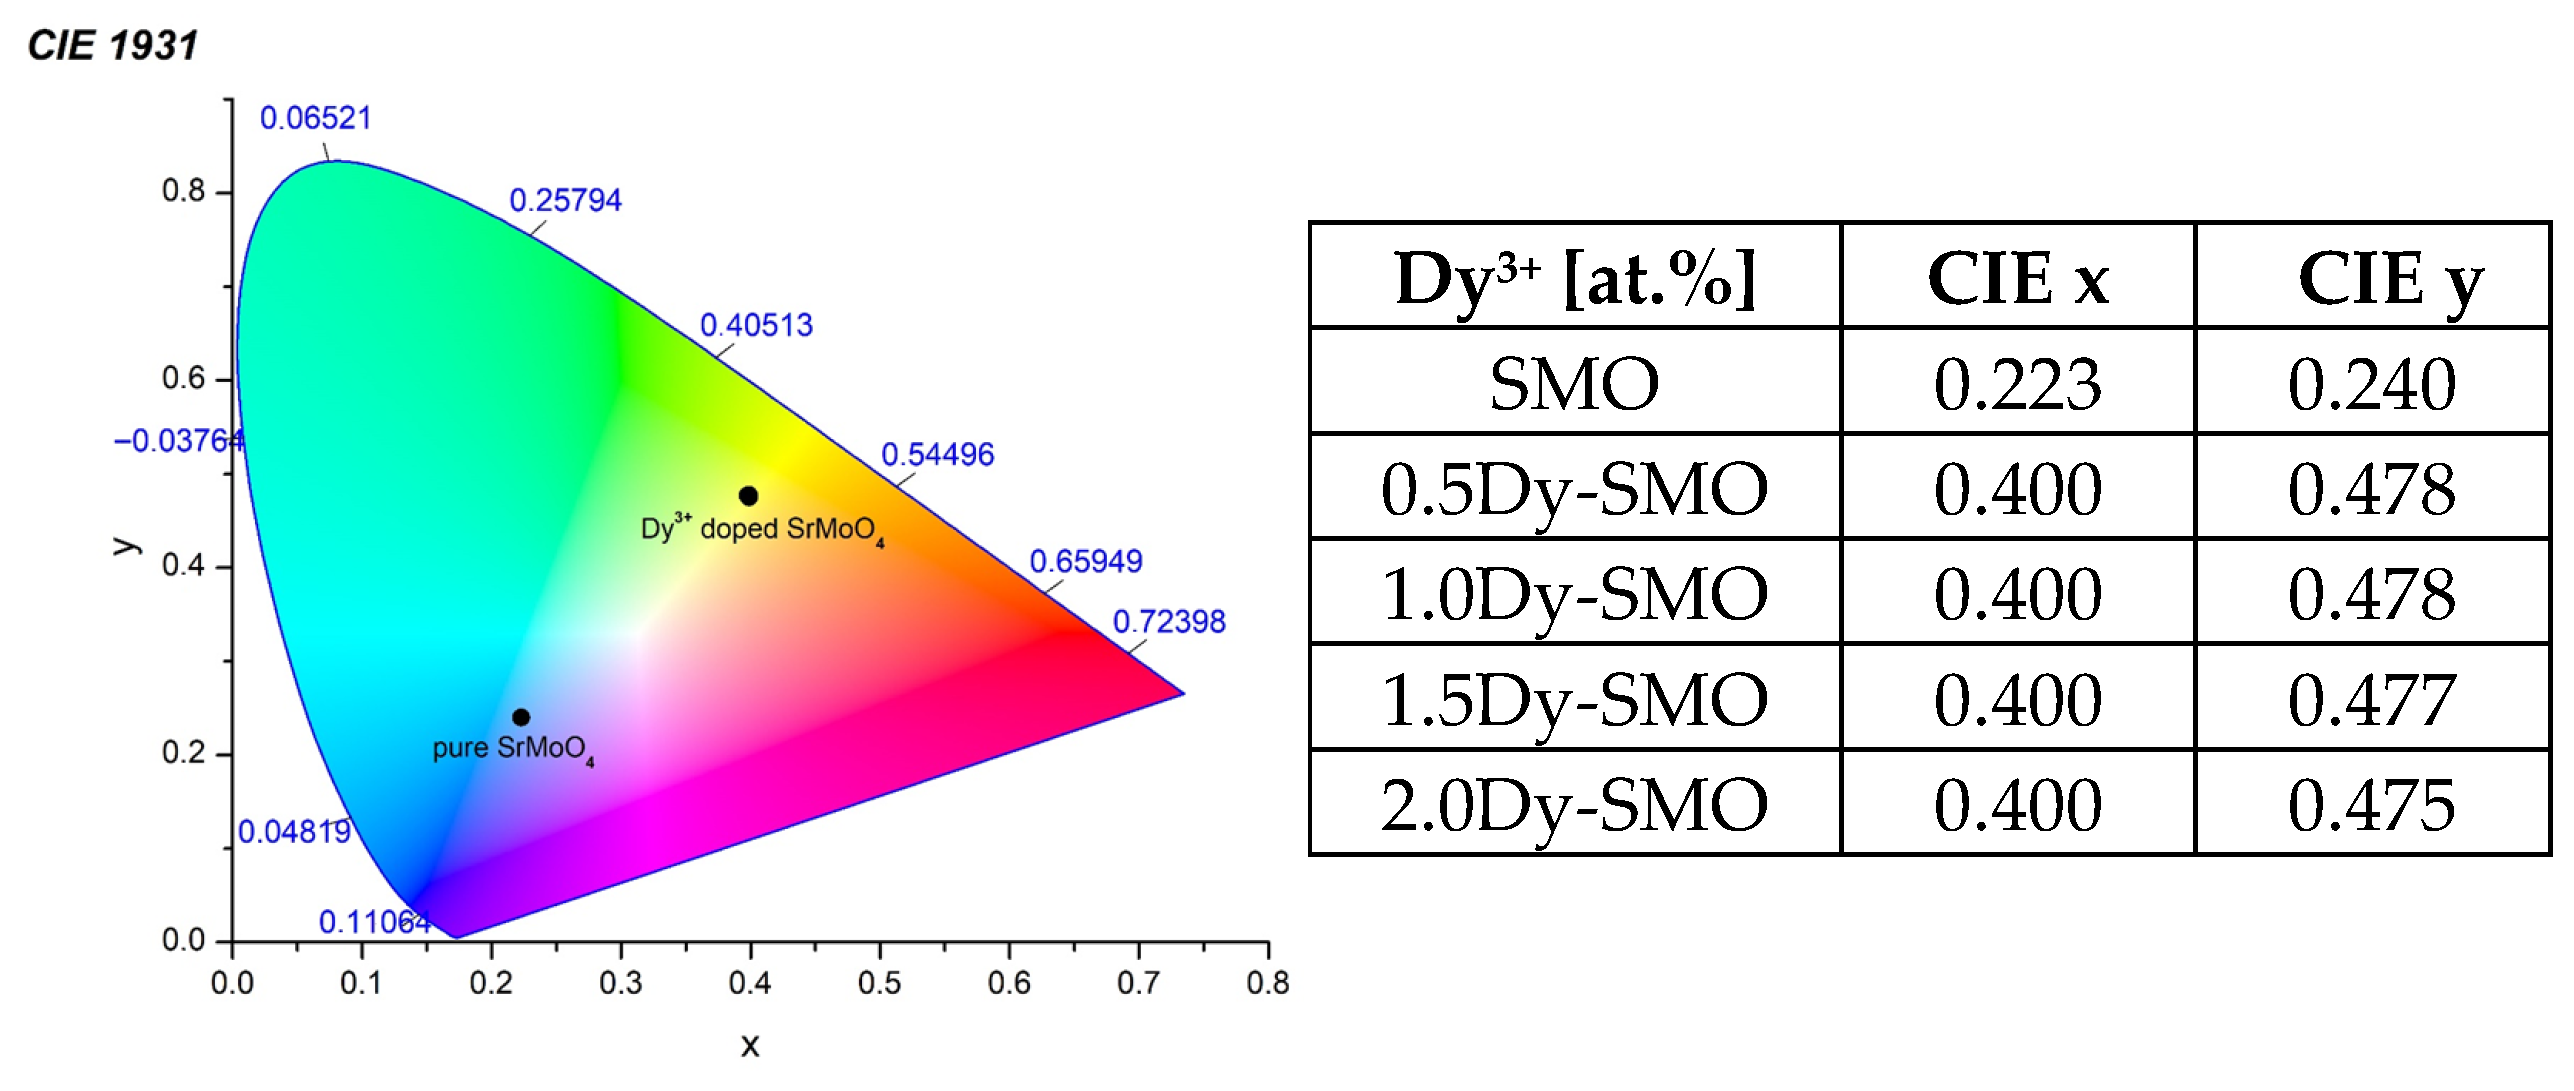
The Commission Internationale de l’Éclairage (CIE) diagram 1931 of the pure and Dy3+-doped samples is shown in Figure 8. The CIE coordinates (x, y) of the as-prepared samples were calculated from the emission spectra. The pure sample emits blue light, while doped samples emit in the yellow spectrum. The resulting yellow light has a slight difference in coloration, which is also visible from the values of the Y/B ratio and CIE coordination values.

3. Materials and Methods

3.1. Direct Mechanochemical Synthesis

The initial mixtures containing SrO (Thermoscientific, Waltham, MA, USA, 99.99%), MoO3 (Merck, Darmstadt, Germany, 99.99%) and Dy2O3 (Aldrich, St. Louis, MO, USA, 99.99%) in the stoichiometric ratio to give the 0.5, 1.0, 1.5 and 2.0 at % Dy-doped phases were subjected to mechanical activation in a planetary ball mill (Fritsch–Premium line Pulversette No 7, Idar-Oberstein, Germany) applied at a milling speed of 850 rpm at room temperature. Both the chamber and the balls were made of ZrO2. In order to avoid the increased temperature during the grinding, the cycle of the milling was 15 min, followed by a pause of 5 min.

3.2. Characterization

The powder XRD patterns were acquired using a Bruker D8 Advance X-ray powder diffractometer (Karlsruhe, Germany) equipped with a CuKa radiation source (1.542 Å) and a LynxEye PSD detector. The lattice parameters (a, c), unit cell volume, microstrain, and crystallite size (D nm) were calculated using the HighScore plus 4.5 and ReX software (ReX v. 0.9.3 build ID 2023 08 221535 (22 August 2023)). The experimental diffraction profiles were modeled using a pseudo-Voigt function, along with the following parameters: scale factors, background coefficients, atomic positions, lattice parameters, occupancy factors, and asymmetry correction factors. Infrared spectra were recorded in the range of 1200–400 cm−1 using a Nicolet-320 FTIR spectrometer (Waltham, MA, USA) using KBr pellets at a spectral resolution of 2 nm. Diffuse reflectance spectra (DRS) were recorded using a Thermo Evolution 300 UV-vis spectrophotometer (Waltham, MA, USA) in order to evaluate the optical band gap of the obtained samples. Spectralon was used as the background. Photoluminescence emission and excitation spectra were recorded on powder samples using a Horiba Fluorolog 3–22 TCS spectrophotometer (Horiba Jobin Yvon S.A.S, Longjumeau, France), equipped with a 450W xenon lamp as the excitation source. All spectra were collected at room temperature. The optical filter used transmits in a range above 400 nm.

4. Conclusions

The suitable mechanochemical approach for the preparation of pure and Dy3+-doped SrMoO4 materials was presented. X-ray diffraction (XRD) analysis confirmed that the samples have a tetragonal structure and an average crystallite size below 30 nm. Using IR and UV-Vis spectroscopy methods, it was established that doping with Dy2O3 led to the formation of MoO4 units with different symmetry and to the reduction in the optical band gap of the obtained crystal phases. Using 230 nm as the excitation source, spectra of the Dy3+-doped SrMoO4 samples show the characteristic emission peak at 430 nm of the host matrix and peaks at 475, 570 and 655 nm for the Dy3+ ions. The maximum luminescence intensity at 570 nm, characteristic of Dy3+ ions, was achieved at 0.5 at.% Dy3+ concentration, beyond which concentration quenching occurs. According to Dexter’s theory, the mechanism of this process was mainly caused by the electric dipole–dipole interaction. The branching ratios for the dominant yellow transitions (4F9/26H13/2) of Dy3+ for all doped samples are about 66%; therefore, they can be promising candidates for LED applications as a yellow light source.

Author Contributions

Conceptualization, M.G. and R.I.; methodology, M.G.; software, I.K., G.A. and P.I.; validation, M.G. and I.K.; formal analysis, M.G. and I.K.; investigation, M.G.; writing—original draft preparation, M.G. and I.K.; writing—R.I.; visualization, M.G., I.K. and P.I. All authors have read and agreed to the published version of the manuscript.

Funding

This research received no external funding.

Institutional Review Board Statement

Not applicable.

Informed Consent Statement

Not applicable.

Data Availability Statement

The original contributions presented in this study are included in the article.

Acknowledgments

Research equipment from the distributed research infrastructure INFRAMAT (part of the Bulgarian National roadmap for research infrastructures), supported by the Bulgarian Ministry of Education and Science under contract D01-322/30, November 2023, was used in this investigation.

Conflicts of Interest

The authors declare no conflicts of interest.

References

  1. Gancheva, M.; Iordanova, R.; Koseva, I.; Avdeev, G.; Burdina, G.; Ivanov, P. Synthesis and luminescent properties of barium molybdate nanoparticles. Materials 2023, 16, 7025. [Google Scholar] [CrossRef]
  2. Jung, J.Y.; Park, J.Y.; Yi, S.S.; Yang, H.K. Barium molybdate up-conversion nanoscale particles with IR-LED chip, temperature sensing, and anti-counterfeiting applications. Nanoscale 2024, 16, 10292–10305. [Google Scholar] [CrossRef] [PubMed]
  3. Zhai, H.F.; Li, W.; Zhang, J.; Xing, D.D.; He, Y.X.; Zhang, P.P.; Liu, H.R.; Yang, J.E.; Wang, B. Excitation-induced tunable luminescent properties of polyhedral CaMoO4 microcrystallites. J. Mater. Sci. Mater. Electron. 2021, 32, 10008–10017. [Google Scholar] [CrossRef]
  4. Gancheva, M.; Iordanova, R.; Koseva, I.; Avdeev, G.; Ivanov, P. Direct mechanochemical synthesis of CaMoO4 and Dy3+ doped CaMoO4 nanoparticles and their photoluminescent properties. Ceram. Int. 2024, 50, 26361–26370. [Google Scholar] [CrossRef]
  5. Künzel, R.; Feldhaus, C.M.S.; Suzuki, Y.O.F.; Ferreira, F.F.; de Paula, V.G.; Courrol, L.C.; Umisedo, N.K.; Yoshimura, E.M.; Okuno, E.; de Azevedo Marques, A.P. Photoluminescence and magnetic properties of SrMoO4 phosphors submitted to thermal treatment and electron irradiation. J. Magn. Magn. Mater. 2022, 562, 169761–169774. [Google Scholar] [CrossRef]
  6. Gancheva, M.; Iordanova, R.; Avdeev, G.; Piroeva, I.; Ivanov, P. Direct mechanochemical synthesis of SrMoO4: Structural and luminescence properties. RSC Mechanochem. 2025, 2, 459–467. [Google Scholar] [CrossRef]
  7. Lan, X.; Wang, B.; Xiao, Z.; Cai, B.; Lv, G.; Huang, Q.; Pemg, R.; Jin, B. Synthesis of scheelite–structured AMoO4 (A = Ca, Ba) via the spiral gas–solid two–phase flow mechanochemical method. J. Mater. Sci. Mater. Electron. 2026, 37, 95–104. [Google Scholar] [CrossRef]
  8. Zhu, Y.N.; Zheng, G.H.; Dai, Z.X.; Mu, J.J.; Yao, Z.F. Mono-disperse SrMoO4 nanocrystals: Synthesis, luminescence and photocatalysis. J. Mater. Sci. Technol. 2017, 33, 834–842. [Google Scholar] [CrossRef]
  9. Ranganatha, C.L.; Palakshamurthy, B.S.; Abhilash, G.P.; Mathew, A.; Kumar, H.S.; Shivakumara, C. Development of flexible luminescent films, photoluminescence properties and anti-counterfeiting applications of SrMoO4:Tb3+ green phosphors. J. Mater. Sci. Mater. Electron. 2023, 34, 1412–1510. [Google Scholar] [CrossRef]
  10. Mikhailik, V.B.; Elyashevskyi, Y.; Kraus, H.; Kim, H.J.; Kapustianyk, V.; Panasyuk, M. Temperature dependence of scintillation properties of SrMoO4. Nucl. Instrum. Meth. Phys. Res. A 2015, 792, 1–5. [Google Scholar] [CrossRef]
  11. Sathiyan, A.; Rajkumar, S.; Dhineshkumar, S.; Merlin, J.P. Electrochemical performance of SrMoO4 as electrode material for energy storage systems. J. Ind. Eng. Chem. 2024, 129, 521–530. [Google Scholar] [CrossRef]
  12. Ramarao, S.D.; Kiran, S.R.; Murthy, V.R.K. Structural, lattice vibrational, optical and microwave dielectric studies on Ca1−xSrxMoO4 ceramics with scheelite structure. Mater. Res. Bull. 2014, 56, 71–79. [Google Scholar] [CrossRef]
  13. Yao, Z.F.; Zheng, G.H.; Dai, Z.X.; Zhang, L.Y. Synthesis of the Dy:SrMoO4 with high photocatalytic activity under visible light irradiation. Appl. Organomet. Chem. 2018, 32, 4412–4420. [Google Scholar] [CrossRef]
  14. Soni, A.K.; Joshi, R.; Jangid, K.; Tewari, R.; Ningthoujam, R.S. Low temperature synthesized SrMoO4:Eu3+ nanophosphors functionalized with ethylene glycol: A comparative study of synthesize route, morphology, luminescence and annealing. Mater. Res. Bull. 2018, 103, 1–12. [Google Scholar] [CrossRef]
  15. Jung, J.Y. Luminescent color-adjustable europium and terbium co-doped strontium molybdate phosphors synthesized at room temperature applied to flexible composite for LED filter. Crystals 2022, 12, 552. [Google Scholar] [CrossRef]
  16. Medina-Aguilar, G.; Lozano-Gorrín, A.D.; Lavín, V.; Hernández-Rodríguez, M.A. Expanding the toolbox for industrial luminescent primary thermometry: Er3+-doped SrMoO4. J. Alloys Compd. 2024, 1002, 175303–175313. [Google Scholar] [CrossRef]
  17. Zhou, A.; Ming, C.; Pei, Y.; Cai, Y.; Guo, T.; Li, H. Controllable thermochromic luminescence in SrMoO4: Eu/Tb by nonradiative relaxation and local symmetry for anti-counterfeiting and high-temperature sensing applications. Opt. Mater. 2026, 169, 117534–117542. [Google Scholar] [CrossRef]
  18. Gurmen, E.; Daniels, E.; King, J.S. Crystal structure refinement of SrMoO4, SrWO4, CaMoO4, and BaWO4 by neutron diffraction. J. Chem. Phys. 1971, 55, 1093–1097. [Google Scholar] [CrossRef]
  19. Su, Q.; Pei, Z.; Chi, L.; Zhang, H.; Zhang, Z.; Zou, F. The yellow-to-blue intensity ratio (Y/B) of Dy3+ emission. J. Alloys Compd. 1993, 192, 25–27. [Google Scholar] [CrossRef]
  20. Zhang, J.; Li, R.; Liu, L.; Li, L.; Zou, L.; Gana, S.; Ji, G. Self-assembled 3D sphere-like SrMoO4 and SrMoO4:Ln3+ (Ln = Eu, Sm, Tb, Dy) microarchitectures: Facile sonochemical synthesis and optical properties. Ultras. Sonochem. 2014, 21, 1736–1744. [Google Scholar] [CrossRef]
  21. Jena, P.; Gupta, S.K.; Natarajan, V.; Padmaraj, O.; Satyanarayana, N.D.; Venkateswarlu, M. On the photo-luminescence properties of sol–gel derived undoped and Dy3+ ion doped nanocrystalline Scheelite type AMoO4 (A = Ca, Sr and Ba). Mater. Res. Bull. 2015, 64, 223–232. [Google Scholar] [CrossRef]
  22. Li, X.; Guan, L.; Sun, M.; Liu, H.; Yang, Z.; Guo, Q.; Fu, G. Luminescent properties of Dy3+ doped SrMoO4 phosphor. J. Lumin. 2011, 131, 1022–1025. [Google Scholar] [CrossRef]
  23. Zhang, L.Y.; Fu, W.W.; Zheng, G.H.; Dai, Z.H.; Zhu, Y.H.; Mu, J.J. Morphology and luminescent properties of SrMoO4:Eu3+, Dy3+. J. Mater. Sci. Mater. Electron. 2016, 27, 5164–5174. [Google Scholar] [CrossRef]
  24. Yogananda, H.S.; Yashodha, S.R.; Basavaraj, R.B.; Bhagya, N.P.; Lalithamba, H.S.; Sharanakumar, T.M.; Kumarg, C.R.R.; Shettyh, H.D. Fabrication of white light emitting SrMoO4:Dy3+ nanophosphors: Photoluminescence, ultrasensitive detection in electrochemical sensing, photocatalytic andadvanced forensic applications. Mater. Sci. Engin. B 2025, 322, 118627–118642. [Google Scholar] [CrossRef]
  25. Niu, N.; Yang, P.; Wang, W.; He, F.; Gai, S.; Wang, D.; Lin, J. Solvothermal synthesis of SrMoO4:Ln (Ln = Eu3+, Tb3+, Dy3+) nanoparticles and its photoluminescence properties at room temperature. Mater. Res. Bull. 2011, 46, 333–339. [Google Scholar] [CrossRef]
  26. Wu, D.; Deng, C. Solid-state reaction synthesis and luminescent properties of (Sr(1−y)La2y/3)(1−x)MoO4:xDy3+ phosphor. J. Mater. Sci. Mater. Electron. 2017, 28, 16321–16328. [Google Scholar] [CrossRef]
  27. Gancheva, M.; Iordanova, R.; Koseva, I.; Piroeva, I.; Ivanov, P. Structural and optical properties of BaWO4 obtained by fast mechanochemical treatment. Inorganics 2025, 13, 172. [Google Scholar] [CrossRef]
  28. Havasi, V.; Tátrai, D.; Szabó, G.; Varga, E.; Erdőhelyi, A.; Sipos, G.; Kónya, Z.; Kukovecz, Á. On the effects of milling and thermal regeneration on the luminescence properties of Eu2+ and Dy3+ doped strontium aluminate phosphors. J. Lumin. 2020, 220, 116917–116932. [Google Scholar] [CrossRef]
  29. Penczner, S.H.; Kumar, P.; Patel, M. Innovations in mechanochemical synthesis: Luminescent materials and their applications. Mater. Today Chem. 2024, 39, 102177–102195. [Google Scholar] [CrossRef]
  30. Zhang, J.; He, J.; Gao, M.; Liu, M.; Peng, J.; Ye, X. Mechanochemical preparation of Mn4+-activated K3MoO3F3 phosphors with short fluorescence lifetime. J. Mol. Str. 2025, 142317–142326. [CrossRef]
  31. Li, H.; Liang, Y.; Zhu, Y.; Liu, S.; Chen, J.; Leia, W.; Wang, M. Control of the photoluminescence in Ba0.97Y2Si3O10:Eu2+ phosphors via the intensification effect of the second luminescence centre. Inorg. Chem. Front. 2018, 5, 2111–2122. [Google Scholar] [CrossRef]
  32. Katiyar, R.; Kumar, V.; Kaur, S.; Rao, A.S. Optical characteristics of samarium doped SrMgSi2O6 silicate phosphors. J. Lumin. 2026, 289, 121613–121627. [Google Scholar] [CrossRef]
  33. Shannon, R.D. Revised effective ionic radii and systematic studies of interatomie distances in halides and chaleogenides. Acta Cryst. 1976, A32, 751–768. [Google Scholar] [CrossRef]
  34. Kashchieva, E.; Petrov, I.; Aleksandrov, L.; Iordanova, R.; Dimitriev, Y. Microstructure of multicomponent borosilicate glasses containing MoO3. Phys. Chem. Glas.-Eur. J. Glass Sci. Technol. B 2012, 53, 264–270. [Google Scholar]
  35. Dos Santos, D.F.; Lovisa, L.X.; Santiago, A.A.G.; Siu Li, M.; Longo, E.; Bomio, M.R.D.; Motta, F.V. Growth mechanism and vibrational and optical properties of SrMoO4:Tb3+, Sm3+ particles: Green–orange tunable color. J. Mater. Sci. 2020, 55, 8610–8629. [Google Scholar] [CrossRef]
  36. Muralidharan, M.; Anbarasu, V.; Perumal, E.; Sivakumar, K. Enhanced ferromagnetism in Cr doped SrMoO4 scheelite structured compounds. J. Mater. Sci. Mater. Electron. 2016, 27, 2545–2556. [Google Scholar] [CrossRef]
  37. Tauc, J. Absorption edge and internal electric fields in amorphous semiconductors. Mater. Res. Bull. 1970, 5, 721–729. [Google Scholar] [CrossRef]
  38. Bi, J.; Wu, L.; Zhang, Y.; Li, Z.; Li, J.; Fu, X. Solvothermal preparation, electronic structure and photocatalytic properties of PbMoO4 and SrMoO4. Appl. Catal. B Environ. 2009, 91, 135–143. [Google Scholar] [CrossRef]
  39. Wang, Y.; Xu, H.; Hao, C.; Cao, J. Doping induced grain size reduction and photocatalytic performance enhancement of SrMoO4:Bi3+. Appl. Surf. Sci. 2017, 392, 649–657. [Google Scholar] [CrossRef]
  40. Kaewnuam, E.; Wantna, N.; Saikaew, S.; Kaewkhao, J. The luminescence, optical, and structural properties of SrMoO4:Ce3+ phosphor for photonics material applications. J. Met. Mater. Miner. 2020, 30, 73–79. [Google Scholar] [CrossRef]
  41. Blasse, G.; Grabmaier, B.C. Luminescent Materials; Springer Science & Business Media: Berlin/Heidelberg, Germany, 2012. [Google Scholar]
  42. Li, J.; Yu, Y.; Liao, J.; Zhang, L.; Xiao, X.; Xiao, H.; Liao, J. Tunable luminescent color and anti-thermal quenching of Dy3+ or/and Eu3+ doping in Sc2(WO4)3 phosphors for white light-emitting diode applications. J. Solid State Chem. 2025, 352, 125599–125610. [Google Scholar] [CrossRef]
  43. Vu, T.H.Q.; Stefanska, D.; Deren, P.J. Effect of A-cation radiuson the structure, luminescence, and temperature sensing of double perovskites A2MgWO6 doped with Dy3+ (A = Ca, Sr, Ba). Inorg. Chem. 2023, 62, 20020–20029. [Google Scholar] [CrossRef]
  44. Huang, L.; Qian, J.; Sun, S.; Li, D. Fixed yellow-to-blue intensity ratio of Dy3+ in KY(CO3)2 host for emission color tuning. Materials 2024, 17, 1438. [Google Scholar] [CrossRef] [PubMed]
  45. Abdallah, A.; Bouzidi, C. Optical studies of Dy2O3 doped phosphate glasses for potential white luminescence applications. Solid State Sci. 2025, 165, 107958–107968. [Google Scholar] [CrossRef]
  46. Blasse, G.P.R.L. Energy transfer in oxidic phosphors. Phys. Lett. A 1968, 28, 444–445. [Google Scholar] [CrossRef]
  47. Dexter, D.L. A theory of sensitized luminescence in solids. J. Chem. Phys. 1953, 21, 836–850. [Google Scholar] [CrossRef]
  48. Dexter, D.L.; Schulman, J.H. Theory of concentration quenching in inorganic phosphors. J. Chem. Phys. 1954, 22, 1063–1070. [Google Scholar] [CrossRef]
  49. Singh, D.K.; Manam, J. Investigation of Structural, Spectral and Photometric Properties of CaTiO3:Dy3+ Nanophosphors for the Lighting Applications. Electron. Mater. Lett. 2017, 13, 292–301. [Google Scholar] [CrossRef]
Figure 1. (A) XRD patterns of the mechanochemically obtained pure and Dy3+-doped SrMoO4 samples after 30 min of milling time at a milling speed of 850 rpm. (B) XRD patterns in the 26.8–28.4° 2θ region for the mechanochemically obtained pure and Dy3+-doped SrMoO4 samples.
Inorganics 14 00133 g001
Figure 2. IR spectra of the mechanochemically obtained pure and Dy3+-doped SrMoO4 samples.
Inorganics 14 00133 g002
Figure 3. (A). Kubelka–Munk spectra of the mechanochemically obtained pure and Dy3+-doped SrMoO4 samples. (B). Tauc plots for band gap calculations of the mechanochemically obtained pure and Dy3+-doped SrMoO4 samples.
Inorganics 14 00133 g003
Figure 4. Excitation spectra of the mechanochemically obtained Dy3+-doped SrMoO4. The line between 282 and 288 nm is an artifact from the xenon lamp.
Inorganics 14 00133 g004
Figure 5. Emission spectra of the mechanochemically obtained pure and Dy3+-doped SrMoO4 samples.
Inorganics 14 00133 g005
Figure 6. Emission spectrum of Dy2O3.
Inorganics 14 00133 g006
Figure 7. Type of phonon interaction presented by the lg(x)/lg(I/x) graph for the SrMoO4 sample doped by 0.5 at.% Dy3+.
Inorganics 14 00133 g007
Figure 8. CIE diagram and coordinates of pure and Dy3+-doped SrMoO4 samples under 230 nm excitation wavelength.
Inorganics 14 00133 g008
Table 1. Crystal data and refinement results for the pure and Dy3+-doped SrMoO4 samples.
SamplesSpace Groupa = b
(Å)
c (Å)Unit Cell
Volume, (Å3)
Crystallite Size, DnmMicrostrain
(ε, %)
SMOI 41/a5.4162 (2)11.9638 (7)350.9630.000.046
0.5Dy-SMOI 41/a5.3937 (3)12.0215 (9)349.7327.000.198
1.0Dy-SMOI 41/a5.3891 (3)12.0076 (9)348.7225.500.087
1.5Dy-SMOI 41/a5.3870 (3)11.9985 (9)348.1924.000.072
2.0Dy-SMOI 41/a5.3856 (3)11.9938 (9)347.8321.000.064
Table 2. Blue and yellow peak areas and Y/B ratio for the Dy3+-doped SrMoO4 samples.
Dy3+ [at.%]Blue Peak Area ×109Yellow Peak Area ×109Y/B
0.53.1916.85.25
1.02.6013.95.34
1.52.4613.15.35
2.02.0111.15.50
Disclaimer/Publisher’s Note: The statements, opinions and data contained in all publications are solely those of the individual author(s) and contributor(s) and not of MDPI and/or the editor(s). MDPI and/or the editor(s) disclaim responsibility for any injury to people or property resulting from any ideas, methods, instructions or products referred to in the content.