Article

Combination of Acid and Base Activation of Montmorillonite Clay and Its Impact on the Basic Blue-41 Removal Properties: Regeneration and Single Batch Design

1
Department of Chemistry, Faculty of Science, Islamic University of Madinah, Madinah 42351, Saudi Arabia
2
Department of Chemistry, Faculty of Science, Taibah University, Madinah 30002, Saudi Arabia
3
Laboratory of Applied Organic Chemistry (LCOA), Chemistry Department, Faculty of Sciences and Techniques, Sidi Mohamed Ben Abdellah University, Imouzzer Road, P.O. Box 2202, Fez 30000, Morocco
4
Department of Physics, Faculty of Science, Mu’tah University, Mu’tah 61710, Jordan
*
Authors to whom correspondence should be addressed.
Inorganics 2025, 13(7), 228; https://doi.org/10.3390/inorganics13070228
Submission received: 4 May 2025 / Revised: 30 June 2025 / Accepted: 4 July 2025 / Published: 7 July 2025
(This article belongs to the Section Inorganic Materials)

Abstract

The treatment with an alkali (sodium hydroxide) solution of acid-activated montmorillonite clay minerals resulted in a reduction in specific surface area. However, a significant enhancement in the removal of basic blue-41 dye solution was achieved compared to acid-activated samples only (first step of activation) and to the raw montmorillonite clay. The obtained products were characterized using different techniques. The results indicated that the acid-activated montmorillonites exhibited different physicochemical properties than the starting raw montmorillonite, with a reduction in the cation exchange capacity and improvements in the specific surface area (from 5 m2/g to 274 m2/g) and total pore volume (from 0.031 cm3/g to 0.450 cm3/g) due to the formation of the amorphous silica phase. However, the treatment with NaOH solution was accompanied by significant reductions in the specific surface area (from 274 m2/g to 18 m2/g) and total pore volume (from 0.450 cm3/g to 0.02 cm3/g) due to the dissolution of the formed amorphous silica phase, as confirmed through 29Si MAS NMR and FTIR techniques. In addition, the SiO2/Al2O3 molar ratios were close to those of the starting montmorillonite clay. The removal of the cationic basic blue-41 was optimized under different conditions, such as different initial concentrations, adsorbent doses, and pHs of the dye solution. The maximum removal capacities of acid-activated clays were in the range of 45 mg/g to 80 mg/g and decreased with the extent of the acid activation process. However, the capacities were enhanced after NaOH treatment and reached values in the range of 80 to 120 mg/g. Enhancing the surface area had less of an impact on the materials’ removal ability. The obtained materials performed well in seven adsorption–regeneration cycles, showing a 70% reduction in removal effectiveness.

1. Introduction

Water pollution constitutes a severe challenge to global public health [1,2]. The severity and nature of the health impacts caused by pollutants are affected by numerous factors, including their concentration, their chemical composition, and the extent of contact. Water polluted by colored dyes is deemed to be a significant environmental problem [3]. These dyes are challenging to degrade, and breaking them down could produce products that are toxic to people and the environment [4,5]. Several dyes exhibit toxic impacts on the health of humans, animals, and the ecosystem, and limit the development of socio-economic systems [1,6,7].
Consequently, it is essential to develop an efficient, accessible, and environmentally friendly procedure for dye removal from wastewater for environmental preservation. Several chemical, physical, and biological technologies have been proposed and reviewed in different reviews [8,9,10]. Of course, each technology has its own advantages and disadvantages, and combinations of two technologies have sometimes been employed in pilot plans [11]. The adsorption process was the most common technology used as the initial step for wastewater treatment [12]. The characteristics of adsorbents are crucial, and a variety of materials have been explored by scientists, from natural to manufactured; various reviews have been published in this regard [13,14,15,16]. It has been found that the application efficiency is constrained by the high cost and difficulty in operating the regeneration process of these materials. Among the low-cost materials, natural clay has been proposed as a potential candidate in the adsorption process due to its natural abundance around the globe, facilitating its use by local communities in various applications. Natural clay materials have been used with or without modification [17]. The best approach is the use of these materials without modification to reduce their cost. However, their modification is necessary in some cases to adapt them to specific applications. For example, organo modification with organic cations was required to remove acidic dyes that hold negative charge once dissolved in water [18].
In addition to the adsorbent costs, the effects of operating parameters are decisive and deserve to be investigated. The initial concentration, dose, temperature, time, regeneration, and pH of the environment are the most crucial factors [19].
Generally, the pH of the dye is adjusted by adding a hydrochloric acid or sodium hydroxide solution before adding the solid to the dye solution [19]. The pH values affect the charge of the dyes and the solid. In the case of clay minerals, the charge is pH-dependent at the particle edges, arising from the protonation or deprotonation of surface hydroxyls. To adapt clays for this application, the sorption behavior is adjusted based on environmental conditions [20].
The removal of anionic dyes such as eosin Y was enhanced at acidic pHs, while that of basic dyes such as basic blue-41 was promoted at higher environmental pH values. Another method was proposed that consisted of changing the pH values of the removal agent surface itself prior to adding it to the dye solution at natural pH (i.e., without altering the dye solution’s pH). For example, the treatment of waste bricks with sodium hydroxide solution improved their removal capacity of basic blue-41 from 16 mg/g to 25 mg/g compared to the raw waste bricks [21]. Meanwhile, the treatment of organoclay solids with hydrochloric solution improved the removal efficiency of eosin Y dye from 50 mg/g to 78 mg/g [22].
Other factors that are necessary for an efficient adsorbent are the surface area and porosity. Many studies have been undertaken to improve and tune these properties [23]. Different methods have been proposed, such as pillaring processes, functionalization, and acid activation [23]. Acid activation was adopted to modify the properties of the parent clay, especially its textural properties and acidity. These two factors are very important in catalytic applications [24]; however, the surface area was believed to be the decisive factor compared to acidity during the adsorption process [25].
Acid treatment dissolves impurities such as calcite and substitutes hydrogen ions for the exchangeable cations, in addition to the leaching cations from octahedral and tetrahedral sheets. It also causes the platelets’ edges to open, increasing the surface area and pore sizes. The minerals are dissolved in acid and form a hydrous, partially protonated amorphous silica phase; however, extremely disordered tetrahedral layers that are no longer parallel to one another are retained [26]. The type of clay and the acid treatment temperature affect the leaching and characteristics of the altered clay minerals [26,27]. For example, a clay that was acid-activated at 90 °C had a higher surface area and pore volume compared to a clay treated at room temperature, and the room-temperature activation resulted in little structural destruction [26].
Initially, acid activation seems to be an easy process; however, the obtained properties should be tuned and planned during the design of this process. The type of acid (organic or inorganic), the temperature, and the period of activation must all be selected. In addition, the origin of the clay minerals has to be considered, as each clay behaves differently from another [27,28]. The three main acids used during this process are hydrochloric, nitric, and sulfuric acid. The choice of the acid is based on the application of the resulting materials, and in some cases, trials have to be performed before making the final decision.
The treatment of clay minerals with alkali solution was reported to dissolve some impurities in the clay minerals, and its impact on the properties was not as significant as in the case of acid treatment [29,30]. Alkali activation with Na2CO3 was adopted to convert an aluminosilicate precursor into an alkali aluminosilicate phase at 110 °C for 3 days [31].
Montmorillonite is a quintessential clay mineral that has been the subject of many research activities due to its intriguing properties. This study intends to hit two birds with one stone: First, acid activation of the parent clay is performed to increase its surface area and porosity. Then, the resulting acid-activated clays are treated with NaOH solution to modify the charge from positive to negative, thus improving the attraction between the positively charged dye and the negatively charged surface of the obtained materials while maintaining the same surface area and porosity. The material’s physicochemical properties were investigated using different characterization techniques. The remarkable efficacy of these materials was established through extensive removal experiments in batch and regeneration studies, presenting intriguing opportunities for their commercial application as cost-effective and environmentally friendly adsorbents. Additionally, a single batch adsorber design was suggested, utilizing the isotherm model parameters and the mass balance equation.

2. Results and Discussion

2.1. Chemical Composition (XRF Data)
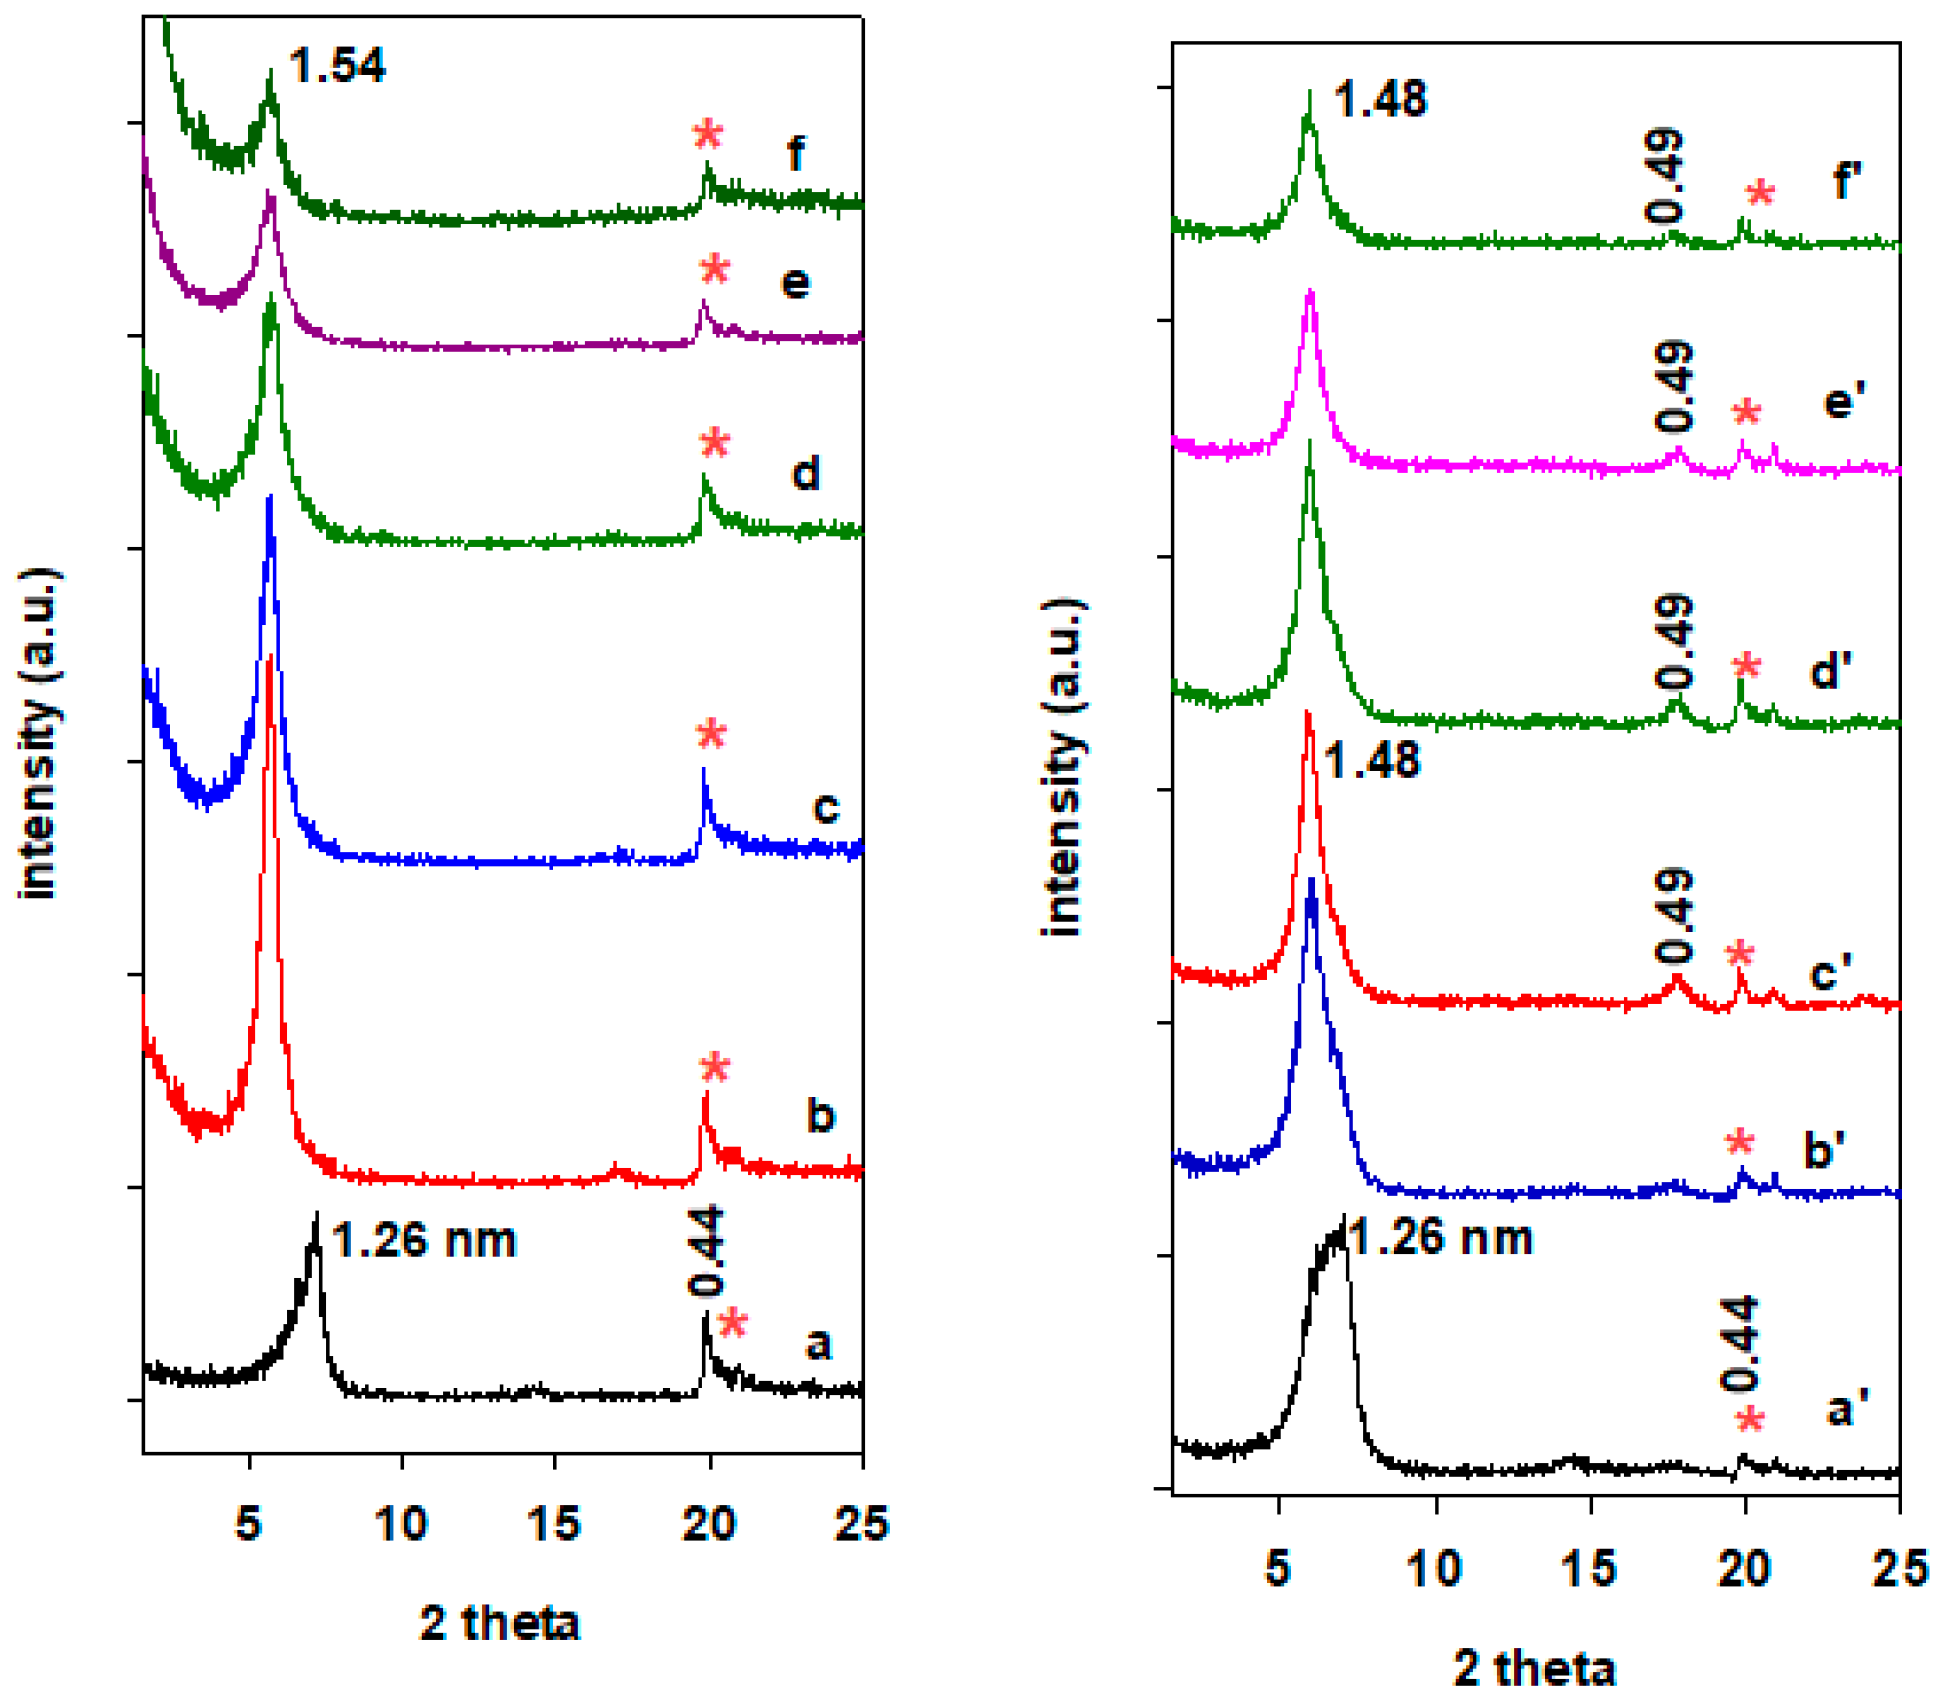
The XRF results displayed in Table 1 show that acid activation of PG montmorillonite acid induced a reduction in the content of NaO (in weight percentage) associated with the replacement of Na+ cations with protons [32]. An increase in the SiO2 content due to the regeneration of the silica phase was also noted, which was enhanced with the increase in the acid/clay ratio. As the concentration of the acid increased, so did the number of protons, and the reduction in Al2O3 and MgO percentages was also enhanced. The resulting CEC was impacted by the leaching of magnesium and aluminum cations, with a clear reduction from 142 meq/100 g to 65 meq/100 g for the A-PG(0.5) sample [33].
It can be seen that the dissolving order of cations in the octahedral sheet of montmorillonites is MgO > Fe2O3 > Al2O3, i.e., MgO is the easiest and Al2O3 is the most difficult to dissolve. During activation, the content of Al2O3 decreases significantly due to the dissolution of octahedral Al, whereas the proportion of SiO2 increases relatively with the acid/clay ratio (shown in Table 1).
Further base activation of A-PG(X) samples induced an increase in NaO percentage, due to the exchange of protons for Na+ cations originating from the NaOH solution, as reported in previous studies, and a decrease in the SiO2 percentage due to the dissolution of amorphous silica. This decrease in the SiO2 phase was accompanied by increases in the percentages of MgO and Al2O3 in the base-treated clays. Generally, the molar ratio of SiO2 to Al2O3 in the BA-PG(X) was lower compared with A-PG(X) clays, and an average value of 3 was obtained. This value was close to the molar ratio of the starting PG clay of 2.84.

2.2. XRD Data

Figure 1 (left) shows the powder XRD patterns of parent PG clay and APG(X) samples. The starting PG clay pattern exhibited an intense reflection corresponding to d001 of 1.26 nm, indicating that PG clay has the characteristic of Na montmorillonite, as confirmed by XRF data [34]. The d001 value of 1.26 nm corresponds to the interlayer spacing of 0.30 nm, associated with the presence of water molecules (12% mass in moisture) in the intragallery region between the aluminosilicate clay layers.
Upon acid activation, an increase in the basal spacing to 1.52 nm was observed for the A-PG(X) samples due to the presence of two layers of water molecules, and reflected the change in the nature of interlayer cations from sodium to protons [35]. The moderately broad (001) reflection with an intensity decrease in the PXRD patterns of the A-PG(X)s indicated that the stacking of the layered structure was more disordered due to loose crystallinity and disintegration of clay sheets. The intensity of the 110 reflection (at 0.44 nm) also reduced, reflecting a change in the chemical composition of the clay sheets.
Additional NaOH treatment caused a shift in the 001 reflection from 1.54 nm to 1.47 nm, associated with a re-exchange of protons by Na+ cations with a reduction in water molecules’ content (Figure 1 right) [36]. A comparable value of 1.44 nm was reported for montmorillonite clay treated with Na2CO3 solution [31]. An enhancement in the intensity of the 001 reflection was noted compared to the A-PG(X) samples, and indicated better crystallinity of the obtained BA-PG(X) samples. The presence of a 003 reflection (ca. 0.49 nm) was also observed. The dissolution of the amorphous silica during NaOH treatment was hardly detected through PXRD. However, its proof was revealed by FTIR and 29Si MAS NMR (see below). It was reported that new phases were formed upon treatment of montmorillonite clay with NaOH solution for more than 3 days. It was difficult to discern a new phase in the current study. This difference could be associated with the short treatment period or the origin of the clay minerals [37,38].

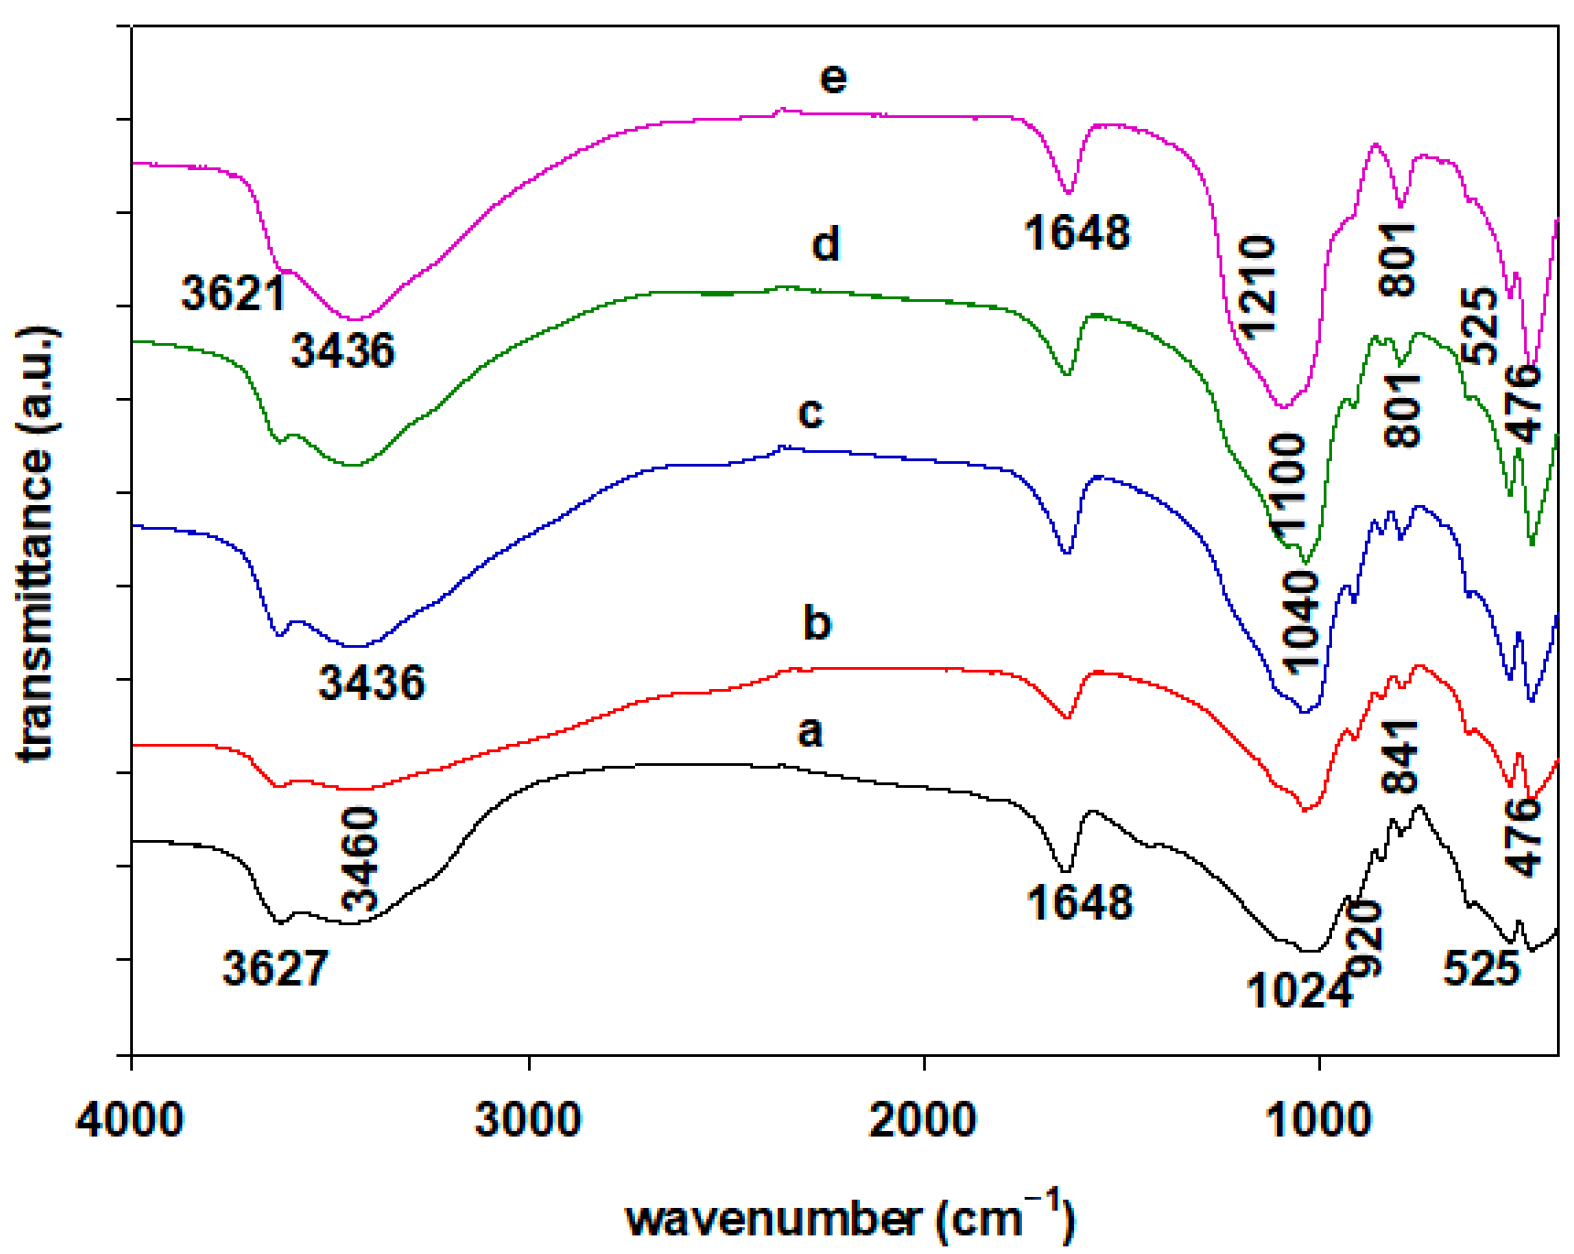
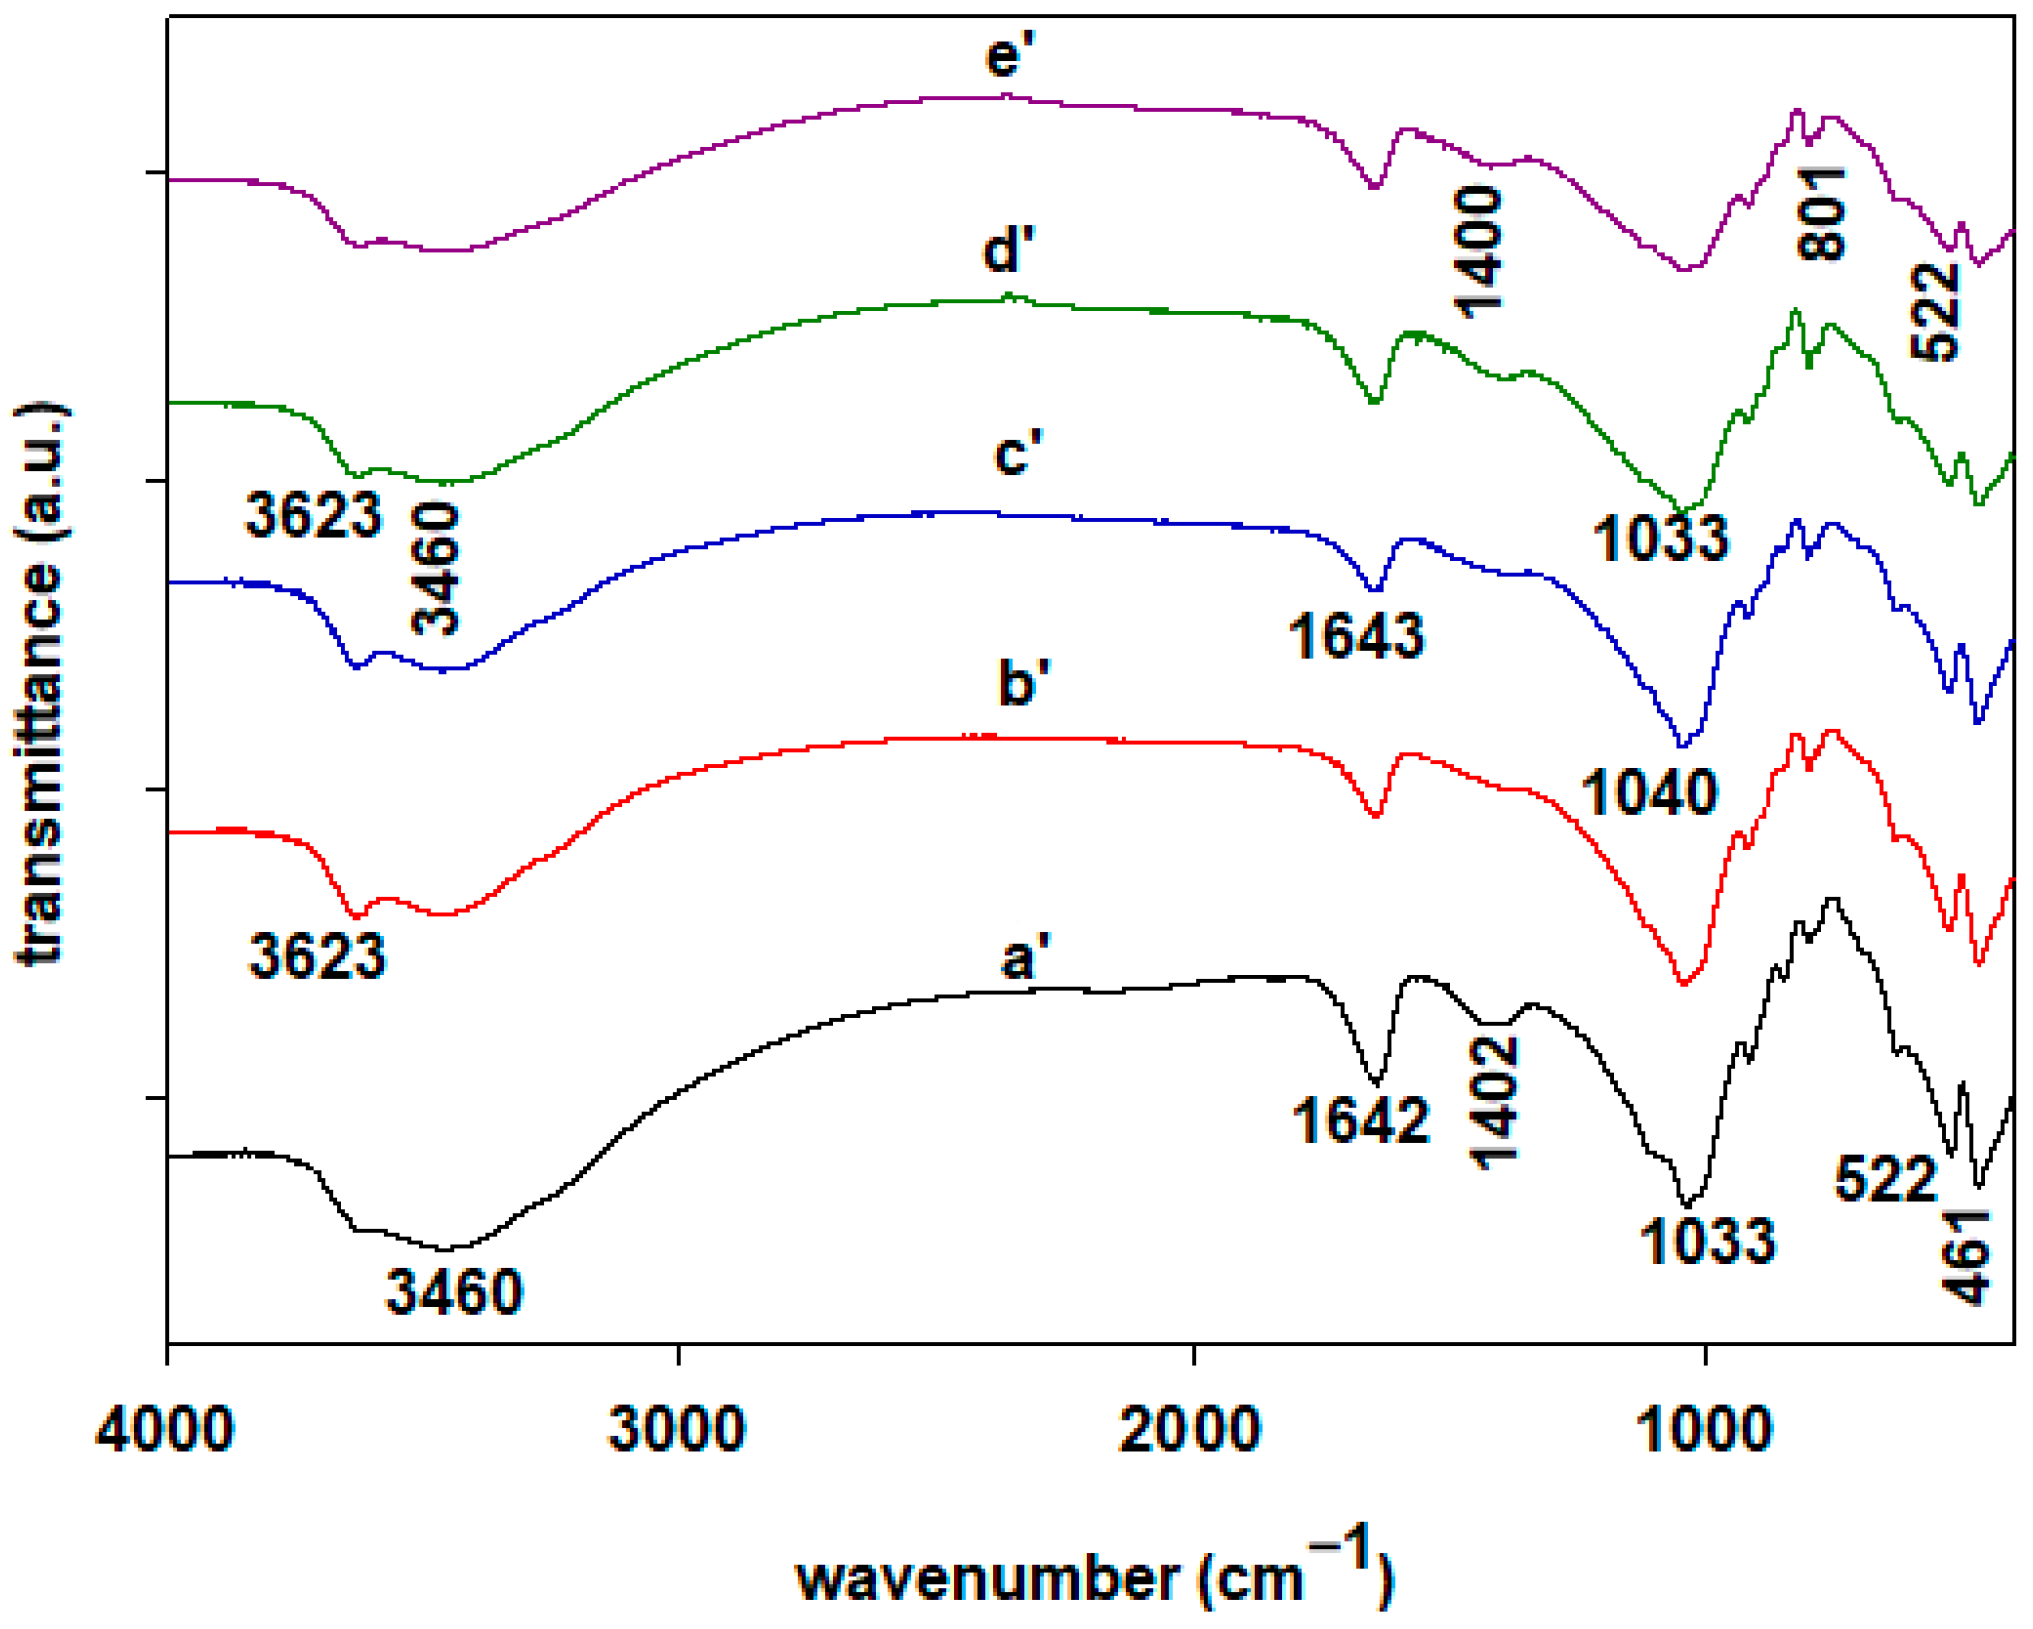
2.3. FTIR Spectroscopy
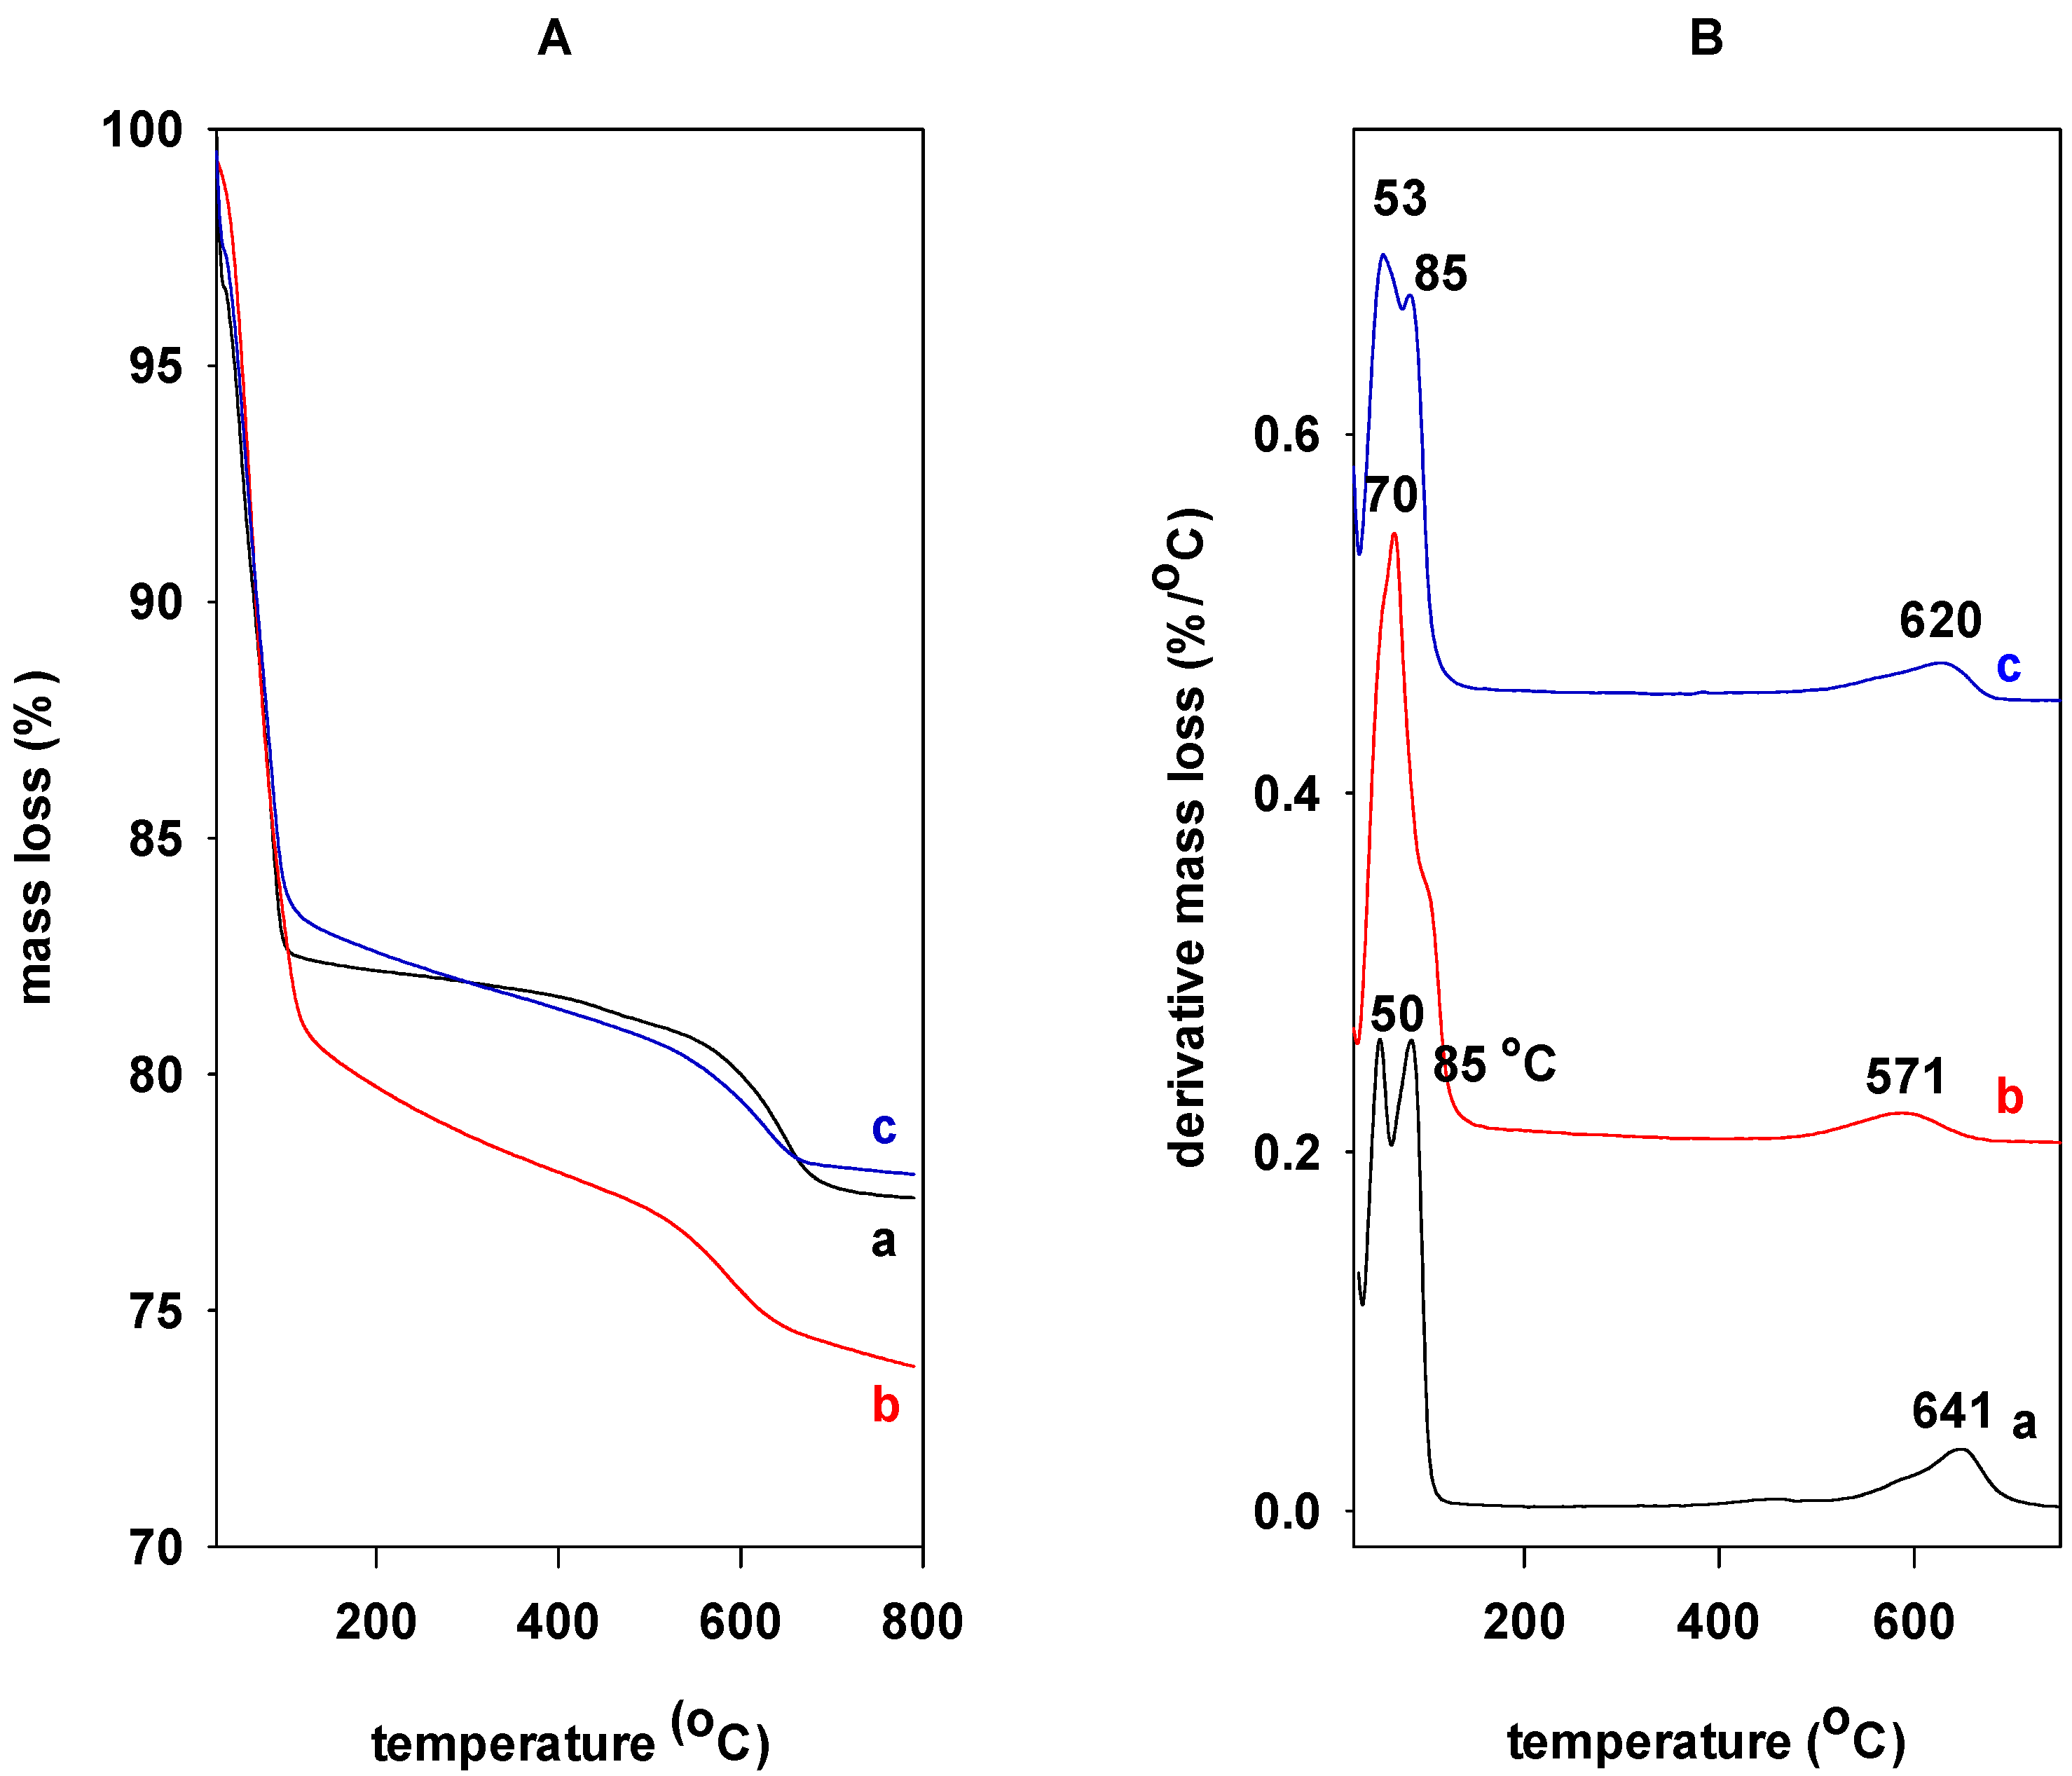
The PG sample exhibited two bands of OH stretching vibration of the structural hydroxyl groups in the clay sheets and the water molecules present in the interlayer at 3627 and 3436 cm−1, respectively. The bending vibration mode of the coordinated interlayer OH groups was detected at 1648 cm−1 [36,39]. The broad band in the 1020–1100 cm−1 range was assigned to the complex Si-O stretching vibrations in the tetrahedral sheets. Meanwhile, the two bands at 525 and 476 cm−1 were attributed to Si-O-Al (octahedral Al) and Si-O-Si bending vibrations [40] (Figure 2).
Some changes in FTIR spectra occurred during the acid activation, with a shift of the band at 1030 cm−1 to 1100 cm−1 assigned to Si-O vibrations of the formed three-dimensional amorphous silica [41]. The later phase was supported by the enhancement of the two bands at 1210 and 801 cm−1. The gradual leaching of the metals from the octahedral sheets was evidenced by reductions in the intensity bands at 920 and 841 cm−1. The release of octahedral cations from the structure and the replacement of interlayer cations by protons may be the causes of the reduction in band intensity at 3627 cm−1 [41]. The A-PG(0.5) sample still preserved some clay features, as supported by the traces of the 3627 and 525 cm−1 bands, in good accordance with the PXRD data.
Figure 3 shows that the Si-O environment was mainly altered by the NaOH treatment of the A-PG(X) samples, as reflected by changes in the location and shape of Si-O stretching bands in the 1200–900 cm−1 range, with a disappearance of the 1100 cm−1 band and the reappearance of the 1036 cm−1 band. A slight reduction was also observed in the band at 801 cm−1. The dissolution of the amorphous silica in the samples was linked to these facts [33]. During the base treatment, carbonate anions were adsorbed on the surface of the samples, as evidenced by the broad band at 1402 cm−1 [42].
The FTIR spectra of BA-PG(X)s were similar to those of the parent PG clay, with a slight decrease in the bands at 3624 and 3460 cm−1 (see Figure 3); this indicated that the NaOH treatment produced a material with properties similar to the starting PG clay.

2.4. TGA Data

The features of the parent PG and A-PG(0.3) derivative obtained through thermogravimetric analysis (TGA) following NaOH treatment (BA-PG(0.3)) are presented in Figure 4A.
TGA makes it possible to follow the mass loss of a PG sample. The TGA features exhibited two mass step losses. The first mass loss of 20% occurred between 25 and 150 °C, related to the elimination of adsorbed and interlayer water, and was associated with two DTG peaks at 25 °C and 82 °C (Figure 4B). The second mass loss occurred in the range of 300 to 600 °C due to the removal of water from the PG sample and dehydroxylation of the clay layers, accompanied by a DTG peak at 650 °C [43]. The DTA curve indicated that the mass loss steps occurred due to an endothermic process The A-PG(0.3) sample displayed comparable traces to the parent PG, with a first mass loss step of 28% due to the dehydration of the external surface and the interlayer region. This step was associated with only one DTG peak at 80 °C and a DTA peak at 70 °C (Figure 4B). The TGA data indicated that the A-PG(0.3) sample contained a high amount of water in the interlayer, as implied by the PXRD data. A continuous mass loss occurred at higher temperatures and was related to the dehydroxylation of the clay layers. The dehydroxylation temperature of A-PG(0.3) shifted to a lower temperature with a DTG peak centered at 595 °C [36]. Once this sample was treated with NaOH solution, the TGA feature was changed and showed similar features to the starting PG (Figure 4A). The first mass loss step of 18% was recorded from 25 °C to 200 °C, associated with two DTG peaks at 55 °C and 81 °C. The dehydroxylation temperature was shifted to higher temperatures from 595 °C to 630 °C. This value was close to that obtained from the starting PG sample at 650 °C (Figure 4B). The other samples behaved similarly and confirmed that treatment with NaOH solution led to a material close to the original PG sample.

2.5. 29Si MAS NMR Data

The alteration of the Si environment was assessed by this technique during the activation process. Figure 5 left presents the 29Si MAS NMR curves of A-PG(X) samples; one of the PG samples was presented for comparison. The latter exhibited a particular montmorillonite resonance band at −93 pp and was coupled to silicon in Q3 (0Al) units, meaning that SiO4 groups were cross-linked in the tetrahedral sheets with no aluminum in the neighboring tetrahedral [44]. The shoulder band at −107 ppm was caused by some silica contaminants in the PG sample [41]. Concerning the A-PG(X)s and as the acid activation proceeds, the 29Si MAS NMR spectra exhibited different features, with a gradual enhancement of the resonance signal around −110 ppm connected to the progressive amorphous silica phase development (Figure 5 left) [41,45].
The intensity of the resonance signal at −93 ppm continued to decrease because some metals were leached from the clay layers throughout the acid activation process. The enhanced resonance signal at −103 ppm observed in A-PG(0.4) and A-PG(0.5) features was ascribed to the amorphous silica originating throughout the process [41,45] (Figure 5 left).
Additional treatment of A-PG(X)s with NaOH solution leads to considerable changes in 29Si MAS NMR features as depicted in Figure 5 right. The resonance signals in the range −100 to −110 ppm almost vanished for the BA-PG-0.3, BA-PG(0.4), and BA-PG(0.5) samples, caused by dissolution of the amorphous silica as confirmed by FTIR data. Only a resonance signal at −107 ppm was detected and close to the one that existed in the starting PG clay. Qualitatively, the intensity of the latter was enhanced as acid/clay ratios increased, and was relatively high for BA-PG (0.5). Conversely, the band’s intensity at −93 ppm was significantly greater than that of the initial A-PG(X) samples, with a minor difference in the intensity of the particular resonance bands at −93 and −107 ppm, respectively. The B-APG(X) clays’ overall spectra were comparable to the initial PG one (see Figure 5 right).

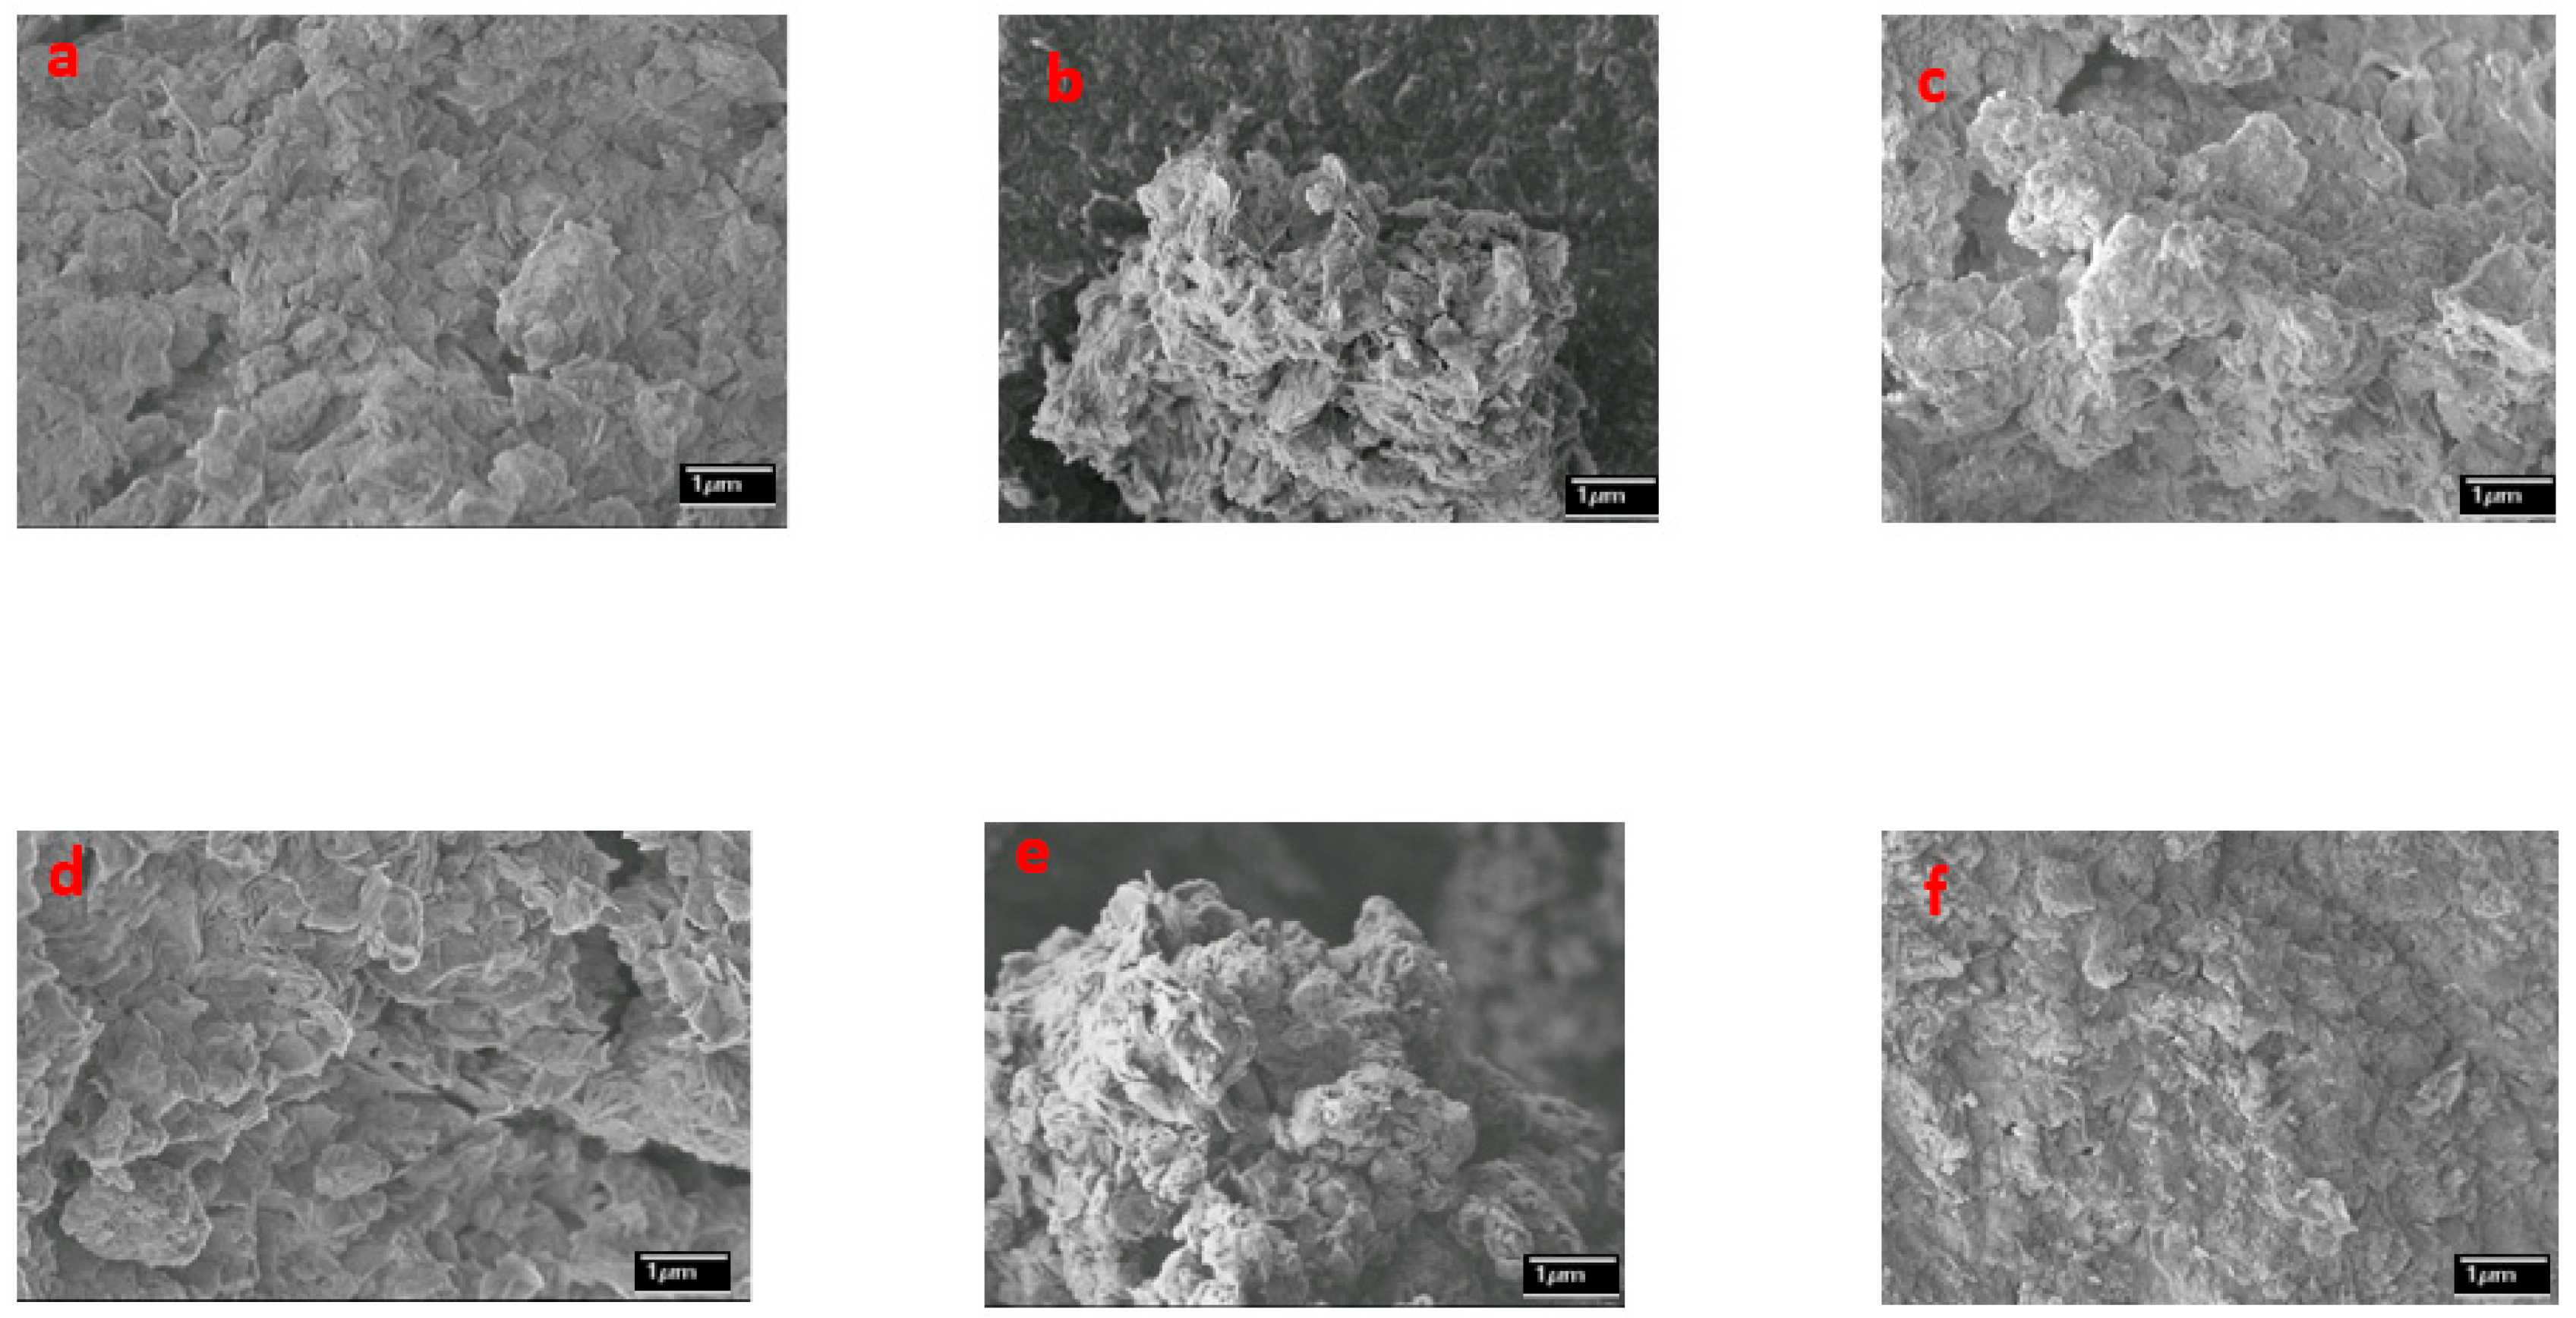
2.6. Microtextural Properties

Table 2 presents the values of the specific surface area, SBET (estimated by applying the Brunauer–Emmett–Teller method), total pore volumes, and average pore diameters of the different materials. The raw PG clay exhibited a low SBET value of 5 m2/g. However, this value continued to increase with the acid activation process and depended on the acid/clay ratio [38]. Comparable values were found for other acid-activated clays [45]. The highest value of 318 m2/g was exhibited by the A-PG(0.5) sample. The significant improvement in SBET value was ascribed to the amorphous silica generated throughout the acid activation process [36,41]. The change in the total pore volume (at P/Po = 0.95) from 0.031 cm3/g to 0.458 cm3/g was correlated with the development of pores between the particles and coincided with an increase in the average pore diameter from 26.7 nm to 67 nm, indicating the mesoporous character of the materials [36].
Additional treatment of the A-PG(X)s samples with sodium hydroxide solution resulted in a dramatic decrease in SBET values. This reduction in SBET was ascribed to the dissolution of the amorphous silica in the A-PG(X) samples. An average value of 11 m2/g was obtained, and it was close to that of the starting PG clay. The total pore volumes and average pore diameters were also altered. The reorganization of the clay particles and the dissolution of the amorphous silica phase resulted in a decrease in these values towards those of PG. When raw montmorillonite clay was hydrothermally treated at 150 °C in NaOH or KOH solutions, an enhancement in SBET value was observed, corresponding to surface roughness and generation of cracks due to the effect of the chemicals used on clay dispersibility and dissolution [38].
The agglomeration of the starting clay particles occurred during the acid activation with an increase in their sizes as represented in SEM micrographs. The morphology of the particles changed following the NaOH activation, and the aggregates were dispersed with less void between the particles (Figure 6).

3. Basic Blue-41 Removal Experiments

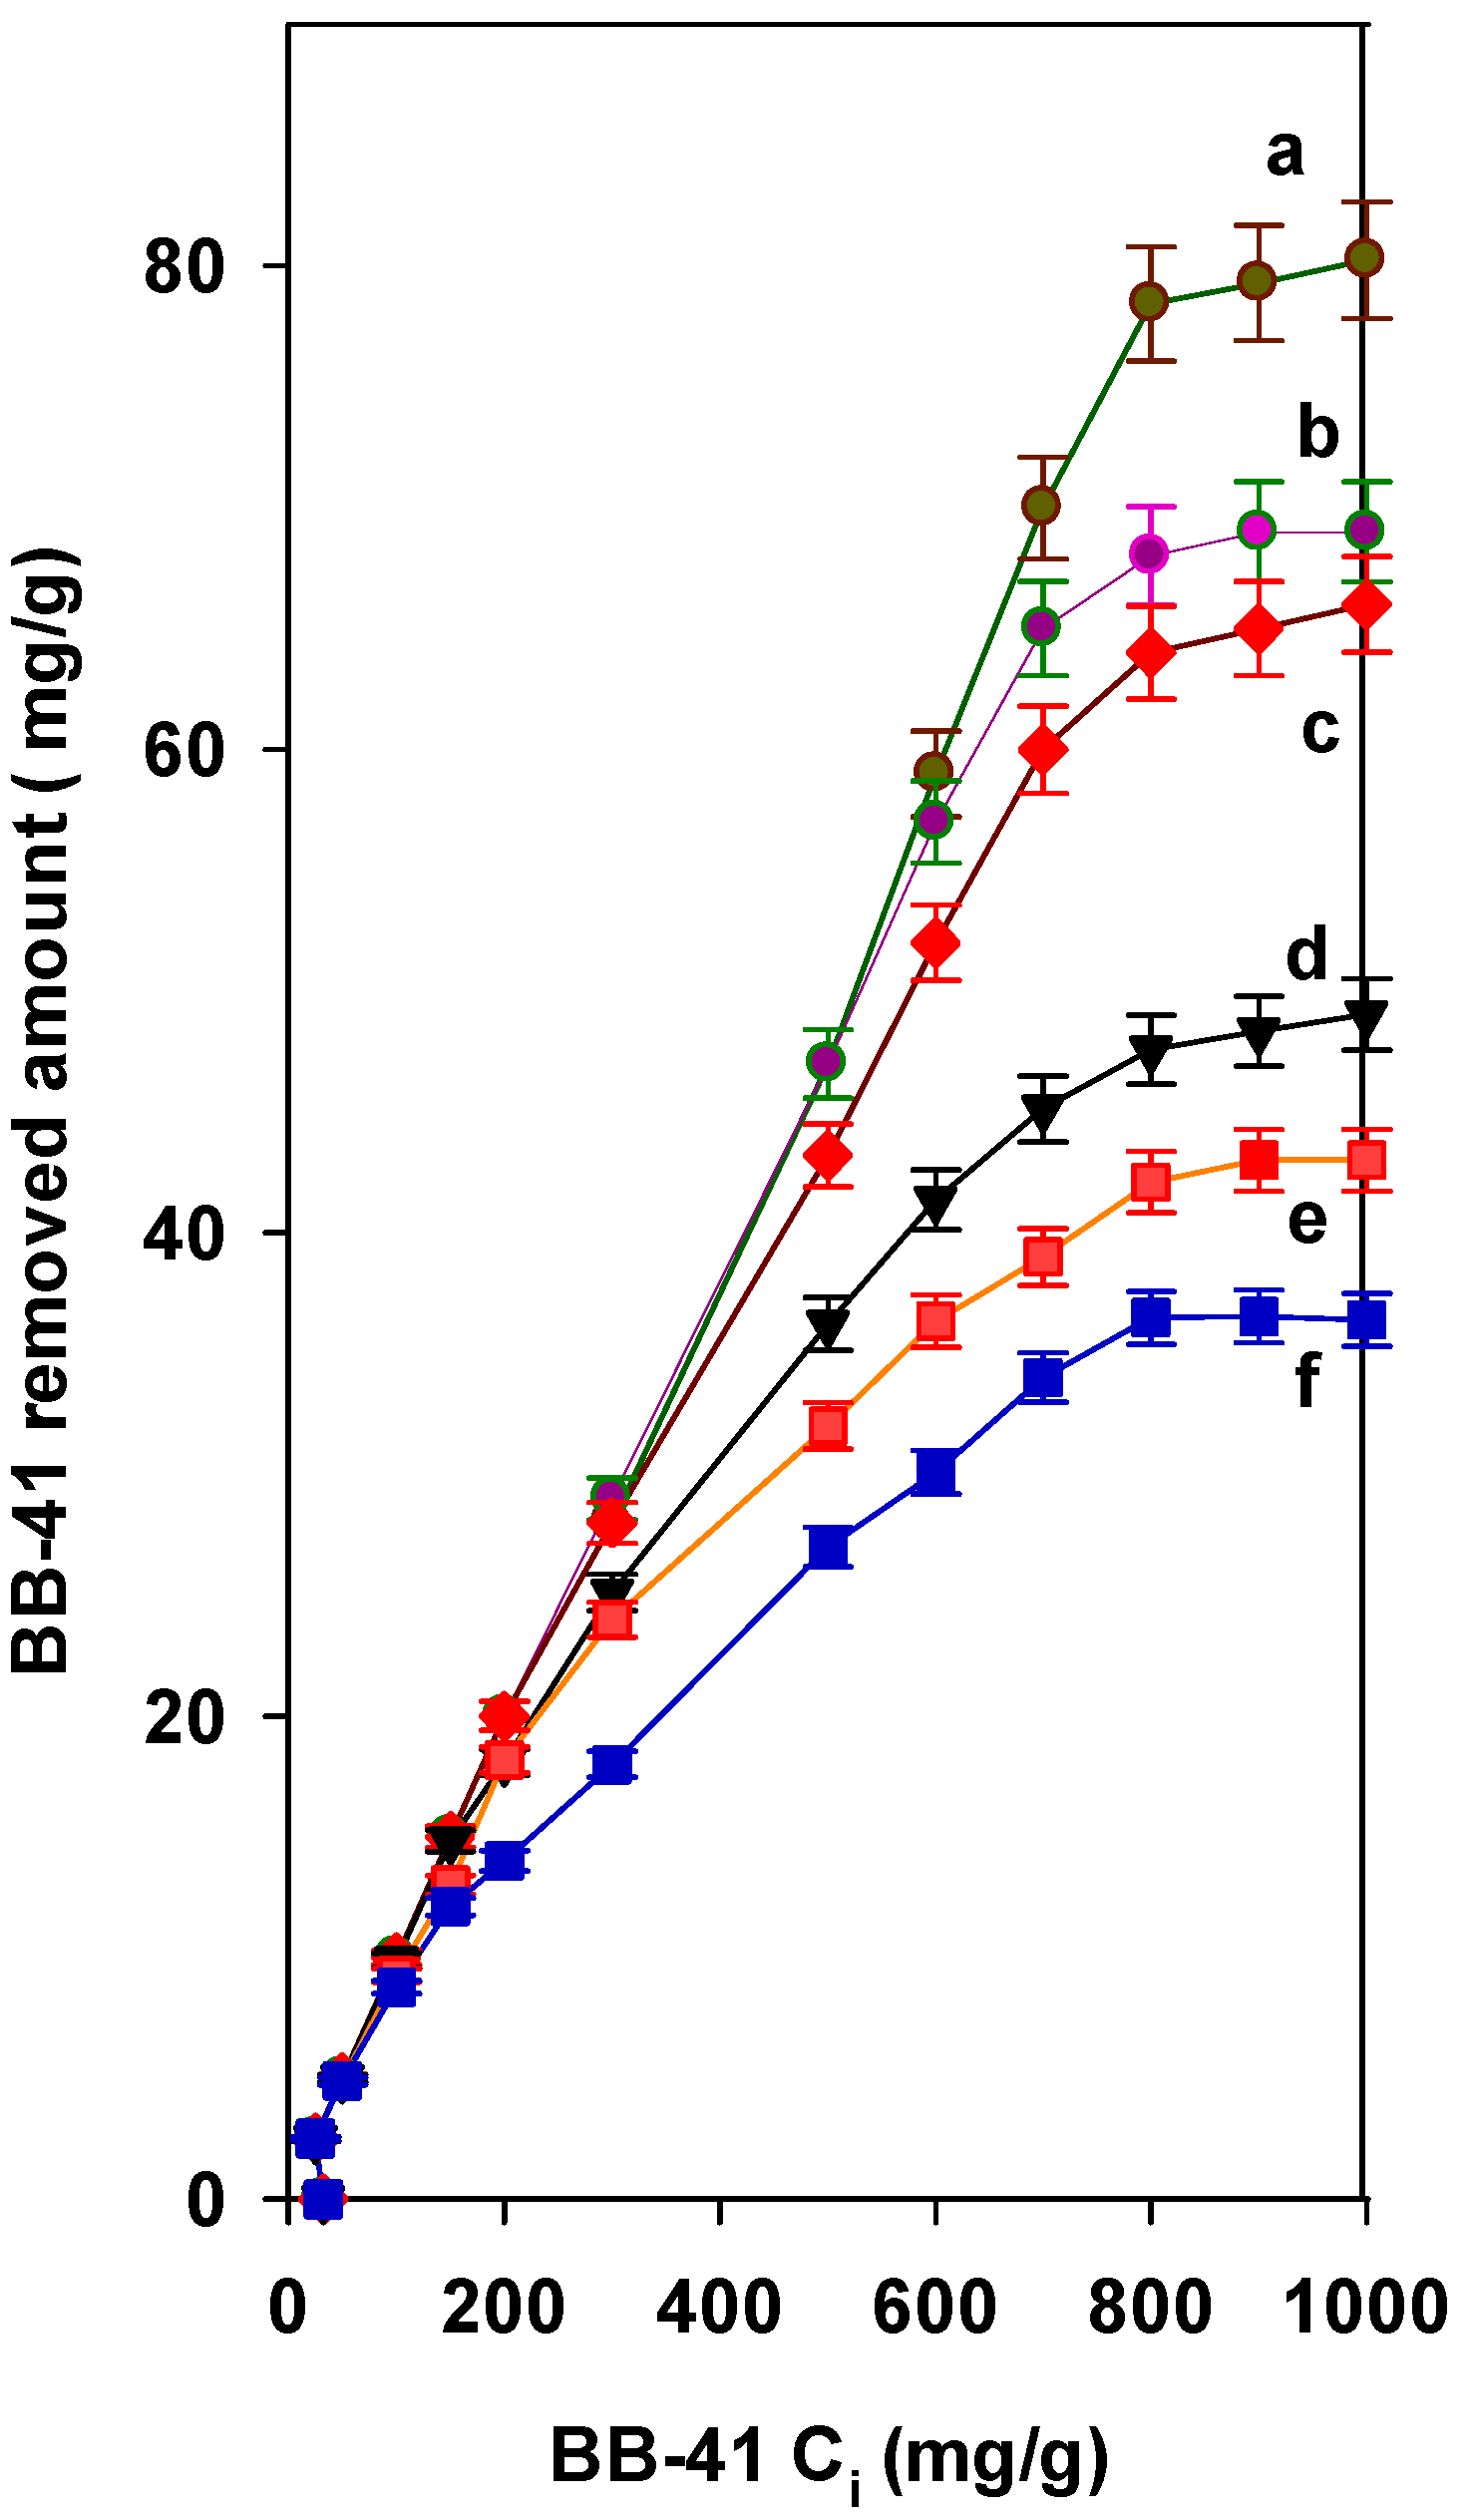
3.1. Effect of Initial Concentration

Figure 7 illustrates the impact of the initial concentrations on the BB-41 removal by A-PG(0.2) and B-APG(0.2) samples. As BB-41 Ci values rose, so did the amount of BB-41 that was removed. This trend was reported for different materials [46,47,48] and was associated with the driving forces that occurred during the BB-41 removal. At lower Ci values below 200 mg/L, the two examined materials exhibited 100% of removal efficiency; meanwhile, at higher Ci values, this percentage efficiency was kept lowering. A-PG(0.2) sample has lower values for the removal efficiency and capacity compared to parent PG.
At lower initial concentrations, more removal sites were available compared to the number of dye molecules in the solution, and at higher Ci values, the number of removal sites was unchanged and not enough to remove all the dye molecules, leading to a decrease in removal efficiency (in %).
Interestingly, the treatment of A-PG(0.2) with a base solution (BA-PG(0.2)) has enhanced the removal efficiency (in %) and the removed amounts (in mg/g), it reached 100% in the range of Ci from 25 to 1000 mg/L, and the removed amount was 80 mg/g using Ci values higher than 1000 mg/L.

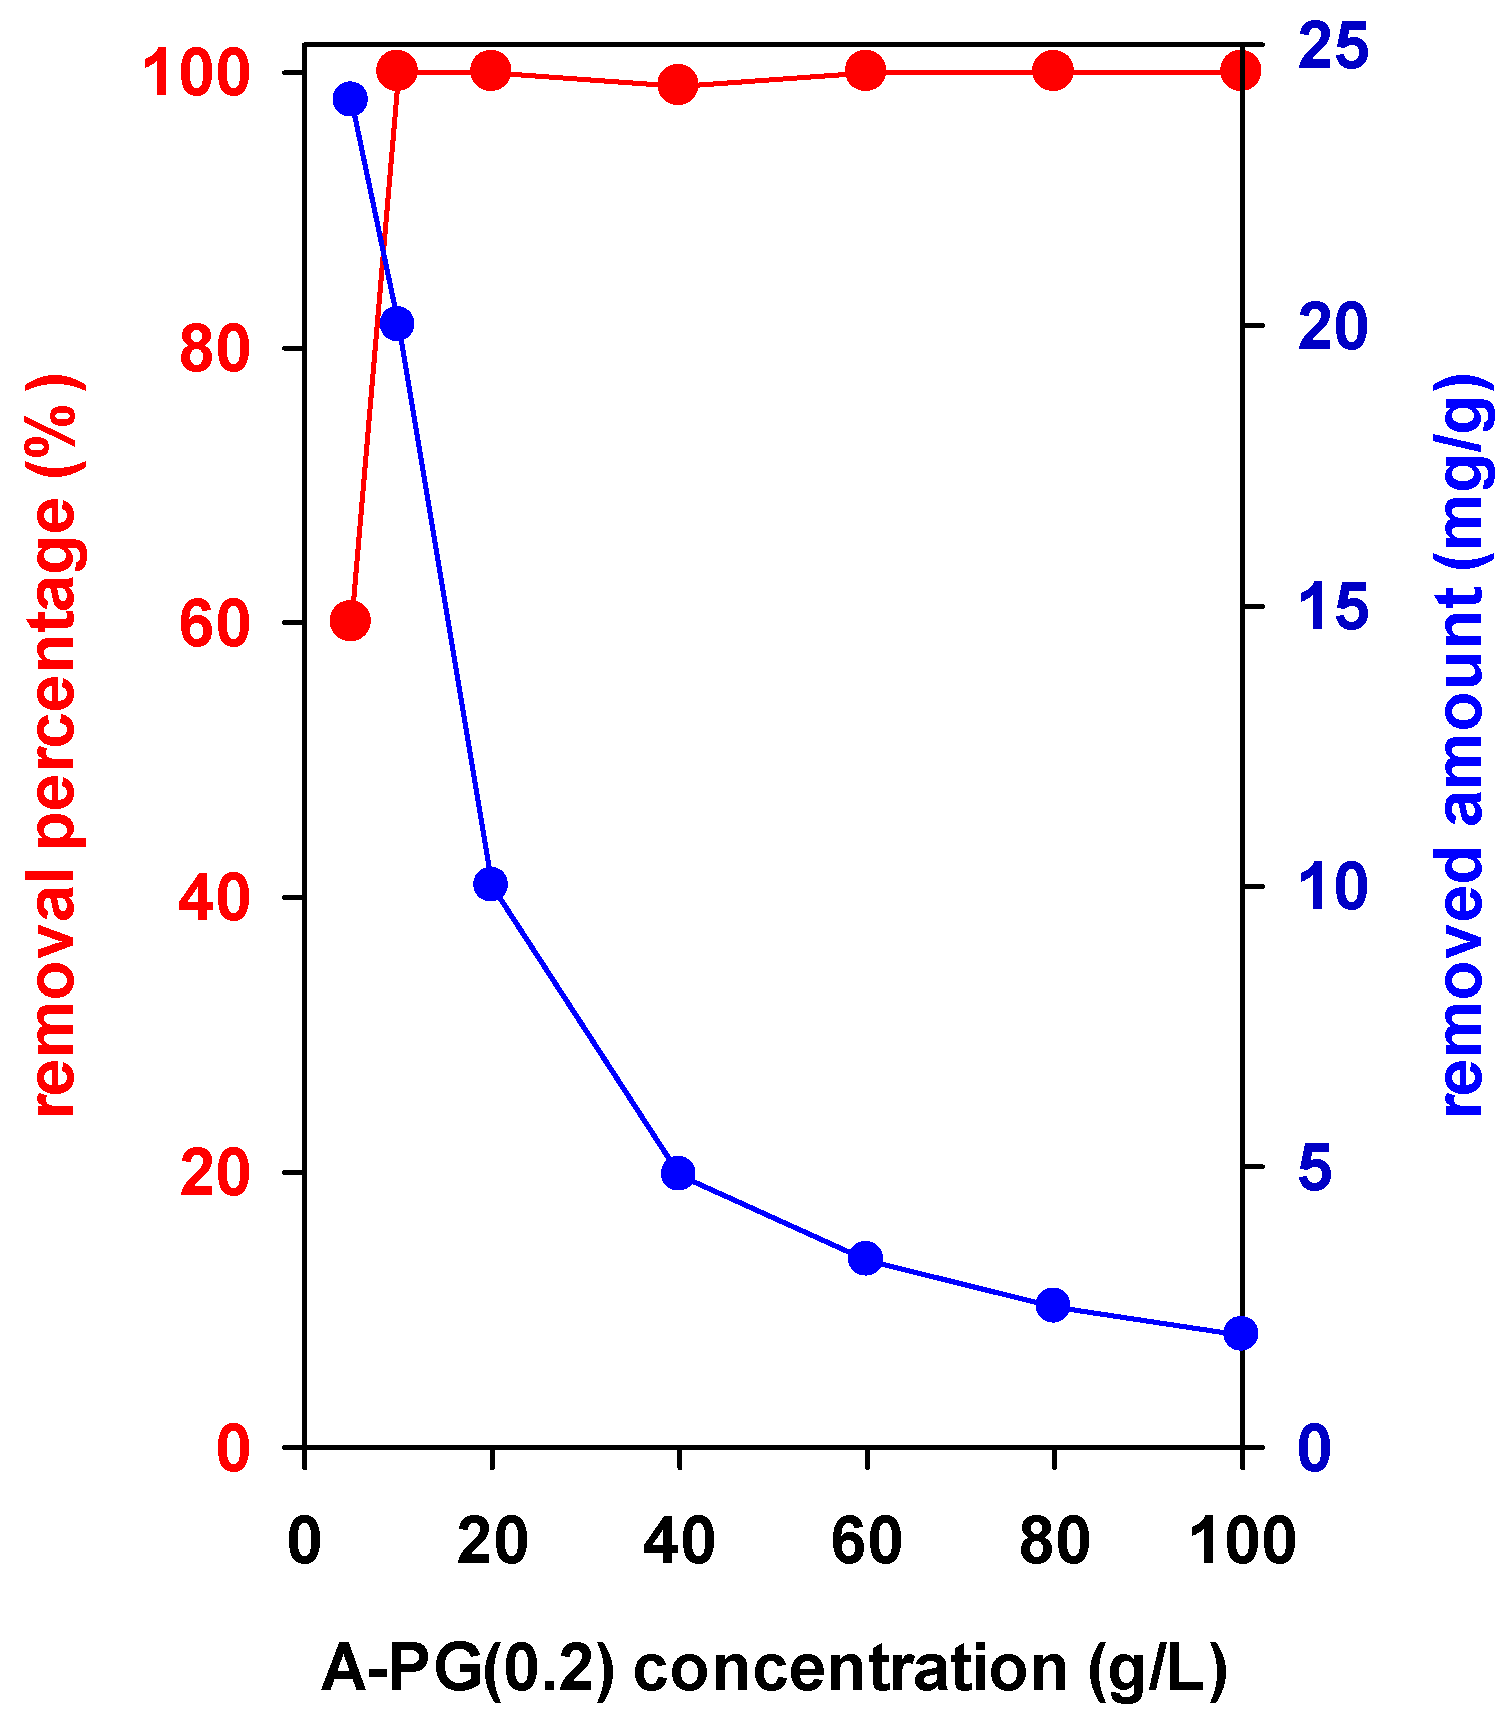
3.2. Effect of Used Masses

In this part, the volume and the initial concentration values were fixed to 10 mL and 200 mg/L, respectively, while the added masses of A-PG(0.2) and BA-PG(0.2) were varied from 0.05 g to 1 g of sample.
The removal percentage was improved when more A-PG(0.2) was added to the BB-41 solution; it varied from 60% for a solid concentration of 5 g/L to 100% for a solution of 10 g/L. This value was unchanged for higher solid concentrations (Figure 8 red line). The BA-PG(0.2) sample exhibited different behavior, and the maximum removal percentage of 100% was attained using a 5 g/L solution. The indicated difference in behavior between the two samples could be related to the number of available removal sites in the samples. Indeed, acid activation reduced the cation exchange capacity of the starting clay, and thus the removal sites, which was not the case for the base treatment. Since the number of BB-41 molecules was fixed, increasing the mass added induced an increase in the number of removal sites to a certain extent, and thus enhanced the removal percentage. However, the removal capacity (in terms of mg/g) decreased when increasing the used mass of both samples (Figure 8 blue line) [46,47,48,49].

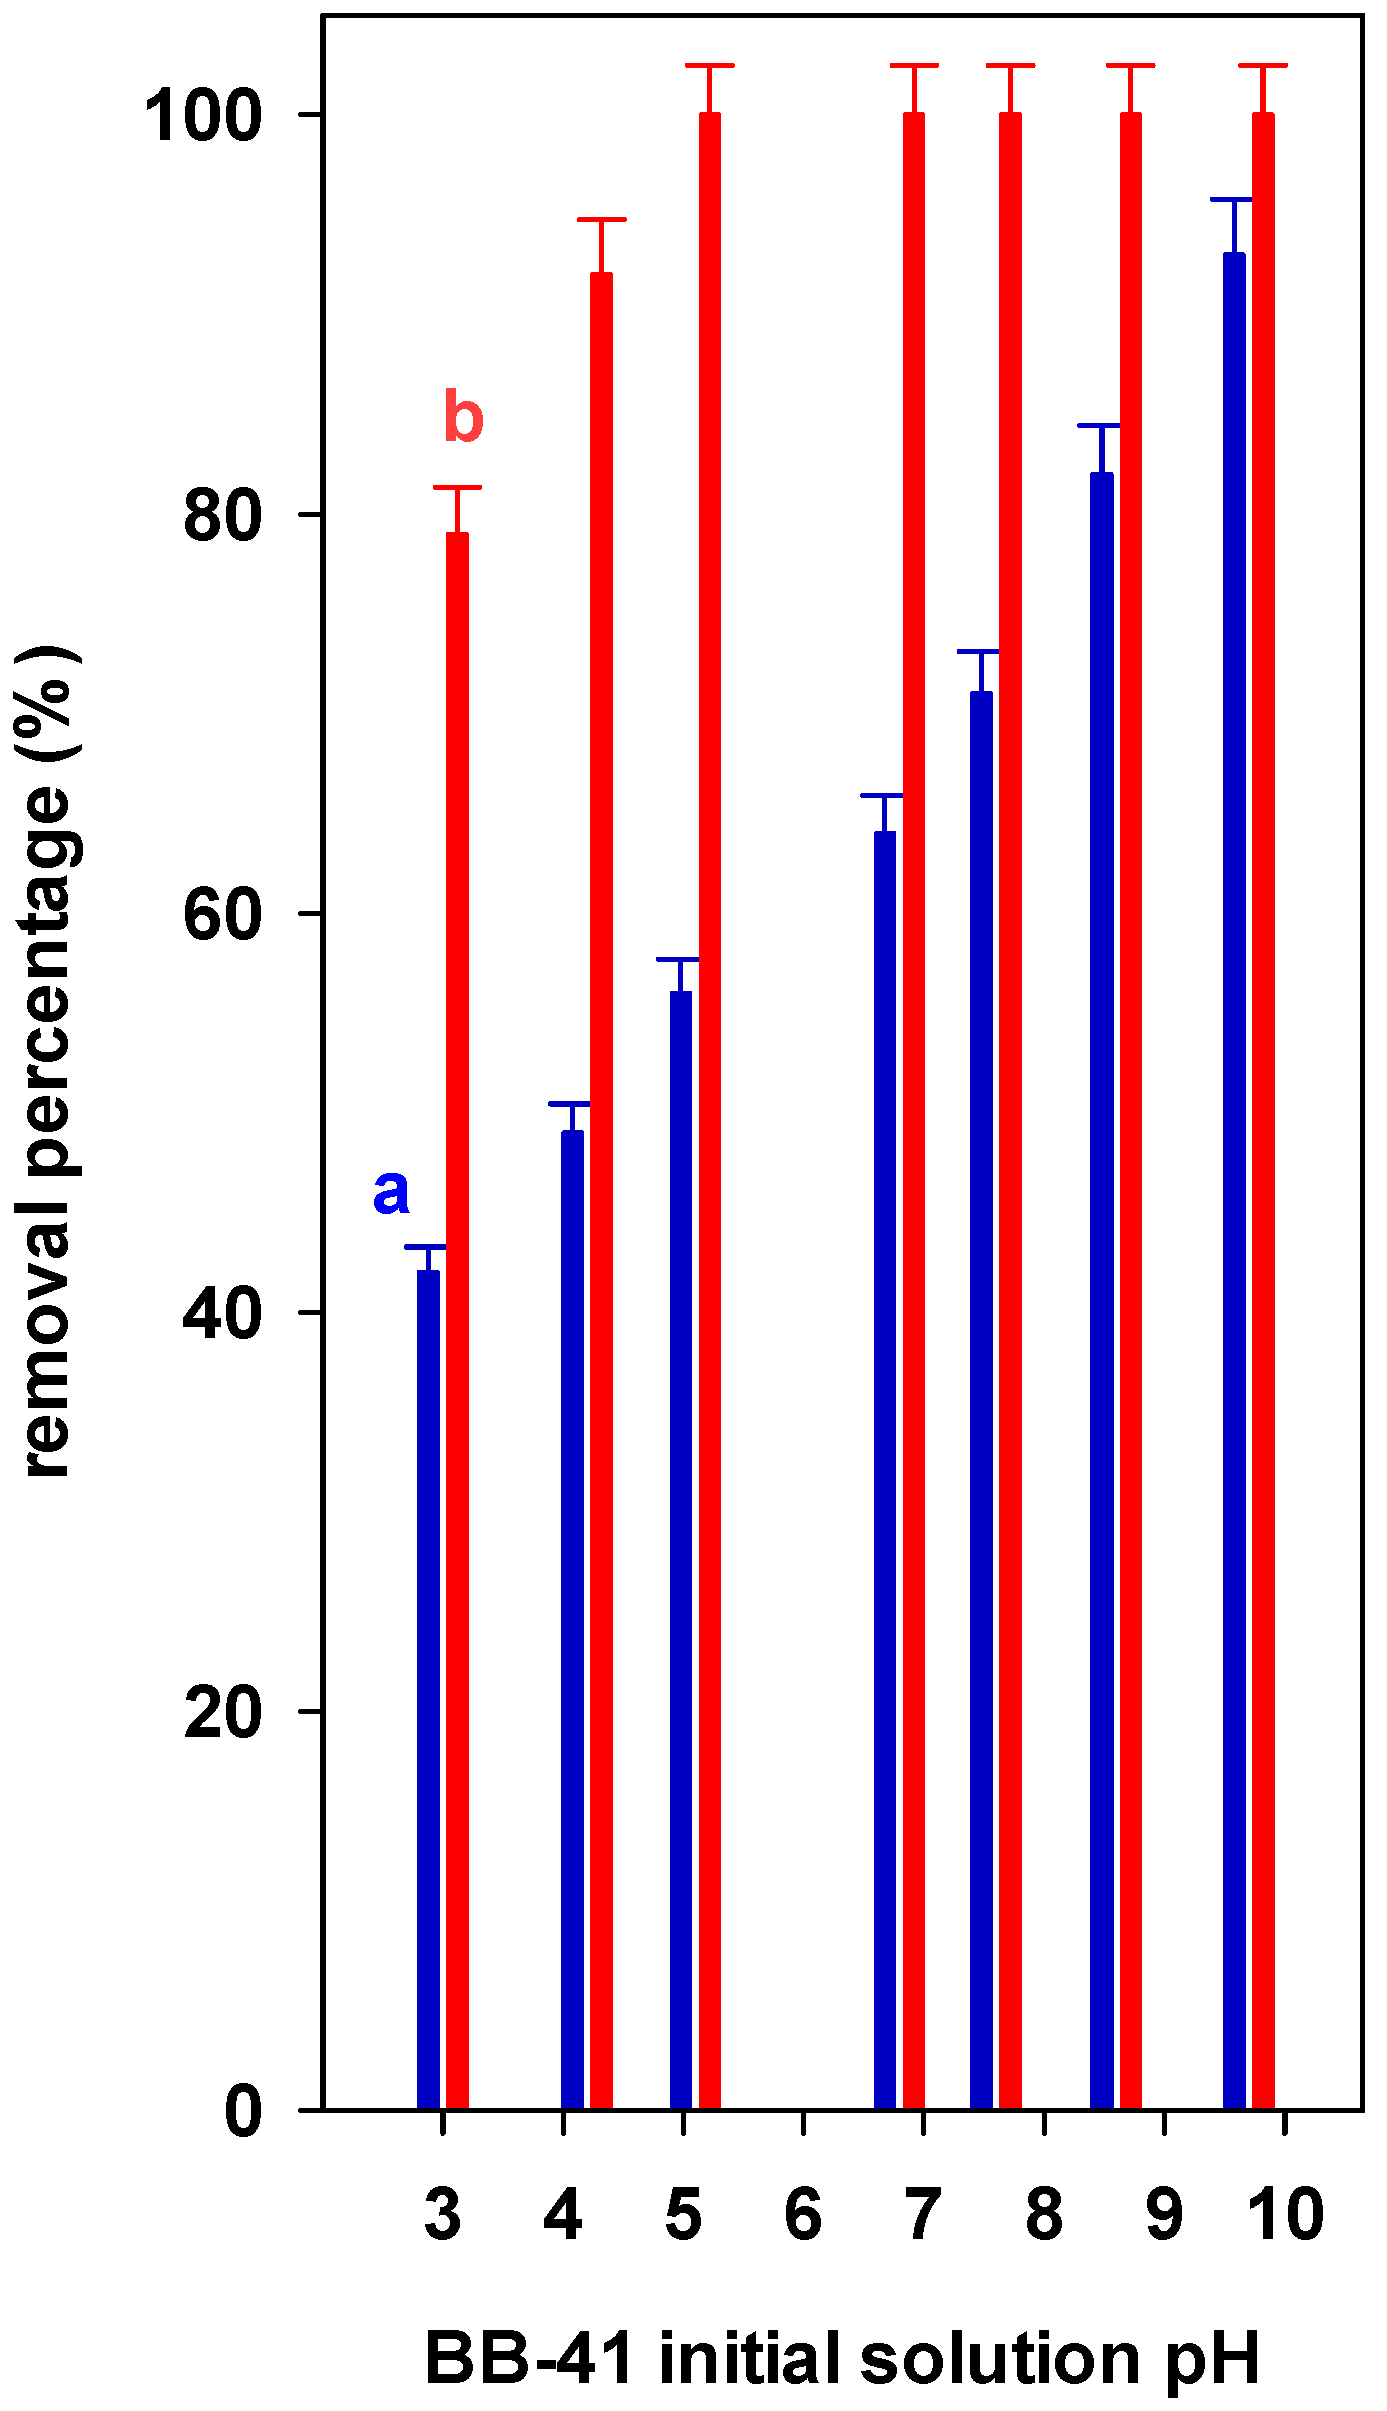
3.3. Effect of Environmental Factor: Effect of Initial pH

Figure 9 presents the impact of initial pH on the percentage of dye removed by the two tested samples (A-PG(0.2) and BA-PG(0.2)). It demonstrates that the BB-41 removal percentage initially increased significantly as the pH increased for both samples and then stabilized, and subsequently, no change occurred for the BA-PG(0.2) sample.
In the case of A-PG(0.2) and due to the acidic nature of the sample, the highest removal percentage of 100% was achieved at the higher pH value of 8. Meanwhile, the BA-PG(0.2) sample exhibited a removal percentage of 100% at lower initial pH values higher than 4.6. The treatment of acid-activated clay (A-PG(0.2)) changed the charge of the solid surface from positive to negative and affected the electrostatic attraction between the surface and the dye cations. The BB-41 removal amount was close to 20 mg/g across the pH range of 4–10. This suggests that the samples exhibited stable removal performance over a broad pH range. However, a precipitation of BB-41 dye occurred at pH > 10, and no further study was conducted.
Generally, the pH values affected the charge of the dyes and the surface of the adsorbents. The charge of adsorbent solid depends on the point zero charge’s pH [50]. The pHpzc of the PG sample exhibited a value of 7. The nature and origin of the clay minerals affected this value; it ranged from 3.4 to 8 [49,51,52,53]. This value decreased after acid activation, and depended on the length of the process; the pHpzc values dropped in the range of 2 to 3.5, confirming the acidic nature of A-PG(X)s. Comparable values have been reported for other acid-activated clays [54]. Significant changes occurred upon NaOH treatment, and the pHpzc values increased from 8 to 9; this indicated the basic character of the BA-PG(X) samples, and resulted in an increase in the hydroxyl groups on the surface of the treated samples. When the pH of the solution was lower than pHpzc, the surface acquired a positive charge that competed with the charge of the BB-41 molecules; in addition, as the pH was lowered, the protons competed and hindered the number of removal sites in the solid with the BB-41 cations. As the pH increased with values higher than pHpzc, the surface of the samples became more negatively charged, leading to greater BB-41 removal. This was clearly observed using the acid-activated sample (A-PG(0.2)).
However, in the case of BA-PG(0.2), the pH of a pure water and clay suspension was too high, about 9 to 10. After adding the sample to the BB-41 solution, the pH of the mixture increased and reached a value above 8, thus favoring the removal of BB-41 dye molecules.

3.4. Effect of Acid and Base Activation

Figure 10 presents the impact of the extent of acid activation on the removal efficiency of the samples. Acid activation did not have an effect at lower initial concentrations, and all the dye molecules were removed from the contaminated solutions with a removal percentage of 100%. However, at Ci values greater than 200 mg/L, the amounts removed depended on the acid activation extent; generally, there was a decline in efficiency, with the lowest value obtained for the A-PG(0.5) sample of 40 mg/g. The general trend was A-PG(0.5) < A-PG(0.4) < A-PG(0.3) <A-PG(0.2) < A-PG(0.1). As the acid/clay ratio increased, the leaching of Al and Mg cations improved, resulting in a reduction in the CEC and an increase in the specific surface areas (see Table 1 and Table 2); however, it seemed that the SBET factor was not crucial to the removal properties of these materials. This performance could be associated with the reduction in the cation exchange capacity of the samples [55]. In addition, the surface became more positively charged, reducing the electrostatic attraction between the surface and the positively charged dye entities.
The additional treatment with NaOH solution significantly enhanced the amount of BB-41 removed, even for the raw PG clay, where the amounts removed exceeded 100 mg/g. The NaOH-treated samples exhibited lower surface areas compared to the acid-activated samples; however, they presented a higher removal capacity, confirming that the surface area values were not the major factor in the removal process in this case [25]. Other factors could be involved, such as the base character of the treated samples associated with the increase in hydroxyl groups on the surfaces that promoted effective attraction between the negative charge and the positively charged dye cations. The regeneration of the cation exchange capacity during NaOH treatment could also promote higher removal amounts, as reported in previous studies for carbon materials [56,57].

3.5. Estimation of Maximum Removal Capacity

Adsorption isotherm experiments were carried out using the optimized experimental variables to estimate the maximum removal capacity (qmax) of BB-41 using the acid and base PG clay minerals. The Langmuir and Freundlich models were tested for the equilibrium data. Linear and nonlinear equations could be used in this case, and the linear model was used the most for comparison purposes (Equations (S3) and (S4)) [58].
Table 3 and Table 4 summarize the correlation coefficients and adsorption constants of both isotherms. Based on the correlation coefficient (R2) values, it can be concluded that the experimental data fitted well to the Langmuir isotherm (R2 higher than 0.999) (Figure S2). This suggested the monolayer adsorption of BB-41 dye onto the surface of the tested samples. The PG clay mineral exhibited a removal capacity qmax of 81 mg/g. This value decreased upon acid activation and reached a value of 37 mg/g for A-PG(0.5). This decrease could be related to the reduction in the CEC values of the raw PG material and the loss of some removal sites as the acid/clay ratio increased. The general decrease in KL values for the acid-activated clays indicated the low affinity of these materials to BB-41 dye molecules.
However, following the base treatment of the PG clay mineral, the qmax value was enhanced by up to 50%, and reached a value of 108 mg/g. A similar trend was observed for BA-PG(X)s, and an evident increase was noted with values in the range of 80 to 100 mg/g, with an increase of 40 to 100%. The KL parameters were higher compared to those of the A-PG(X) samples, and reflected the high affinity of the BB-41 dye molecules to the treated surfaces.
The values of 1/n of the Freundlich model were lower than 1 for all of the tested samples, indicating a favorable removal process with a multilayer adsorption mechanism associated with non-uniform distribution of affinities and heat over the heterogeneous surfaces. The positive slopes related to these linear plots indicated an improvement in the removal efficiency with the increase in the initial concentration of BB-41.
The remarkable increase in qmax was related to the increase in the pH of BA-PG(X) solids. Once they were added to the dye solution, they rendered the final environmental pH basic, thus enhancing the removal capacity. On the other hand, the treatment of clay minerals with the base solution enhanced the CEC values and partially contributed to the higher qmax values.
Although the BA-PG(X) samples possessed lower SBET values in the range of 5 to 10 m2/g, they revealed high removal properties in comparison to the A-PG(X) samples, with 20- to 50-fold higher SBET values. In this instance, the obtained results showed that the specific surface area was not a significant factor in the removal process [55].
While there are other materials that can be used for the removal of BB-41 dye, Table 5 reports the qmax values of some restricted aluminosilicate materials. NaOH-treated samples exhibited reasonable qmax values, and they represent potential candidates for the removal of BB-41 dye.

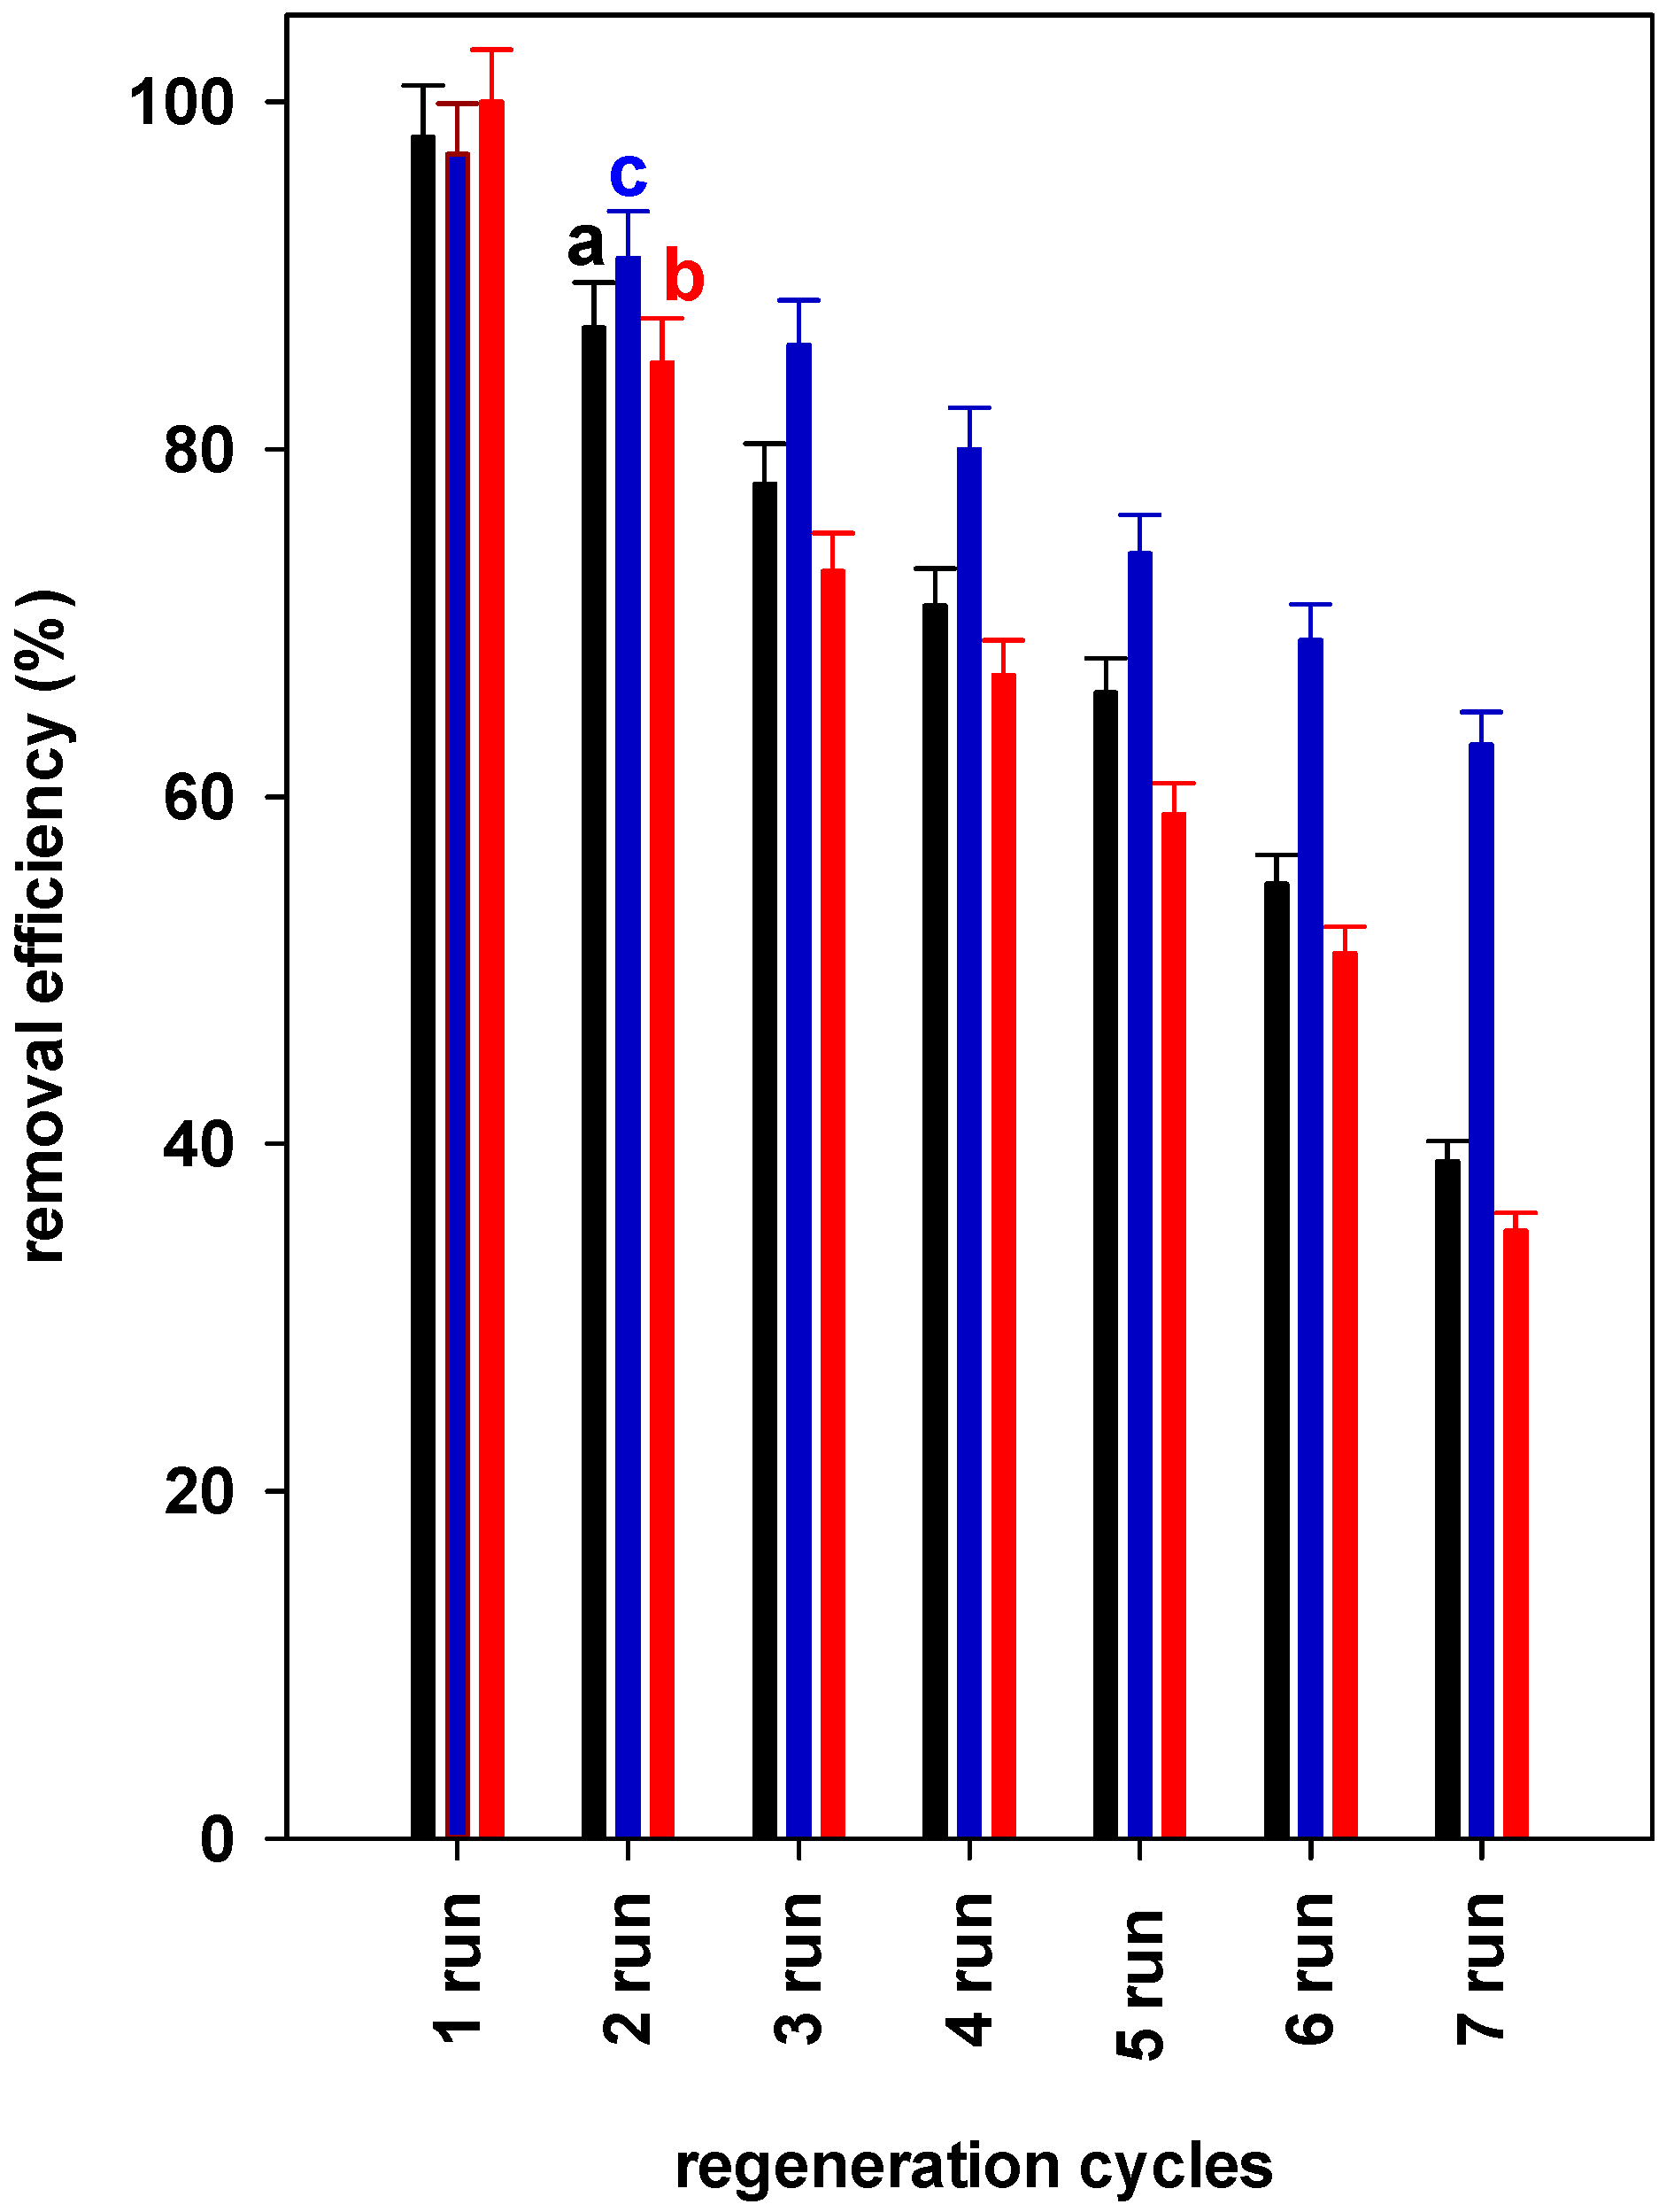
3.6. Regeneration Tests

The factor representing cost-effectiveness in the treatment process is reusability, i.e., regeneration. In this context, the used samples can be recycled and reused, protecting the environment from further pollution and saving costs. Different processes have been reported and reviewed in the literature [65,66,67]. The proposed method consisted of treating a spent adsorbent with a solution of cobalt nitrate and oxone for seven cycles. This method showed its efficiency and simplicity without the generation of additional waste [21].
Three selected samples (PG, A-PG(0.2), and BA-PG(0.2)) were investigated, and the outcomes are illustrated in Figure 11. For the PG sample, the original removal percentage of 98% was maintained for three cycles with a slight decrease of 20%. This value declined to 40% after seven consecutive regeneration tests, and the sample exhibited a rate of 40%. However, the tests indicated that the removal percentage of 97% was reduced to 80% after four tests for the A-PG(0.2) sample. This value continued to drop to a lesser extent to 63%. The BA-PG(2.0) sample, with an initial removal efficiency of 100% retained its efficacy of 73% after three tests. Following seven tests, the sample was still effective, and a percentage of 35% was obtained.
The difference between the three samples could be associated with the easy access of the removed BB-41 molecules and their destruction by the sulfate radical originating from oxone, which made the removal sites available for the next test [64]. In some cases, the less available sites were present due to the difficulty of destroying the BB-41 on the solid surface.
The PXRD data indicated that the investigated samples were stable after seven tests, and the patterns exhibited were similar to the original ones, with a slight decrease in intensity.

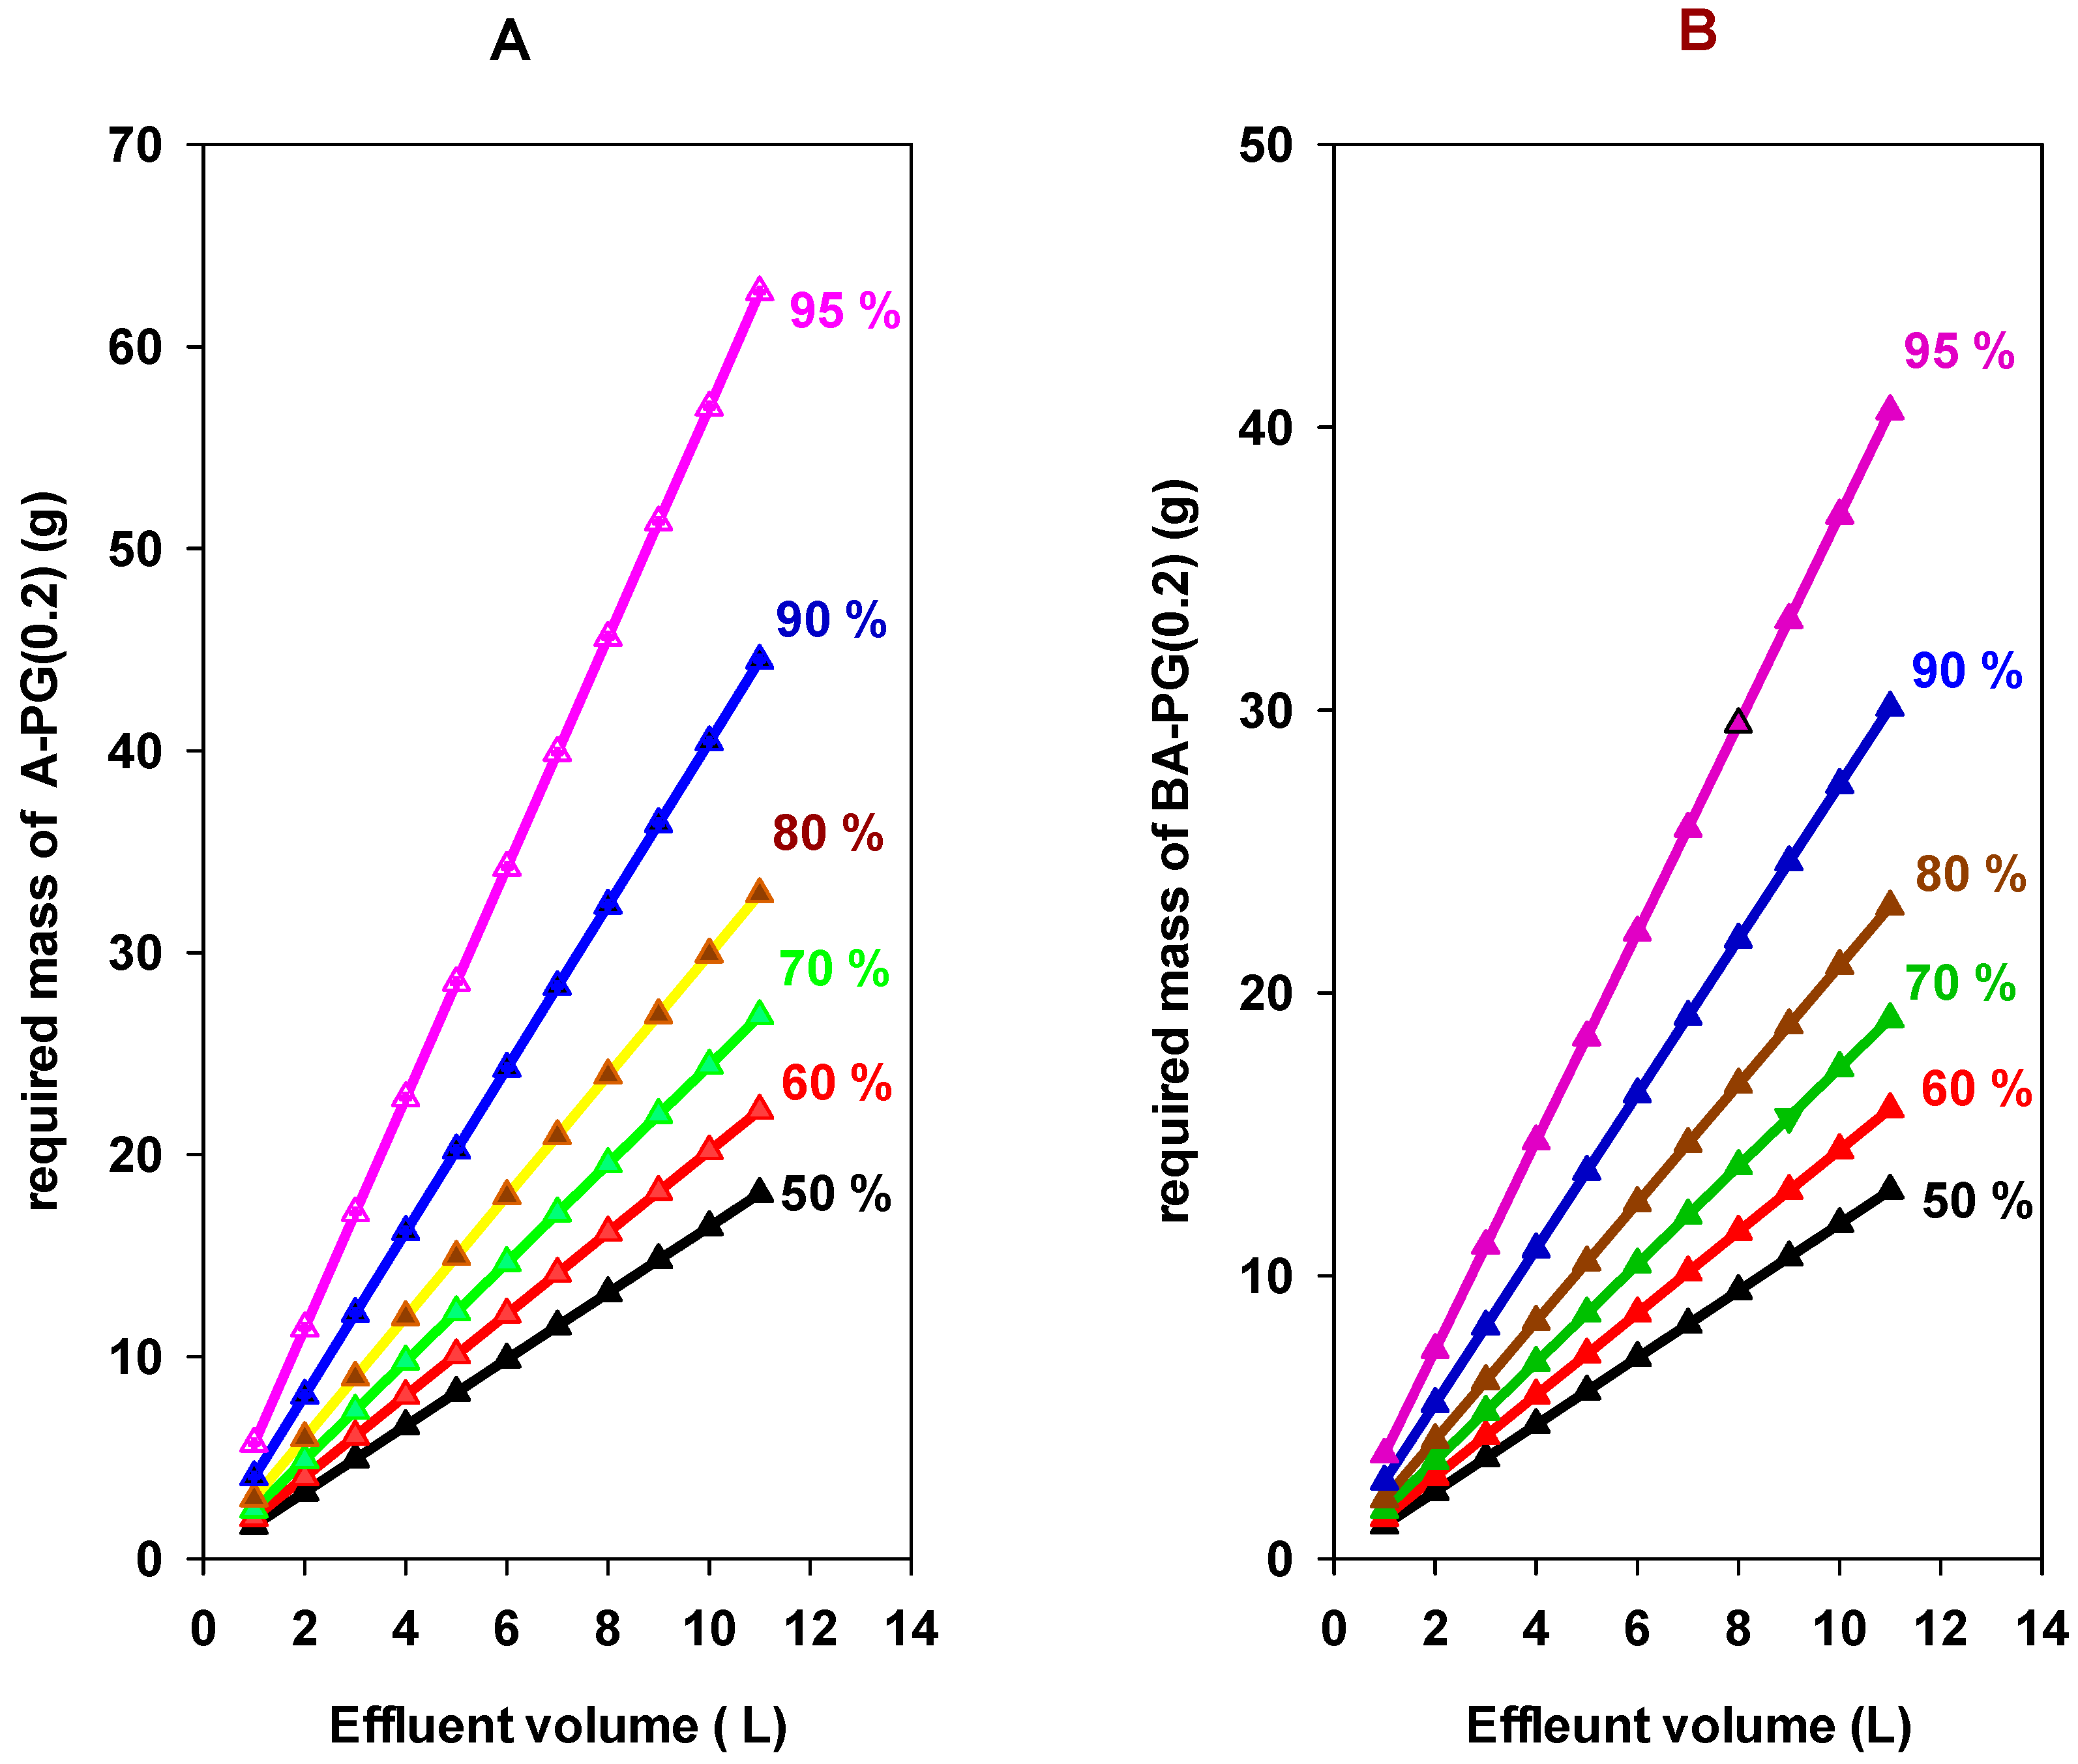
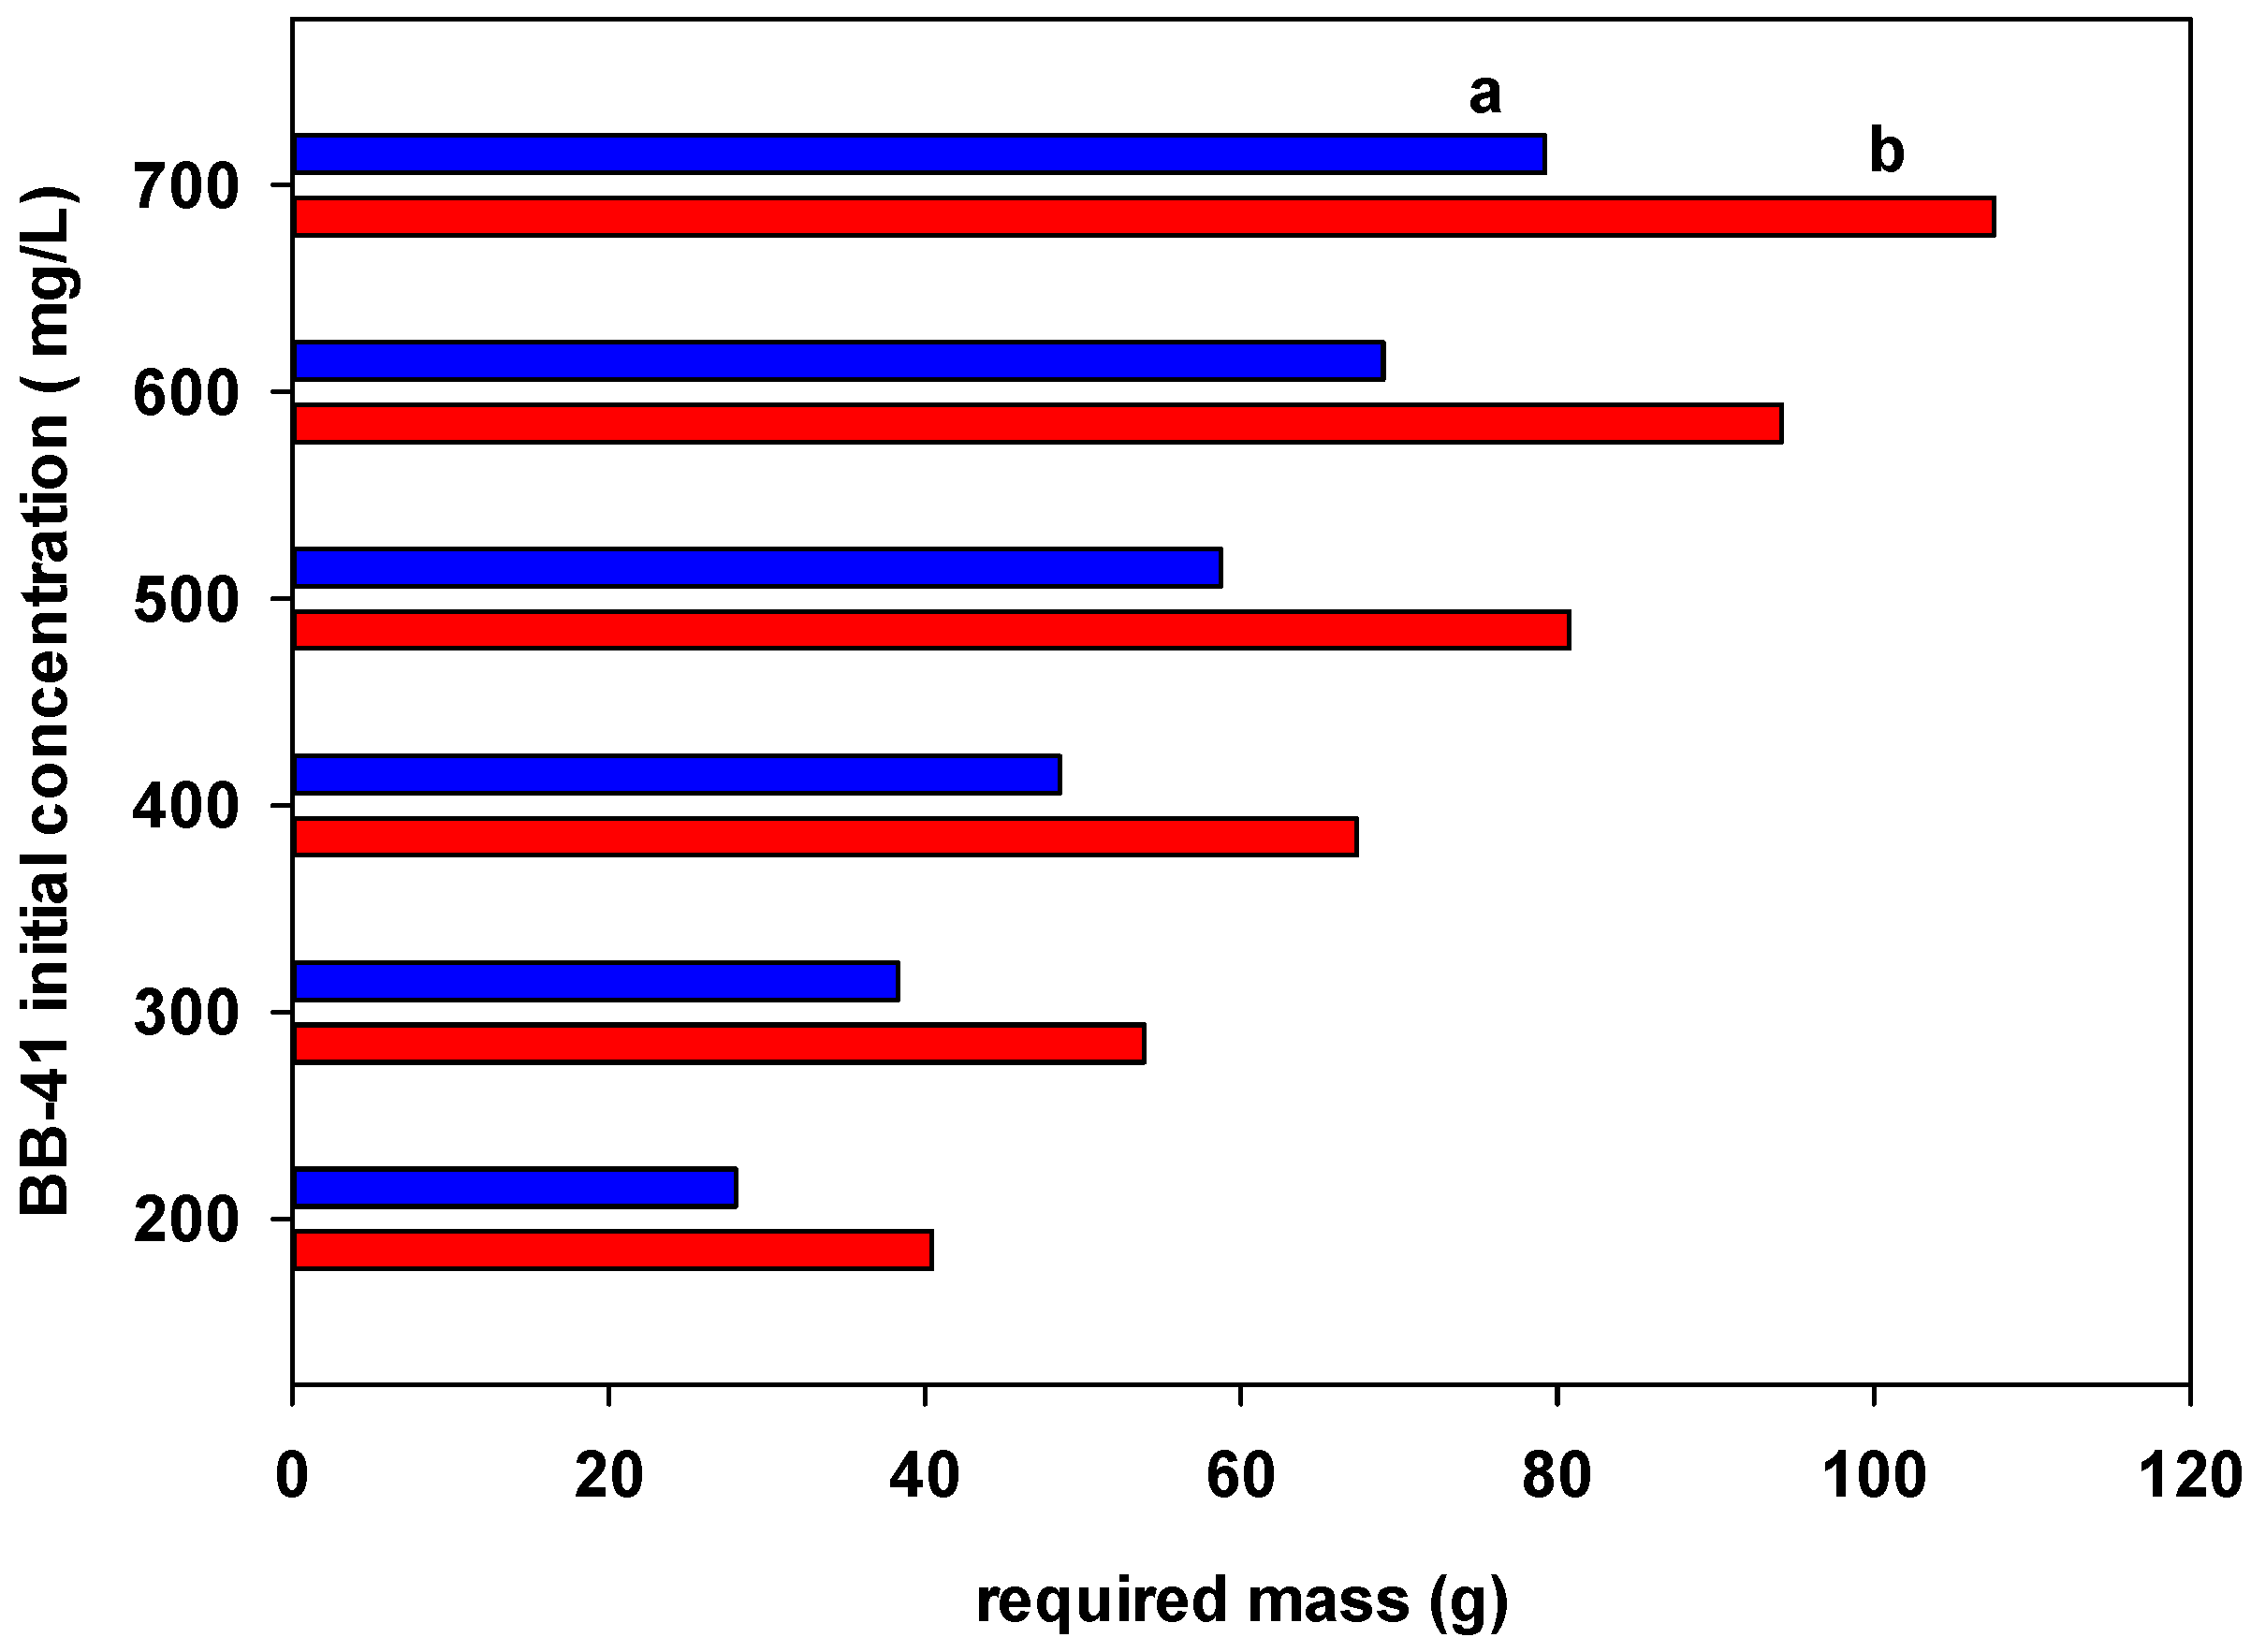
3.7. Single Batch Design Process

Reducing the operating expenses of the waste treatment requires the design of a large-scale batch adsorber [68]. The design was based on the isotherm equilibrium parameters and enables the approximation of the minimum mass required to remove a given amount of pollutant from a given volume of polluted wastewater (or the maximum volume of wastewater removed with a fixed mass of adsorbent) [69]. Equation (1) is based on the mass balance equation for handling a volume V (L) and achieving the appropriate removal capabilities (qe, mg/g) using the necessary mass M (g).
V(Co − Ce) = M (qe − qo)
Rearrangement of Equation (1) gives
(qe − qo) = −V/M (Ce − Co)
Equation (2) indicates that the system follows a removal pathway or an operational straight line with a slope of −V/M [70,71]. Starting from an initial point (C = Co, qo = 0) on the isotherm, the equilibrium point (C = Ce, q = qe) is reached as indicated by the intersection of the operational line with the adsorption isotherm (Figure 12). Two important benefits of Equation (2) are that V/M can be calculated for a desired process, and (Ce, qe) at desired V/M can be determined from the adsorption isotherm plot, as shown in Figure 12.
Equation (2) is rearranged by the substitution of the expression qe from the Langmuir isotherm equation, which leads to Equation (3):
m V = C o C e q e = C o C e q m K L C e 1 + K L C e
Equation (3) allows the calculation of the M/V ratio for a given change in solution concentrations Co to Ce and thus the necessary mass (M) to treat different volumes (V) of effluents. For example, starting with an initial concentration (Ci) of 200 mg/L and aiming to achieve a series of removal concentrations between 10 mg/L and 100 mg/L, the optimal adsorbent masses can be estimated for different effluent volumes in the range of 1 to 11 L, with 1 L increments.
A series of plots resulting from Equation (3) are displayed in Figure 13A,B. The ideal masses of A-PG(0.2) increased as the volume of the dye solution and/or the removal percentage rose. For example, the necessary masses of A-PG(0.2) to treat 10 L of 200 mg/L are 16.4, 20.2, 24.4, 29.9, 40.4, and 57.0 g for 50%, 60%, 70%, 80%, 90%, and 95%, respectively (Figure 13A). Using BA-PG(0.2), which has a higher maximum removal capacity, the required masses were reduced for the same treated volumes of effluents and removal percentages (Figure 13B). For example, to achieve 50%, 60%, 70%, 80%, 90%, and 95% BB-41 removal percentages, the necessary masses are 11.8, 14.5, 17.4, 20.9, 27.4, and 36.9 g. These masses continued decreasing to 9.7, 11.8, 14.0, 16.6, 20.7, and 26.1 g using BPG. The differences in the estimated masses were affected by the qmax values of the investigated materials; comparable trends were described for similar PCH materials doped with Zr species or porous acid-activated heterostructures [59,71].
When treating 10 L of effluent for a fixed removal percentage of 90%, the calculations indicated that the A-PG(0.2) masses of 40.4 g, 53.9 g, 67.3 g, 80.8 g, 94.2 g, and 107.6 g were needed for initial concentrations of 200 mg/L, 300 mg/L, 400 mg/L, 500 mg/L, 600 mg/L, and 700 mg/L, respectively (Figure 14). For the same process and using the BA-PG(0.2) sample, which has a higher removal capacity compared to A-PG(0.2), the amounts of the sample were reduced to an average of 28%, as expected (Figure 13). This indicated that the batch design process was closely affected by the maximum removal capacity (qmax) of the samples used during the treatment [71].

4. Experimental

4.1. Materials

Montmorillonite clay was supplied by Nanocor Inc (Arlington Heights, IL, USA). under the brand name “polymer grade” (PG). The clay mineral exhibited a cation exchange capacity (CEC) of 1.42 meq g−1. Analytical-grade sulfuric acid and sodium hydroxide were purchased from Aldrich. Oxone, cobalt nitrate, and basic blue-41 (BB-41) dye were supplied by Alfa Chemicals (Binfield, Berkshire, U.K.).

4.2. Acid Activation Process

The standard process was adopted in all the preparations. A specific mass of PG clay was treated with a defined volume (20 mL) of sulfuric acid solution at 90 °C overnight. The ratio of acid to clay (in weight) was adjusted between 0.1 and 0.5, using the dried mass of sulfuric acid and PG to compute the ratio [28]. The resulting acid-activated products were filtered out, thoroughly rinsed with distilled water until the pH was neutral, and the BaCl2 solution confirmed the presence of free sulfate ions, and then left to dry at room temperature. The solid is designated as A-PG(X), where X refers to the acid/clay ratio that was employed.

4.3. Base Activation

An amount of 20 g of raw or acid-activated clay was mixed with a NaOH solution, keeping the NaOH/clay ratio at 20 mL/g [36]. The mixture was agitated overnight at 90 °C. Filtration was used to collect the solid phase, which was then repeatedly rinsed with distilled water and allowed to dry at room temperature. The sample’s designation is BA-PG(X), where X stands for the values of the acid/clay ratio. B-PG is the name given to the raw PG clay mineral treated with NaOH solution.
Figure S1 summarizes the flow chart of the acid and base activation processes.

4.4. Basic Blue-41 Removal Procedure

The removal process was carried out in accordance with an earlier study [25]. One liter of stock solution of 1000 mg/L of BB-41 was prepared. The required concentrations were obtained via dilution. Typically, 10 mL of BB-41 solution in closed tubes was mixed with 100 mg of each sample, using various concentrations of 25 mg/L to 800 mg/L. The tubes were placed in a temperature-controlled water bath at 25 °C and shaken overnight. The solutions were collected through centrifugation and then analyzed using a UV–visible spectrophotometer to estimate the amount of dye removed.

4.5. Regeneration Runs

Selected samples were treated with a BB-200 mg/L BB-41 solution for six hours, and then separated and washed with deionized water. Then, the spent samples were added to 12 mL of a solution comprising 12 mg oxone and cobalt nitrate for 30 min. After centrifugation and washing with distilled water, the products were added once more to 50 mL of new BB-41 solution, and then the same process was repeated seven times. At each step, the supernatant was examined using a UV–visible spectrophotometer set to the Lambda maximum (λmax) of 610 nm [25].

4.6. Characterization Techniques

The CECs of the different clays were estimated using the micro-Kjedahl method. An X-ray fluorescence (XRF) technique was employed to estimate the oxide contents in the samples. S4 explorer from Bruker (Karlsruhe, Germany) was used for XRF, and Bruker Advance 8 (Karlsruhe, Germany; using a Cu Kλ source (λ = 1.54056 Å)) was used to investigate the materials’ phases. X-ray diffraction (XRD) runs between 2° and 30° (2 theta) were also performed. In addition, a Thermogravimetric Analyzer (SDT2960) from TA Instruments (New Castle, DE, USA) was used to conduct a thermal gravimetric analysis between 30 °C and 800 °C in an air atmosphere at a heating rate of 10 °C/min. The FTIR spectra were collected using a Digilab Excalibur FTS 3000 series spectrometer (Hercules, CA, USA) and the KBr technique. The surface morphologies were performed via scanning electron microscopy (SEM), a Jeol model, JSM-6700F (Tokyo, Japan). N2 adsorption isotherms were obtained using the Autosorb 6 instrument from Quantachrome (Boynton Beach, FL, USA) with a degas temperature of 100 °C. The specific surface area (SBET) was determined via the Brunauer–Emmett–Teller (BET) method. The total pore volume (T.P.V.) was estimated at a relative pressure of P/Po = 0.95 (adsorption branch), and the average pore diameter (A.P.D.) was calculated based on the formula d = 4Vp/Sp (where Vp is the total pore volume and Sp is the total specific surface area (SBET). A Brucker 400 spectrometer (Karlsruhe, Germany) set to a 29Si NMR frequency of 78 MHz was used to gather 29Si MAS NMR spectra [36]. The dye solutions’ concentrations were measured using the Cary 100 UV–Vis spectrophotometer from Variant (Mulgrave, Australia).

5. Conclusions

In this study, additional treatment of acid-activated PG montmorillonite with NaOH changed the physico-chemical properties of the clay. The resulting samples exhibited a good capacity to remove BB-41 dye molecules.
According to the XRF data, magnesium, aluminum, and iron cations were leached during the acid activation process, which caused the CEC to decrease as the acid/clay ratio increased, and resulted in the production of an amorphous three-dimensional silica phase, which was dissolved after NaOH treatment. The successful acid activation and production of acid–base activated clay minerals were confirmed through XRF, XRD, FTIR, and 29Si MAS NMR data.
The properties of the parent PG materials were restored from the acid-activated clays after NaOH treatment. The removal experiments indicated the benefit of the additional NaOH activation for the acid-activated clays. Adsorption isotherms were consistent with the Langmuir isotherm, with a maximum removal capacity of 108 mg/g observed at alkaline pH. Selected samples maintained their performances over at least four regeneration cycles with a loss of activity of around 20 to 40%. The removal of BB-41 dye molecules was not specifically linked to the specific surface area of the used samples, and was mainly induced by the CEC values and the solid pH. Acid–base-treated clay minerals are promising agents for the efficient removal of dyes such as BB-41 from their aqueous solutions. Kinetic studies will be carried out in the future to understand the mechanisms of BB-41 removal in different materials, in addition to the thermodynamic characteristics of the process.

Supplementary Materials

The following supporting information can be downloaded at https://www.mdpi.com/article/10.3390/inorganics13070228/s1: Equation (S1): To estimate the removed amount of BB-41 (mg/g); Equation (S2): To estimate the removal percentage of BB-41 (%); Equation (S3): Represents the linear Langmuir model equation; Equation (S4): Represents the linear Freundlich model equation; Figure S1: Flow chart of sample preparation; Figure S2: Langmuir isotherms for BB-41 dye on selected samples: (a) A-PG(0.2) (b) A-PG(0.5) (c) BA-PG(0.2), and (d) BA-PG(0.3).

Author Contributions

Conceptualization, T.S.A. and F.K.; methodology, R.A.-F., S.A.P., H.A.D., S.R., and F.K.; software, S.A.P., H.A.D., and F.K.; validation, T.S.A., R.A.-F., M.G.A., and F.K.; formal analysis, M.G.A., R.A.-F., and S.R.; investigation, H.A.D., R.A.-F., T.S.A., and F.K.; resources, R.A.-F., H.A.D., S.A.P., M.G.A., and F.K.; data curation, S.R., S.A.P., T.S.A., R.A.-F., S.R., and F.K.; writing—original draft preparation, S.A.P., S.R., T.S.A., and F.K.; writing—review and editing, M.G.A., R.A.-F., and F.K.; visualization, S.A.P., R.A.-F., M.G.A., and F.K.; supervision, T.S.A., S.A.P., and F.K.; project administration, F.K.; funding acquisition, T.S.A., S.A.P., and F.K. All authors have read and agreed to the published version of the manuscript.

Funding

This research received no external funding.

Institutional Review Board Statement

Not applicable.

Informed Consent Statement

Not applicable.

Data Availability Statement

Data are contained within this article.

Conflicts of Interest

The authors declare no conflicts of interest.

References

  1. Babuji, P.; Thirumalaisamy, S.; Duraisamy, K.; Periyasamy, G. Human health risks due to exposure to water pollution: A review. Water 2023, 15, 2532. [Google Scholar] [CrossRef]
  2. Lin, J.; Ye, W.; Xie, M.; Seo, D.H.; Luo, J.; Wan, Y.; Van der Bruggen, B. Environmental impacts and remediation of dye-containing wastewater. Nat. Rev. Earth Environ. 2023, 4, 785–803. [Google Scholar] [CrossRef]
  3. Hassaan, M.; Nemr, A. Health and environmental impacts of dyes: Mini review. Amer. J. Environ. Sci. Engin. 2017, 1, 64–67. [Google Scholar]
  4. Kant, R. Textile dyeing industry an environmental hazard. Nat. Sci. 2012, 4, 22–26. [Google Scholar] [CrossRef]
  5. Savin, I.; Butnaru, R. Wastewater characteristics in textile finishing mills. Environ. Eng. Manag. J. 2008, 7, 859–864. [Google Scholar] [CrossRef]
  6. Amte, G.K.; Mhaskar, T.V. Impact of textile-dyeing industry effluent on some haematological parameters of freshwater fish Oreochromis mossambicus. Nat. Environ. Pollut. Technol. 2013, 12, 93–98. [Google Scholar]
  7. de Sousa, M.L.; de Moraes, P.B.; Lopes, P.R.M.; Montagnolli, R.N.; de Angelis, D.D.F.; Bidoia, E.D. Contamination by remazol red brilliant dye and its impact in aquatic photosynthetic microbiota. Environ. Manag. Sustain. Dev. 2012, 1, 129–138. [Google Scholar]
  8. Piaskowski, K.; Świderska-Dąbrowska, R.; Zarzycki, P.K. Dye removal from water and wastewater using various physical, chemical, and biological processes. J. AOAC Int. 2018, 101, 1371–1384. [Google Scholar] [CrossRef]
  9. Agarwala, R.; Mulky, L. Adsorption of dyes from wastewater: A comprehensive review. ChemBioEng Rev. 2023, 10, 326–335. [Google Scholar] [CrossRef]
  10. Solayman, H.; Hossen, M.A.; Abd Aziz, A.; Yahya, N.Y.; Leong, K.H.; Sim, L.C.; Monir, M.U.; Zoh, K.D. Performance evaluation of dye wastewater treatment technologies: A review. J. Environ. Chem. Eng. 2023, 11, 109610. [Google Scholar] [CrossRef]
  11. Dutta, P.; Rabbi, M.R.; Abu Sufian, M.; Mahjebin, S. Review Effects of textile dyeing effluent on the environment and its treatment: A review. Eng. Appl. Sci. Lett. 2022, 5, 1–17. [Google Scholar] [CrossRef]
  12. Ngulube, T.; Gumbo, J.R.; Masindi, V.; Maity, A. An update on synthetic dyes adsorption onto clay based minerals: A state-of-art review. J. Environ. Manag. 2017, 191, 35–57. [Google Scholar] [CrossRef]
  13. Haque, A.N.M.A.; Sultana, N.; Sayem, A.S.M.; Smriti, S.A. Sustainable adsorbents from plant-derived agricultural wastes for anionic dye removal: A review. Sustainability 2022, 14, 11098. [Google Scholar] [CrossRef]
  14. Liu, X.; Pang, H.; Liu, X.; Li, Q.; Zhang, N.; Mao, L.; Qiu, M.; Hu, B.; Yang, H.; Wang, X.; et al. Orderly porous covalent organic frameworks-based materials: Superior adsorbents for pollutants removal from aqueous solutions. Innovation 2021, 2, 100076. [Google Scholar] [CrossRef]
  15. Sriram, G.; Bendre, A.; Mariappan, E.; Altalhi, T.; Kigga, M.; Ching, Y.C.; Jung, H.-Y.; Bhaduri, B.; Kurkuri, M. Recent trends in the application of metal-organic frameworks (MOFs) for the removal of toxic dyes and their removal mechanism-a review. Sustain. Mater. Technol. 2022, 31, e00378. [Google Scholar] [CrossRef]
  16. Zhou, Y.; Lu, J.; Zhou, Y.; Liu, L. Recent advances for dyes removal using novel adsorbents: A review. Environ. Pollut. 2019, 252, 352–365. [Google Scholar] [CrossRef] [PubMed]
  17. Adeyemo, A.A.; Adeoye, I.O.; Bello, O.S. Adsorption of dyes using different types of clay: A review. Appl. Water Sci. 2017, 7, 543–568. [Google Scholar] [CrossRef]
  18. Leyva-Ramos, R.; Jacobo-Azuara, A.; Martínez-Costa, J.I. Organoclays. Fundamentals and Applications for Removing Toxic Pollutants from Water Solution. In Porous Materials. Engineering Materials; Moreno-Piraján, J.C., Giraldo-Gutierrez, L., Gómez-Granados, F., Eds.; Springer: Cham, Switzerland, 2021. [Google Scholar] [CrossRef]
  19. Rápó, E.; Tonk, S. Factors affecting synthetic dye adsorption; desorption studies: A Review of Results from the Last Five Years (2017–2021). Molecules 2021, 26, 5419. [Google Scholar] [CrossRef]
  20. Tombacz, E.; Szekeres, M. Colloidal behavior of aqueous montmorillonite suspensions: The specific role of pH in the presence of indifferent electrolytes. Appl. Clay Sci. 2004, 27, 75–94. [Google Scholar] [CrossRef]
  21. Kooli, F.; Yan, L.; Al-Faze, R.; Al-Sehimi, A. Removal enhancement of basic blue 41 by waste brick from an aqueous solution. Arab. J. Chem. 2015, 8, 333–342. [Google Scholar] [CrossRef]
  22. Alanazi, A.M.; Al Dmour, H.; Popoola, S.A.; Oudghiri Hassani, H.; Rakass, S.; Al-Faze, R.; Kooli, F. Parameters Synthesis of Na-magadiite materials for water treatment and removal of basic blue-41: Properties and single-batch design adsorber. Inorganics 2023, 11, 423. [Google Scholar] [CrossRef]
  23. Barakan, S.; Aghazadeh, V. The advantages of clay mineral modification methods for enhancing adsorption efficiency in wastewater treatment: A review. Environ. Sci. Pollut. Res. 2021, 28, 2572–2599. [Google Scholar] [CrossRef] [PubMed]
  24. Hart, M.; Brown, D. Surface acidities and catalytic activities of acid-activated clays. J. Mol. Catal. A Chem. 2004, 212, 315–321. [Google Scholar] [CrossRef]
  25. Tran, H.N.; You, S.-J.; Hosseini-Bandegharaei, A.; Chao, H.-P. Mistakes and inconsistencies regarding adsorption of contaminants from aqueous solutions: A critical review. Water Res. 2017, 120, 88–116. [Google Scholar] [CrossRef]
  26. Bahranowski, K.; Klimek, A.; Gaweł, A.; Olejniczak, Z.; Serwicka, E.M. Rehydration Driven Acid Impregnation of Thermally Pretreated Ca-Bentonite—Evolution of the Clay Structure. Materials 2022, 15, 2067. [Google Scholar] [CrossRef] [PubMed]
  27. Komadel, P. Acid activated clays: Materials in continuous demand. Appl. Clay Sci. 2016, 131, 84–99. [Google Scholar] [CrossRef]
  28. Carrado, K.A.; Komadel, P. Acid Activation of Bentonites and Polymer-Clay Nanocomposites. Elements 2009, 5, 111–116. [Google Scholar] [CrossRef]
  29. Bauer, A.; Berger, G. Kaolinite and smectite dissolution rate in high molar KOH solutions at 35° and 80 °C. Appl. Geochem. 1998, 13, 905–916. [Google Scholar] [CrossRef]
  30. Marsh, A.; Heath, A.; Patureau, P.; Evernden, M.; Walker, P. Alkali activation behaviour of un-calcined montmorillonite and illite clay minerals. Appl. Clay Sci. 2018, 166, 250–261. [Google Scholar] [CrossRef]
  31. Bahranowski, K.; Klimek, A.; Gaweł, A.; Serwicka, E.M. Rehydration Driven Na-Activation of Bentonite—Evolution of the Clay Structure and Composition. Materials 2021, 14, 7622. [Google Scholar] [CrossRef]
  32. Foletto, E.L.; Volzone, C.; Porto, L.M. Performance of an Argentinian acid-activated bentonite in the bleaching of soybean oil. Braz. J. Chem. Eng. 2003, 20, 139–145. [Google Scholar] [CrossRef]
  33. Christidis, G.E.; Scott, P.W.; Dunham, A.C. Acid activation and bleaching capacity of bentonites from the islands of Milos and Chios, Aegean, Greece. Appl. Clay Sci. 1997, 12, 329–347. [Google Scholar] [CrossRef]
  34. Ferrage, E.; Lanson, B.; Sakharov, B.A.; Geoffroy, N.; Jacquot, E.; Drits, V.A. Investigation of dioctahedral smectite hydration properties by modeling of X-ray diffraction profiles: Influence of layer charge and charge location. Am. Mineral. 2007, 92, 1731–1743. [Google Scholar] [CrossRef]
  35. Tyagi, B.; Chudasama, C.D.; Jasra, R.V. Determination of structural modification in acid activated montmorillonite clay by FT IR spectroscopy. Spectrochim. Acta Part A Mol. Biomol. Spectrosc. 2006, 64, 273–278. [Google Scholar] [CrossRef]
  36. Kooli, F.; Liu, Y.; Tan, S.X.; Zheng, J. Organoclays from alkaline-treated acid-activated clays. J. Therm. Anal. Calorim. 2014, 115, 1465–1475. [Google Scholar] [CrossRef]
  37. Gates, P.W.; Bouazza, A. Bentonite transformations in strongly alkaline solutions. Geotext. Geomembr. 2010, 28, 206–218. [Google Scholar] [CrossRef]
  38. Jozefaciuk, G.; Sarzynska, D.M. Effect of acid treatment and alkali treatment on nanopore properties of selected minerals. Clays Clay Miner. 2006, 54, 220–229. [Google Scholar] [CrossRef]
  39. Ahmed, A.; Chaker, Y.; Belarbi, E.H.; Abbas, O.; Chotard, J.N.; Abassi, H.B.; Nguyen Van Nhien, A.; El Hadri, M.; Bresson, S. XRD and ATR/FTIR investigations of various montmorillonite clays modified by monocationic and dicationic imidazolium ionic liquids. J. Mol. Struct. 2018, 1173, 653–664. [Google Scholar] [CrossRef]
  40. Madejová, J. FTIR techniques in clay mineral studies. Vib. Spectrosc. 2003, 31, 1–10. [Google Scholar] [CrossRef]
  41. Horri, N.; Sanz-Pérez, E.S.; Arencibia, A.; Sanz, R.; Frini-Srasra, N.; Srasra, E. Effect of acid activation on the CO2 adsorption capacity of montmorillonite. Adsorption 2020, 26, 793–811. [Google Scholar] [CrossRef]
  42. Sarioğlan, S.; Yüzer, H.; Koral, M. Acid activation and bleaching performance of Turkish (somas) bentonite in crude soybean oil. Part. Sci. Technol. 2010, 28, 298–308. [Google Scholar] [CrossRef]
  43. Caglar, B.; Afsin, B.; Koksal, E.; Tabak, A.; Eren, E. Characterization of Unye bentonite after treatment with sulfuric acid. Quim. Nova 2012, 36, 955–959. [Google Scholar] [CrossRef]
  44. He, H.; Guo, J.; Xie, X.; Lin, H.; Li, L. A microstructural study of acid-activated montmorillonite from Choushan, China. Clay Miner. 2002, 37, 337–344. [Google Scholar] [CrossRef]
  45. Pavón, E.; Alba, M.D. Swelling layered minerals applications: A solid state NMR overview. Prog. Nucl. Magn. Reson. Spectrosc. 2021, 124–125, 99–128. [Google Scholar] [CrossRef]
  46. Lellou, S.; Kadi, S.; Ouadjenia, F.; Benhebal, H.; Schott, J.; Marouf, R. Synthesis and application of montmorillonite nanocomposites/phenolic resins for the elimination of Basic Blue 41. Desalin. Water Treat. 2021, 218, 389–400. [Google Scholar] [CrossRef]
  47. El Kassimi, A.; Boutouil, A.; El Himri, M.; Laamari, M.R.; El Haddad, M. Selective and competitive removal of three basic dyes from single, binary and ternary systems in aqueous solutions: A combined experimental and theoretical study. J. Saudi Chem. Soc. 2020, 24, 527–544. [Google Scholar] [CrossRef]
  48. Al-Madanat, O.Y.; Popoola, S.A.; Al Dmour, H.; Al-Faze, R.; Kooli, F. Na-Kenyaite as Efficient Basic Blue-41 Dye Removal: Synthesis and Regeneration Studies. Water 2024, 16, 2056. [Google Scholar] [CrossRef]
  49. Nwosu, F.O.; Ajala, O.J.; Owoyemi, R.M.; Raheem, B.G. Preparation and characterization of adsorbents derived from bentonite and kaolin clays. Appl. Water Sci. 2018, 8, 195. [Google Scholar] [CrossRef]
  50. Arab, C.; El Kurdi, R.; Patra, D. Effect of pH on the removal of anionic and cationic dyes using zinc curcumin oxide nano-particles as adsorbent. Mater. Chem. Phys. 2022, 277, 125504. [Google Scholar] [CrossRef]
  51. Olakitan Ijagbemi, C.; Baek, M.H.; Kim, D.S. Montmorillonite surface properties and sorption characteristics for heavy metal removal from aqueous solutions. J. Hazard. Mater. 2009, 166, 538–546. [Google Scholar] [CrossRef]
  52. Dodoo, D.; Fynn, G.E.; Yawson, E.S.C.; Appiah, G.; Suleiman, N.; Yaya, A. Eco-efficient treatment of hazardous bauxite liquid-residue using acid-activated clays. Clean. Chem. Eng. 2022, 3, 100040. [Google Scholar] [CrossRef]
  53. Dehmani, Y.; Franco, D.S.P.; Georgin, J.; Lamhasni, T.; Brahmi, Y.; Oukhrib, R.; Mustapha, B.; Moussout, H.; Ouallal, H.; Sadik, A. Comparison of phenol adsorption property and mechanism onto different moroccan clays. Water 2023, 15, 1881. [Google Scholar] [CrossRef]
  54. Alanazi, A.M.; Jefri, G.A.M.; Al-Faze, R.; Kooli, F. Organo acid-activated clays for water treatment as removal agent of Eosin-Y: Properties, regeneration, and single batch design absorber. Heliyon 2024, 10, e30530. [Google Scholar] [CrossRef] [PubMed]
  55. Amari, A.; Gannouni, H.; Khan, M.I.; Almesfer, M.K.; Elkhaleefa, A.M.; Gannouni, A. Effect of structure and chemical activation on the adsorption properties of green clay minerals for the removal of cationic dye. Appl. Sci. 2018, 8, 2302. [Google Scholar] [CrossRef]
  56. Ding, Z.; Hu, X.; Wan, Y.; Wang, S.; Gao, B. Removal of lead, copper, cadmium, zinc, and nickel from aqueous solutions by alkali-modified biochar: Batch and column tests. J. Ind. Eng. Chem. 2016, 33, 239–245. [Google Scholar] [CrossRef]
  57. Liu, C.; Wang, W.; Wu, R.; Liu, Y.; Lin, X.; Kan, H.; Zheng, Y. Preparation of Acid- and Alkali-Modified Biochar for Removal of Methylene Blue Pigment. ACS Omega 2020, 5, 30906–30922. [Google Scholar] [CrossRef]
  58. Rajabi, M.; Keihankhadiv, S.; Suhas; Tyagi, I.; Karri, R.R.; Chaudhary, M.; Mubarak, N.M.; Chaudhary, S.; Kumar, P.; Singh, P. Comparison and interpretation of isotherm models for the adsorption of dyes, proteins, antibiotics, pesticides and heavy metal ions on different nanomaterials and nonnano materials—A comprehensive review. J. Nanostruct. Chem. 2023, 13, 43–65. [Google Scholar] [CrossRef]
  59. Popoola, S.A.; Al Dmour, H.; Rakass, S.; Fatimah, I.; Liu, Y.; Mohmoud, A.; Kooli, F. Enhancement properties of Zr modified porous clay heterostructures for adsorption of basic-blue 41 dye: Equilibrium, regeneration, and single batch design adsorber. Materials 2022, 15, 5567. [Google Scholar] [CrossRef]
  60. Kooli, F.; Liu, Y.; Abboudi, M.; Oudghiri Hassani, H.; Rakass, S.; Ibrahim, S.M.; Al Wadaani, F. Waste bricks applied as removal agent of Basic Blue 41 from aqueous solution: Base treatment and their regeneration efficiency. Appl. Sci. 2019, 9, 1237. [Google Scholar] [CrossRef]
  61. Humelnicu, I.; Baiceanu, A.; Ignat, M.; Dulman, V. The removal of Basic Blue 41 textile dye from aqueous solution by ad-sorption onto natural zeolitic tuff: Kinetics and thermodynamics. Process Saf. Environ. Prot. 2017, 105, 274–287. [Google Scholar] [CrossRef]
  62. Gougazeh, M.; Kooli, F.; Buhl, J.-C. Removal efficiency of basicblue41 by three zeolites prepared from natural Jordanian kaolinite. Clays Clay Miner. 2019, 67, 143–153. [Google Scholar] [CrossRef]
  63. Kul, A.R.; Aldemir, A.; Koyuncu, H. An investigation of natural and modified diatomite performance for adsorption of Basic Blue 41: Isotherm, kinetic, and thermodynamic studies. Desalin. Water Treat. 2021, 229, 384–394. [Google Scholar] [CrossRef]
  64. Al Dmour, H.; Kooli, F.; Mohmoud, A.; Liu, Y.; Popoola, S.A. Al and Zr Porous Clay Heterostructures as Removal Agents of Basic Blue-41 Dye from an Artificially Polluted Solution: Regeneration Properties and Batch Design. Materials 2021, 14, 2528. [Google Scholar] [CrossRef] [PubMed]
  65. El Messaoudi, N.; El Khomri, M.; El Mouden, A.; Bouich, A.; Jada, A.; Lacherai, A.; Iqbal, H.M.N.; Mulla, S.I.; Kumar, V.; Américo-Pinheiro, J.H.P. Regeneration and reusability of non-conventional low-cost adsorbents to remove dyes from wastewaters in multiple consecutive adsorption–desorption cycles: A review. Biomass Convers. Biorefin. 2024, 14, 11739–11756. [Google Scholar] [CrossRef]
  66. Momina Shahadat, M.; SuIsamil, S. Regeneration performance of clay-based adsorbents for the removal of industrial dyes: A review. RSC Adv. 2018, 8, 24571–24587. [Google Scholar] [CrossRef]
  67. Vakili, M.; Deng, S.; Shen, L.; Shan, D.; Liu, D.; Yu, G. Regeneration of chitosan-based adsorbents for eliminating dyes from aqueous solutions. Sep. Purif. Rev. 2017, 48, 1–13. [Google Scholar] [CrossRef]
  68. Khalilzadeh Shirazi, E.; Metzger, J.W.; Fischer, K.; Hassani, A.H. Design and cost analysis of batch adsorber systems for removal of dyes from contaminated groundwater using natural low-cost adsorbents. Int. J. Ind. Chem. 2020, 11, 101–110. [Google Scholar] [CrossRef]
  69. Awasthi, A.; Maheshwari, V.; Rastogi, K.; Singh, K.; Kumar, S.; Kapoor, A.; Sastry, S. Treatment of textile dyes using modified banyan leaf-based biosorbent using batch and intensified batch process: Kinetic and isotherm studies. Biomass Convers. Biorefin. 2023. [Google Scholar] [CrossRef]
  70. Ho, Y.S.; McKay, G. Batch sorber design using equilibrium and contact time data for the removal of lead. Water Air Soil Pollut. 2000, 124, 141–153. [Google Scholar] [CrossRef]
  71. Yakouta, S.M.E.; Salemb, N.A.; Abdeltawab, A.A. Single and two-stage batch adsorber design for efficient uranium removal by activated carbon. Desalin. Water Treat. 2017, 98, 216–221. [Google Scholar] [CrossRef]
Figure 1. (Left) Powder XRD patterns of PG montmorillonite acid activated with sulfuric acid solution at different ratios: (a) 0, (b) 0.1, (c) 0.2, (d) 0.3, (e) 0.4, and (f) 0.5, and (right) followed by treatment with NaOH solution: (a’) 0, (b’) 0.1, (c’) 0.2, (d’) 0.3, (e’) 0.4, and (f’) 0.5. * corresponds to 110 reflection at 0.44 nm.
Inorganics 13 00228 g001
Figure 2. FTIR spectra of PG montmorillonite acid activated with sulfuric acid solution at different ratios: (a) 0, (b) 0.1, (c) 0.2, (d) 0.3, and (e) 0.5.
Inorganics 13 00228 g002
Figure 3. FTIR spectra of PG montmorillonite treated with NaOH solution after acid activation with sulfuric acid solution at different ratios: (a’) 0, (b’) 0.1, (c’) 0.2, (d’) 0.3, and (e’) 0.5.
Inorganics 13 00228 g003
Figure 4. (A) TGA features of (a) PG montmorillonite, (b) acid activated with H2SO4 solution at acid/clay ratio of 0.2, then (c) treated with NaOH solution. (B) corresponds to DTG curves of samples a, b, and c, respectively.
Inorganics 13 00228 g004
Figure 5. (Left) 29Si MAS NMR of PG montmorillonite (a) acid activated with sulfuric acid solution at different ratios: (b) 0.1, (c) 0.2, (d) 0.3, (e) 0.4, and (f) 0.5, and (right) followed by treatment withNaOH solution of samples b, d, and f, respectively.
Inorganics 13 00228 g005
Figure 6. SEM micrographs of (a) PG starting clay acid activated at a ratio of acid/clay of (b) 0.3 and (c) 0.5. (df) correpond to samples (ac) treated with NaOH solution, respectively.
Inorganics 13 00228 g006
Figure 7. (Left) Effect BB-41 initial concentration (Ci) on (a) the removal amount (mg/g) and (b) removal percentage (%) of A-PG(0.2), (right) corresponds to effect of BB-41 initial concentration (Ci) on (a’) the removal amount (mg/g) and (b’) removal percentage (%) of BA-PG(0.2).
Inorganics 13 00228 g007
Figure 8. Effect of A-PG(0.2) dose on (red line) removal percentage (%) and (blue line) removed amount (mg/g) of BB-41 dyes.
Inorganics 13 00228 g008
Figure 9. Impact of initial pH of solution on the removal percentage of BB-41 using (a) A-PG(0.2) and (b) BA-PG(0.2) samples.
Inorganics 13 00228 g009
Figure 10. Impact of acid activation extent on the removed amount of BB-41 (mg/g). (a) PG, (b) A-PG(0.1), (c) A-PG(0.2), (d) A-PG(0.3), (e) A-PG(0.4), and (f) A-PG(0.5).
Inorganics 13 00228 g010
Figure 11. Regeneration tests using (a) PG, (b) A-PG(0.2), and (c) BA-PG(0.2) samples.
Inorganics 13 00228 g011
Figure 12. The removal pathway or the operational straight line with a slope of −V/M for the single-stage batch design. Black dots correspond to equilibrium concentration (Ce) and its removed amount (qe) of each experiment.
Inorganics 13 00228 g012
Figure 13. (A) Required masses (g) of A-PG(0.2) and (B) of BA-PG(0.2) samples to reduce 200 mg/L of BB-41 at different percentages and volumes (L).
Inorganics 13 00228 g013
Figure 14. Masses of (a) A-PG(0.2) and (b) BA-PG(0.2) required to reduce 10 L of different initial concentrations of BB-41 (mg/L) at a removal percentage of 90%.
Inorganics 13 00228 g014
Table 1. The chemical composition (in weight %) of the PG clay after different treatments.
SamplesNa2OMgOAl2O3SiO2Fe2O3SiO2/Al2O3CEC *
PG (BPG)5.4 (4.05)3.1 (2.19)21.4 (18.1)59.7 (51.2)2.1 (1.55)2.79 (2.84)140
A-PG(0.1) (B-APG(0.1))0.0 (4.34)2.6 (2.73)18.2 (21.2)54.7 (43.8)2.1 (2.13)3.00 (2.82)120
A-PG(0.2) (BA-PG(0.2))00 (4.65)2.3 (2.18)16.6 (16.8)58.9 (42.4)1.8 (1.39)3.54 (3.0)102
A-PG(0.3) (BA-PG(0.3))0.0 (4.82)2.0 (2.46)14.5 (16.9)66.5 (48.9)1.7 (1.95)4.58 (2.91)89
A-PG(0.4) (BA-PG(0.4))0.0 (6.25)1.8 (1.81)12.7 (13.8)72.1 (42.1)1.5 (1.58)5.67 (3.05)78
A-PG(0.5) (BA-PG(0.5))0.0 (7.48)1.0 (1.54)8.1 (12.7)83.6 (46.7)0.96 (1.49)10.32 (3.05)65
* Cation exchange capacity (meq/100 g).
Table 2. Textural properties of PG clay after different treatments.
SamplesSBET (m2/g)T.P.V. (cc/g)A.P.S (nm)
PG (BPG)5 (3)0.031 (0.016)26.7 (22.3)
APG-0.1 (BAPG-0.1)127 (4)0.126 (0.031)4.0 (35.8)
APG-0.2 (BAPG-0.2)151 (6)0.224 (0.097)5.9 (23.3)
APG-0.3 (BAPG-0.3)216 (8)0.227 (0.03)4.2 (16.2)
APG-0.4 (BAPG-0.4)234 (10)0.350 (0.053)6.3 (20.1)
APG-0.5 (BAPG-0.5)273 (4)0.458 (0.02)6.7 (18.9)
T.P.V. is total pore volume, A.P.S. stands for average pore size.
Table 3. Isotherm model parameters obtained from linear fittings of the Langmuir equation.
Samplesqmax (mg/g)KL (g/L)R2
PG (BPG) *81 (108)0.0775 (0.2066)0.9923 (0.9997)
A-PG(0.1)72 (99)0.056 (0.1084)0.9992 (0.9997)
A-PG(0.2)67 (91)0.099 (0.1305)0.9997 (0.9998)
A-PG(0.3)51 (86)0.0461 (0.105)0.9982 (0.9992)
A-PG(0.4)43 (81)0.0134 (0.0936)0.9802 (0.9992)
A-PG(0.5)37 (82)0.0072 (0.0951)0.9901 (0.9995)
* values between brackets correspond to NaOH-treated acid-activated clays.
Table 4. Isotherm model parameters obtained from linear fittings of the Freundlich equation.
Samples1/nKF (mg/g)R2
PG (BPG) *0.2553 (0.0912)3.1652 (3.2087)0.8836 (0.8126)
A-PG(0.1)0.3622 (0.1675)2.2498 (3.7395)0.8912 (0.7682)
A-PG(0.2)0.2970 (0.1289)2.6024 (3.7750)0.8725 (0.9390)
A-PG(0.3)0.2512 (0.1153)3.6633 (3.3.7733)0.9134 (0.9134)
A-PG(0.4)0.3971 (0.1179)1.1885 (3.7132)0.9321 (0.9098)
A-PG(0.5)0.5618 (0.08388)1.1352 (3.8389)0.9274 (0.9274)
* values between brackets correspond to NaOH-treated acid-activated clays.
Table 5. Removal properties of selected materials.
Samplesqmax (mg/g)References
Montmorillonite (Mt)+55[59]
Saudi Local clays50–70[25]
Brick wastes60–70[21,60]
Natural zeolite60–70[61]
Sodalite zeolite39[62]
Mn-modified diatomite77[63]
Bentonite *173[46]
Alumina pillared clay88[34]
Zirconia pillared clay114[64]
Acid-activated PGs (A-PG)43–88This study
Base–acid-activated PGs (BA-PGs)92–110This study
* Bentonite-poly(p-hydroxybenzoic acid) composite. A-PG corresponds to acid-activated PG clays, BA-PG corresponds to NaOH-treated acid-activated clays.
Disclaimer/Publisher’s Note: The statements, opinions and data contained in all publications are solely those of the individual author(s) and contributor(s) and not of MDPI and/or the editor(s). MDPI and/or the editor(s) disclaim responsibility for any injury to people or property resulting from any ideas, methods, instructions or products referred to in the content.

