
DNA Binding with Dipyrromethene Ruthenium(II) Complexes

 , , , , , ,
Abstract

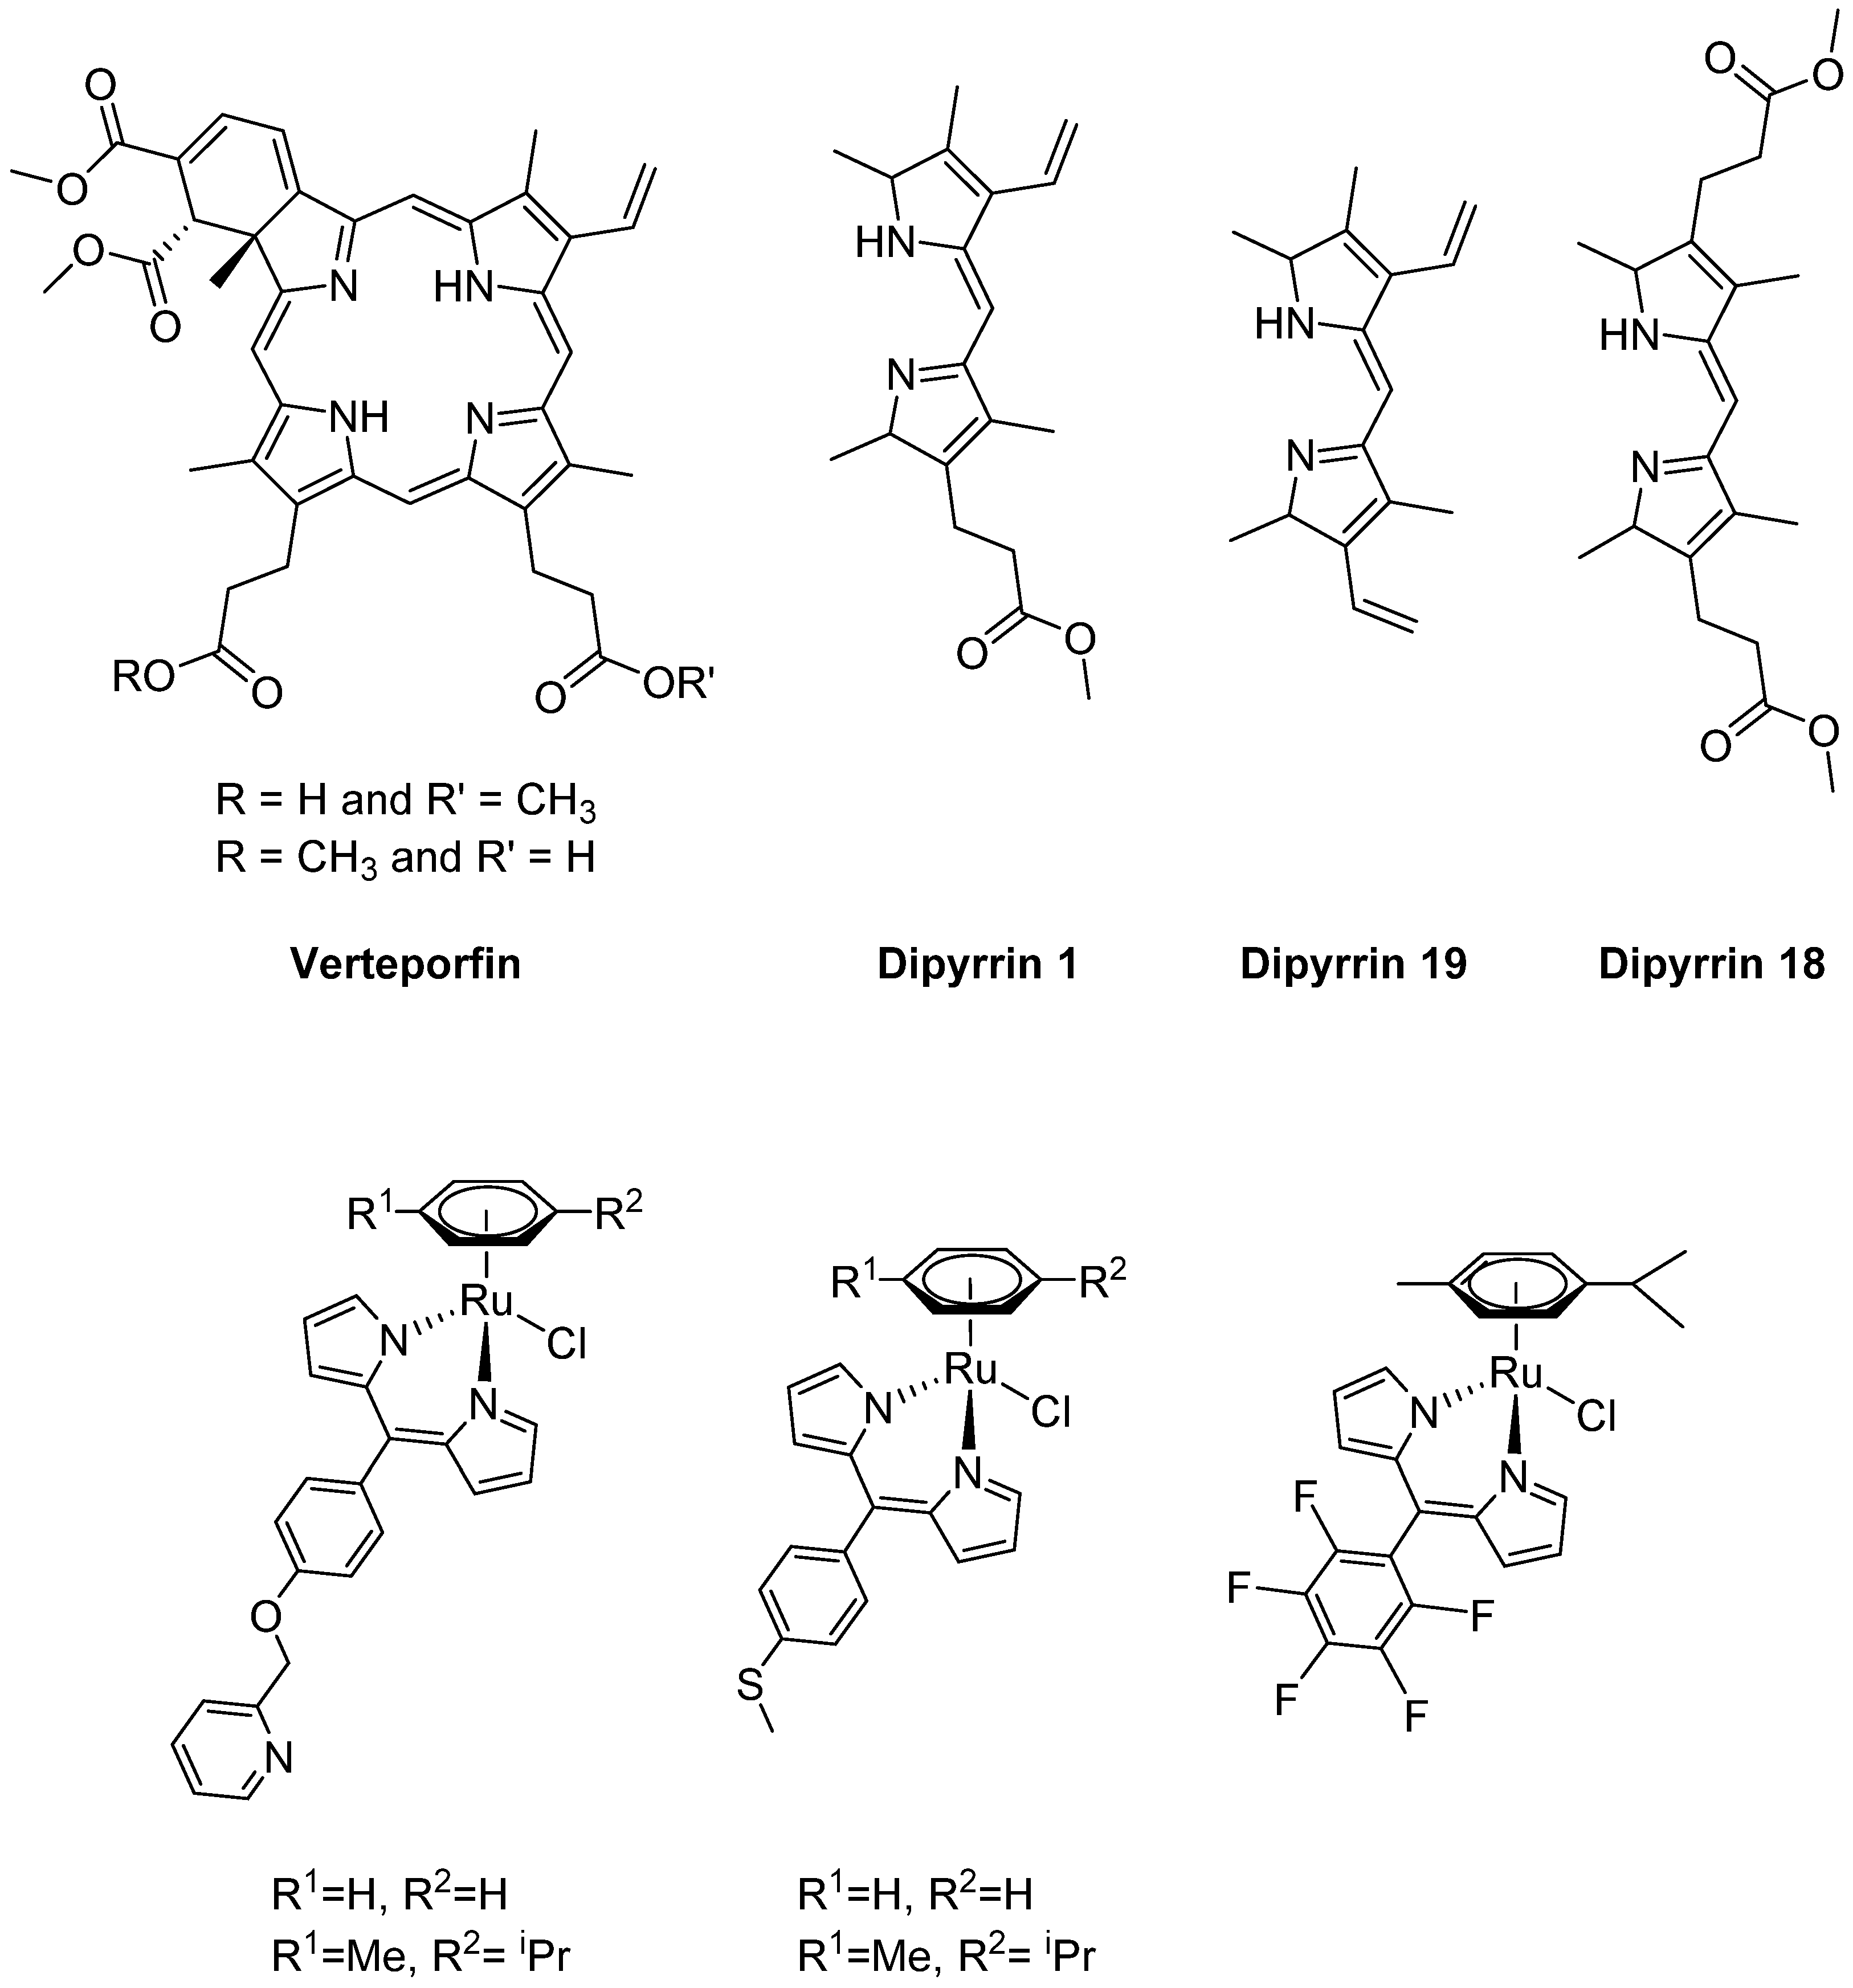
1. Introduction
2. Results
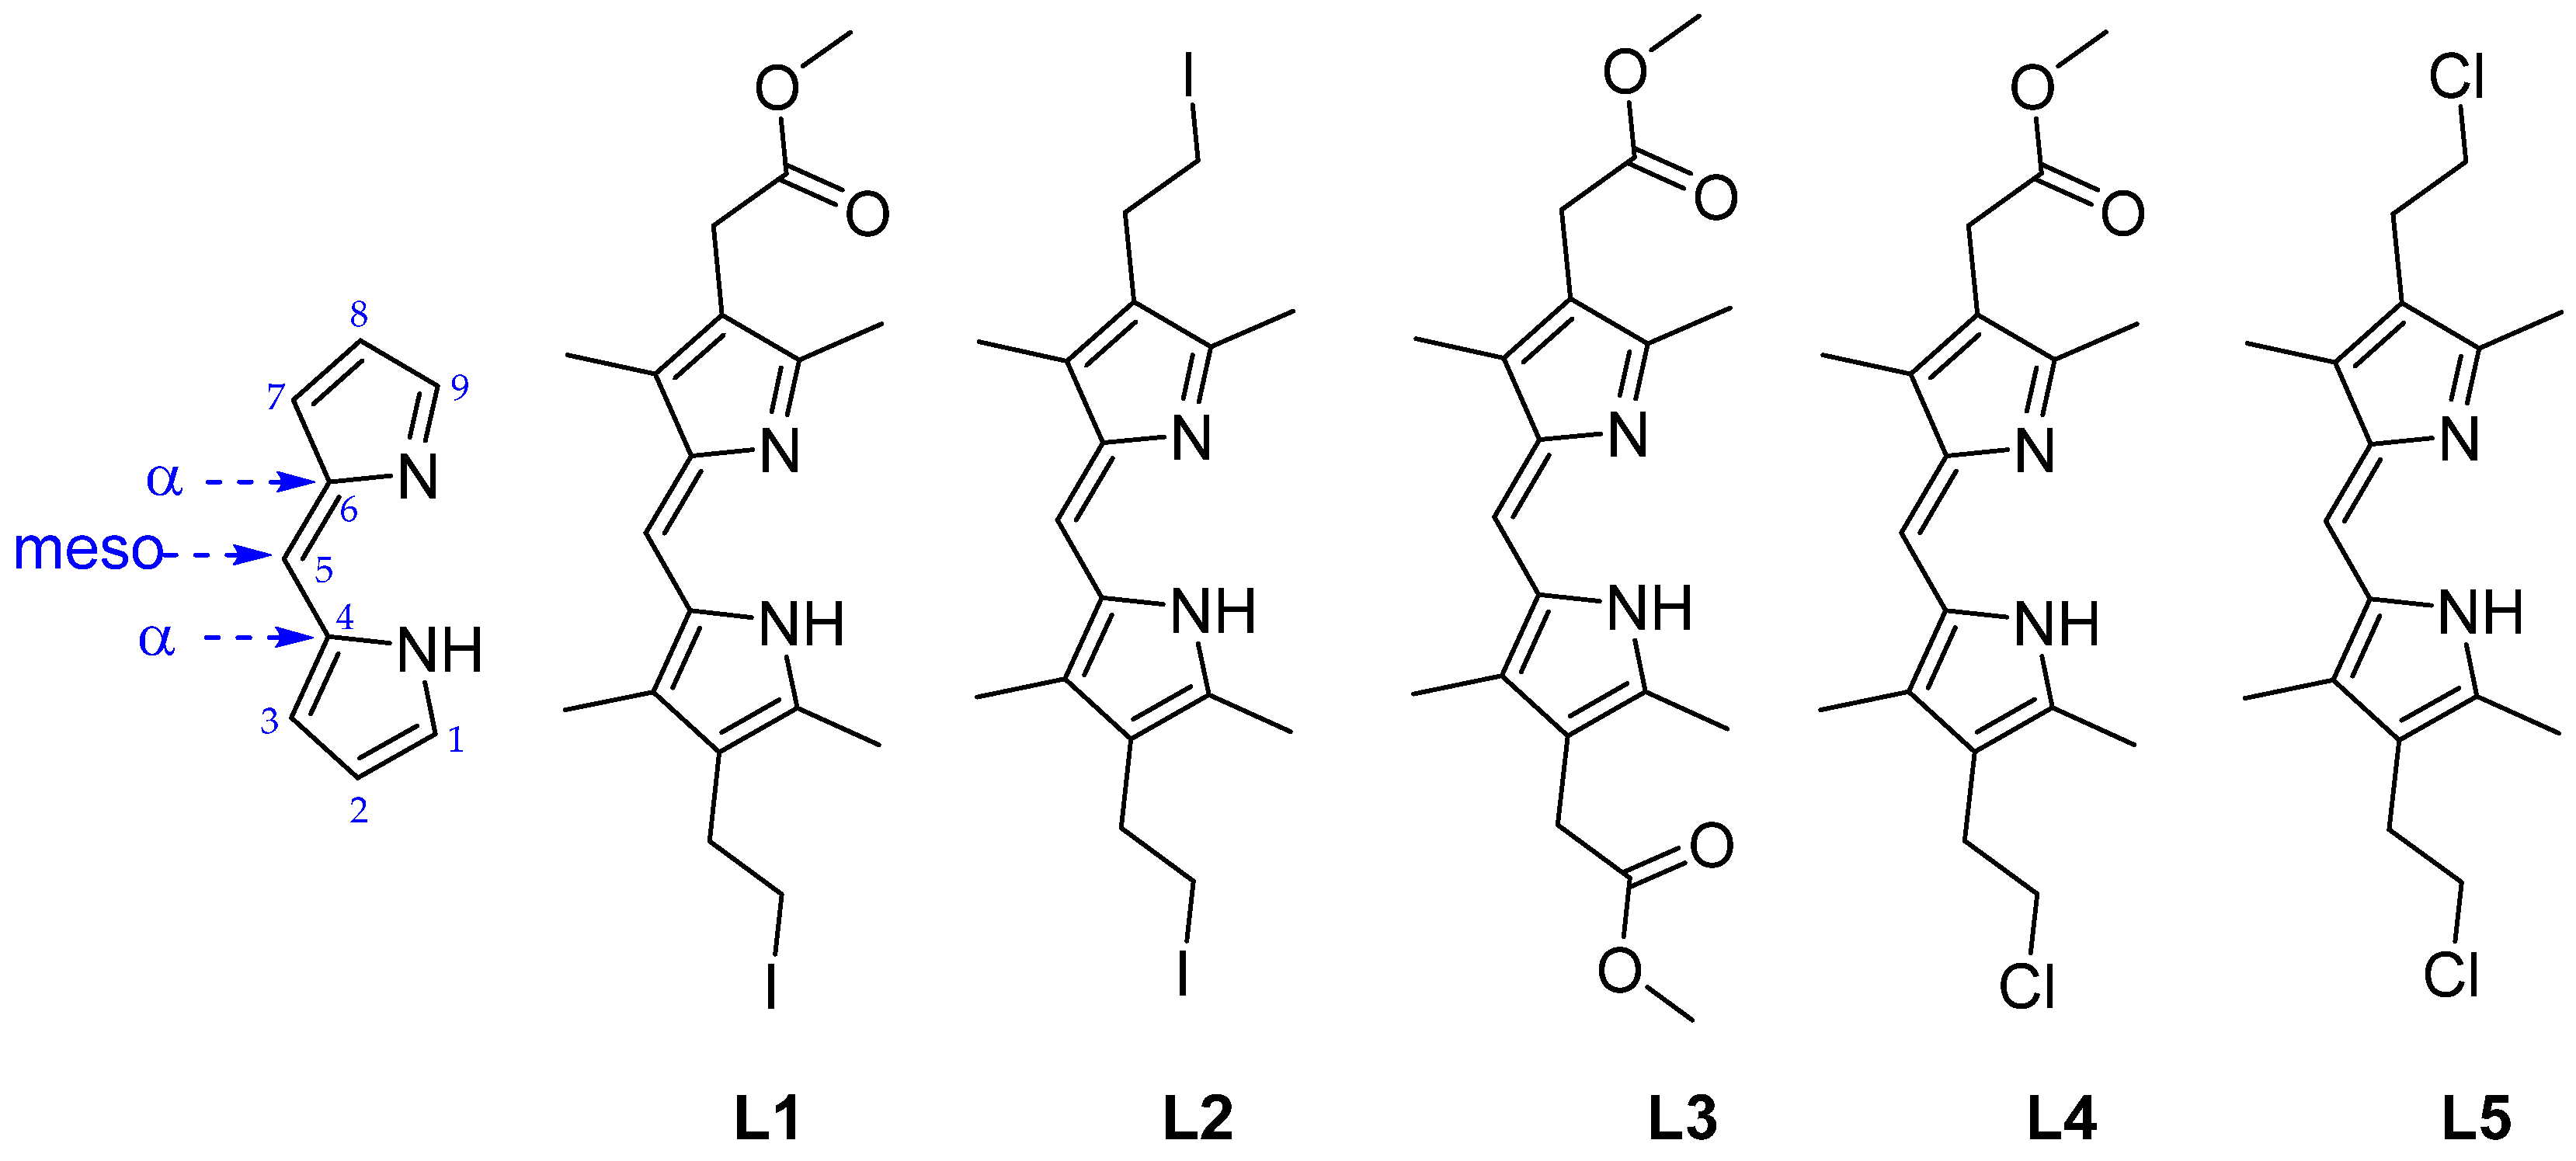
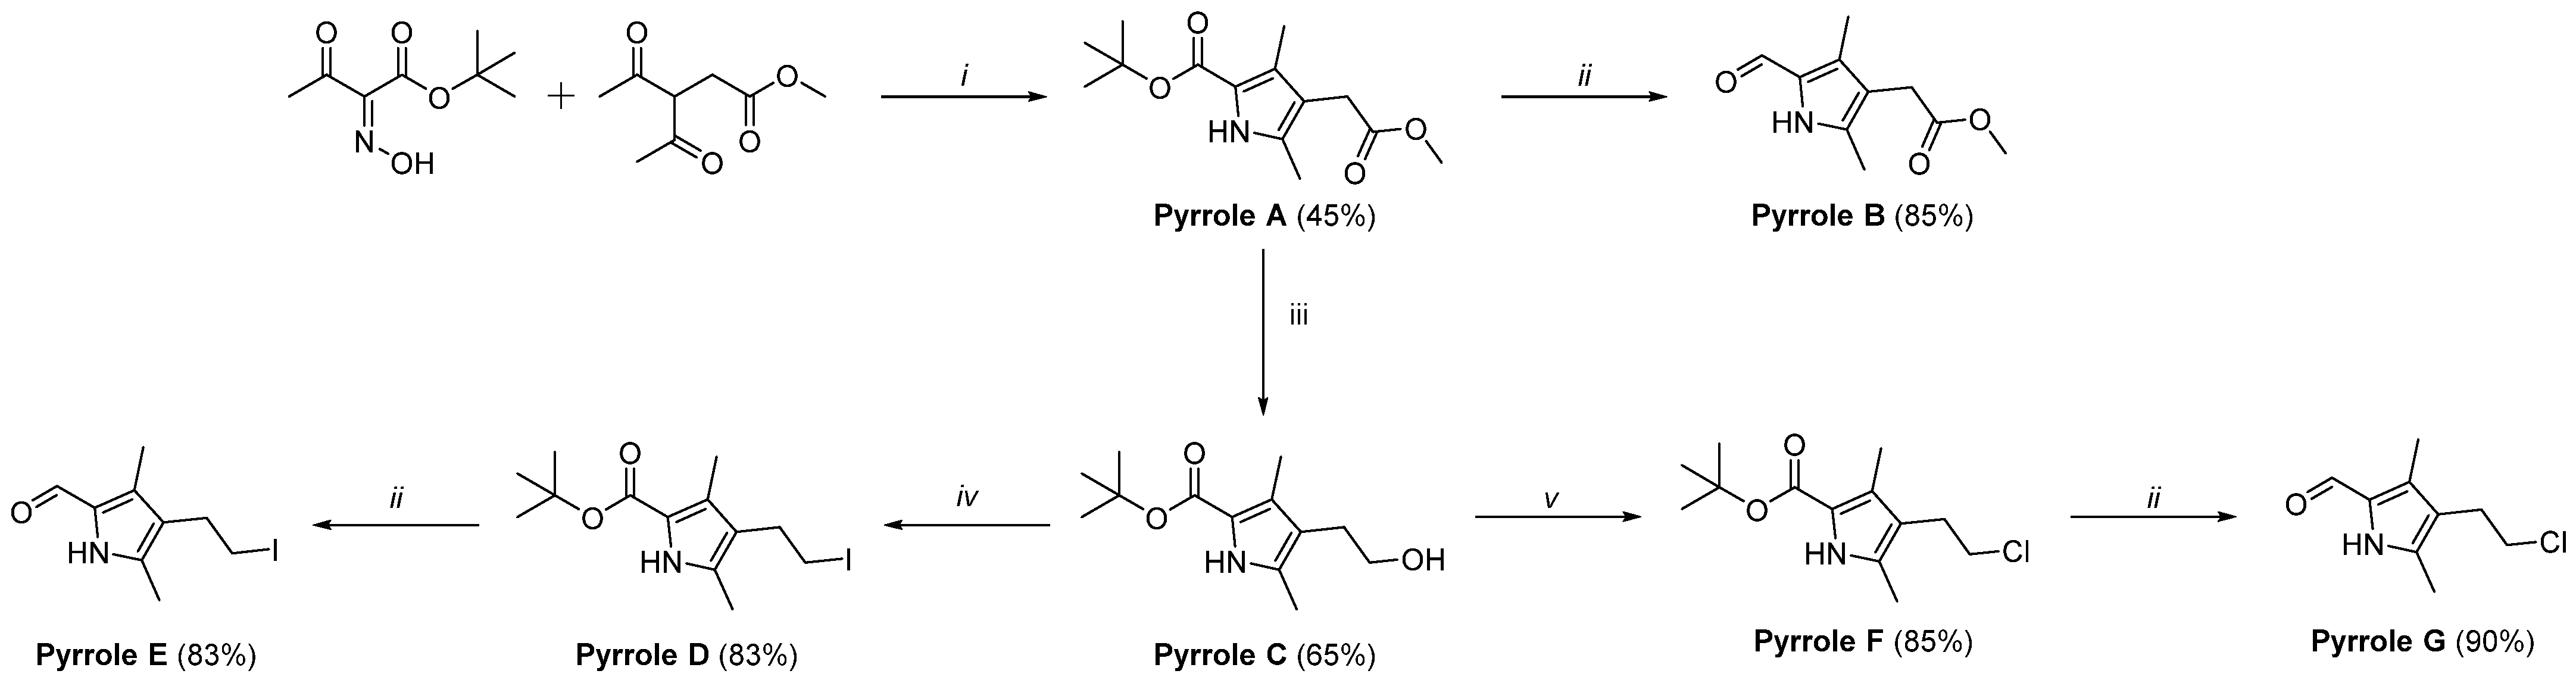
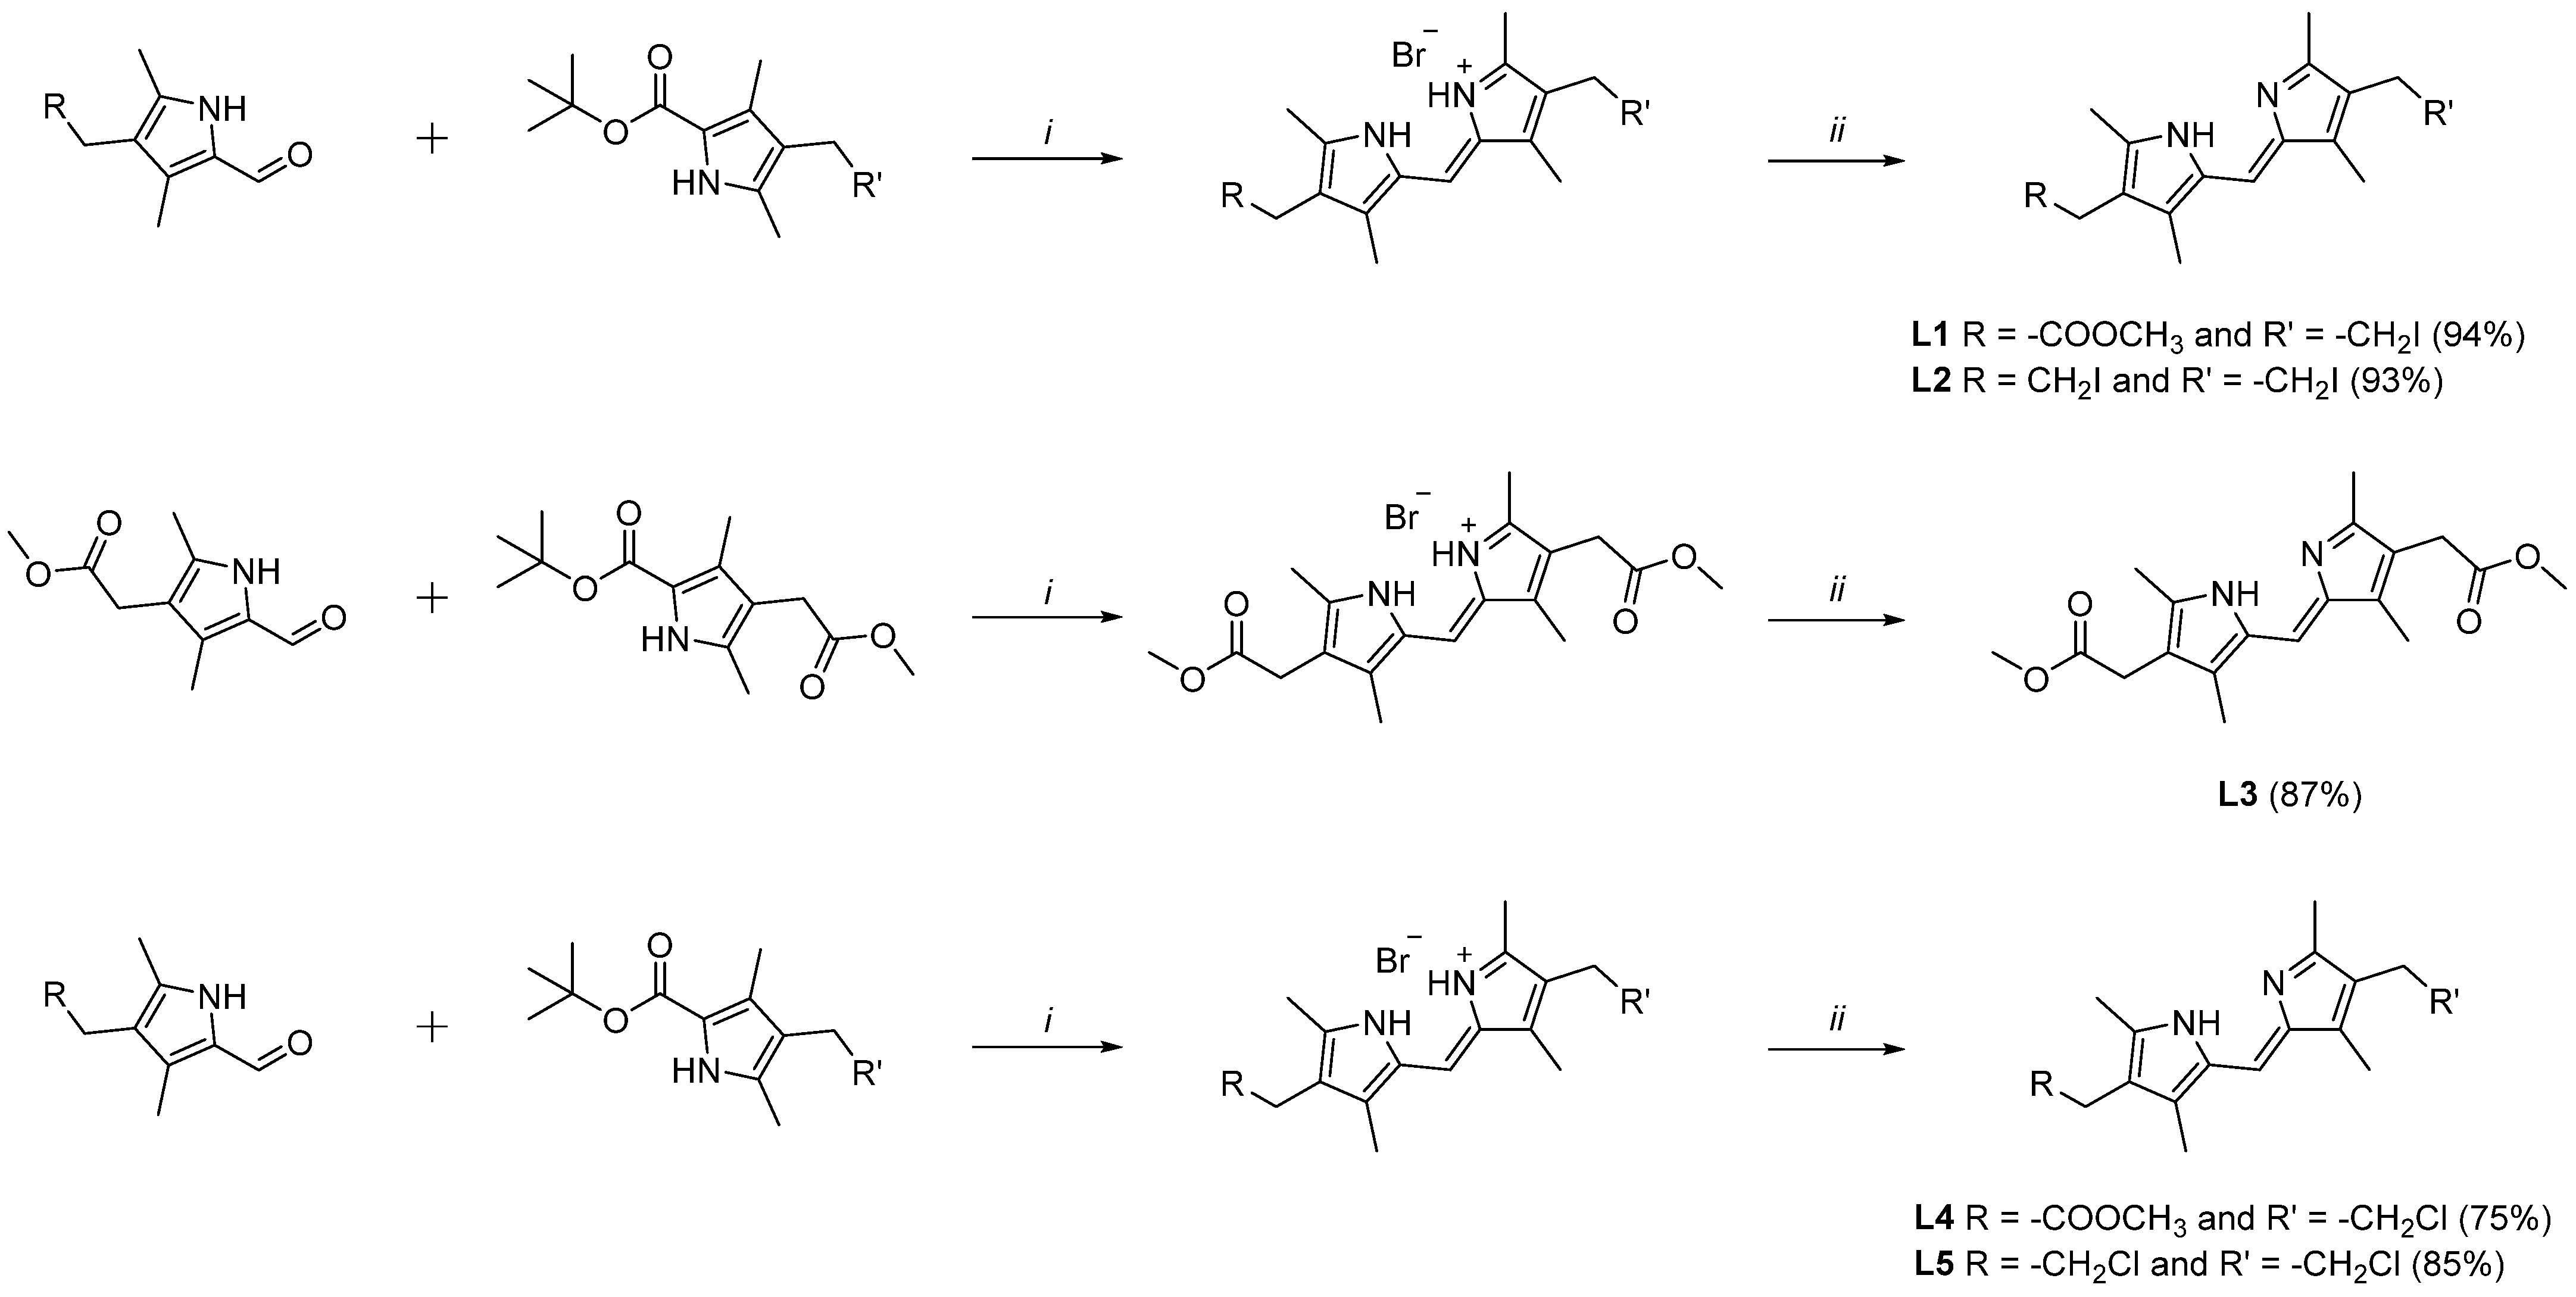
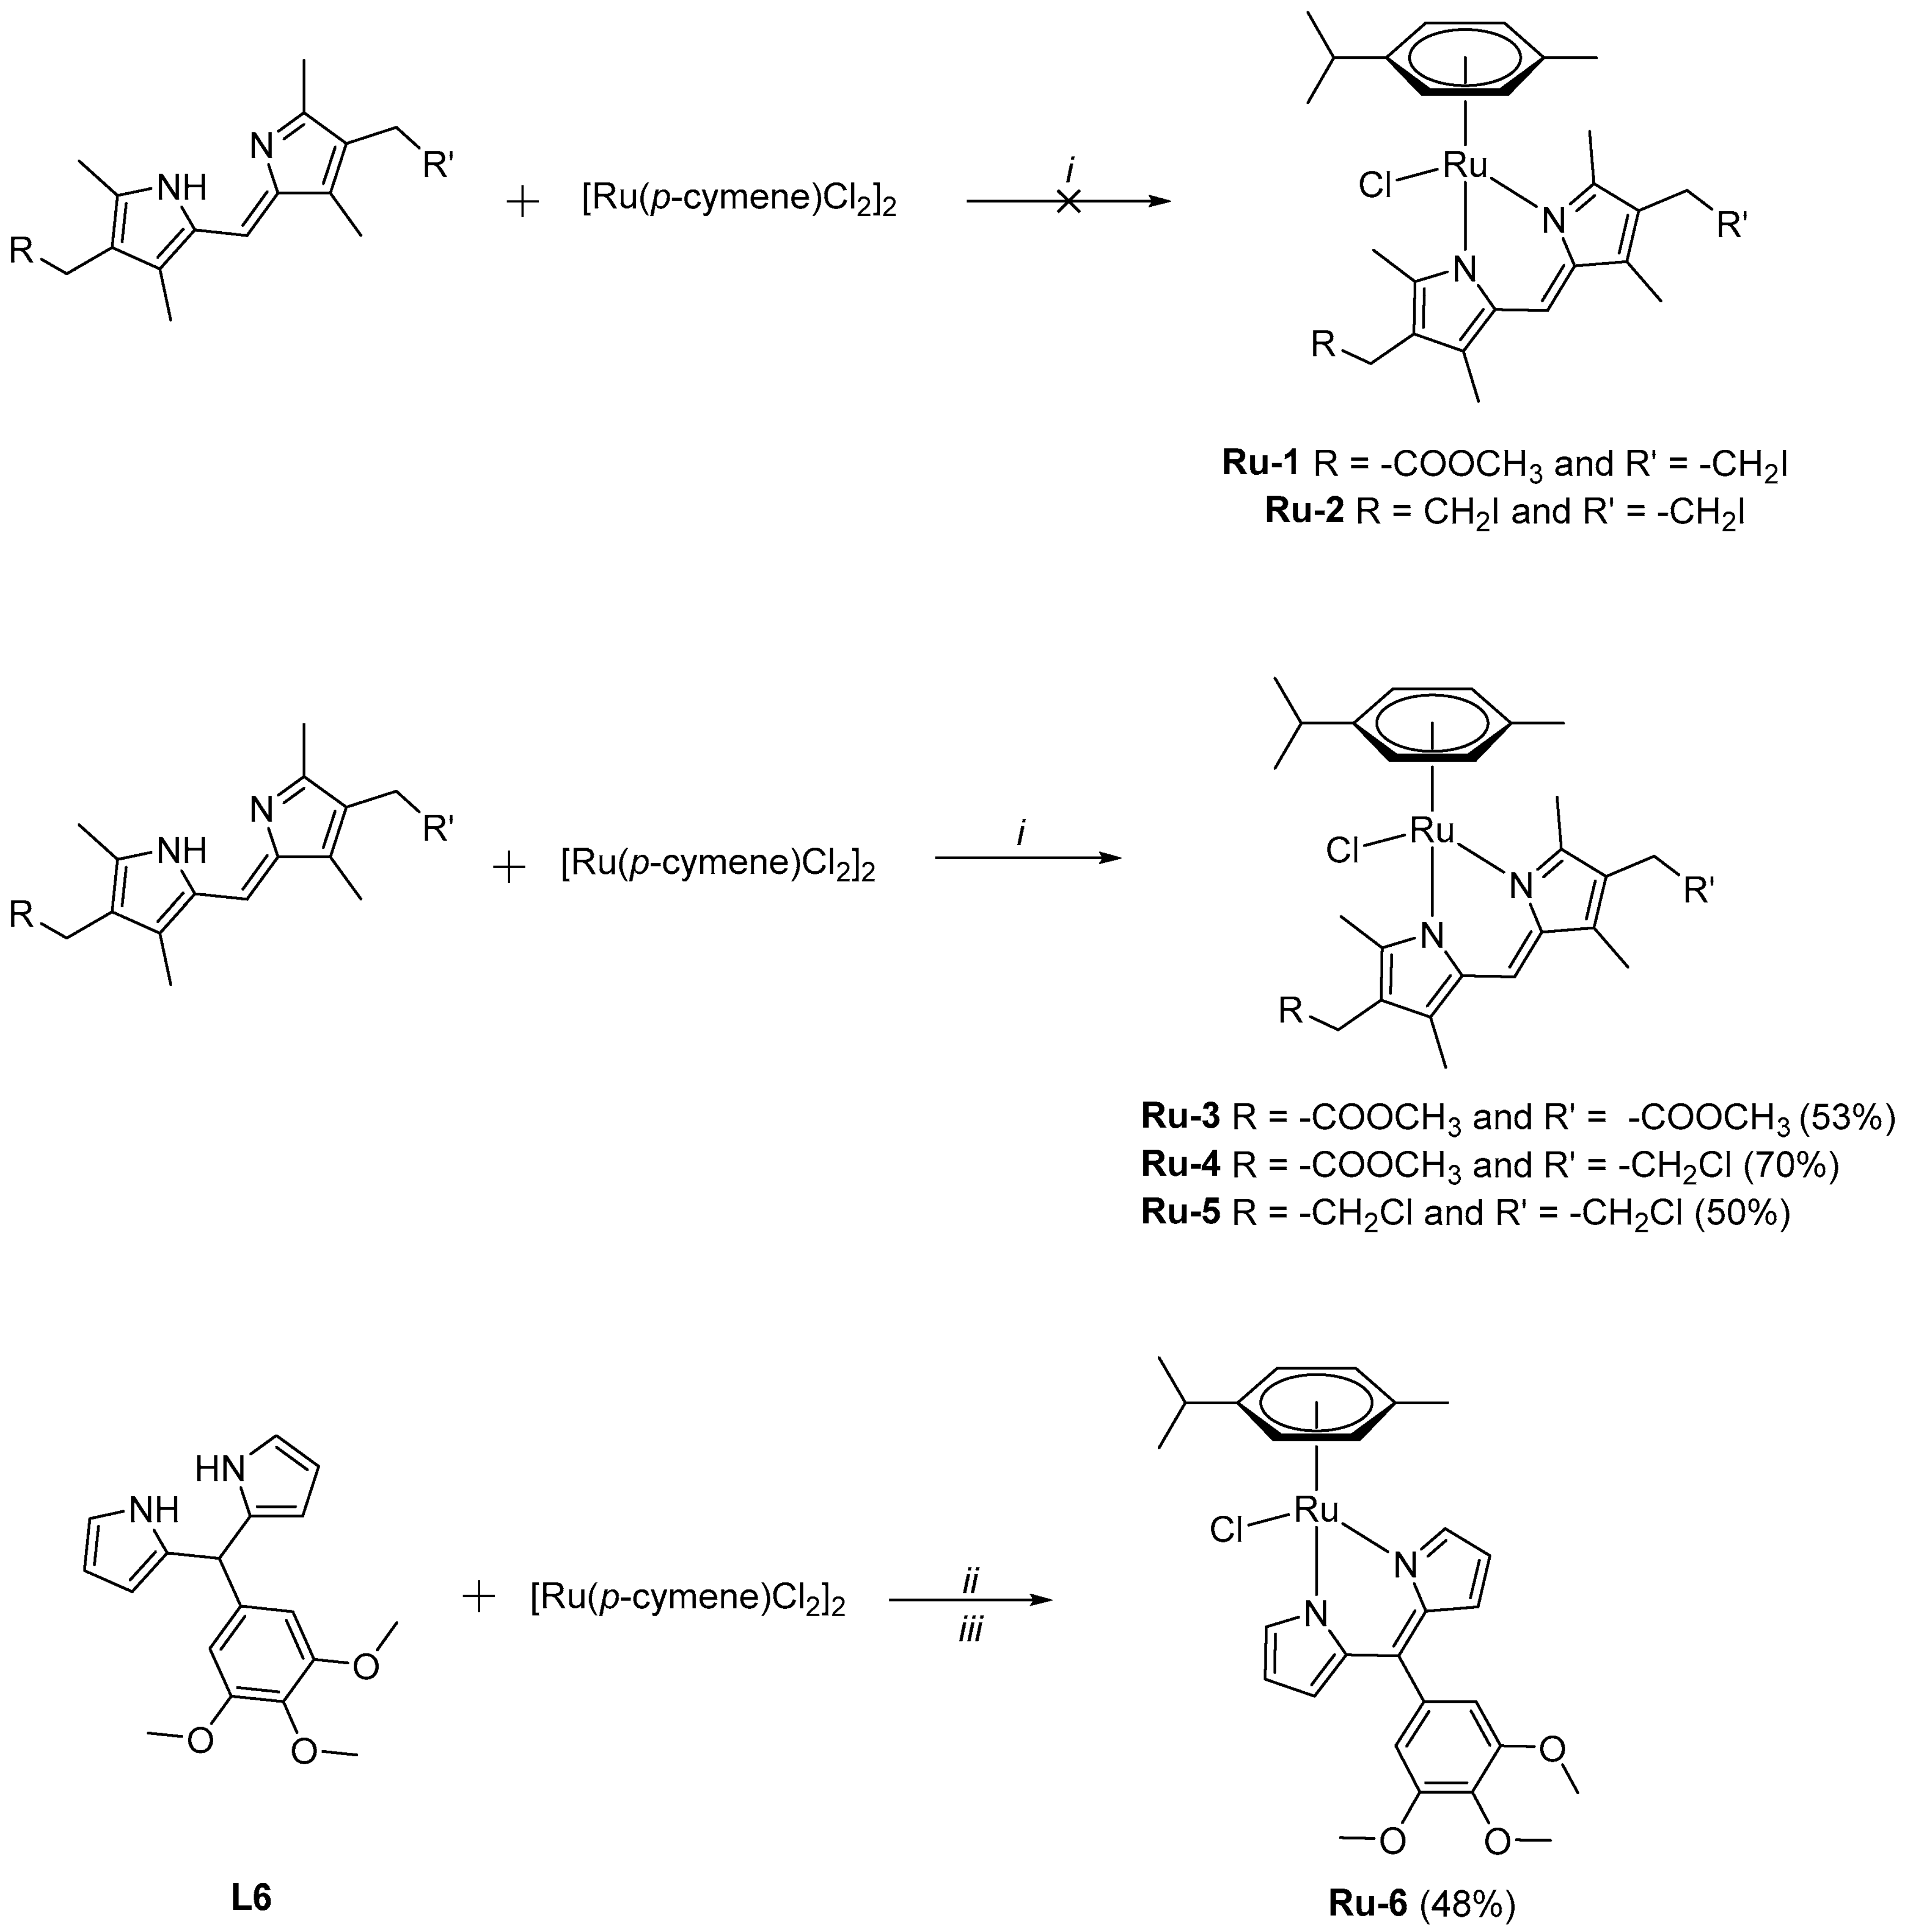
2.1. Synthesis of Ligands L1–L5
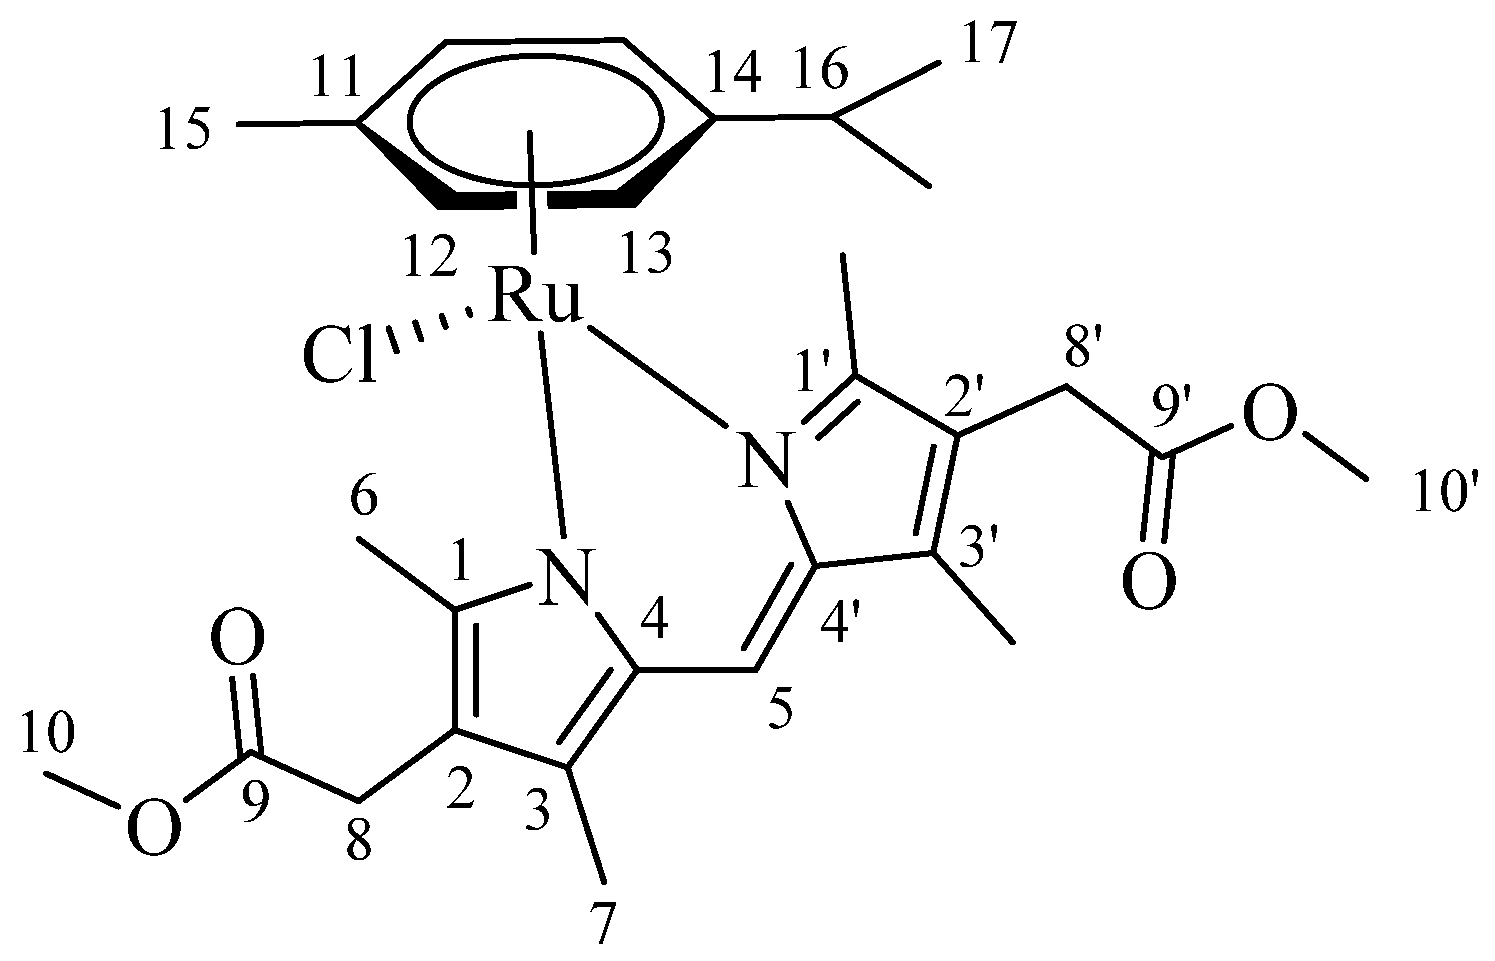
2.2. Synthesis of Complexes Ru-1–Ru-6
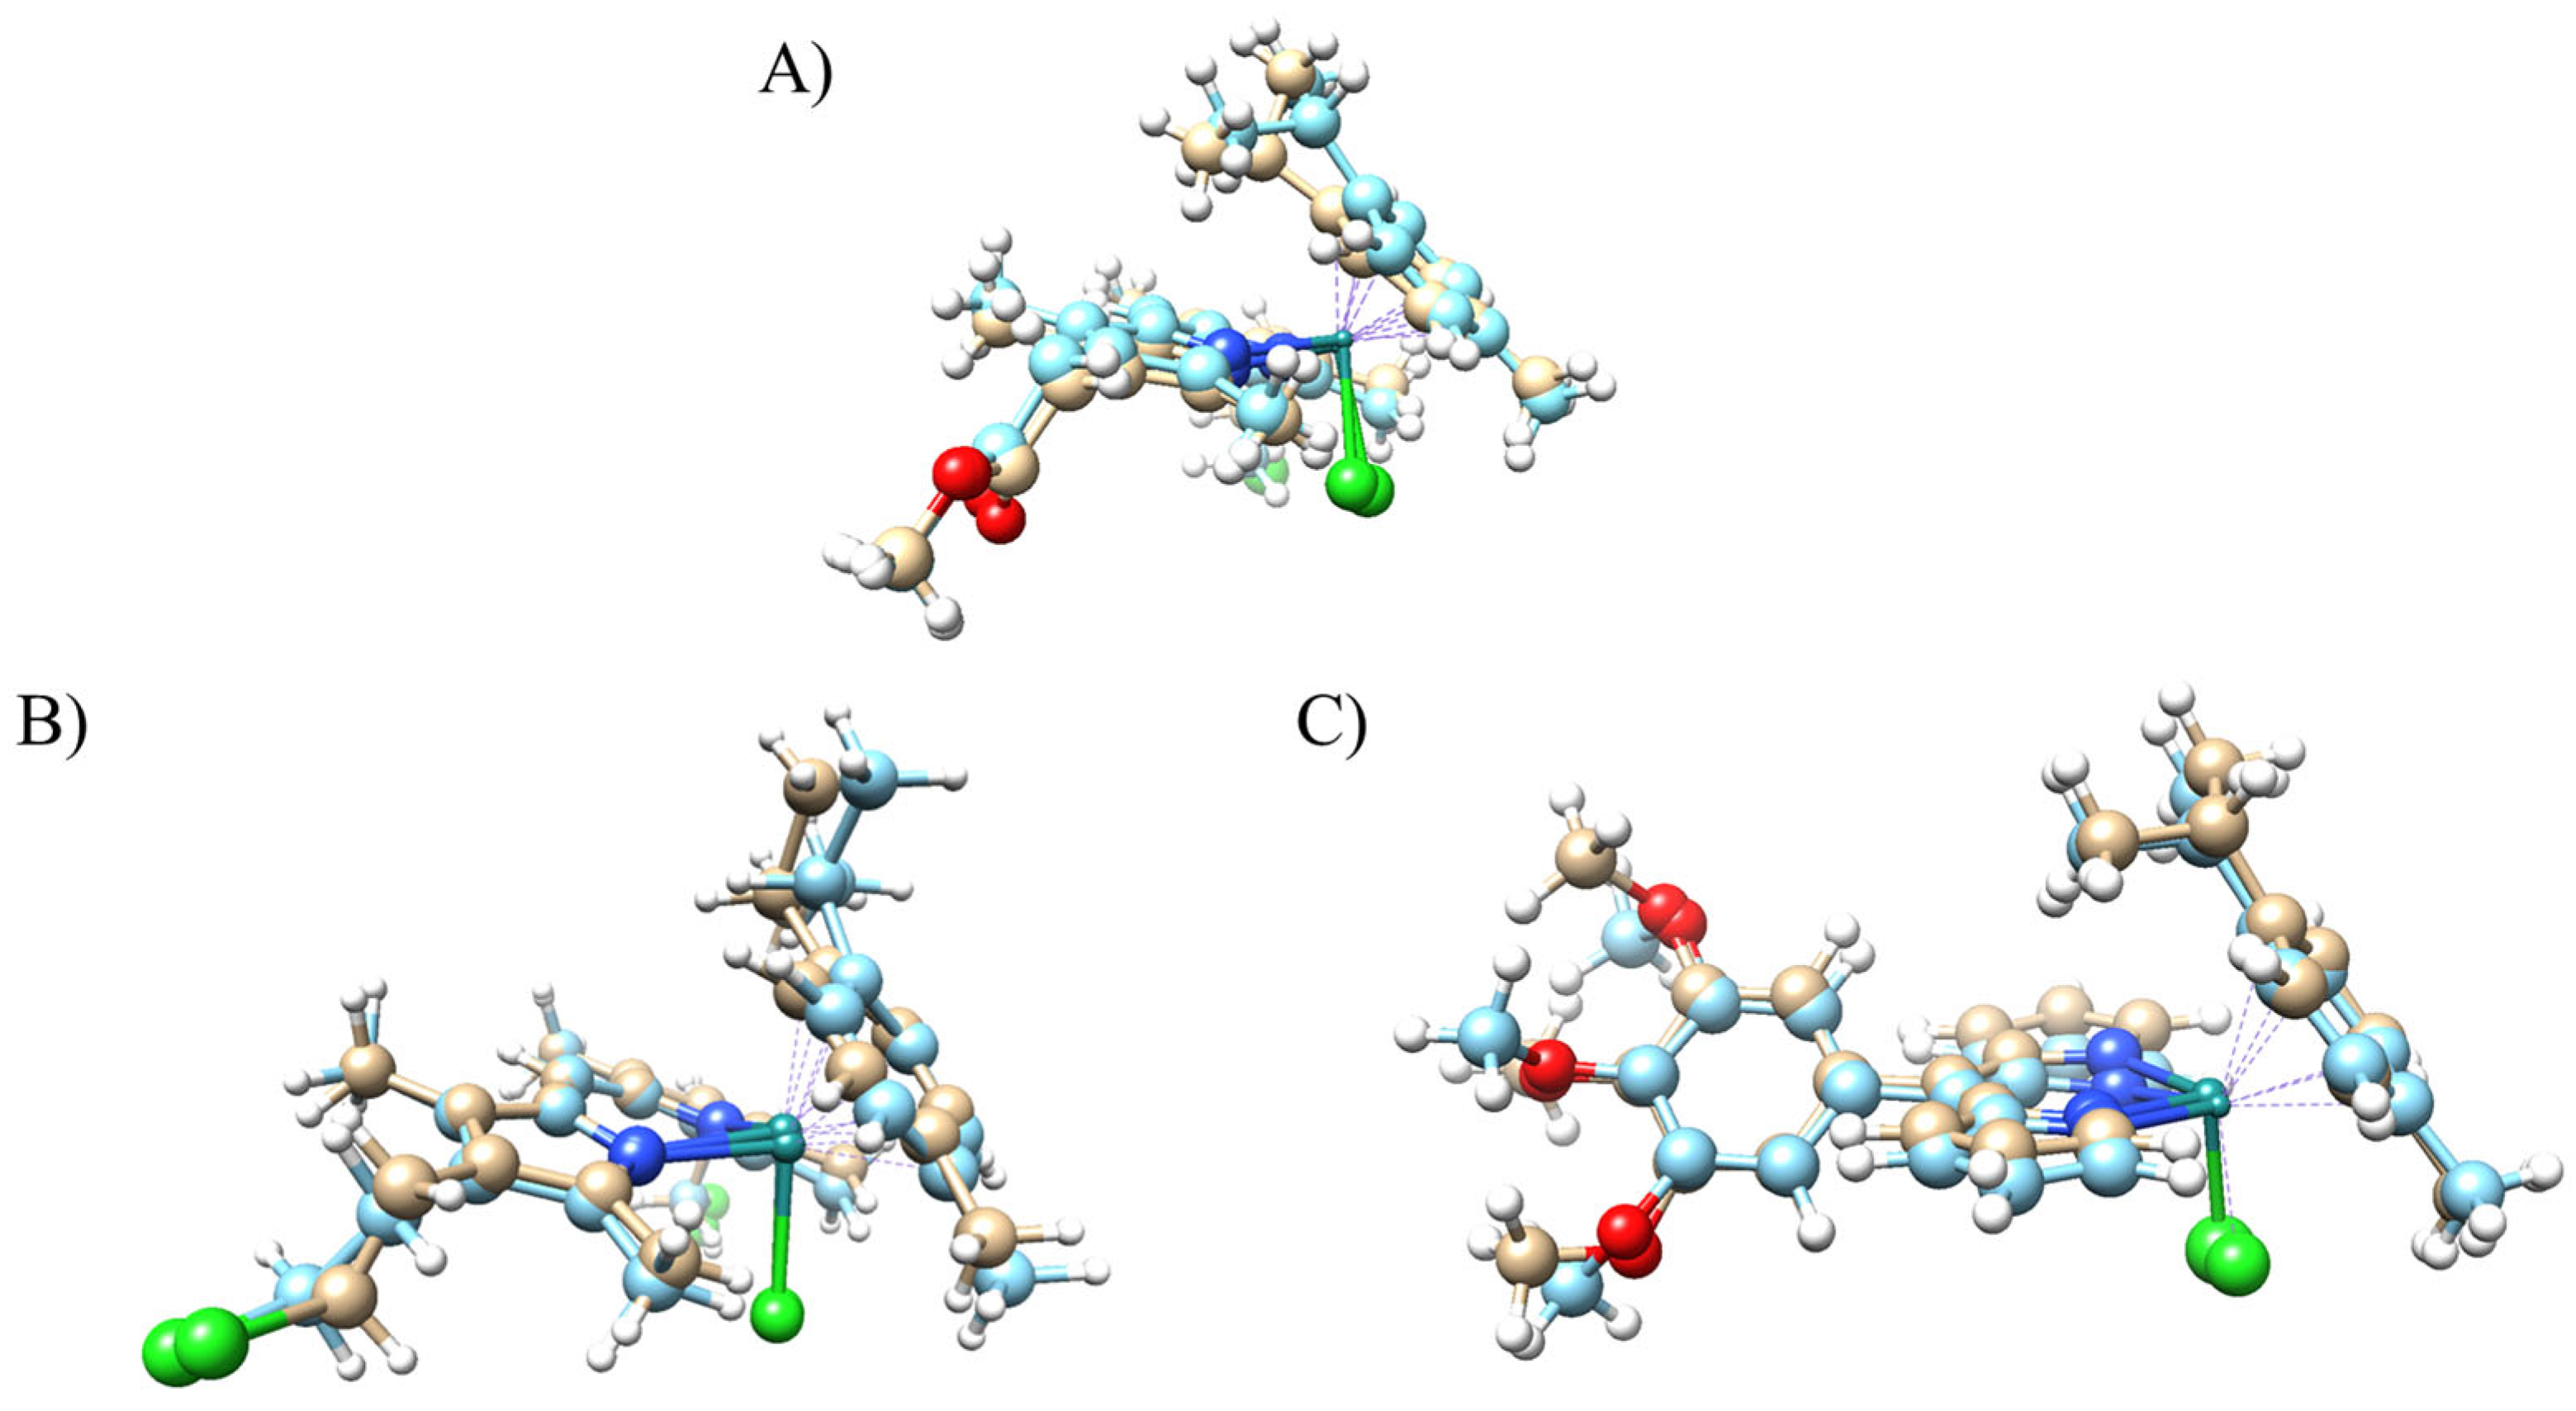
2.3. Crystal Structures
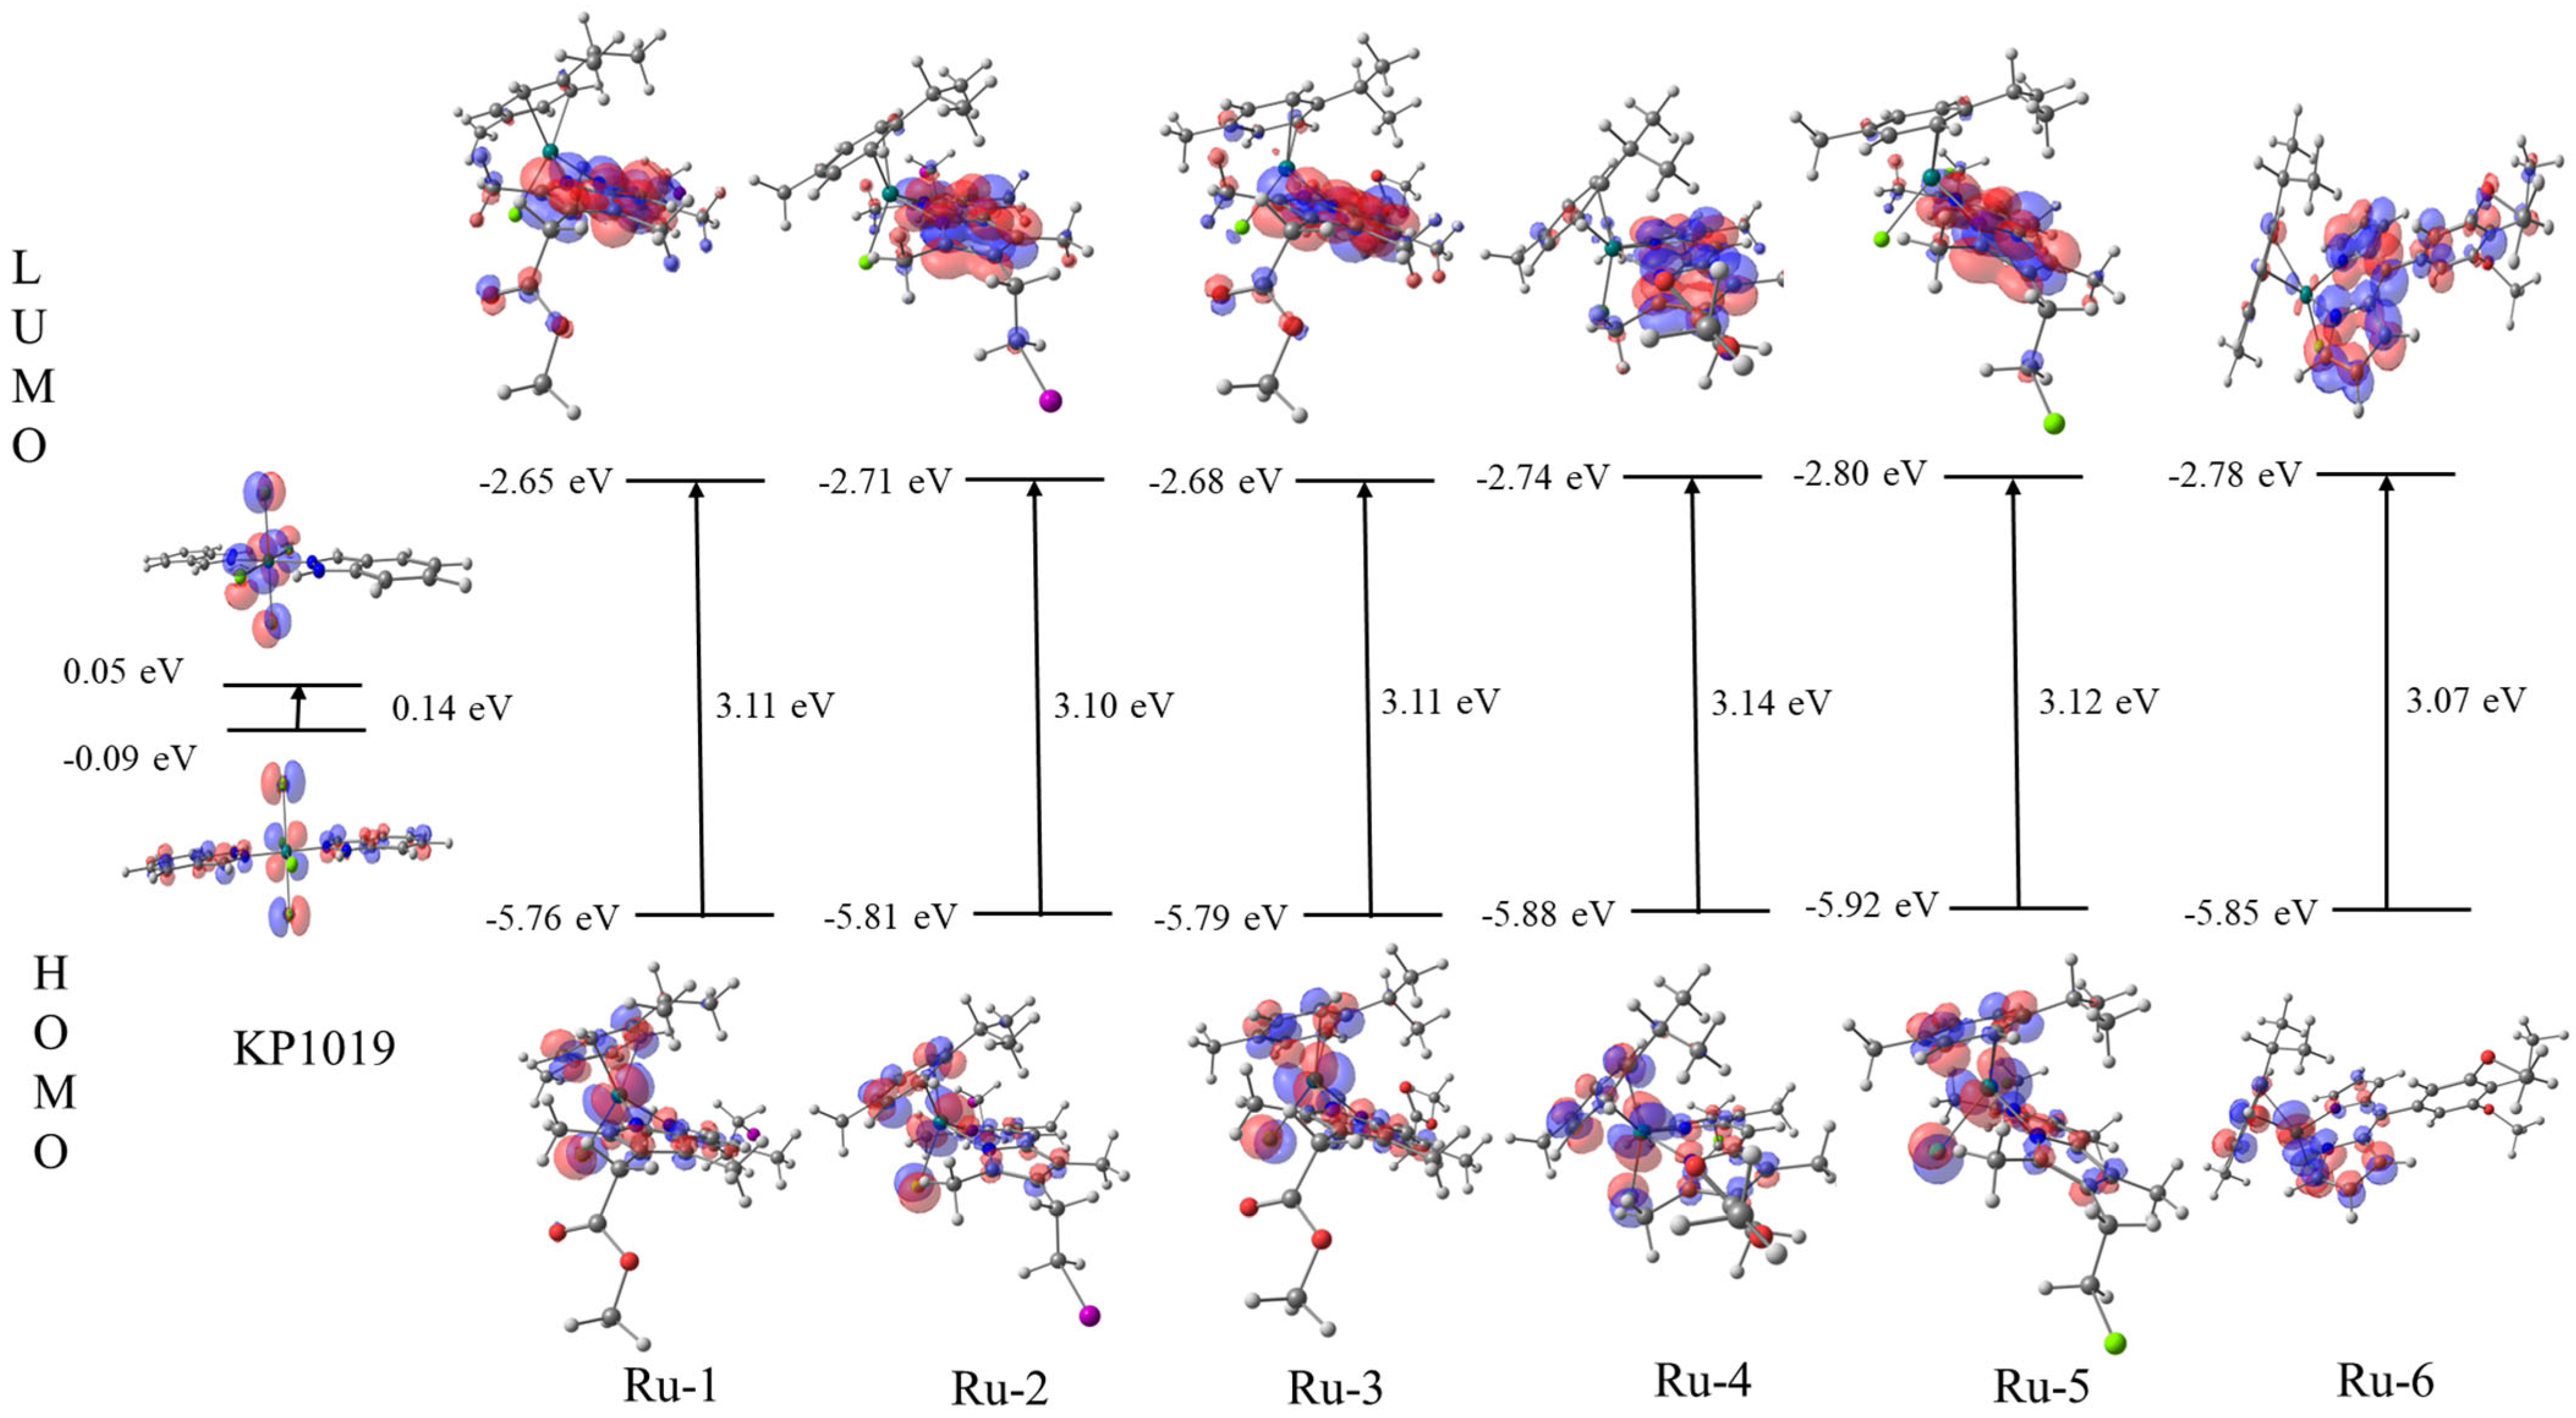
2.4. Frontier Molecular Orbitals (FMOs)
2.5. Stability Studies
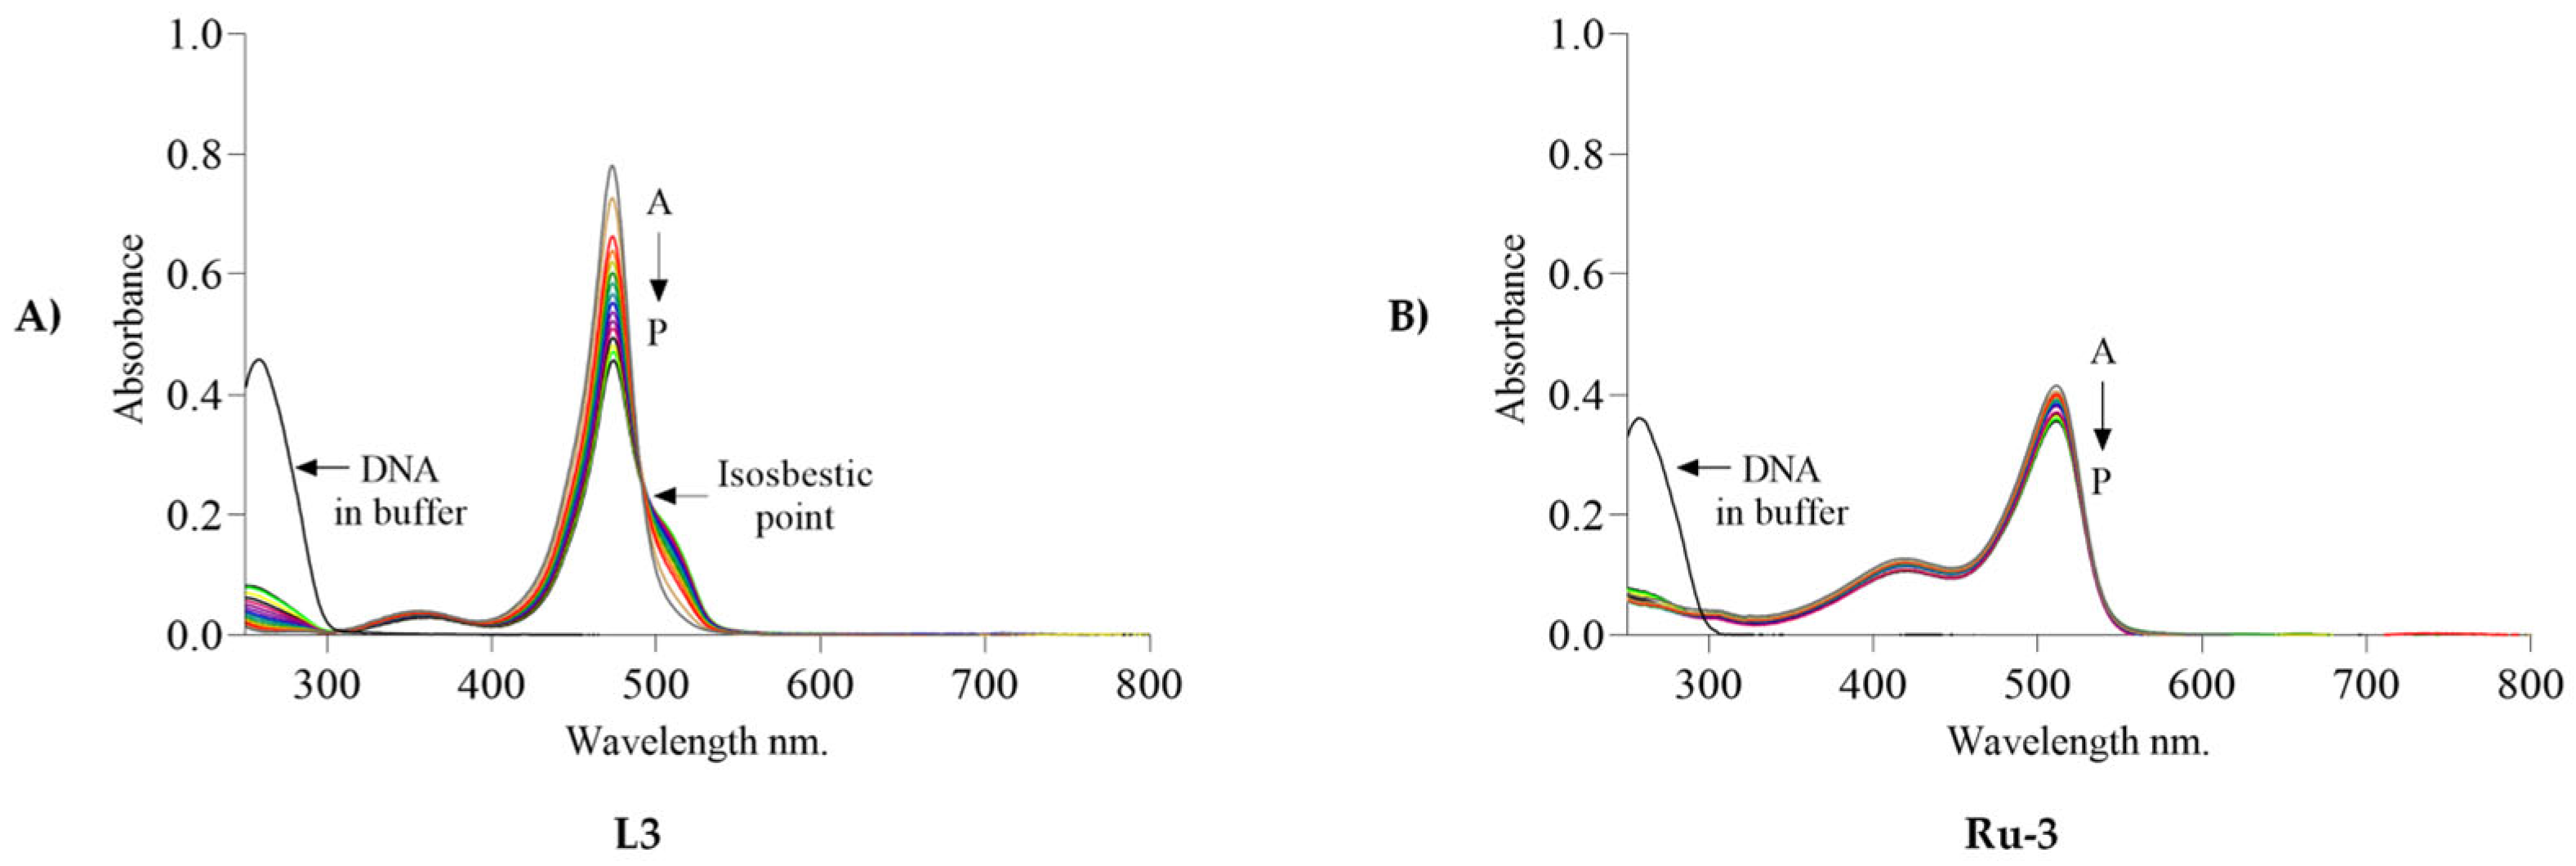
2.6. UV–vis Titration Studies
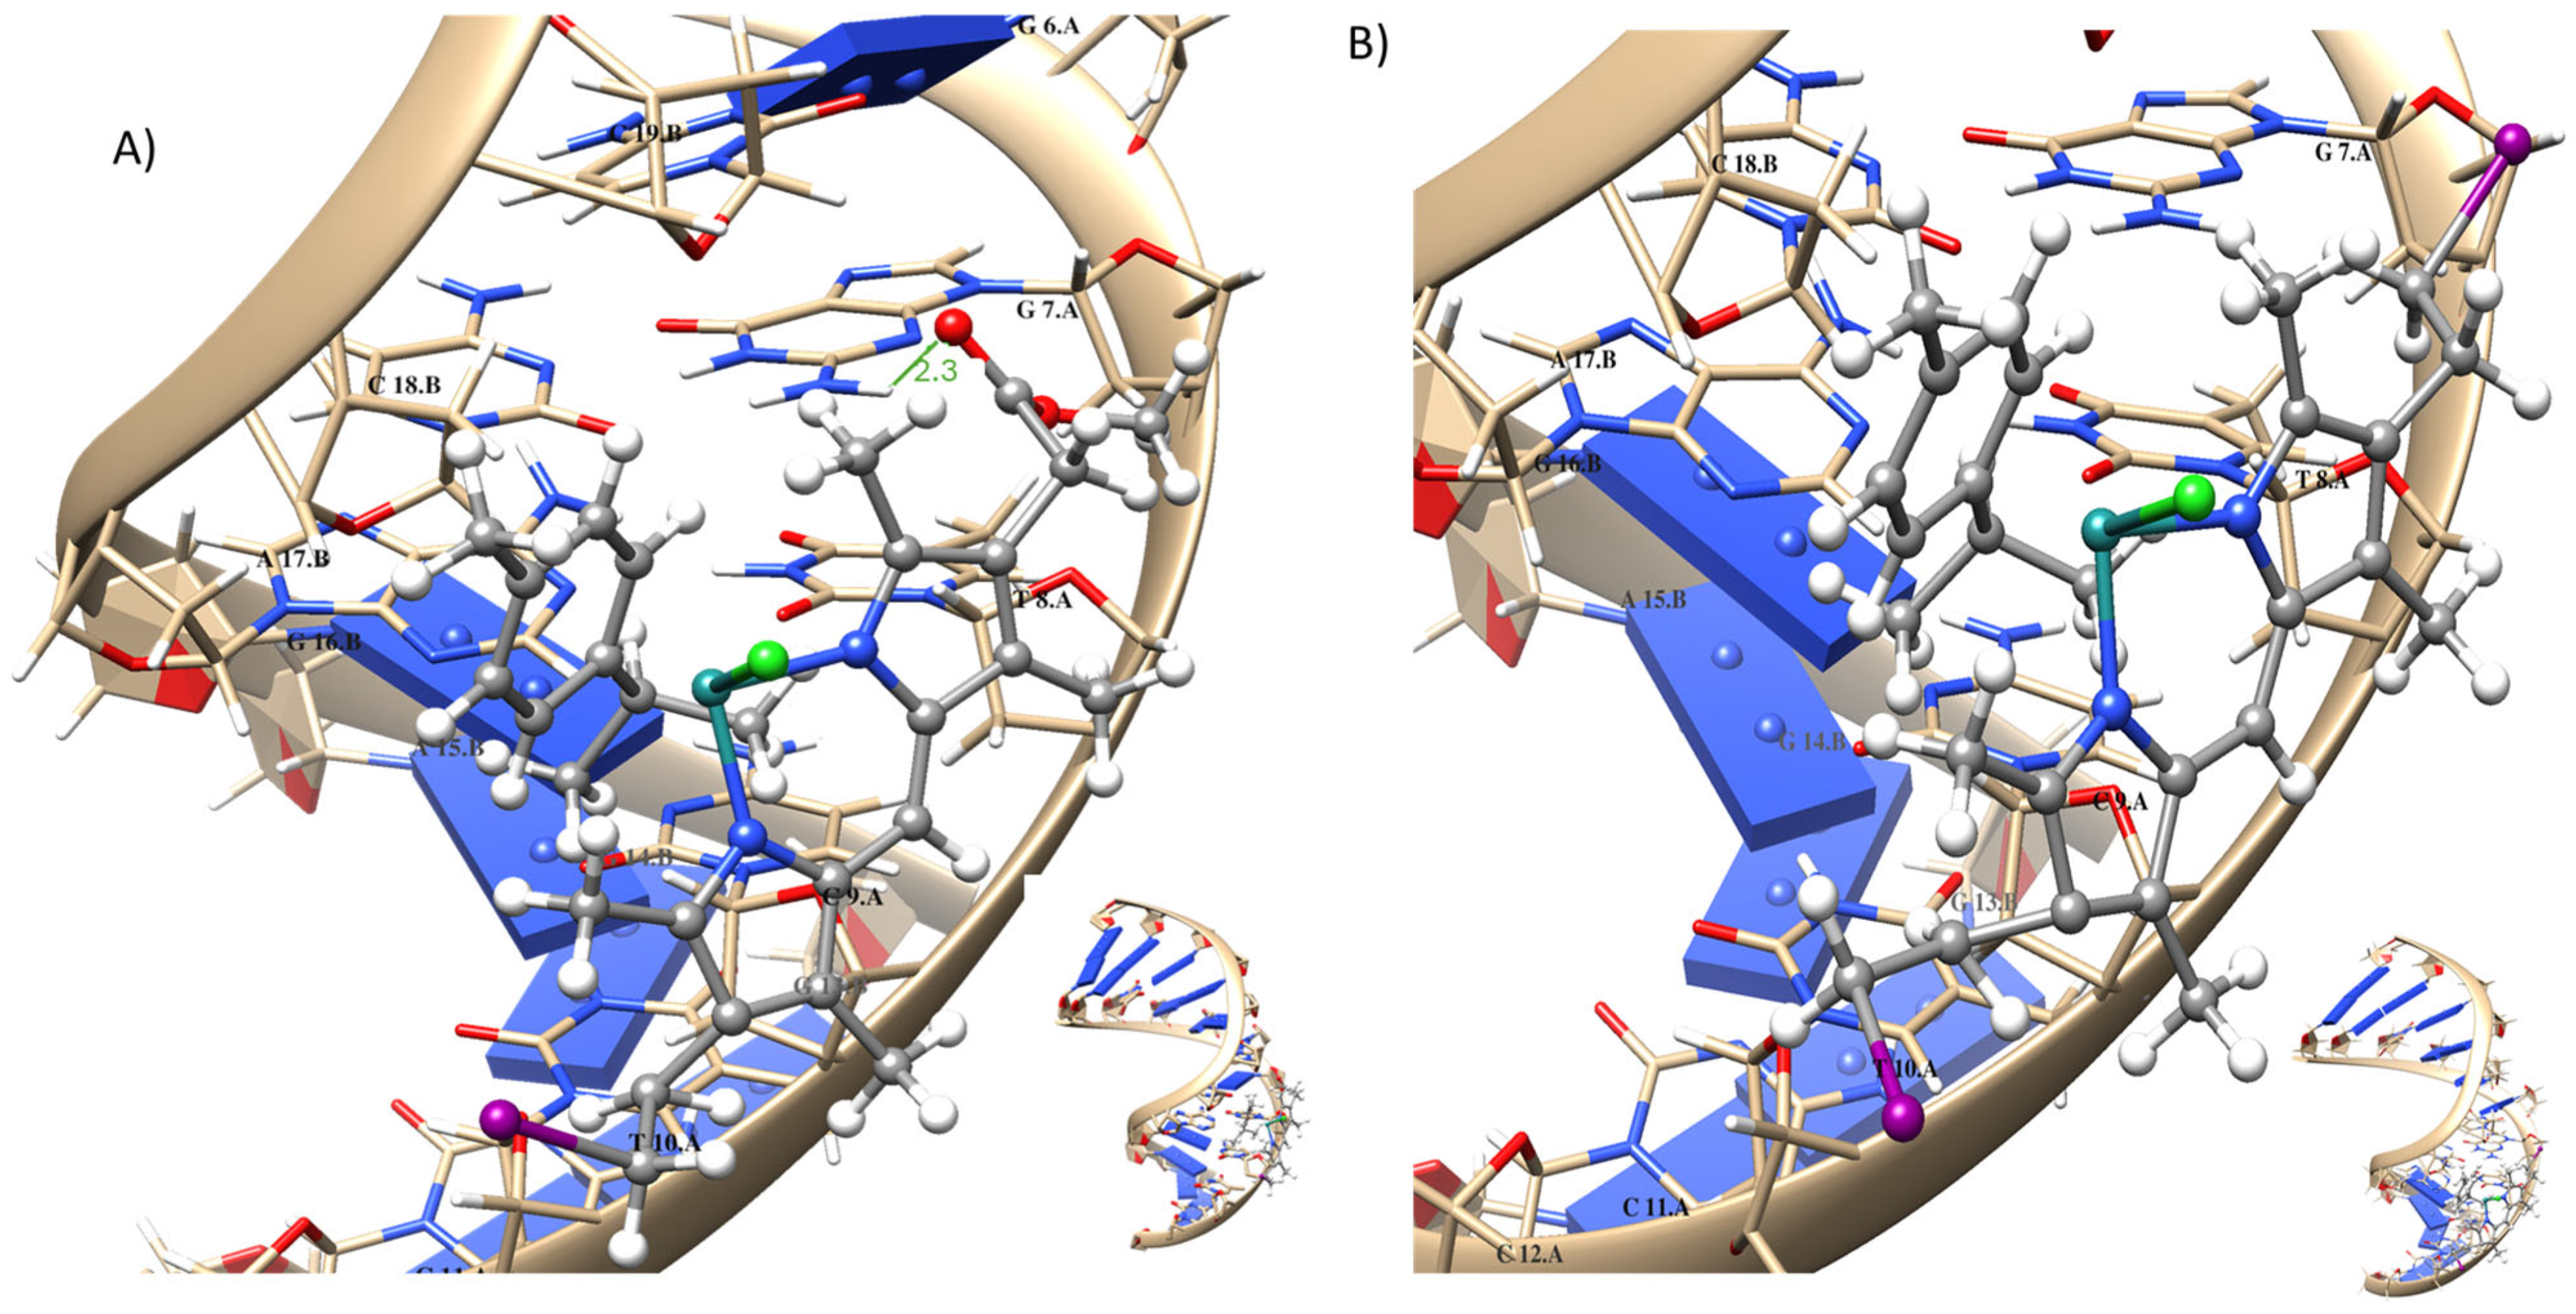
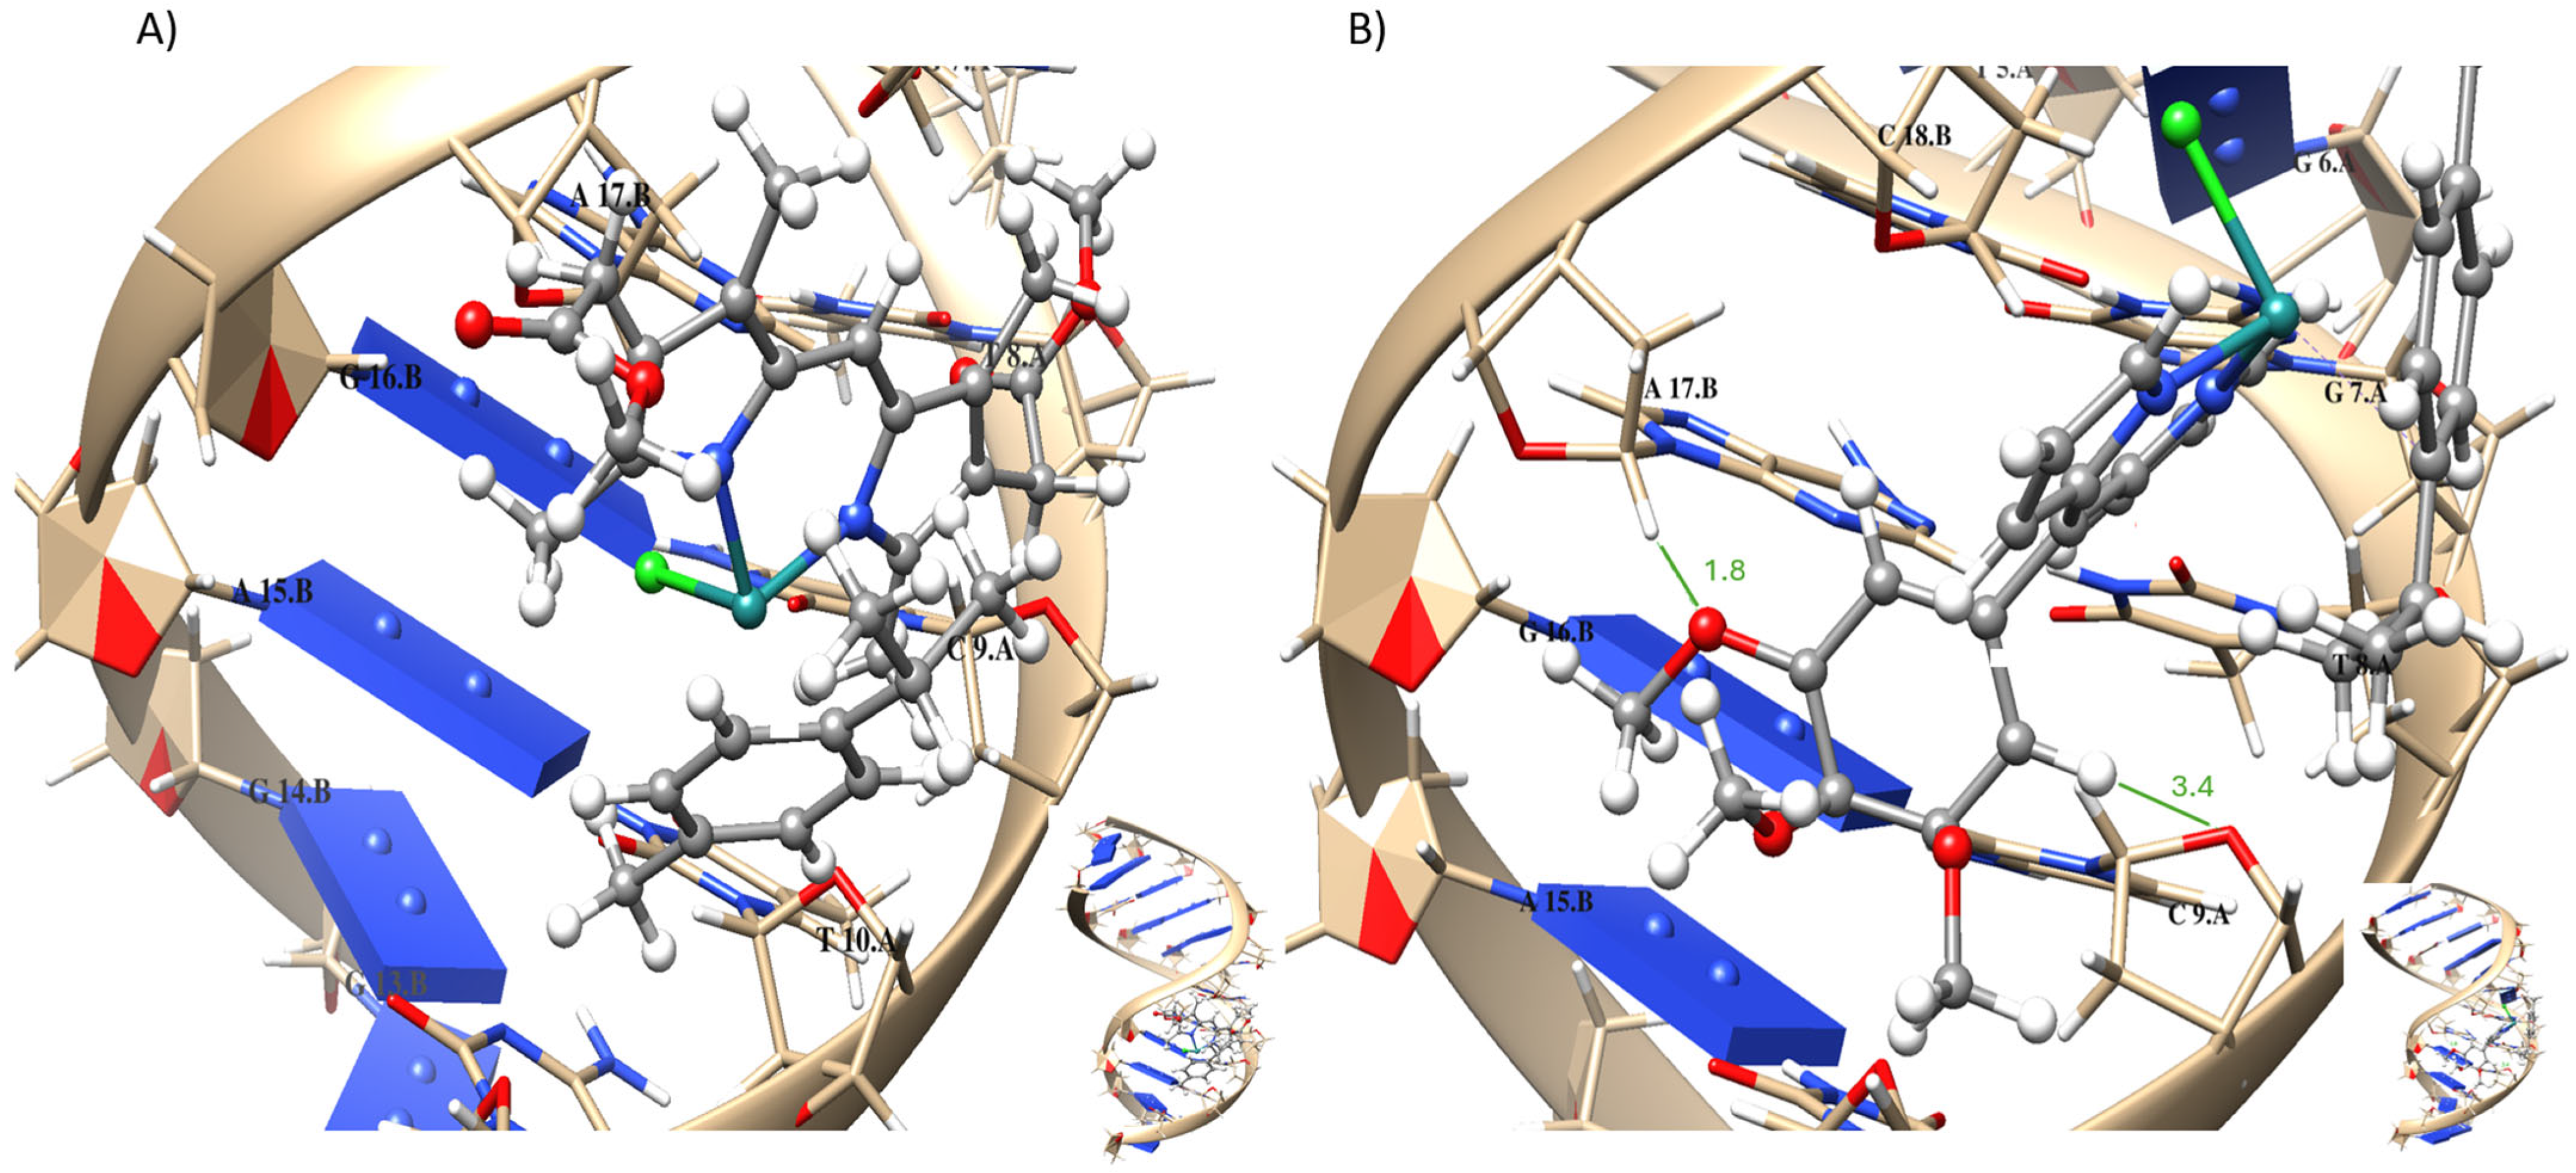
2.7. Molecular Modeling
3. Materials and Methods
3.1. X-Ray Diffraction Crystallography
3.2. Computational Details
3.3. Titration Experiments
3.4. Synthesis of Tert-butyl 4-(2-chloroethyl)-3,5-dimethyl-1H-pyrrole-2-carboxylate (pyrrole F)
3.5. Synthesis of Dipyrrin Ligands
3.5.1. Methyl (Z)-2-(2-((4-(2-methoxy-2-oxoethyl)-3,5-dimethyl-1H-pyrrol-2-yl)methylene)-3,5-dimethyl-2H-pyrrol-4-yl)acetate (L1)
3.5.2. (Z)-3-(2-Iodoethyl)-5-((4-(2-iodoethyl)-3,5-dimethyl-2H-pyrrol-2-ylidene)methyl)-2,4-dimethyl-1H-pyrrole (L2)
3.5.3. Methyl (Z)-2-(2-((4-(2-methoxy-2-oxoethyl)-3,5-dimethyl-1H-pyrrol-2-yl)methylene)-3,5-dimethyl-2H-pyrrol-4-yl)acetate (L3)
3.5.4. Methyl (Z)-2-(2-((4-(2-chloroethyl)-3,5-dimethyl-1H-pyrrol-2-yl)methylene)-3,5-dimethyl-2H-pyrrol-4-yl)acetate (L4)
3.5.5. (Z)-3-(2-Chloroethyl)-5-((4-(2-chloroethyl)-3,5-dimethyl-2H-pyrrol-2-ylidene)methyl)-2,4-dimethyl-1H-pyrrole (L5)
3.6. Synthesis of Ruthenium Complexes
3.6.1. Synthesis of Compound Ru-3
3.6.2. Synthesis of Compound Ru-4
3.6.3. Synthesis of Compound Ru-5
3.6.4. Synthesis of Compound Ru-6
4. Conclusions
Supplementary Materials
Author Contributions
Funding
Institutional Review Board Statement
Informed Consent Statement
Data Availability Statement
Acknowledgments
Conflicts of Interest
References
- Highley, M.S.; Landuyt, B.; Prenen, H.; Harper, P.G.; De Bruijn, E.A. The Nitrogen Mustards. Pharmacol. Rev. 2022, 74, 552–599. [Google Scholar] [CrossRef] [PubMed]
- Delahousse, J.; Molina, L.; Paci, A. Cyclophosphamide and analogues; a matter of dose and schedule for dual anticancer activities. Cancer Lett. 2024, 598, 217119. [Google Scholar] [CrossRef] [PubMed]
- Patra, S.; Dey, J.; Kar, S.; Chakraborty, A. Delivery of Chlorambucil to the Brain Using Surface Modified Solid Lipid Nanoparticles. ACS Appl. Bio Mater. 2024, 7, 3403–3413. [Google Scholar] [CrossRef]
- Raber, J.; Zhu, C.; Eriksson, L.A. Theoretical Study of Cisplatin Binding to DNA: The Importance of Initial Complex Stabilization. J. Phys. Chem. B 2005, 109, 11006–11015. [Google Scholar] [CrossRef]
- Romani, A.M.P. Cisplatin in cancer treatment. Biochem. Pharmacol. 2022, 206, 115323. [Google Scholar] [CrossRef]
- Wang, D.; Lippard, S.J. Cellular processing of platinum anticancer drugs. Nat. Rev. Drug Discov. 2005, 4, 307–320. [Google Scholar] [CrossRef] [PubMed]
- Oun, R.; Moussa, Y.E.; Wheate, N.J. The side effects of platinum-based chemotherapy drugs: A review for chemists. Dalton Trans. 2018, 47, 6645–6653. [Google Scholar] [CrossRef]
- Gamberi, T.; Hanif, M. Metal-Based Complexes in Cancer Treatment. Biomedicines 2022, 10, 2573. [Google Scholar] [CrossRef]
- Alessio, E.; Messori, L. NAMI-A and KP1019/1339, Two Iconic Ruthenium Anticancer Drug Candidates Face-to-Face: A Case Story in Medicinal Inorganic Chemistry. Molecules 2019, 24, 1995. [Google Scholar] [CrossRef]
- Liu, H.-K.; Sadler, P.J. Metal Complexes as DNA Intercalators. Acc. Chem. Res. 2011, 44, 349–359. [Google Scholar] [CrossRef]
- Alagesan, M.; Sathyadevi, P.; Krishnamoorthy, P.; Bhuvanesh, N.S.P.; Dharmaraj, N. DMSO containing ruthenium(ii) hydrazone complexes: In vitro evaluation of biomolecular interaction and anticancer activity. Dalton Trans. 2014, 43, 15829–15840. [Google Scholar] [CrossRef] [PubMed]
- Ganeshpandian, M.; Loganathan, R.; Suresh, E.; Riyasdeen, A.; Akbarsha, M.A.; Palaniandavar, M. New ruthenium(ii) arene complexes of anthracenyl-appended diazacycloalkanes: Effect of ligand intercalation and hydrophobicity on DNA and protein binding and cleavage and cytotoxicity. Dalton Trans. 2014, 43, 1203–1219. [Google Scholar] [CrossRef]
- Kilpin, K.J.; Clavel, C.M.; Edafe, F.; Dyson, P.J. Naphthalimide-Tagged Ruthenium–Arene Anticancer Complexes: Combining Coordination with Intercalation. Organometallics 2012, 31, 7031–7039. [Google Scholar] [CrossRef]
- Uma Maheswari, P.; Palaniandavar, M. DNA binding and cleavage properties of certain tetrammine ruthenium(II) complexes of modified 1,10-phenanthrolines—Effect of hydrogen-bonding on DNA-binding affinity. J. Inorg. Biochem. 2004, 98, 219–230. [Google Scholar] [CrossRef]
- Gasser, G.; Ott, I.; Metzler-Nolte, N. Organometallic anticancer compounds. J. Med. Chem. 2011, 54, 3–25. [Google Scholar] [CrossRef] [PubMed]
- Swaminathan, S.; Karvembu, R. Dichloro Ru(II)-p-cymene-1,3,5-triaza-7-phosphaadamantane (RAPTA-C): A Case Study. ACS Pharmacol. Transl. Sci. 2023, 6, 982–996. [Google Scholar] [CrossRef] [PubMed]
- Debreczeni, J.É.; Bullock, A.N.; Atilla, G.E.; Williams, D.S.; Bregman, H.; Knapp, S.; Meggers, E. Ruthenium Half-Sandwich Complexes Bound to Protein Kinase Pim-1. Angew. Chem. Int. Ed. 2006, 45, 1580–1585. [Google Scholar] [CrossRef]
- Bregman, H.; Williams, D.S.; Meggers, E. Pyrido[2,3-a]pyrrolo[3,4-c]carbazole-5,7(6H)-diones: Synthesis, Cyclometalation, and Protein Kinase Inhibition. Synthesis 2005, 2005, 1521–1527. [Google Scholar] [CrossRef]
- Meggers, E.; Atilla-Gokcumen, G.E.; Bregman, H.; Maksimoska, J.; Mulcahy, S.P.; Pagano, N.; Williams, D.S. Exploring Chemical Space with Organometallics: Ruthenium Complexes as Protein Kinase Inhibitors. Synlett 2007, 2007, 1177–1189. [Google Scholar] [CrossRef]
- Wood, T.E.; Thompson, A. Advances in the Chemistry of Dipyrrins and Their Complexes. Chem. Rev. 2007, 107, 1831–1861. [Google Scholar] [CrossRef]
- Mahanta, C.S.; Ravichandiran, V.; Swain, S.P. Recent Developments in the Design of New Water-Soluble Boron Dipyrromethenes and Their Applications: An Updated Review. ACS Appl. Bio Mater. 2023, 6, 2995–3018. [Google Scholar] [CrossRef] [PubMed]
- Shikha Singh, R.; Prasad Paitandi, R.; Kumar Gupta, R.; Shankar Pandey, D. Recent developments in metal dipyrrin complexes: Design, synthesis, and applications. Coord. Chem. Rev. 2020, 414, 213269. [Google Scholar] [CrossRef]
- Gibault, F.; Bailly, F.; Corvaisier, M.; Coevoet, M.; Huet, G.; Melnyk, P.; Cotelle, P. Molecular Features of the YAP Inhibitor Verteporfin: Synthesis of Hexasubstituted Dipyrrins as Potential Inhibitors of YAP/TAZ, the Downstream Effectors of the Hippo Pathway. ChemMedChem 2017, 12, 954–961. [Google Scholar] [CrossRef] [PubMed]
- Kurzwernhart, A.; Kandioller, W.; Bächler, S.; Bartel, C.; Martic, S.; Buczkowska, M.; Mühlgassner, G.; Jakupec, M.A.; Kraatz, H.-B.; Bednarski, P.J.; et al. Structure–Activity Relationships of Targeted RuII(η6-p-Cymene) Anticancer Complexes with Flavonol-Derived Ligands. J. Med. Chem. 2012, 55, 10512–10522. [Google Scholar] [CrossRef]
- Kurzwernhart, A.; Kandioller, W.; Bartel, C.; Bächler, S.; Trondl, R.; Mühlgassner, G.; Jakupec, M.A.; Arion, V.B.; Marko, D.; Keppler, B.K.; et al. Targeting the DNA-topoisomerase complex in a double-strike approach with a topoisomerase inhibiting moiety and covalent DNA binder. Chem. Commun. 2012, 48, 4839–4841. [Google Scholar] [CrossRef] [PubMed]
- Kurzwernhart, A.; Kandioller, W.; Enyedy, É.A.; Novak, M.; Jakupec, M.A.; Keppler, B.K.; Hartinger, C.G. 3-Hydroxyflavones vs. 3-hydroxyquinolinones: Structure–activity relationships and stability studies on RuII(arene) anticancer complexes with biologically active ligands. Dalton Trans. 2013, 42, 6193–6202. [Google Scholar] [CrossRef]
- Kandioller, W.; Balsano, E.; Meier, S.M.; Jungwirth, U.; Göschl, S.; Roller, A.; Jakupec, M.A.; Berger, W.; Keppler, B.K.; Hartinger, C.G. Organometallic anticancer complexes of lapachol: Metal centre-dependent formation of reactive oxygen species and correlation with cytotoxicity. Chem. Commun. 2013, 49, 3348–3350. [Google Scholar] [CrossRef]
- Arion, V.B.; Dobrov, A.; Göschl, S.; Jakupec, M.A.; Keppler, B.K.; Rapta, P. Ruthenium- and osmium-arene-based paullones bearing a TEMPO free-radical unit as potential anticancer drugs. Chem. Commun. 2012, 48, 8559–8561. [Google Scholar] [CrossRef]
- Meier, S.M.; Hanif, M.; Adhireksan, Z.; Pichler, V.; Novak, M.; Jirkovsky, E.; Jakupec, M.A.; Arion, V.B.; Davey, C.A.; Keppler, B.K.; et al. Novel metal(ii) arene 2-pyridinecarbothioamides: A rationale to orally active organometallic anticancer agents. Chem. Sci. 2013, 4, 1837–1846. [Google Scholar] [CrossRef]
- Nazarov, A.A.; Meier, S.M.; Zava, O.; Nosova, Y.N.; Milaeva, E.R.; Hartinger, C.G.; Dyson, P.J. Protein ruthenation and DNA alkylation: Chlorambucil-functionalized RAPTA complexes and their anticancer activity. Dalton Trans. 2015, 44, 3614–3623. [Google Scholar] [CrossRef]
- Gupta, R.K.; Pandey, R.; Sharma, G.; Prasad, R.; Koch, B.; Srikrishna, S.; Li, P.-Z.; Xu, Q.; Pandey, D.S. DNA Binding and Anti-Cancer Activity of Redox-Active Heteroleptic Piano-Stool Ru(II), Rh(III), and Ir(III) Complexes Containing 4-(2-Methoxypyridyl)phenyldipyrromethene. Inorg. Chem. 2013, 52, 3687–3698. [Google Scholar] [CrossRef] [PubMed]
- Paitandi, R.P.; Gupta, R.K.; Singh, R.S.; Sharma, G.; Koch, B.; Pandey, D.S. Interaction of ferrocene appended Ru(II), Rh(III) and Ir(III) dipyrrinato complexes with DNA/protein, molecular docking and antitumor activity. Eur. J. Med. Chem. 2014, 84, 17–29. [Google Scholar] [CrossRef] [PubMed]
- Gupta, R.K.; Sharma, G.; Pandey, R.; Kumar, A.; Koch, B.; Li, P.-Z.; Xu, Q.; Pandey, D.S. DNA/Protein Binding, Molecular Docking, and in Vitro Anticancer Activity of Some Thioether-Dipyrrinato Complexes. Inorg. Chem. 2013, 52, 13984–13996. [Google Scholar] [CrossRef]
- Paitandi, R.P.; Singh, R.S.; Mukhopadhyay, S.; Sharma, G.; Koch, B.; Vishnoi, P.; Pandey, D.S. Synthesis, characterization, DNA binding and cytotoxicity of fluoro-dipyrrin based arene ruthenium(II) complexes. Inorganica Chim. Acta 2017, 454, 117–127. [Google Scholar] [CrossRef]
- Yadav, M.; Singh, A.K.; Maiti, B.; Pandey, D.S. Heteroleptic Arene Ruthenium Complexes Based on meso-Substituted Dipyrrins: Synthesis, Structure, Reactivity, and Electrochemical Studies. Inorg. Chem. 2009, 48, 7593–7603. [Google Scholar] [CrossRef]
- Smart, B.E. Fluorine substituent effects (on bioactivity). J. Fluor. Chem. 2001, 109, 3–11. [Google Scholar] [CrossRef]
- Lund, K.-l.A.R.; Thompson, A. Synthesis of Symmetric meso-H-Dipyrrin Hydrobromides from 2-Formyl-pyrroles. Synlett 2014, 25, 1142–1144. [Google Scholar] [CrossRef]
- Smith, K.M.; Pandey, R.K. Syntheses of isomers of protoporphyrin-IX with permuted propionic side-chains. J. Heterocycl. Chem. 1985, 22, 1041–1044. [Google Scholar] [CrossRef]
- Wilcken, R.; Zimmermann, M.O.; Lange, A.; Joerger, A.C.; Boeckler, F.M. Principles and Applications of Halogen Bonding in Medicinal Chemistry and Chemical Biology. J. Med. Chem. 2013, 56, 1363–1388. [Google Scholar] [CrossRef]
- Auffinger, P.; Hays, F.A.; Westhof, E.; Ho, P.S. Halogen bonds in biological molecules. Proc. Natl. Acad. Sci. USA 2004, 101, 16789–16794. [Google Scholar] [CrossRef]
- Ahmed, B.; Barukial, P.; Bezbaruah, B. Some halogenated anticancer agents, role of halide (-X) and their interaction mechanism with AT/GC base pairs: A computational study. J. Indian Chem. Soc. 2023, 100, 101027. [Google Scholar] [CrossRef]
- MacDonald, S.F. DIPYRRYLMETHANES. J. Am. Chem. Soc. 1957, 79, 2659. [Google Scholar] [CrossRef]
- Treibs, A.; Häberle, N. Über die Synthese und die Elektronenspektren ms-substituierter Porphine. Justus Liebigs Ann. Chem. 1968, 718, 183–207. [Google Scholar] [CrossRef]
- Singh, N.K.; Kumar, Y.; Paitandi, R.P.; Tiwari, R.K.; Kumar, A.; Pandey, D.S. DNA/protein binding and anticancer activity of ruthenium (II) arene complexes based on quinoline dipyrrin. Inorganica Chim. Acta 2023, 545, 121241. [Google Scholar] [CrossRef]
- Abada, Z.; Cojean, S.; Pomel, S.; Ferrié, L.; Akagah, B.; Lormier, A.T.; Loiseau, P.M.; Figadère, B. Synthesis and antiprotozoal activity of original porphyrin precursors and derivatives. Eur. J. Med. Chem. 2013, 67, 158–165. [Google Scholar] [CrossRef]
- Gill, H.S.; Finger, I.; Božidarević, I.; Szydlo, F.; Scott, M.J. Preparation of α,β-unsubstituted meso-arylbidipyrrins via metal-templated, oxidative coupling of dipyrrins. New J. Chem. 2005, 29, 68–71. [Google Scholar] [CrossRef]
- Thoi, V.S.; Stork, J.R.; Magde, D.; Cohen, S.M. Luminescent Dipyrrinato Complexes of Trivalent Group 13 Metal Ions. Inorg. Chem. 2006, 45, 10688–10697. [Google Scholar] [CrossRef] [PubMed]
- Marchetti, F.; Pettinari, C.; Pettinari, R.; Cerquetella, A.; Cingolani, A.; Chan, E.J.; Kozawa, K.; Skelton, B.W.; White, A.H.; Wanke, R.; et al. Areneruthenium(II) 4-Acyl-5-pyrazolonate Derivatives: Coordination Chemistry, Redox Properties, and Reactivity. Inorg. Chem. 2007, 46, 8245–8257. [Google Scholar] [CrossRef]
- Murillo, M.I.; Restrepo-Acevedo, A.C.; Rocha-Roa, C.; Zacchino, S.; Svetaz, L.; Hernández-Ortega, S.; Abonia, R.; Le Lagadec, R.; Cuenú-Cabezas, F. Evaluation of the Antifungal Properties of Azomethine-Pyrazole Derivatives from a Structural Perspective. ChemistryOpen 2025, e202500132. [Google Scholar] [CrossRef]
- Chakraborty, D.; Chattaraj, P.K. Conceptual density functional theory based electronic structure principles. Chem. Sci. 2021, 12, 6264–6279. [Google Scholar] [CrossRef]
- Olsztynska, S.; Komorowska, M. (Eds.) Biomedical Engineering, Trends, Research and Technologies; IntechOpen: London, UK, 2011. [Google Scholar] [CrossRef]
- Liu, Y.-J.; Chao, H.; Tan, L.-F.; Yuan, Y.-X.; Wei, W.; Ji, L.-N. Interaction of polypyridyl ruthenium (II) complex containing asymmetric ligand with DNA. J. Inorg. Biochem. 2005, 99, 530–537. [Google Scholar] [CrossRef]
- Mbugua, S.N.; Sibuyi, N.R.S.; Njenga, L.W.; Odhiambo, R.A.; Wandiga, S.O.; Meyer, M.; Lalancette, R.A.; Onani, M.O. New Palladium(II) and Platinum(II) Complexes Based on Pyrrole Schiff Bases: Synthesis, Characterization, X-ray Structure, and Anticancer Activity. ACS Omega 2020, 5, 14942–14954. [Google Scholar] [CrossRef] [PubMed]
- Vardevanyan, P.O.; Antonyan, A.P.; Parsadanyan, M.A.; Davtyan, H.G.; Karapetyan, A.T. The binding of ethidium bromide with DNA: Interaction with single- and double-stranded structures. Exp. Mol. Med. 2003, 35, 527–533. [Google Scholar] [CrossRef]
- Aslanoglu, M. Electrochemical and Spectroscopic Studies of the Interaction of Proflavine with DNA. Anal. Sci. 2006, 22, 439–443. [Google Scholar] [CrossRef]
- Sirajuddin, M.; Ali, S.; Haider, A.; Shah, N.A.; Shah, A.; Khan, M.R. Synthesis, characterization, biological screenings and interaction with calf thymus DNA as well as electrochemical studies of adducts formed by azomethine [2-((3,5-dimethylphenylimino)methyl)phenol] and organotin(IV) chlorides. Polyhedron 2012, 40, 19–31. [Google Scholar] [CrossRef]
- Zelonka, R.A.; Baird, M.C. Benzene Complexes of Ruthenium(II). Can. J. Chem. 1972, 50, 3063–3072. [Google Scholar] [CrossRef]
- CrysAlisPro Oxford Diffraction; Agilent Technologies UK Ltd.: Yarnton, UK, 2017.
- Dolomanov, O.V.; Bourhis, L.J.; Gildea, R.J.; Howard, J.A.K.; Puschmann, H. OLEX2: A complete structure solution, refinement and analysis program. J. Appl. Crystallogr. 2009, 42, 339–341. [Google Scholar] [CrossRef]
- Impact, C. Diamond–crystal and molecular structure visualization. Kreuzherrenstr 2014, 102, 53227. [Google Scholar]
- Macrae, C.F.; Bruno, I.J.; Chisholm, J.A.; Edgington, P.R.; McCabe, P.; Pidcock, E.; Rodriguez-Monge, L.; Taylor, R.; van de Streek, J.; Wood, P.A. Mercury CSD 2.0—New features for the visualization and investigation of crystal structures. J. Appl. Crystallogr. 2008, 41, 466–470. [Google Scholar] [CrossRef]
- Xcalibur, C. System, CrysAlis CCD and CrysAlis RED, Versions 1.171. 36.32; Oxford Diffraction Ltd.: Abingdon, UK, 2013.
- Clark, R.C.; Reid, J.S. The analytical calculation of absorption in multifaceted crystals. Acta Crystallogr. Sect. A 1995, 51, 887–897. [Google Scholar] [CrossRef]
- Sheldrick, G. SHELXT—Integrated space-group and crystal-structure determination. Acta Crystallogr. Sect. A 2015, 71, 3–8. [Google Scholar] [CrossRef] [PubMed]
- Sheldrick, G. Crystal structure refinement with SHELXL. Acta Crystallogr. Sect. C 2015, 71, 3–8. [Google Scholar] [CrossRef] [PubMed]
- Farrugia, L. WinGX and ORTEP for Windows: An update. J. Appl. Crystallogr. 2012, 45, 849–854. [Google Scholar] [CrossRef]
- Lee, C.; Yang, W.; Parr, R.G. Development of the Colle-Salvetti correlation-energy formula into a functional of the electron density. Phys. Rev. B 1988, 37, 785–789. [Google Scholar] [CrossRef]
- Roy, L.E.; Hay, P.J.; Martin, R.L. Revised Basis Sets for the LANL Effective Core Potentials. J. Chem. Theory Comput. 2008, 4, 1029–1031. [Google Scholar] [CrossRef] [PubMed]
- Marenich, A.V.; Cramer, C.J.; Truhlar, D.G. Universal Solvation Model Based on Solute Electron Density and on a Continuum Model of the Solvent Defined by the Bulk Dielectric Constant and Atomic Surface Tensions. J. Phys. Chem. B 2009, 113, 6378–6396. [Google Scholar] [CrossRef]
- Marenich, A.V.; Jerome, S.V.; Cramer, C.J.; Truhlar, D.G. Charge Model 5: An Extension of Hirshfeld Population Analysis for the Accurate Description of Molecular Interactions in Gaseous and Condensed Phases. J. Chem. Theory Comput. 2012, 8, 527–541. [Google Scholar] [CrossRef]
- Frisch, M.J.; Trucks, G.W.; Schlegel, H.B.; Scuseria, G.E.; Robb, M.A.; Cheeseman, J.R.; Scalmani, G.; Barone, V.; Petersson, G.A.; Nakatsuji, H.; et al. Gaussian 16 Rev. C.01; Gaussian, Inc.: Wallingford, CT, USA, 2016. [Google Scholar]
- Takahara, P.M.; Rosenzweig, A.C.; Frederick, C.A.; Lippard, S.J. Crystal structure of double-stranded DNA containing the major adduct of the anticancer drug cisplatin. Nature 1995, 377, 649–652. [Google Scholar] [CrossRef]
- Hakkennes, M.L.A.; Buda, F.; Bonnet, S. MetalDock: An Open Access Docking Tool for Easy and Reproducible Docking of Metal Complexes. J. Chem. Inf. Model. 2023, 63, 7816–7825. [Google Scholar] [CrossRef]
- Morris, G.M.; Huey, R.; Lindstrom, W.; Sanner, M.F.; Belew, R.K.; Goodsell, D.S.; Olson, A.J. AutoDock4 and AutoDockTools4: Automated docking with selective receptor flexibility. J. Comput. Chem. 2009, 30, 2785–2791. [Google Scholar] [CrossRef]
- Morris, G.M.; Goodsell, D.S.; Halliday, R.S.; Huey, R.; Hart, W.E.; Belew, R.K.; Olson, A.J. Automated docking using a Lamarckian genetic algorithm and an empirical binding free energy function. J. Comput. Chem. 1998, 19, 1639–1662. [Google Scholar] [CrossRef]
- Pettersen, E.F.; Goddard, T.D.; Huang, C.C.; Couch, G.S.; Greenblatt, D.M.; Meng, E.C.; Ferrin, T.E. UCSF Chimera—A visualization system for exploratory research and analysis. J. Comput. Chem. 2004, 25, 1605–1612. [Google Scholar] [CrossRef] [PubMed]
- Maestro; Schrödinger LLC: New York, NY, USA, 2023.
- Sirajuddin, M.; Ali, S.; Badshah, A. Drug–DNA interactions and their study by UV–Visible, fluorescence spectroscopies and cyclic voltametry. J. Photochem. Photobiol. B Biol. 2013, 124, 1–19. [Google Scholar] [CrossRef] [PubMed]
- Stevanović, N.; Mazzeo, P.P.; Bacchi, A.; Matić, I.Z.; Đorđić Crnogorac, M.; Stanojković, T.; Vujčić, M.; Novaković, I.; Radanović, D.; Šumar-Ristović, M.; et al. Synthesis, characterization, antimicrobial and cytotoxic activity and DNA-binding properties of d-metal complexes with hydrazones of Girard’s T and P reagents. JBIC J. Biol. Inorg. Chem. 2021, 26, 863–880. [Google Scholar] [CrossRef]
- Cuartas, V.; Aragón-Muriel, A.; Liscano, Y.; Polo-Cerón, D.; Crespo-Ortiz, M.d.P.; Quiroga, J.; Abonia, R.; Insuasty, B. Anticancer activity of pyrimidodiazepines based on 2-chloro-4-anilinoquinazoline: Synthesis, DNA binding and molecular docking. RSC Adv. 2021, 11, 23310–23329. [Google Scholar] [CrossRef]


| Compound | L3 | Ru-6 | Ru-4 | Ru-5 |
|---|---|---|---|---|
| Emp. Formula | C19H24N2O4 | C28H31Cl1N2O3Ru | C28H36Cl2N2O2Ru | C27H35Cl3N2Ru |
| FW (g/mol) | 344 | 580 | 604 | 594 |
| Temperature (K) | 150(2) | 130(2) | 173(2) | 173(2) |
| λ (Å) | 0.71073 | 0.71073 | 1.54178 | 0.71073 |
| Crystal system | Triclinic | Triclinic | Monoclinic | Monoclinic |
| Space group | P-1 | P-1 | C2/c | P21/c |
| a (Å) | 7.346(4) | 11.586(14) | 30.047(5) | 14.276(5) |
| b (Å) | 7.866(4) | 12.987(2) | 11.541(2) | 11.337(3) |
| c (Å) | 8.466(4) | 14.649(3) | 17.2579(3) | 17.579(6) |
| α (°) | 102.167(2) | 111.498(16) | 90 | 90 |
| β (°) | 104.778(2) | 108.775(13) | 113.8080(10) | 98.990(14) |
| γ (°) | 99.512(2) | 100.096(12) | 90 | 90 |
| Volume (Å3) | 449.82(4) | 1831.00(6) | 5475.35(17) | 2810.30(15) |
| Z | 1 | 2 | 8 | 4 |
| ρ calcd (mg × m3) | 1.271 | 1.502 | 1.504 | 1.477 |
| Abs. Coeff. (mm−1) | 0.090 | 0.831 | 7.965 | 1.190 |
| F(000) | 184 | 848 | 2544 | 1271 |
| θ range (°) | 2.95 to 32.02 | 3.46 to 29.44 | 3.22 to 77.46 | 2.31 to 26.69 |
| Reflections collected/unique | 6215/3127 | 8506 | 52,372/5798 | 29,361/5668 |
| [R(int)] | [0.0199] | [0.0291] | [0.0494] | [0.0363] |
| Completeness (%) | 99.6 | 99.7 | 99.5 | 99.2 |
| Data/restraints/parameters | 3127/930/469 | 8506/12/395 | 5798/1/334 | 5668/59/343 |
| GoF on F2 | 1.136 | 1.083 | 1.317 | 1.049 |
| R1 [I > 2σ(I)] | 0.0514 | 0.0442 | 0.0922 | 0.0540 |
| wR2 [I > 2σ(I)] | 0.0615 | 0.0538 | 0.1052 | 0.0749 |
| Final R-index | 0.05 | 0.04 | 0.09 | 0.05 |
| Compound | Exp. Distance (Å) | DFT Distance (Å) | Bond |
|---|---|---|---|
| Ru-4 | 2.509 | 2.42 | Ru–Cl |
| Ru-5 | 2.582 | 2.42 | |
| Ru-6 | 2.413 | 2.37 | |
| Ru-4 | 1.456 | 1.82 | Ru–arene centroid |
| Ru-5 | 1.453 | 1.82 | |
| Ru-6 | 1.442 | 1.98 | |
| Ru-4 | 2.114 | 2.15 | Ru–N1 |
| Ru-5 | 2.104 | 2.15 | |
| Ru-6 | 2.078 | 2.03 | |
| Ru-4 | 2.084 | 2.14 | Ru–N2 |
| Ru-5 | 2.079 | 2.14 | |
| Ru-6 | 2.068 | 1.97 |
| Complex | μ (eV) | χ (eV) | η (eV) | S (eV−1) | ω (eV) |
|---|---|---|---|---|---|
| Ru-1 | −4.21 | 4.21 | 3.11 | 0.322 | 2.84 |
| Ru-2 | −4.26 | 4.26 | 3.1 | 0.323 | 2.93 |
| Ru-3 | −4.24 | 4.24 | 3.11 | 0.322 | 2.88 |
| Ru-4 | −4.31 | 4.31 | 3.14 | 0.318 | 2.96 |
| Ru-5 | −4.36 | 4.36 | 3.12 | 0.321 | 3.05 |
| Ru-6 | −4.31 | 4.31 | 3.07 | 0.326 | 3.03 |
| Compounds | Kb (M−1) | Binding Energy ΔG° (kJ/Mol) |
|---|---|---|
| L1 | 1.1 ± 0.1 × 10⁷ | −36.8 ± 0.7 |
| L2 | 1.2 ± 0.5 × 10¹⁰ | −52.7 ± 0.5 |
| L3 | 5.7 ± 1.8 × 10¹⁰ | −56.2 ± 0.5 |
| L4 | 3.4 ± 0.8 × 10¹¹ | −60.3 ± 1.1 |
| Ru-3 | 6.5 ± 0.5 × 10¹¹ | −61.8 ± 1.0 |
| Ru-4 | 2.0 ± 0.6 × 10¹⁰ | −53.9 ± 0.6 |
| Ru-5 | 3.7 ± 3.3 × 10¹⁰ | −55.0 ± 0.2 |
| Ru-6 | 9.6 ± 1.3 × 10¹⁰ | −57.4 ± 0.6 |
| Complex | Ru-1 | Ru-2 | Ru-3 | Ru-4 | Ru-5 | Ru-6 | CP | KP1019 |
|---|---|---|---|---|---|---|---|---|
| Binding energy (kJ/mol) | −29.41 | −28.70 | −27.69 | −27.57 | −26.36 | −26.61 | −25.73 | −14.72 |
Disclaimer/Publisher’s Note: The statements, opinions and data contained in all publications are solely those of the individual author(s) and contributor(s) and not of MDPI and/or the editor(s). MDPI and/or the editor(s) disclaim responsibility for any injury to people or property resulting from any ideas, methods, instructions or products referred to in the content. |
© 2025 by the authors. Licensee MDPI, Basel, Switzerland. This article is an open access article distributed under the terms and conditions of the Creative Commons Attribution (CC BY) license (https://creativecommons.org/licenses/by/4.0/).
Share and Cite
Murillo, M.I.; Mejia, C.F.; Restrepo-Acevedo, A.; Barraud, B.; Orjuela, A.L.; Flores-Alamo, M.; Toscano, R.A.; Alí-Torres, J.; Ryabov, A.D.; Le Lagadec, R. DNA Binding with Dipyrromethene Ruthenium(II) Complexes. Inorganics 2025, 13, 198. https://doi.org/10.3390/inorganics13060198
Murillo MI, Mejia CF, Restrepo-Acevedo A, Barraud B, Orjuela AL, Flores-Alamo M, Toscano RA, Alí-Torres J, Ryabov AD, Le Lagadec R. DNA Binding with Dipyrromethene Ruthenium(II) Complexes. Inorganics. 2025; 13(6):198. https://doi.org/10.3390/inorganics13060198
Chicago/Turabian StyleMurillo, Maria Isabel, Carlos Felipe Mejia, Andrés Restrepo-Acevedo, Benjamin Barraud, Adrian L. Orjuela, Marcos Flores-Alamo, Rubén A. Toscano, Jorge Alí-Torres, Alexander D. Ryabov, and Ronan Le Lagadec. 2025. "DNA Binding with Dipyrromethene Ruthenium(II) Complexes" Inorganics 13, no. 6: 198. https://doi.org/10.3390/inorganics13060198
APA StyleMurillo, M. I., Mejia, C. F., Restrepo-Acevedo, A., Barraud, B., Orjuela, A. L., Flores-Alamo, M., Toscano, R. A., Alí-Torres, J., Ryabov, A. D., & Le Lagadec, R. (2025). DNA Binding with Dipyrromethene Ruthenium(II) Complexes. Inorganics, 13(6), 198. https://doi.org/10.3390/inorganics13060198