Abstract
Hydrogen from water splitting is seen as a promising future energy source. Pt electrochemical catalysts with an ideal hydrogen evolution reaction (HER) performance face problems relating to their cost and scarcity. Research into transition metal dichalcogenides (TMDs) as alternative catalysts is in demand. In our work, H adsorption on monolayer MoTe2 is investigated at different sites and rates. Through structure and charge distribution analysis, it is found that uniform charge distribution facilitates H adsorption. In addition, the enhanced electronic density of states and reduced band gap calculated by the electronic energy band structure are advantageous for H adsorption. And the Mo edge of MoTe2 is sensitive to the H adsorption rate. Finally, the H adsorbed on the sites is stable at 600 K, as shown in molecular dynamics (MD) calculations. Our work provides a further mechanism for H adsorption on MoTe2.
1. Introduction
Hydrogen as an energy carrier is seen as an alternative renewable energy due to its environmentally friendly and sustainable advantages over fossil fuels [1]. Electrical-energy driven water splitting has been used to produce hydrogen [2]. Pt is well-known as the most efficient electrocatalyst for HER with a near-zero overpotential, a remarkable exchange current density, and a small Tafel slope [3]. Its high cost and inadequate reserves make Pt less competitive in practical applications. Over the past few years, great efforts have been devoted to developing an alternative electrocatalyst [4]. MoTe2 is a promising catalyst for the hydrogen evolution reaction (HER) due to its excellent mobility (~4000 cm2/V s) and conductivity (0.2/Ω cm) [5]. Monolayer MoTe2 can improve the charge transfer for HER due to its atomic thickness. Moreover, the prominent chemical stability and robustness of MoTe2 during electrochemical reactions are advantages for HER electrocatalysts [6].
The edge sites of MoTe2 are active catalytic sites while the basal planes of MoTe2 are inert for catalytic activity. So, great effort has been put into activating the catalytic sites. Experimentally, the HER catalytic capability of 2H-MoTe2 has been improved by Te vacancies engineering [7], nanowire structure engineering [8], hybrid composites [9], phase engineering [10,11] and so on. Theoretically, the better HER activity of the MoTe2 plane via metal/non-metal atom substituted doping [6,12] or Te vacancy [13] engineering has been predicted. Among them, the HER activity of MoTe2 as a function of hydrogen adsorption coverage is investigated. For example, the equilibrium hydrogen adsorption coverage at vacancy sites of MoTe2 is calculated as bigger than 0.8 [14]. G-CN/MoTe2 heterojunctions achieve higher HER performance at 4 H coverage [15]. The effective HER performance of MoTe2 with a 2H-1T phase boundary is achieved below 60% hydrogen adsorption coverage, according to a density functional theory (DFT) calculation [16].
As far as we know, systematic work on monolayer MoTe2 HER activity in terms of hydrogen adsorption sites and coverage is scarce. Hydrogen adsorption with different active sites and coverage rates on similar TMDS MoSe2 materials has been reported [17]. These authors found that the catalytic capacity of HER for the Se edge is more stable than that of the Mo edge, with less sensibility to the absorption hydrogen coverage rates. Our work follows up on previous work, except for the MoTe2 materials used.
Here, DFT is used to calculate the hydrogen adsorption Gibbs free energy of MoTe2 as a function of the adsorption sites and adsorption rates. The exchange current density () as a function of the Gibbs free energy (∆GH) is calculated to analyze the catalytic ability. In our 2 × 2 × 1 MoTe2 models, the Mo edge is found to be sensitive to the adsorption rate. To further explore the mechanism, the geometry structure and the differential charge density distribution are investigated, and it is found that the uniform charge distribution explains the better HER performance. In addition, the relationship between the Gibbs free energy and energy bandgap is established by calculating the electronic energy band structure of MoTe2 models. And it is found that the enhanced electronic density of states and the reduced band gap is advantageous for H atom adsorption. The adsorbed hydrogen is stable at 600 K kinetically according to MD calculations.
2. Results
2.1. Structure
Figure 1a,b show the top and side views of a MoTe2 unit cell. The Mo atom (purple color) is sandwiched between the two nearest S atoms (yellow color). The lattice constant, Mo-Te bond length and Te-Mo-Te angle are 3.56 Å, 2.738 Å and ~83°, respectively, which is consistent with other reports [18]. The pristine MoTe2 has a bandgap of ~0.97 eV, which is consistent with previous DFT calculations [6]. The orbital projected band structure and partial density of states (PDOS) of the MoTe2 primitive cell are shown in Figure S1. Figure 1c shows the top view of the 2 × 2 × 1 supercell MoTe2. Three sites were chosen to identify the optimal position for H adsorption: hollow sites (#0), top Te site (#1) in the Te zigzag edge, and top Mo site (#2) in the Mo zigzag edge; these are shown in Figure 1c.
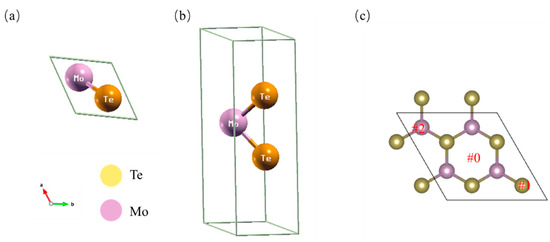
Figure 1.
(a,b) The top and side view of the optimized structure of pristine MoTe2. The Te and Mo atoms are represented by yellow and purple colors, respectively. (c) Supercell structure and hydrogen adsorption sites (#0 hollow site of MoTe2; #1 site on top of Te; #2 site on top of Mo).
2.2. Gibbs Free Energy (∆GH) of H Adsorption Sites and Coverage
∆GH is a good descriptor of HER activity [19]. A value of ∆GH close to 0 indicates the optimal catalyst, while a positive value means that the protons find it difficult to bond to the catalyst surface and a negative value meaning that the adsorbed hydrogen is hard to leave for H2 formation. It is found that the hollow sites are weak for the adsorption of protons based on the calculated ∆GH of adsorption sites #0–2 (shown in Table 1). So, the upper Te (#1) and Mo sites (#2) are chosen for further exploration due to the relative strength of the adsorption protons. The difference in the coverage of H at the #1 and #2 site is investigated. The coverage of H adsorption is defined as the number of atoms adsorbed by the H atom divided by the number of edge atoms. The Te (#1) edge that adsorbs one or two H atoms has a coverage of 50% and 100%, and is thus denoted as #1_1/2 and #1_2/2 for simplicity. Similarity, the Mo (#2) edge that adsorbs one and two H atoms is denoted as #2_1/2 and #2_2/2. The calculated total energies of the relaxed MoTe2 and H-adsorbed MoTe2 configurations (#0, #1_1/2, #1_2/2, #2_1/2 and #2_2/2) are shown in Table S1. The Gibbs free energy calculations are detailed in Section 4. The calculated ∆GH as a function of adsorption sites and coverage is shown in Table 1. It is found that the ∆GH of Te sites (1) increases from 1.945 to 2.024 eV. The ∆GH of Mo sites decreases from 1.601 to 1.326 eV. The optimal H adsorption site and coverage is #2_2/2 as it had the lowest ∆GH energy.

Table 1.
∆GH at #0, #1 and #2 adsorption sites with a 50% and 100% hydrogen coverage rate.
In order to further analyze the HER activity, the volcano relationship between the exchange current density () and the Gibbs free energy under standard conditions (pH = 0, T = 300 K) is shown in Figure 2 [20]. The calculation formula is as follows:
where is the unit charge and is the proton transfer rate constant, is the Boltzmann constant, and is the temperature. The exchange current density of the #0 adsorption sites is at the lower end of the triangle. The of #2_2/2 is closer to the top of the triangle while the of #1_2/2 is away from the top of the triangle, indicating the faster reaction rate of #2_2/2 and the slower reaction rate of #1_2/2.
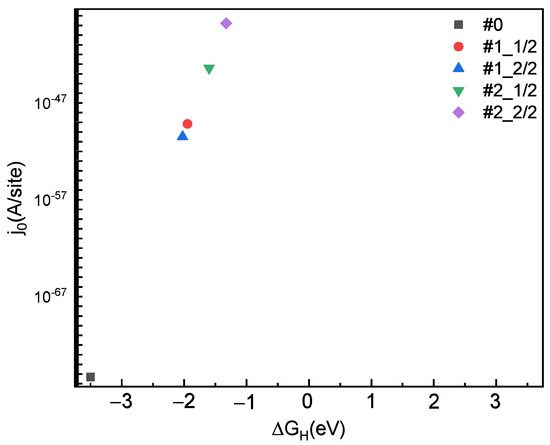
Figure 2.
Exchange current density () at #0, #1 and #2 adsorption sites with a 50% and 100% hydrogen coverage rate.
3. Discussion
To further explore the mechanism from the perspective of structure and energy, the structure and charge density differences in the four situations are calculated. Figure 3 shows the geometry relaxation of #1_1/2, #1_2/2, #2_1/2, #2_2/2. The length of the Mo-H bond is 1.712, 1.795, 1.710 and 1.695 Å. The longest length is observed in structure #1_2/2, and an obvious lattice deformation is observed. Meanwhile, the ∆GH is the largest, at 2.024 eV.
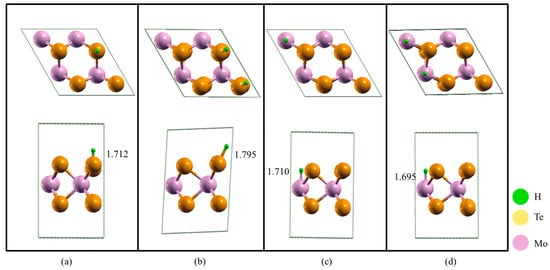
Figure 3.
The top-view and side-view of the optimized structure of (a) #1_1/2; (b) #1_2/2; (c) #2_1/2; (d) #2_2/2. The green, yellow and purple spheres indicate H, Te and Mo atoms, respectively.
In addition, the charge transfer was analyzed by calculating the differenctial charge density distribution, as shown in Figure 4a–d. The isosurface is 0.0025 e *. Green regions near the atom represent electron deletion and yellow regions near the atom represent electron accumulation [21]. For structure #1_1/2, as shown in Figure 4a, it is found that the adsorbed H atom gain electrons while the adsorption site Te (#1) loses electrons. In addition, there is no transfer of electrons in the unadsorbed Te atoms and the redistribution of electrons occurs in three Mo atoms. In particular, the electron transfer occurs between the adsorbed Te atom and the two nearest Mo atoms. For structure #1_2/2, large-scale electron transfer occurs near the adsorbed Te and nearest Mo atoms. The nonlocalized electron distribution is related to the deformed structure. Electrons are distributed more locally near the adsorbed Mo atoms in structures #2_1/2 and #2_2/2 compared with the zigzag Te atoms of structures #1_1/2 and #1_2/2, especially in structure #2_2/2. Combined with the ∆GH, it is deduced that a large ∆GH value 2.024 eV is related to nonlocalized electron distribution and that a small ∆GH value 1.326 eV is related to the localized electron distribution, which is consistent with another report [17]. The electronegativity of H, Mo and Te is 2.20, 2.16 and 2.10, respectively. So, electrons are enriched near the H atom and depleted near Mo and Te atoms. The zigzag Mo atom site is sensitive to H compared with the zigzag Te atom, which is consistent with the result showing that the zigzag Mo atom is more sensitive to zigzag Se atoms [17].
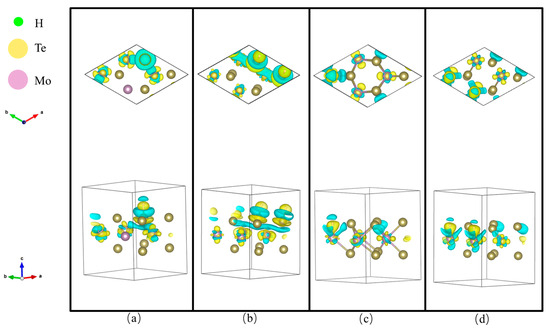
Figure 4.
The top and side view of the differential charge density distribution for (a) #1_1/2; (b) #1_2/2; (c) #2_1/2; (d) #2_2/2. The blue and yellow color indicate the charge deletion and accumulation region. The green, yellow and purple spheres indicate H, Te and Mo atoms, respectively.
We also studied the energy band structure along the K′-M-K-G-K′ path in the Brillouin zone of the H-adsorbed MoTe2 with four configurations (#1_1/2, #1_2/2, #2_1/2 and #2_2/2), as shown in Figure 5a–d. For the #1_1/2 structure, the conduction band minimum (CBM) and valence band maximum (VBM) are located at the K high-symmetry point, exhibiting a direct band gap with a band gap of 0.43 eV. Similarly, for the #2_1/2 and #2_2/2 structure, the direct band gap decreased to 0.40 eV and 0.17 eV, respectively. It is noted that for the #1_2/2 structure, the energy band transitions to an indirect semiconductor, exhibiting an energy bandgap of 0.49 eV. It is found that the bandgap of the four structures is related to the Gibbs free energy. The bandgap of structure #1_2/2 is the largest (0.49 eV) and the corresponding ΔGH is also the largest (2.024 eV). Conversely, the smallest band gap (0.17 eV) of structure #2_2/2 and the smallest ΔGH (1.326 eV) are observed. This is because the enhanced density of the conduction band and the reduced band gap are beneficial for the charge transfer from the adsorbed H to the adsorption sites of MoTe2 [6]. It is noted that for structure #1_2/2, the VBM is located at the K point while the CBM is not located at the K point. To study the transition from direct band gap to indirect band gap, the orbital projected band structure and projected density of the states (PDOS) of structure #1_2/2 are shown in Figure S2 of the Supplementary Materials. Compared to the projected band structure of the pristine MoTe2 shown in Figure S1b, the absorbed H 1s orbital of structure #1_2/2 contributes to the CBM located along the K to Gamma point. The PDOS of Figure S2b further demonstrates that the Mo 4d, Te 5s, 5p and H 1s contribute to the density of the states at CBM.
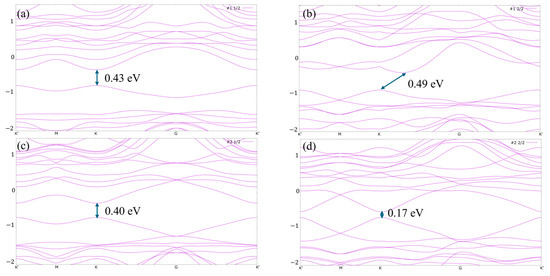
Figure 5.
Energy band structure for (a) #1_1/2; (b) #1_2/2; (c) #2_1/2; (d) #2_2/2. K′, M, K, G are the points of high symmetry in the Brillouin zone with K′, K in the corners, M between two corners and G in the center.
In order to analyze the thermal stability of adsorbed H atoms, we carried out first-principles molecular dynamics (MD) simulations. The total energy of the #2_1/2 structure as a function of time simulation at a finite temperature (600 K) is presented in Figure 6. The inset shows the snapshots for the #2_1/2 structure after the 96 fs and 10 ps MD run. It is noted that the #2_1/2 structure other than #2_2/2 is chosen due to the limited calculation resources. It can be seen that the total energy fluctuates around −10,713.6 eV and that the structure is slightly deformed after 10 ps, with no atoms leaving the substrate [22], indicating that the structure remains dynamically stable. At 700 K, the H atom oscillated violently and detached away from the adsorption sites (shown in Figure S3a–e).
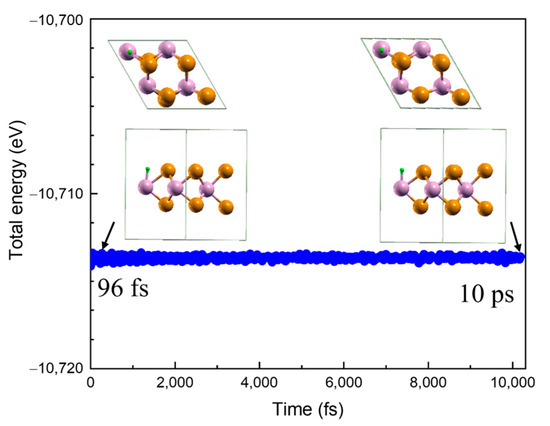
Figure 6.
The total energy of the #2_1/2 structure as a function of the time simulation at finite temperature (600 K). The inset shows the top and side views for the H-MoTe2 #2_1/2 structure after 96 fs and 10 ps first-principles MD simulations. The green, yellow and purple spheres indicate H, Te and Mo atoms, respectively.
4. Materials and Methods
All DFT calculations were performed by using the Quantum open-source Package for Research in Electronic Structure, Simulation, and Optimization (ESPRESSO, version 6.7) [23,24]. Electron–electron exchange correlations are treated by the Perdew–Burke–Ernzerhof (PBE) functional within the generalized gradient approximation (GGA) and electron–ion interactions are treated by the projector augmented wave (PAW) method. The crystal structures are relaxed with a cutoff energy of 49 Ry for the plane–wave expansion of the electronic wave function and the force on each atom is less than 0.04 eV/Å. A vacuum space of 15 Å is adopted to prevent interlayer interactions. The Monkhorst-Pack k-point sampling is set as 1 1 1, 3 3 1 for primitive and supercell structures.
In addition, the change in the Gibbs free energy of hydrogen adsorbed on MoTe2 (∆GH) is calculated at zero potential and PH = 0 as follows:
where is the hydrogen adsorption energy; is the difference in the zero-point energy. and are computed as follows:
where and represent the adsorption of MoTe2 by and hydrogen atoms, respectively. is the vibrational frequency. is the temperature (300 K) and is the difference in entropy between the H that is adsorbed and in the gas phase at 1.01 × 10⁵ pa. T∆SH is simplified as 0.20 eV, as reported elsewhere [25]. The calculated ∆EZPE is about 0.01 eV. The detailed zero-point energy is shown in Table S2 of the Supplementary Materials. We set ∆EZPE-T∆SH as 0.21 eV for simplicity.
The thermodynamic stability of hydrogen adsorption on MoTe2 is evaluated by molecular dynamics simulations at 600 K, 700 K and 800 K under the NVT (number of simulated particles, simulation cell volume, and temperature). The total simulation time is 10 ps and the time step is 1 fs [22].
5. Conclusions
In summary, 2 2 1 monolayer MoTe2 shows a Gibbs free energy of 1.326 eV with 2 H adsorption on the Te edge but 2.024 eV with 2 H adsorption on the Mo edge. The exchange current density () as a function of the Gibbs free energy (∆) is calculated to analyze the HER activity. Combining the structure and charge distribution analysis, the electron distribution associated with the deformed structure is the reason for the big Gibbs free value. Local electron distribution is the reason for the small Gibbs free energy value. In addition, the relationship between the Gibbs free energy and energy band gap is established by calculating the electronic energy band structure of MoTe2 models. It is found that the enhanced electronic density of states and the reduced band gap is advantageous for H adsorption. It was found that the H-adsorbed MoTe2 of #1_2/2 became an indirect-gap semiconductor, which could be the reason for the large Gibbs free energy of 2.024 eV. According to the use of Gibbs free energy as a function of hydrogen adsorption rates, zigzag Mo is sensitive to H adsorption. Finally, based on MD data, the #2_1/2 structure shows thermal stability below 600 K. These findings provide valuable references for the application of two-dimensional MoTe2 in the field of electrocatalytic hydrogen production.
Supplementary Materials
The following supporting information can be downloaded at: https://www.mdpi.com/article/10.3390/inorganics13060197/s1, Figure S1: (a) The band structure of monolayer 2H-MoTe2; (b) The orbital projected band structure of monolayer 2H-MoTe2; (c) The partial density of states (PDOS) of monolayer 2H-MoTe2. Table S1: The calculated energy of relaxed MoTe2 and the H-adsorbed MoTe2 configurations (#0, #1_1/2, #1_2/2, #2_1/2 and #2_2/2). Figure S2: (a) The orbital projected band structure of #2_2/2; (b) The partial density of states (PDOS) of #2_2/2. Table S2: The calculated zero-point energy of relaxed MoTe2 and the H-adsorbed MoTe2 configurations (#0, #1_1/2, #1_2/2, #2_1/2 and #2_2/2). Figure S3: The snapshot of typical of H-MoTe2 #2_1/2 structure at 700K at (a) 100 fs; (b) 4.02 ps; (c) 6.04 ps; (d) 7.36 ps; (e) 8.48 ps.
Author Contributions
Conceptualization, J.M.; writing—original draft preparation, X.G.; writing—review and editing, J.M.; supervision, J.M.; funding acquisition, X.G. and J.M. All authors have read and agreed to the published version of the manuscript.
Funding
This research was funded by National College Students Innovation and Entrepreneurship Training Program, grant number X202510010441.
Institutional Review Board Statement
Not applicable.
Informed Consent Statement
Not applicable.
Data Availability Statement
The original contributions presented in this study are included in the article/Supplementary Materials. Further inquiries can be directed to the corresponding author.
Acknowledgments
The authors acknowledge Beijing PARATERA Tech Co., Ltd. for providing HPC resources that have contributed to the research results reported within this paper.
Conflicts of Interest
Beijng PARATERA Tech Co., Ltd. provided HPC resources for this research. The authors declare that the research was conducted in the absence of any commercial or financial relationships that could be construed as a potential conflict of interest.
References
- Midilli, A.; Ay, M.; Dincer, I.; Rosen, M.A. On hydrogen and hydrogen energy strategies: I: Current status and needs. Renew. Sustain. Energy Rev. 2005, 9, 255–271. [Google Scholar] [CrossRef]
- Tee, S.Y.; Win, K.Y.; Teo, W.S.; Koh, L.-D.; Liu, S.; Teng, C.P.; Han, M.-Y. Recent Progress in Energy-Driven Water Splitting. Adv. Sci. 2017, 4, 1600337. [Google Scholar] [CrossRef] [PubMed]
- Guo, F.; Macdonald, T.J.; Sobrido, A.J.; Liu, L.; Feng, J.; He, G. Recent Advances in Ultralow-Pt-Loading Electrocatalysts for the Efficient Hydrogen Evolution. Adv. Sci. 2023, 10, 2301098. [Google Scholar] [CrossRef] [PubMed]
- Saji, V.S.; Pillai, V.K.; Sotiropoulos, S. Recent advances in electrochemical water splitting. Electrochim. Acta 2024, 475, 143645. [Google Scholar] [CrossRef]
- Mao, J.; Ta, Q.T.H.; Tri, N.N.; Shou, L.; Seo, S.; Xu, W. 2D MoTe2 nanomesh with a large surface area and uniform pores for highly active hydrogen evolution catalysis. Appl. Mater. Today 2023, 35, 101939. [Google Scholar] [CrossRef]
- Xiao, Z.; Gan, X.; Zhu, T.; Lei, D.; Zhao, H.; Wang, P. Activating the Basal Planes in 2H-MoTe2 Monolayers by Incorporating Single-Atom Dispersed N or P for Enhanced Electrocatalytic Overall Water Splitting. Adv. Sustain. Syst. 2022, 6, 2100515. [Google Scholar] [CrossRef]
- Yang, H.; Zhao, Y.; Wen, Q.; Mi, Y.; Liu, Y.; Li, H.; Zhai, T. Single MoTe2 sheet electrocatalytic microdevice for in situ revealing the activated basal plane sites by vacancies engineering. Nano Res. 2021, 14, 4814–4821. [Google Scholar] [CrossRef]
- Mao, J.; Zhou, L.; Li, Y.; Tao, Y.; Chai, K.; Shi, Y.; Xu, W. Synthesis of MoTe2 nanowire as an efficient hydrogen evolution reaction material. Mater. Lett. 2021, 290, 129471. [Google Scholar] [CrossRef]
- Shinde, P.V.; Mane, P.; Late, D.J.; Chakraborty, B.; Rout, C.S. Promising 2D/2D MoTe2/Ti3C2Tx Hybrid Materials for Boosted Hydrogen Evolution Reaction. ACS Appl. Energy Mater. 2021, 4, 11886–11897. [Google Scholar] [CrossRef]
- Lu, D.; Ren, X.; Ren, L.; Xue, W.; Liu, S.; Liu, Y.; Chen, Q.; Qi, X.; Zhong, J. Direct Vapor Deposition Growth of 1T′ MoTe2 on Carbon Cloth for Electrocatalytic Hydrogen Evolution. ACS Appl. Energy Mater. 2020, 3, 3212–3219. [Google Scholar] [CrossRef]
- Lei, Y.; Xiao, X.; Ma, T.; Li, W.; Zhang, H.; Ma, C. Facile hydrothermal synthesis of layered 1T′ MoTe2 nanotubes as robust hydrogen evolution electrocatalysts. Front. Chem. 2022, 10, 1005782. [Google Scholar] [CrossRef] [PubMed]
- Huang, Y.; Chen, Y.; Zhang, Y.; Zhang, H.; Xiong, K.; Ye, X.; Liu, Q.; Zhu, J. Transition-metal atoms embedded MoTe2 single-atom catalyst for efficient electrocatalytic hydrogen evolution reaction. Appl. Surf. Sci. 2025, 680, 161335. [Google Scholar] [CrossRef]
- Pu, M.; Guo, Y.; Guo, W. Wrinkle facilitated hydrogen evolution reaction of vacancy-defected transition metal dichalcogenide monolayers. Nanoscale 2021, 13, 20576–20582. [Google Scholar] [CrossRef]
- Lee, J.; Kang, S.; Yim, K.; Kim, K.Y.; Jang, H.W.; Kang, Y.; Han, S. Hydrogen Evolution Reaction at Anion Vacancy of Two-Dimensional Transition-Metal Dichalcogenides: Ab Initio Computational Screening. J. Phys. Chem. Lett. 2018, 9, 2049–2055. [Google Scholar] [CrossRef]
- Shen, Y.; Yuan, P.; Yuan, Z.; Cui, Z.; Ma, D.; Cheng, F.; Qin, K.; Wang, H.; Li, E. Modulation of electronic and optical properties of g-CN/XTe2(X=W, Mo) heterojunctions by biaxial strain. Int. J. Hydrogen Energy 2024, 80, 289–297. [Google Scholar] [CrossRef]
- Chen, Y.; Ou, P.; Bie, X.; Song, J. Basal plane activation in monolayer MoTe2 for the hydrogen evolution reaction via phase boundaries. J. Mater. Chem. A 2020, 8, 19522–19532. [Google Scholar] [CrossRef]
- Xu, Z.-W.; Shi, C.-S.; Zhao, G.-H.; Wang, M.-Y.; Liu, G.-W.; Qiao, G.-J. Hydrogen adsorption mechanism on single-layer MoSe2 for hydrogen evolution reaction: First-principles study. Acta Phys. Sin. 2018, 67, 217102. [Google Scholar] [CrossRef]
- Lamba, A.; Kumar, R.; Srivastava, S. Band gap engineering of 2H-MX2 (M = Mo; X = S, Se, Te) monolayers using strain effect. Mater. Today Proc. 2021, 54, 677–681. [Google Scholar] [CrossRef]
- Tang, Q.; Jiang, D.-E. Mechanism of Hydrogen Evolution Reaction on 1T-MoS2 from First Principles. ACS Catal. 2016, 6, 4953–4961. [Google Scholar] [CrossRef]
- Yang, T.T.; Patil, R.B.; McKone, J.R.; Saidi, W. Revisiting trends in the exchange for hydrogen evolution. Catal. Sci. Technol. 2021, 11, 6832–6838. [Google Scholar] [CrossRef]
- Zhang, X.; Song, Y.; Zhang, F.; Fan, Q.; Jin, H.; Chen, S.; Jin, Y.; Gao, S.; Xiao, Y.; Mwankemwa, N.; et al. The electronic properties of hydrogenated Janus MoSSe monolayer: A first principles investigation. Mater. Res. Express 2019, 6, 105055. [Google Scholar] [CrossRef]
- Li, X.D.; Qian, Y.Y.; Guo, T.S.; Fu, L.J. DFT study on adsorption properties of TM(Ni, Co)Nx-doped graphene for high-temperature sensing of SF6 decomposed gases. Mater. Today Chem. 2024, 35, 101904. [Google Scholar] [CrossRef]
- Giannozzi, P.; Andreussi, O.; Brumme, T.; Bunau, O.; Buongiorno Nardelli, M.; Calandra, M.; Car, R.; Cavazzoni, C.; Ceresoli, D.; Cococcioni, M.; et al. Advanced capabilities for materials modelling with Quantum ESPRESSO. J. Phys. Condens. Matter 2017, 29, 465901. [Google Scholar] [CrossRef] [PubMed]
- Giannozzi, P.; Baroni, S.; Bonini, N.; Calandra, M.; Car, R.; Cavazzoni, C.; Ceresoli, D.; Chiarotti, G.L.; Cococcioni, M.; Dabo, I.; et al. QUANTUM ESPRESSO: A modular and open-source software project for quantum simulations of materials. J. Phys. Condens. Matter 2009, 21, 395502. [Google Scholar] [CrossRef]
- Wang, J.S.; Liu, J.; Zhang, B.; Ji, X.; Xu, K.; Chen, C.; Miao, L.; Jiang, J.J. The mechanism of hydrogen adsorption on transition metal dichalcogenides as hydrogen evolution reaction catalyst. Phys. Chem. Chem. Phys. 2017, 19, 10125–10132. [Google Scholar] [CrossRef]
Disclaimer/Publisher’s Note: The statements, opinions and data contained in all publications are solely those of the individual author(s) and contributor(s) and not of MDPI and/or the editor(s). MDPI and/or the editor(s) disclaim responsibility for any injury to people or property resulting from any ideas, methods, instructions or products referred to in the content. |
© 2025 by the authors. Licensee MDPI, Basel, Switzerland. This article is an open access article distributed under the terms and conditions of the Creative Commons Attribution (CC BY) license (https://creativecommons.org/licenses/by/4.0/).