2. Results and Discussion
One of the primary objectives of this study is to explore how varying the BaO content affects the synthesis properties of M-E-SBMSO-
x powders. To achieve this, the concentrations of the Mn
2+ and Eu
2+-codoped activators were fixed at 0.05 and 0.0075, respectively. Meanwhile, the BaO content was adjusted to modify the host lattice, altering the composition of M-E-SBMSO-
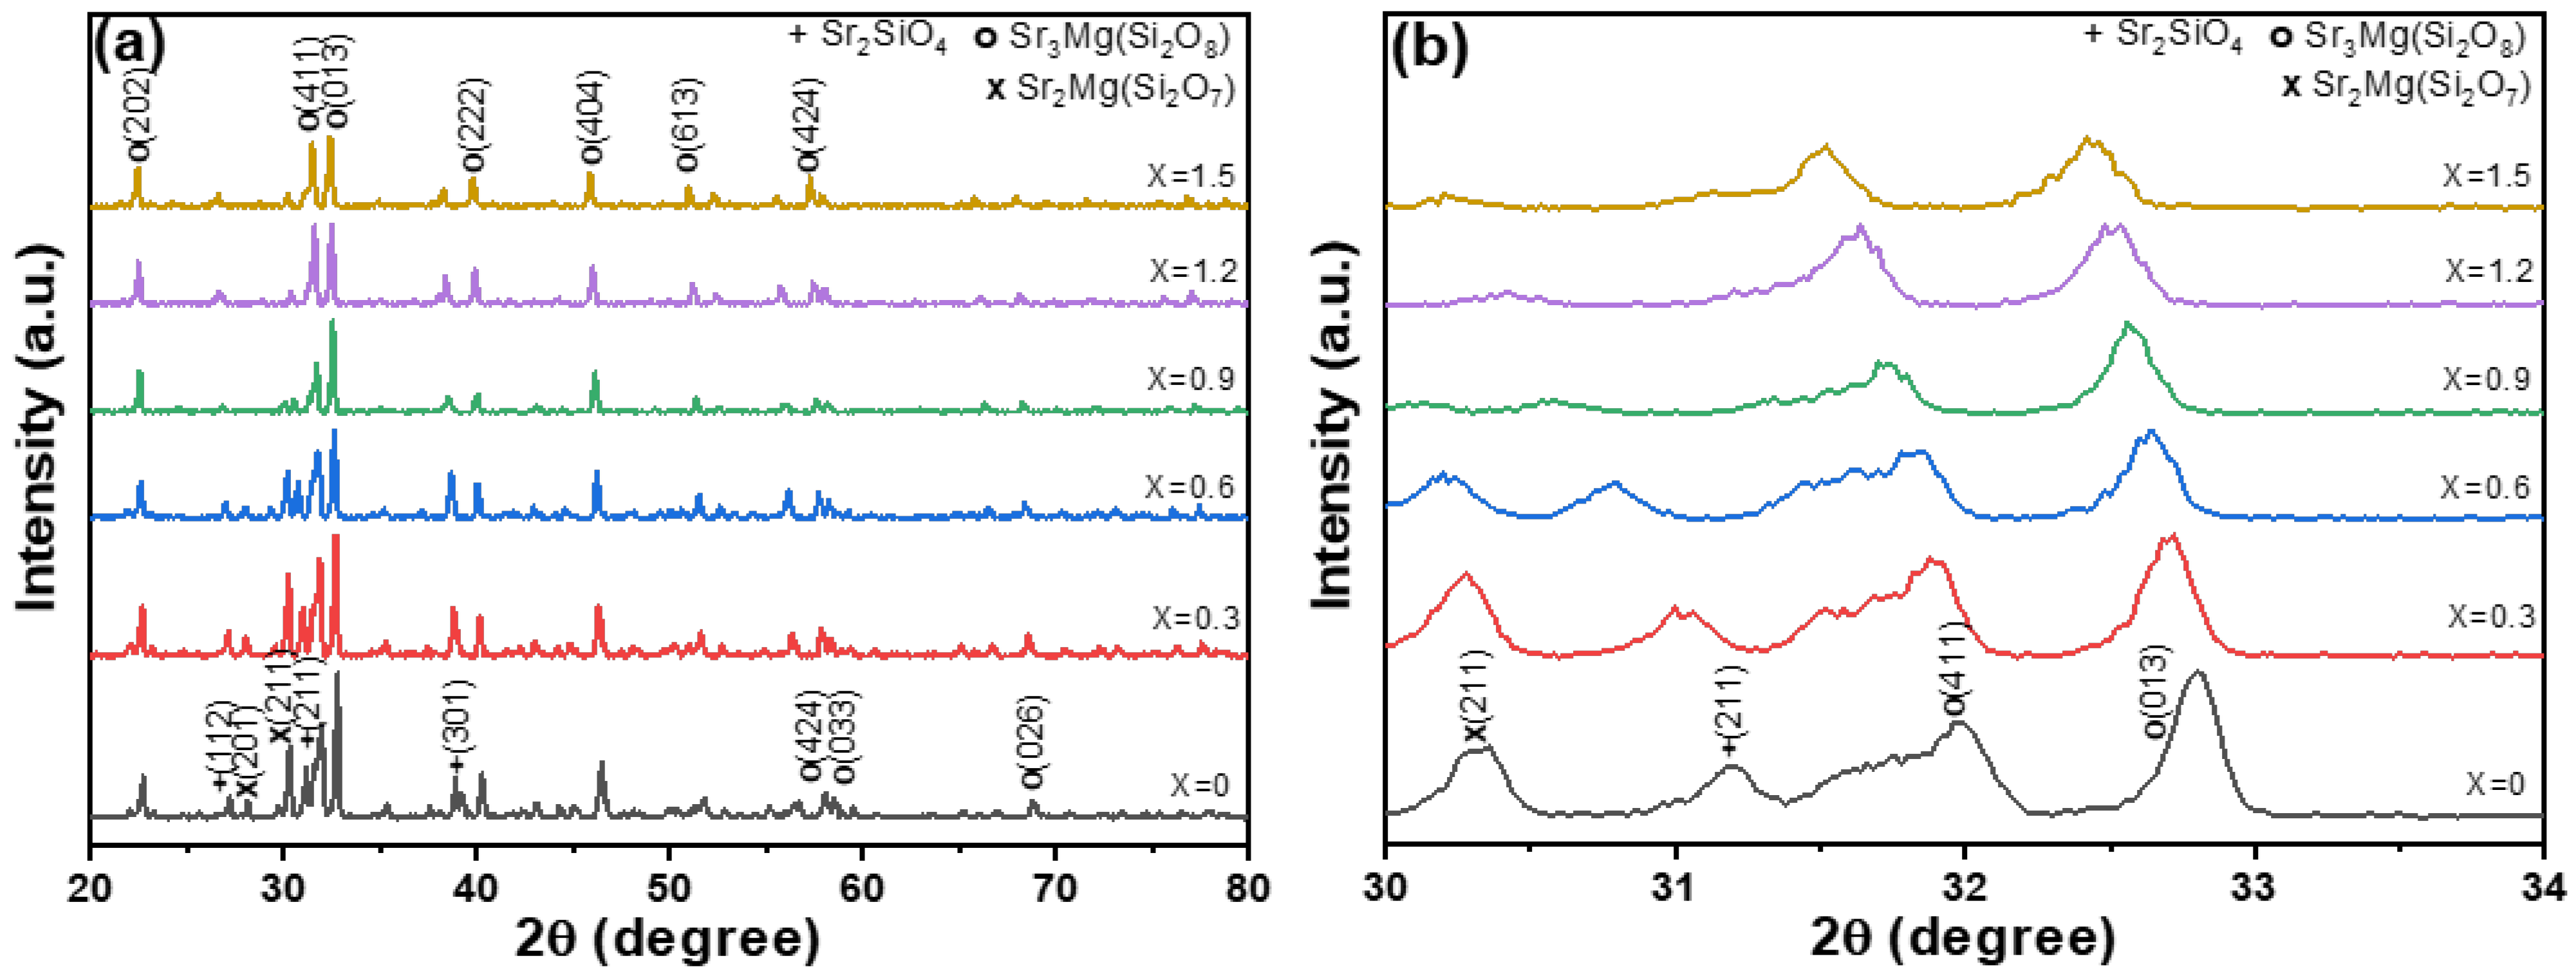
x by varying the x value from 0 to 1.5 in increments of 0.3. X-ray diffraction (XRD) analysis was employed as a key technique to investigate the crystal structure of the synthesized phosphors. The resulting XRD patterns, shown in
Figure 1a for a broad range, reflect the changes in crystal phases as a function of the varying SrO content. The diffraction peaks were compared with the standard JCPDS card No. 01-090-0307 for Sr
3MgSi
2O
8 to confirm whether Sr
3MgSi
2O
8 (SBMSO-
x) is the primary crystalline phase present in the synthesized M-E-SBMSO-
x powders. The diffraction peaks corresponding to the Ba
0.125Sr
2.875Mg(SiO
4)
2 composition, referenced from JCPDS No. 04-022-8338, were also used to identify the diffraction peaks of the M-E-SBMSO-
x phosphors. According to JCPDS No. 01-090-0307, the Sr
3MgSi
2O
8 phase exhibits a monoclinic structure with the space group P2
1/a and angles
α =
β =
γ = 90°. The unit cell parameters
a,
b, and
c are 13.877 Å, 5.4577 Å, and 9.452 Å, with a unit cell volume of 715.86 Å
3. In comparison, the Ba
0.125Sr
2.875Mg(SiO
4)
2 composition, as reported in JCPDS No. 04-022-8338, also adopts a monoclinic structure, but with space group C2. Its unit cell parameters
a,
b, and
c are 13.886 Å, 5.4637 Å, and 9.452 Å, with angles
α =
γ = 90° and
β = 90.4453°, and a unit cell volume of 717.09 Å
3. These findings suggest that substituting BaO for SrO in the Sr
3MgSi
2O
8 lattice to form SBMSO-
x results in a slight expansion of the lattice parameters
a and
b, along with an increase in the
β angle beyond 90°.
The analysis results presented in
Figure 1 demonstrate a strong correlation between the observed diffraction peaks and those listed in JCPDS No. 01-090-0307 and JCPDS No. 04-022-8338. Although minor deviations in the 2θ values are observed, the data provide compelling evidence that the synthesized M-E-SBMSO-
x phosphors possess a monoclinic crystal structure. These slight shifts in 2θ may stem from factors such as lattice distortions or variations in chemical composition. Further investigation is necessary to clarify the underlying causes of these deviations and to assess their potential impact on the material’s properties. It is also noteworthy that all synthesized M-E-SBMSO-
x phosphors consistently match the characteristic diffraction peaks. However, slight variations in the intensities of the diffraction peaks were also observed. These results confirm that the dominant crystal structure of all synthesized M-E-SBMSO-
x powders is monoclinic, with a
P21/a space group, showing excellent agreement with the standard patterns from JCPDS No. 01-090-0307 and JCPDS No. 04-022-8338. Moreover, the data presented in
Figure 1 indicate that increasing the BaO content does not alter the primary monoclinic phase nor significantly enhance the formation of secondary phases. Across all synthesized M-E-SBMSO-
x samples, diffraction peaks corresponding to Sr
3MgSi
2O
8 and Ba
0.125Sr
2.875Mg(SiO
4)
2 compositions were identified. In addition, secondary phases such as Sr
2SiO
4 in JCPDS No. 39-1256 and Sr
2MgSi
2O
7 in JCPDS No. 009-1842 were also detected, as shown in
Figure 1.
Notably,
Figure 1b shows that the intensities of the two secondary phase diffraction peaks ((211) for Sr
2SiO
4 phase and (211) for Sr
2MgSi
2O
7 phase) decrease with increasing BaO content. To further investigate the crystal structure of the M-E-SBMSO-
x powders,
Figure 1b presents the XRD patterns within a narrow 2θ range of 30–34°, corresponding to BaO content progressively increasing from
x = 0 to
x = 0.15. The results indicate that the main diffraction peak of the M-E-SBMSO-
x powders corresponds to the (013) plane. Two key observations can be drawn from
Figure 1b. First, the intensity of the (013) diffraction peak decreases as the BaO content increases. Second, with increasing BaO content from 0 to 0.15, the 2θ position of the (013) peak exhibits a noticeable and nearly linear shift from 2θ = 32.82° to 2θ = 32.48°. This shift suggests a gradual decrease in the lattice constant of the M-E-SBMSO-
x powders as BaO content increases. This phenomenon can be attributed to the ionic substitution of Ba
2+ for Sr
2+ in the crystal lattice. Since the ionic radius of Ba
2+ (approximately 1.61 Å) is larger than that of Sr
2+ (approximately 1.44 Å), the substitution leads to a lattice distortion. The observed shift toward lower 2θ values provides supporting evidence of Ba
2+ incorporation into Sr
2+ sites, resulting in a contraction of the overall lattice dimensions.
Figure 1 also shows that the peaks for Sr
2SiO
4 and Sr
2MgSi
2O
7 also shift to lower 2θ values. The shift of the Sr
2SiO
4 and Sr
2MgSi
2O
7 peaks to lower 2θ values indicates lattice expansion, which is consistent with the incorporation of larger Ba
2+ ions (ionic radius ~1.35 Å) substituting for smaller Sr
2+ ions (ionic radius ~1.18 Å) in these secondary phases. This suggests that some of the Ba
2+ is indeed entering the crystal structures of the secondary phases rather than solely substituting into the Sr
3MgSi
2O
8 host lattice. This observation implies that the Sr
3MgSi
2O
8 lattice has a limited tolerance or solubility for Ba
2+. Once the solubility limit is exceeded, the excess Ba
2+ ions are likely to be incorporated into the secondary phases instead. Therefore, the presence of Ba in these secondary phases indicates that not all of the added Ba is successfully doped into the Sr
3MgSi
2O
8 phase, which may affect the uniformity and efficiency of luminescent properties attributed to Ba-related lattice distortions or energy transfer pathways in the host phase.
These findings highlight the crucial role of BaO content in influencing the composition of the synthesized M-E-SBMSO-x powders, which, in turn, significantly affects their PL properties. For the synthesized M-E-SBMSO-x phosphors, it is observed that the XRD diffraction peak intensities gradually decrease with increasing BaO content. However, this reduction in peak intensity is not attributed to a decrease in crystallinity. Instead, it can be explained by the gradual substitution of Sr2+ by the larger Ba2+ ions, which causes lattice expansion and slight structural disorder. These structural distortions can lead to reduced diffraction intensity due to increased lattice strain and enhanced diffuse scattering, even though the overall crystalline phase remains intact. Furthermore, the persistence of sharp and well-defined diffraction peaks across all compositions confirms that the samples maintain good crystallinity. Therefore, the decline in XRD intensity with increasing BaO content is primarily related to changes in atomic scattering contrast and local structural modifications rather than a degradation of crystallinity.
All M-E-SBMSO-
x powders exhibit a monoclinic crystal structure, belonging to the space group
P21/a. The unit cell parameters were determined through Rietveld refinement: a technique used to evaluate the agreement between observed diffraction data and a calculated pattern based on a proposed crystal structure model. The refined structural parameters varied with changes in BaO content, as summarized in
Table 1. The results show that the lattice constants
a,
b, and
c, as well as the unit cell volume and the β angle, slightly increased with increasing BaO content, while the
α and
γ angles remained fixed at 90°. This demonstrates that when
x = 0, the M-E-SBMSO-0 powder cannot fully transform into a cubic phase. As the BaO content increases, the M-E-SBMSO-
x powders tend to gradually shift toward the monoclinic phase, resulting in a gradual increase in the β angle. The refinement yielded the following values for the weighted profile R-factor (Rwp) and the profile R-factor (Rp): for M-E-SBMSO-0, M-E-SBMSO-0.3, M-E-SBMSO-0.6, M-E-SBMSO-0.9, M-E-SBMSO-1.2, and M-E-SBMSO-1.5, the Rwp values were 8.89%, 8.75%, 8.53%, 8.42%, 8.33%, and 8.25%, while the Rp values were 5.23%, 5.05%, 4.90%, 5.82%, 4.74%, and 4.65%, respectively. These results validate the reliability of the refined parameters, demonstrating a strong agreement between the experimental data from the XRD patterns and the crystal structure model proposed in this study.
The Mn
2+ and Eu
2+-codoped Sr
3−xBa
xMgSi
2O
8 (
x = 0–1.5) phosphors were found to comprise three primary crystalline phases, namely Sr
3−xBa
xMgSi
2O
8, Sr
2SiO
4, and Sr
2MgSi
2O
7, as confirmed through XRD analysis and subsequent Rietveld refinement. Although the Ba
2+ substitution was initially targeted for incorporation into the Sr
3−xBa
xMgSi
2O
8 host lattice, it is plausible that Ba
2+ ions also partially substitute into the Sr
2SiO
4 and Sr
2MgSi
2O
7 lattices. This is attributed to the comparable ionic radii and coordination geometries of Ba
2+ and Sr
2+, which facilitate the incorporation of Ba
2+ into multiple structural environments. Such inter-phase distribution of Ba
2+ ions introduces a level of compositional complexity that hinders the precise quantification of Ba content within each individual phase when relying solely on Rietveld refinement, as this technique primarily yields phase fractions rather than site-specific elemental distributions. Nonetheless, the Rietveld refinement remains effective for determining the relative mole fractions of the crystalline phases present in the samples. The quantitative phase compositions derived from the refinement are summarized in
Table 2, providing insight into the phase evolution as a function of increasing Ba content.
The visual morphologies of the M-E-SBMSO-
x powders synthesized via sintering at 1400 °C are shown in
Figure 2, illustrating the influence of varying BaO content on their microstructures. As depicted in
Figure 2a–f, it is evident that increasing the BaO content results in a noticeable increase in the particle size of the powders. Additionally, all M-E-SBMSO-
x powder particles exhibit surface features characterized by either short protrusions or whisker-like structures. When the BaO content increases from
x = 0 to
x = 0.3, these short protrusions gradually elongate. At
x = 0.6, the protrusions begin to transform into whisker-like structures. With further increases in BaO content, the whiskers become significantly longer and more defined. This morphological evolution suggests that BaO plays a critical role in promoting anisotropic crystal growth during the sintering process, possibly by influencing the local viscosity of the melt or modifying the crystallization kinetics of the silicate phases. The formation of whisker-like structures with higher BaO content may also indicate enhanced diffusion rates or altered growth directions driven by the presence of Ba
2+ ions, which are known to affect the crystallographic behavior of silicate materials.
Previous studies provide supporting evidence for these observations. Wang et al. utilized a template-free solvothermal method to synthesize SrSiO
3 under varying water/ethanol volume ratios, successfully producing SrSiO
3 nanofibers in a mixed water-ethanol solvent system [
12]. Similarly, Yang and co-workers fabricated flower-like Sr
2SiO
4 nanostructures via thermal oxidation of Sr
2SiO
4 powders [
13]. Previously, we employed transmission electron microscopy to conduct a detailed analysis of these nanostructures and confirmed the presence of both Sr
2SiO
4 and Sr
2MgSi
2O
7 phases in the synthesized Eu
2+-doped Sr
3MgSi
2O
8 powder [
14]. Their findings, along with the microstructural features observed in
Figure 2a, suggest that the protruding and whisker-like structures in the M-E-SBMSO-
x powders correspond to either SrSiO
3 or Sr
2SiO
4 phases. In the present study, XRD analyses clearly confirmed the presence of the Sr
2SiO
4 phase across all samples. This result strongly indicates that the primary crystalline phase causing the protruding and whisker-like structures in the M-E-SBMSO-
x powders is Sr
2SiO
4. The morphological transition from short protrusions to elongated whiskers, in combination with the phase identification, implies that BaO addition not only promotes the growth of Sr
2SiO
4 but also affects its microstructural development, potentially offering a means to tailor material properties through compositional control.
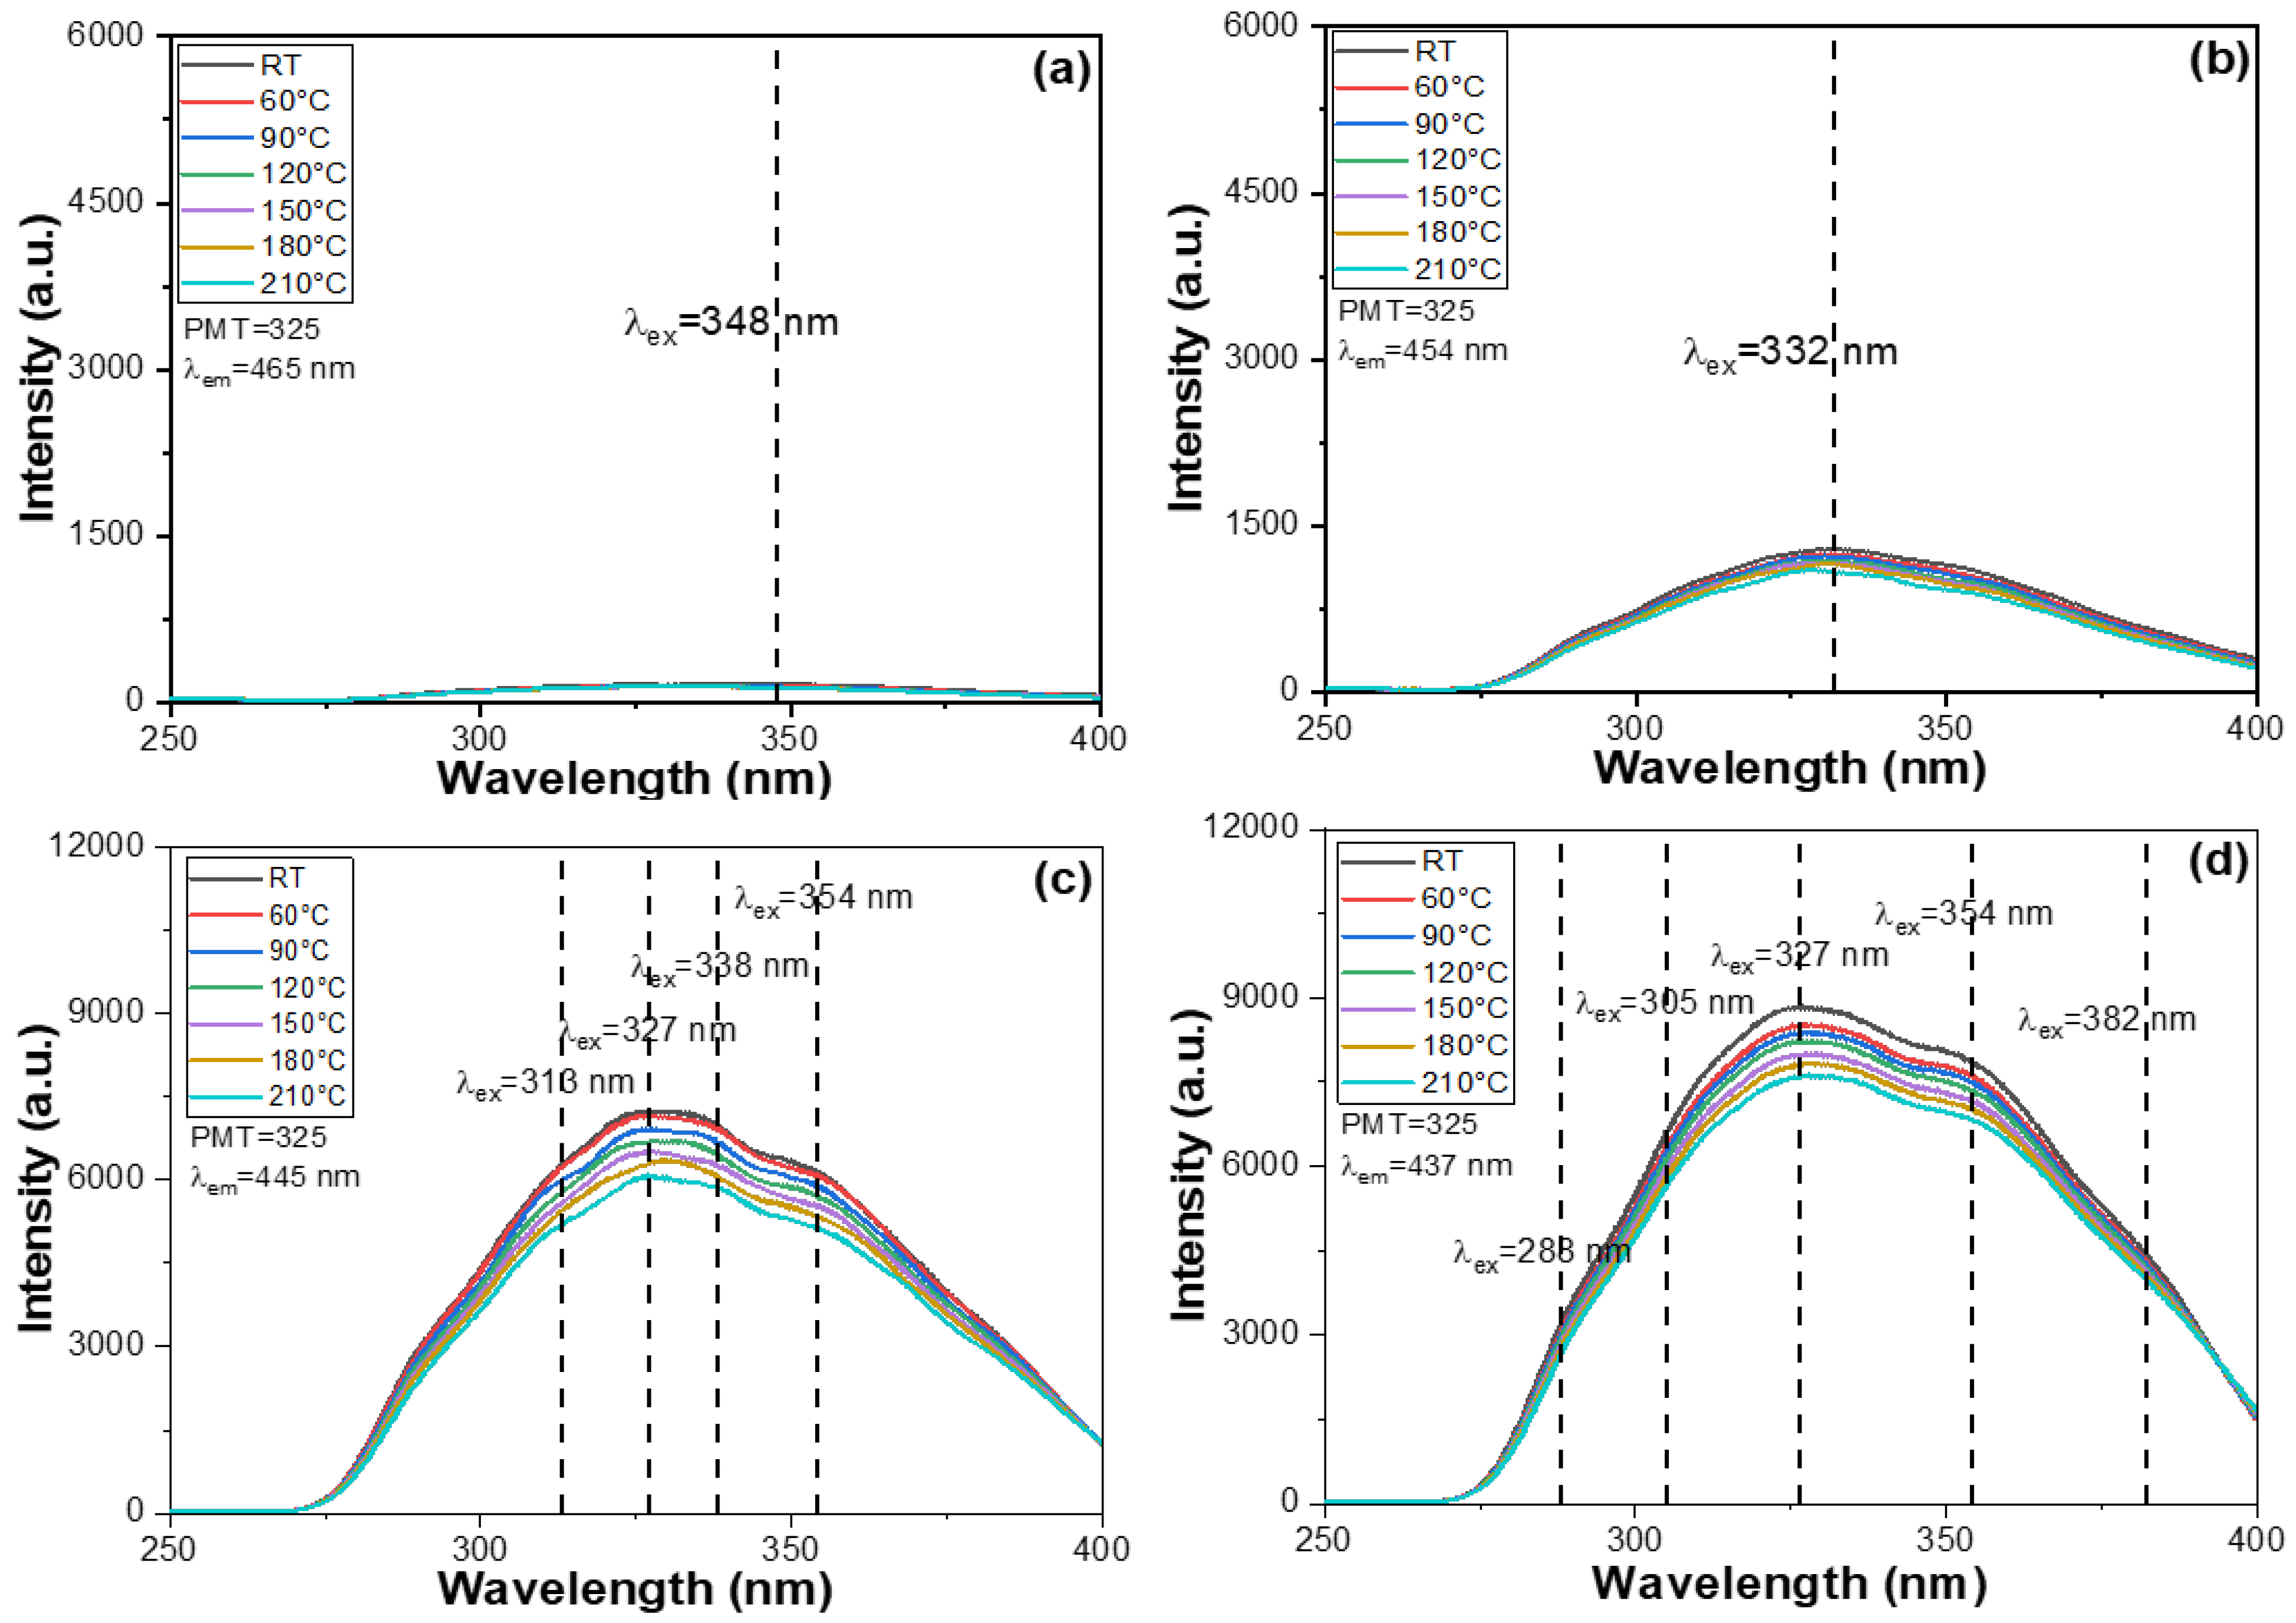
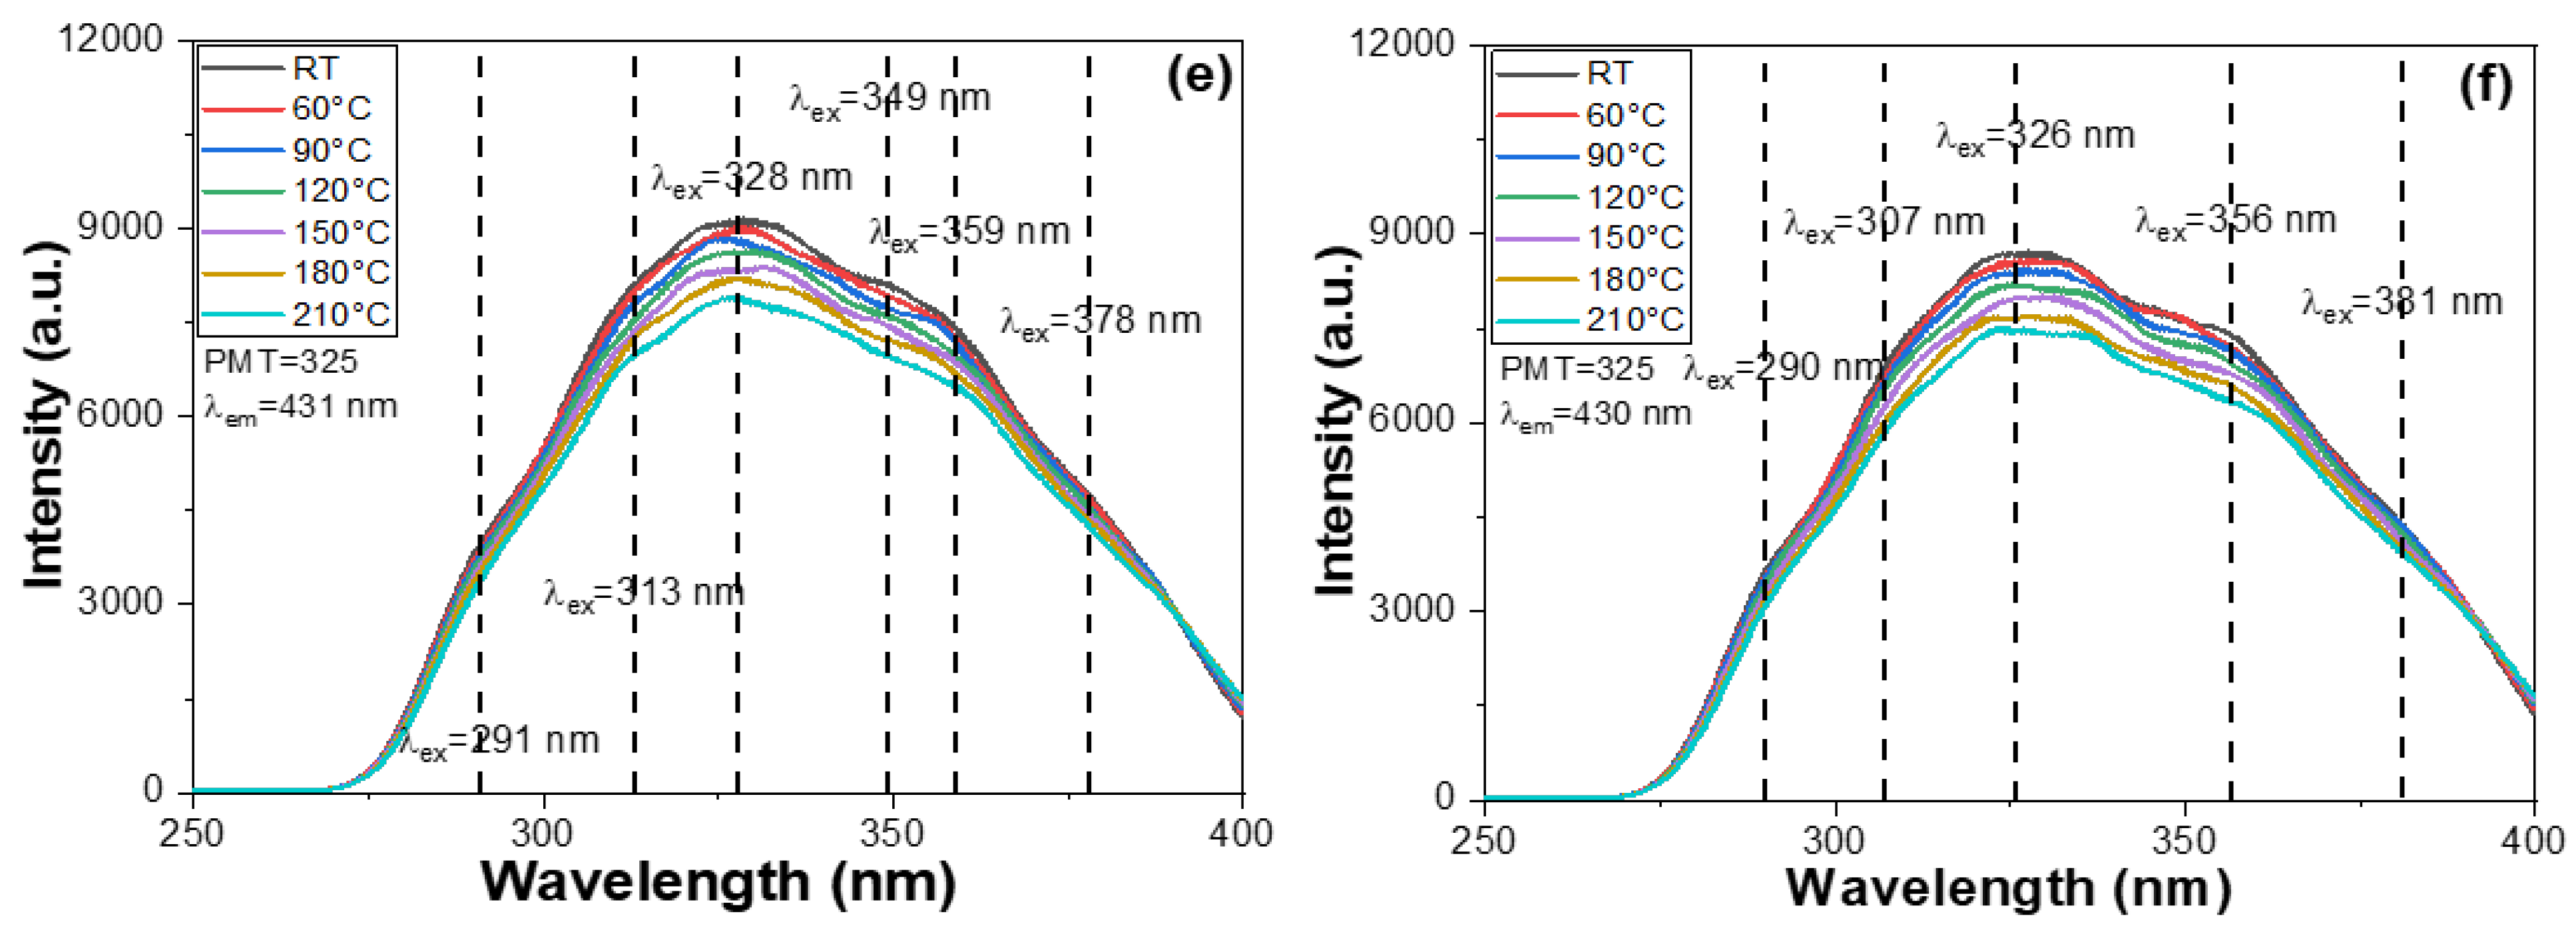
Another important focus of this study is to analyze the impact of BaO content on the PLE and PL properties of the synthesized M-E-SBMSO-
x phosphors. The PLE spectra of these phosphors were recorded under varying BaO content conditions. For the M-E-SBMSO-
x phosphors with
x = 0, 0.3, 0.6, 0.9, 1.2, and 1.5, the PLE spectra were measured using a spectrophotometer while monitoring emission at 465, 454, 445, 437, 431, and 430 nm, respectively. The rationale behind selecting different monitoring wavelengths will be discussed in a later section. These measurements were conducted within the spectral range of 250–400 nm, and temperature conditions were varied from room temperature to 210 °C. The results for the M-E-SBMSO-
x phosphors with
x = 0, 0.3, 0.6, 0.9, 1.2, and 1.5 are presented in
Figure 3a,
Figure 3b,
Figure 3c,
Figure 3d,
Figure 3e, and
Figure 3f, respectively. The emission intensities observed across the entire PLE spectra of the synthesized M-E-SBMSO-
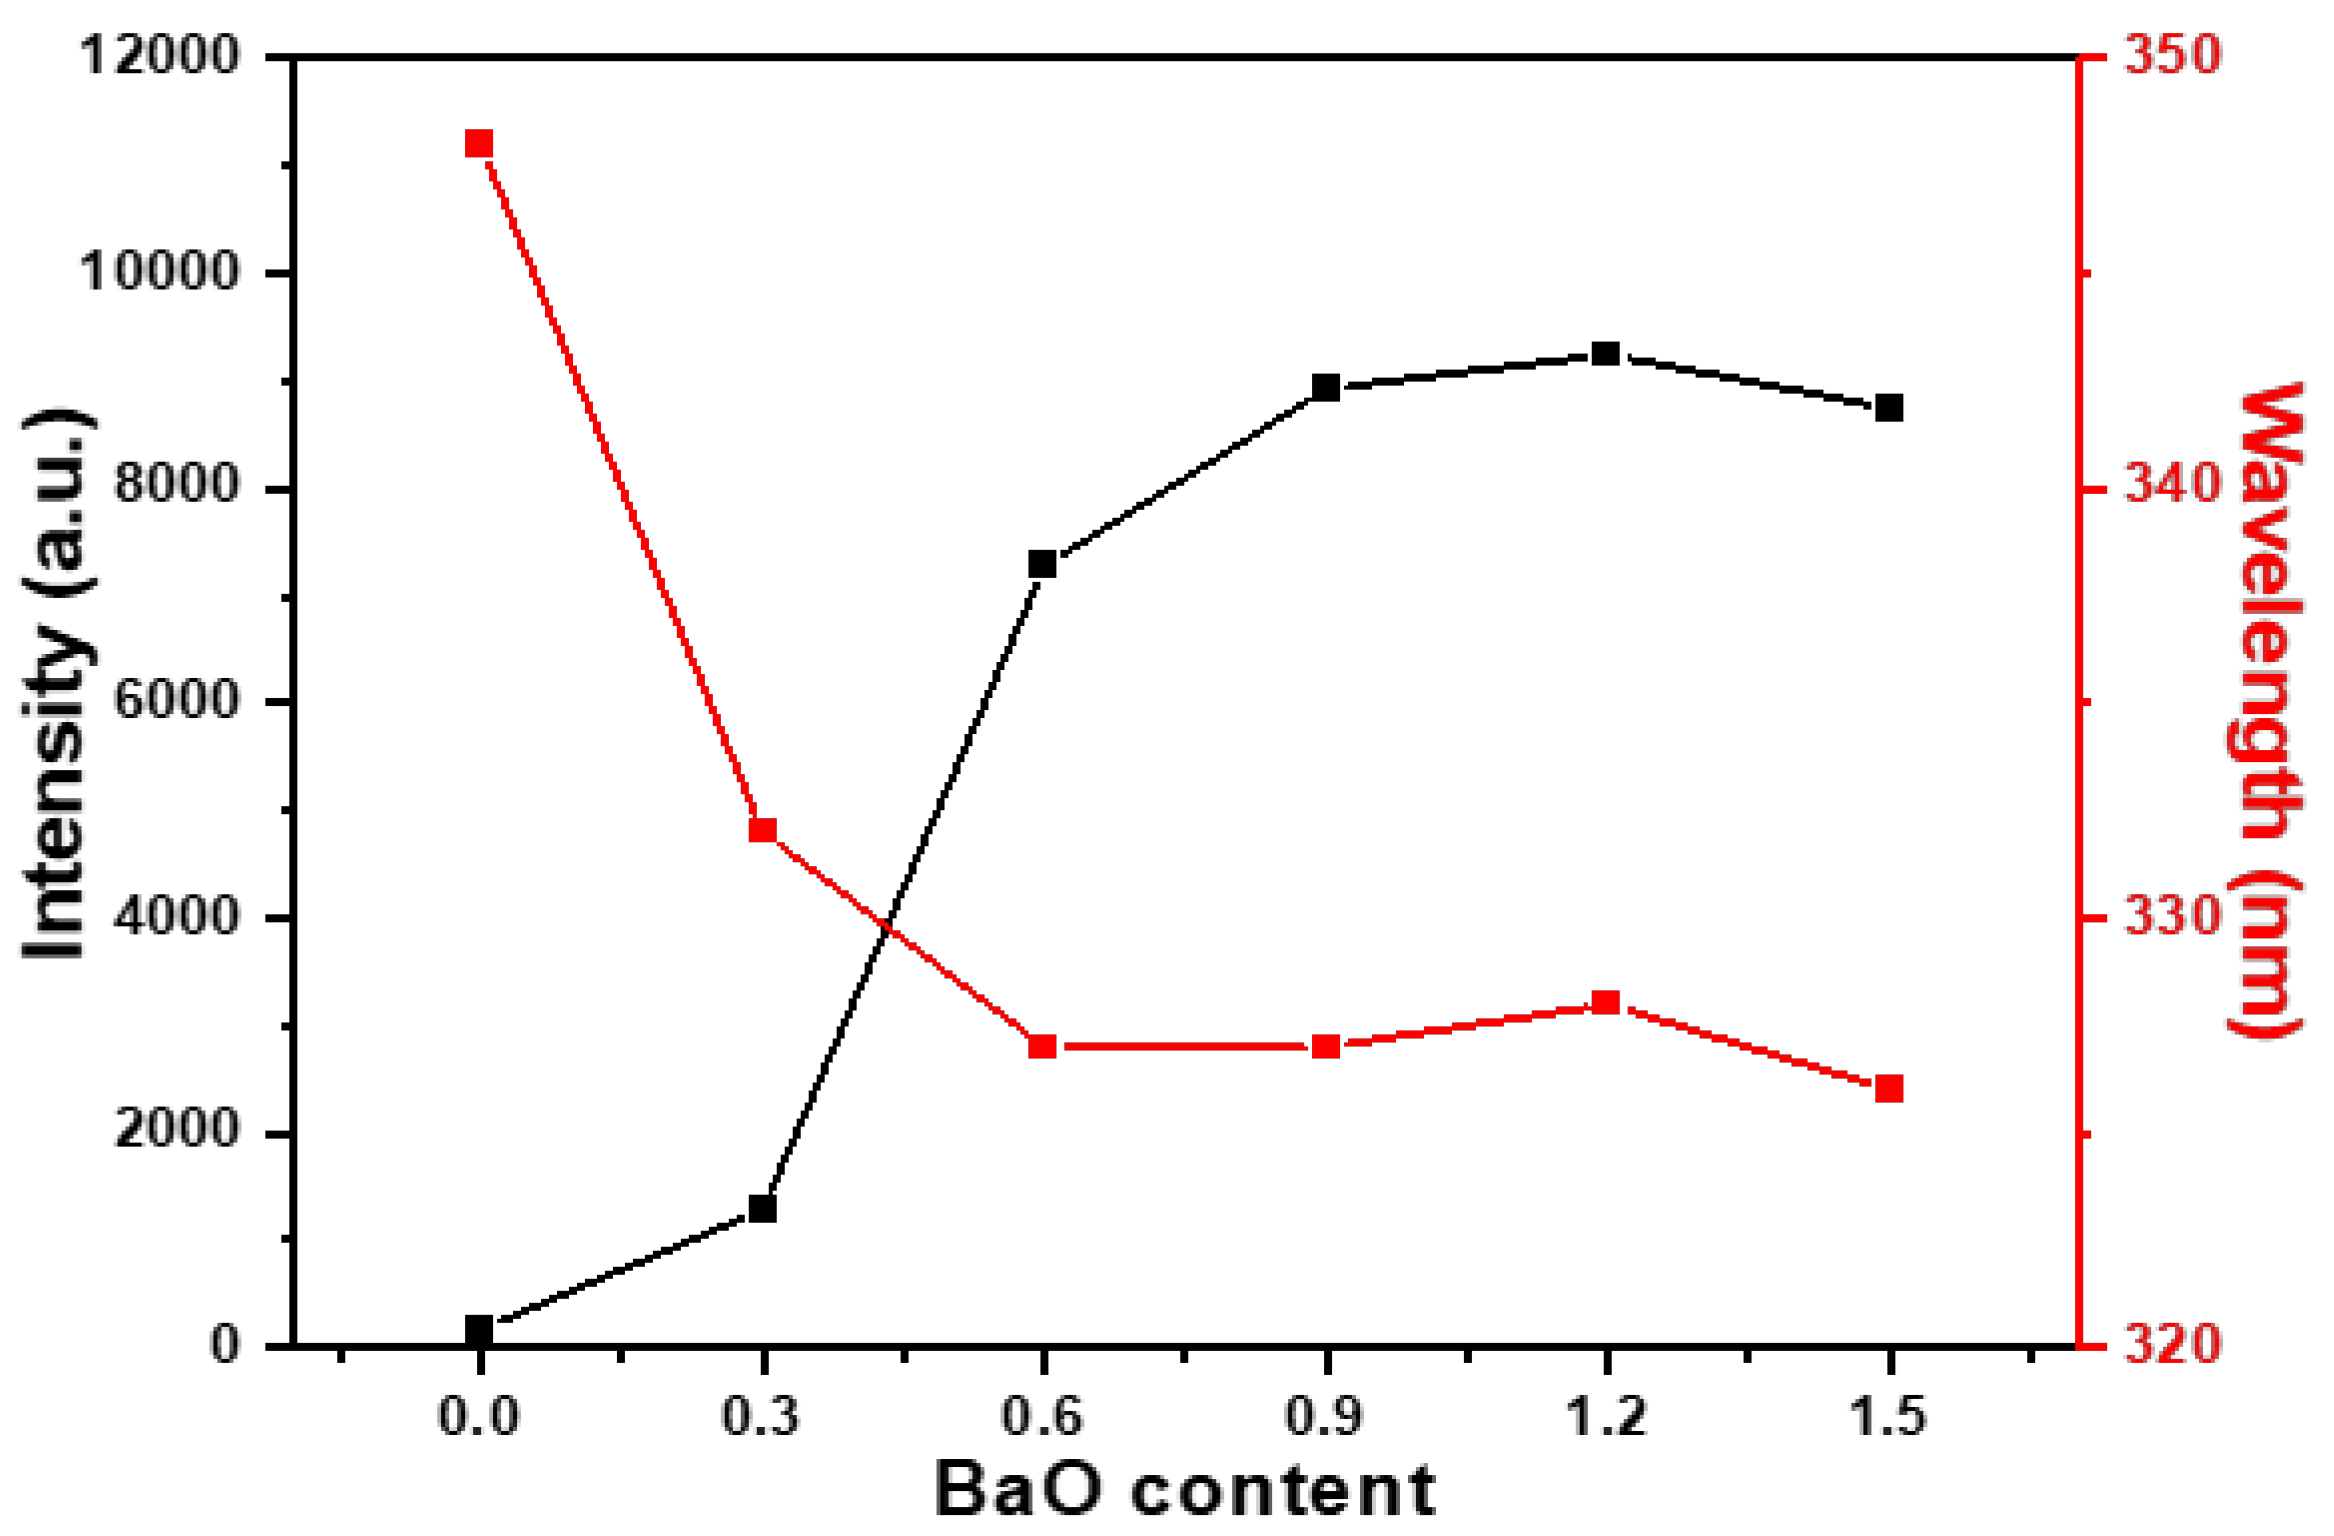
x phosphors showed a significant increase as the BaO content increased from 0 to 0.6. Beyond this point, the PLE spectra slightly increased as the BaO content rose from 0.6 to 1.2, reaching a maximum at
x = 1.2. However, as the BaO content was further increased to 1.5, the intensities declined slightly, as shown in
Figure 3f and
Figure 4. These results indicate that BaO content plays a crucial role in influencing the optical properties of the M-E-SBMSO-
x phosphors.
It is important to note that previous studies have primarily focused on investigating the PL spectra and have not provided detailed insights into the PLE spectra [
15,
16]. We hypothesize that the changes observed in the PLE spectra of the M-E-SBMSO-
x phosphors are a result of substituting SrO with BaO. For the M-E-SBMSO-
x phosphors with
x = 0.6, 0.9, 1.2, and 1.5, similarly broad PLE spectra were observed, each displaying three indistinct yet notable excitation peaks. These PLE spectra exhibited multiple excitation bands, all located in the range of 288–382 nm. The presence of multiple peaks in the PLE spectra is attributed to the complex electronic transitions within the host lattice and dopant ions. These transitions involve various energy levels, including the charge transfer transitions and 4f-5d transitions of rare-earth dopants, as well as possible crystal field effects and lattice distortions caused by compositional variations. This leads to the overlapping of several excitation bands, resulting in multiple distinct peak features. For the M-E-SBMSO-
x phosphors with
x = 0, 0.3, 0.6, 0.9, 1.2, and 1.5, the PLE spectra were recorded using the spectrophotometer while monitoring emission at 465, 454, 445, 437, 431, and 430 nm, respectively. As
Figure 4 shows, for all M-E-SBMSO-
x compositions, the maximum PLE wavelengths (PLEmax) were recorded at 348, 332, 327, 327, 328, and 326 nm for
x = 0, 0.3, 0.6, 0.9, 1.2, and 1.5, respectively. A noticeable blue shift of the main excitation peak was observed with increasing BaO content, which eventually saturated in the M-E-SBMSO-0.6 phosphor.
This blue shift is primarily attributed to the gradual substitution of Sr
2+ ions with Ba
2+ ions in the host lattice. Since Ba
2+ has a larger ionic radius than Sr
2+, this substitution leads to lattice expansion and a change in the local crystal field environment around the activator ions. These changes increase the energy separation between the ground and excited states of the luminescent centers, resulting in a higher energy (shorter wavelength) excitation, hence the observed blue shift. However, beyond
x = 0.6, the lattice reaches a structural saturation point where further incorporation of Ba
2+ has minimal impact on the crystal field strength, leading to the stabilization (or saturation) of the excitation peak position. Consequently, these specific peak wavelengths were selected as the excitation wavelengths (λex) for recording the PL spectra and determining the PL emission maxima (PLmax) of the M-E-SBMSO-
x phosphors. Upon heating the M-E-SBMSO-
x phosphors from 30 °C to 210 °C, only slight decreases in emission intensities were observed in both the PLE and PL spectra, as shown in
Figure 3. The M-E-SBMSO-0 sample was excluded from further analysis due to its extremely low signal intensity and resulting measurement errors. Based on repeated experimental measurements, the PLEmax intensities of M-E-SBMSO-
x phosphors at 210 °C decreased to approximately 84.4% ± 2.1%, 83.6% ± 2.0%, 86.1% ± 2.1%, 86.4% ± 1.9%, and 85.9% ± 2.0% for
x = 0.3, 0.6, 0.9, 1.2, and 1.5, respectively, relative to their initial values at room temperature.
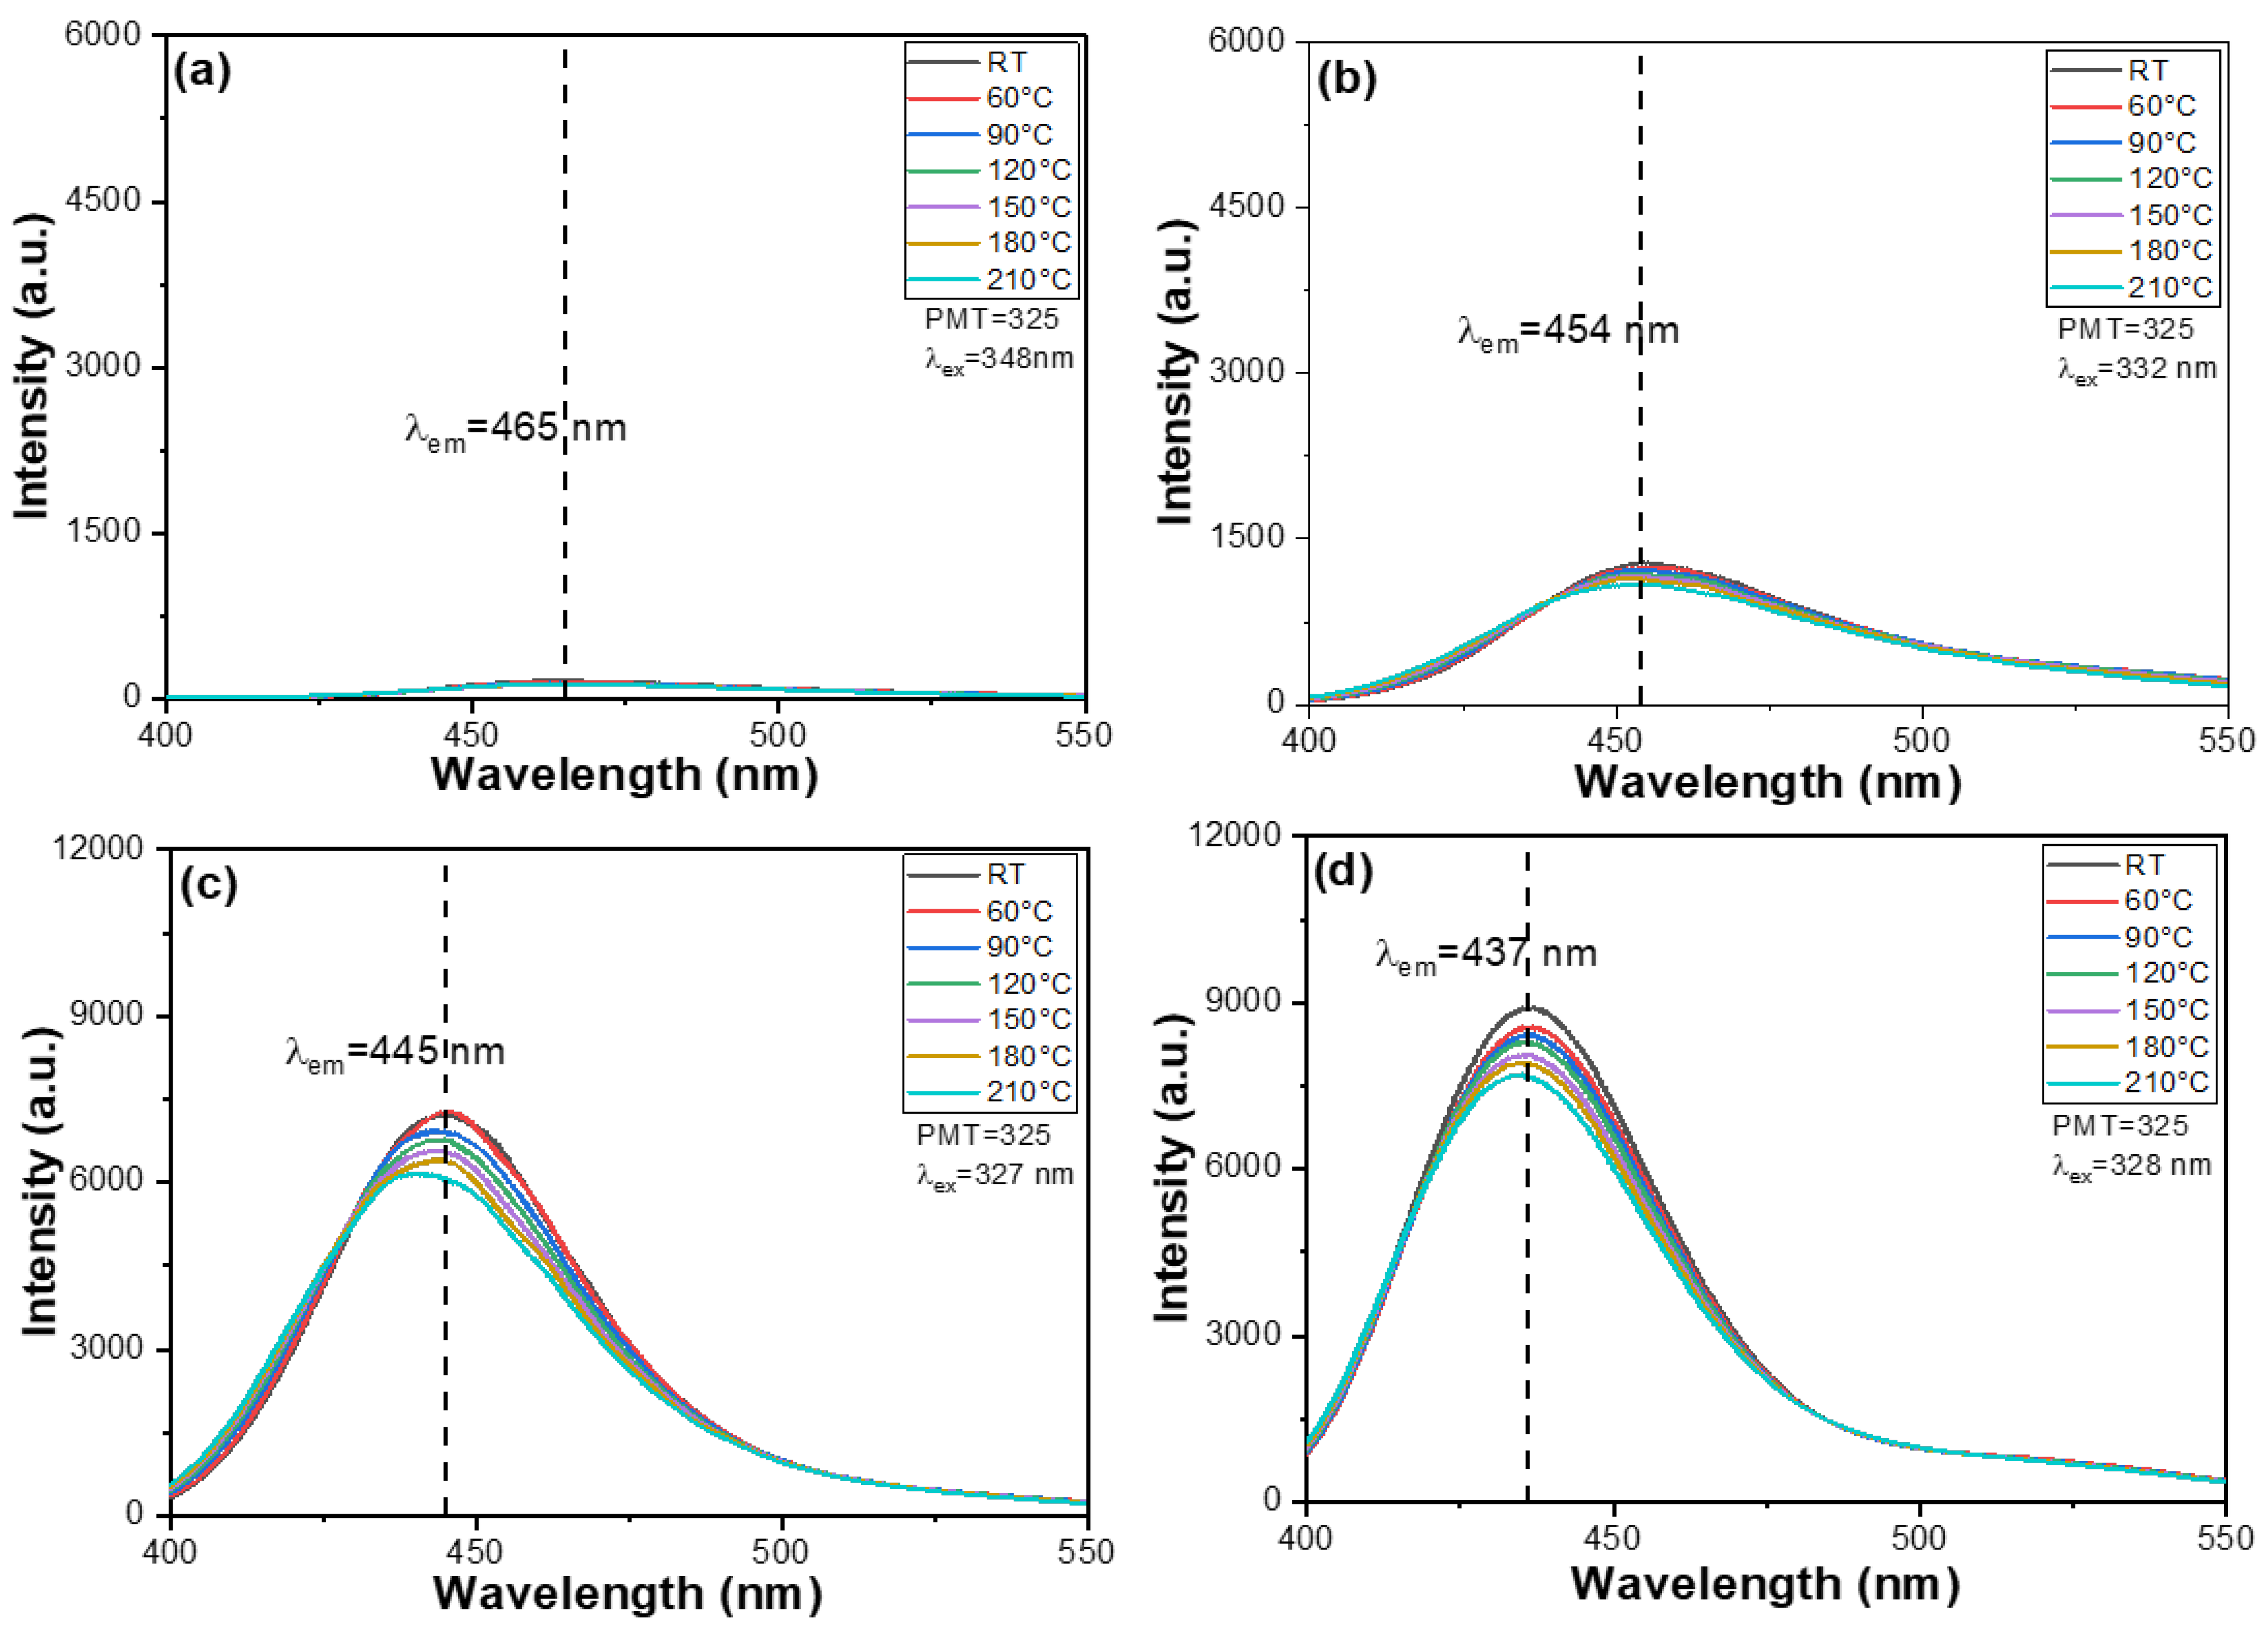
For the M-E-SBMSO-
x phosphors with
x = 0, 0.3, 0.6, 0.9, 1.2, and 1.5, PL spectra were recorded using excitation wavelengths of 348, 332, 327, 327, 328, and 326 nm, respectively. The emission spectra were collected over a wavelength range of 400–550 nm, with systematic variation in BaO content, and measurements were conducted at temperatures ranging from room temperature up to 210 °C. The PL spectra corresponding to different BaO contents are shown in
Figure 5a–f, and the wavelengths at which the PL intensity reaches its maximum (PLmax) and the values of PLmax are summarized in
Figure 6. When
x = 0, 0.3, 0.6, 0.9, 1.2, and 1.5, the PLmax wavelengths were observed at 465, 454, 445, 437, 431, and 430 nm, respectively. A distinct blue shift in PLmax is observed as the value of x increases, from 465 nm at
x = 0 to 430 nm at
x = 1.5. This phenomenon is primarily attributed to structural and electronic modifications in the host lattice induced by the increasing BaO content. The substitution of Ba
2+ ions into the lattice alters the crystal field environment around the luminescent centers. Ba
2+ has a larger ionic radius and different electro-negativity compared to the cations it replaces, which results in local distortion of the crystal lattice. In this study, Ba
2+ primarily substitutes for Sr
2+ sites. It is unlikely to replace Mg
2+ (0.76 Å) due to the significant difference in ionic radii. This distortion modifies the symmetry and bonding configuration around the activator ions, thereby influencing the energy levels of their excited states. As BaO content increases, the host matrix tends to create a stronger crystal field and possibly introduces more covalent character into the surrounding bonds. These changes typically lead to a widening of the energy gap between the excited and ground states of the activator ions. A wider energy gap means the emitted photons have higher energy, which corresponds to a shorter emission wavelength, hence the observed blue shift. Additionally, the increasing BaO concentration may also lead to changes in lattice rigidity or phonon interactions, which can further influence the emission behavior. The gradual blue shift in PLmax with increasing x reflects a combined effect of crystal field modification, lattice distortion, and energy level redistribution within the phosphor materials.
It is worth noting that although slight variations in emission intensity were observed in both the PLE and PL spectra, their overall spectral shapes and trends remained largely consistent throughout the series. As the value of
x increased from 0 to 1.5, the PLmax intensity, similar to the PLEmax intensity, initially increased, reaching a maximum at
x = 1.2. However, upon further increasing
x to 1.5, a slight decrease in PLmax was observed. The initial increase in PLmax intensity with rising
x can be attributed to the optimized modification of the crystal environment. Previous studies showed that Sr
2MgSi
2O
7:Eu
2+ phosphor exhibits a broad emission band centered around 470 nm under UV excitation [
17]. In the present study, the content of Sr
2MgSi
2O
7 decreases progressively with increasing BaO concentration. At
x = 0, the PLE and PL spectra of the M-E-SBMSO-0 phosphor exhibit very weak intensities. Notably, as the BaO content increases, particularly when
x is equal to or greater than 0.9, the intensity of the Sr
2MgSi
2O
7 crystalline phase diminishes significantly, while the corresponding PLE and PL intensities of the phosphors increase markedly. This inverse relationship strongly indicates that the Eu
2+-doped Sr
2MgSi
2O
7 phase does not contribute significantly to the observed luminescence and can therefore be excluded from consideration when evaluating the emission behavior of the codoped phosphor system.
The gradual introduction of BaO enhances the crystal field around the luminescent centers, improving energy transfer and increasing radiative recombination efficiency. This leads to a stronger emission up to x = 1.2. However, as x continues to increase beyond this optimal point, a slight decline in intensity is observed at x = 1.5. This can be explained by the onset of concentration quenching or structural distortion effects. At higher BaO concentrations, excessive distortion of the host lattice may occur, potentially introducing non-radiative defect states or increasing interactions among activator ions. These interactions can facilitate non-radiative energy losses, such as cross-relaxation or energy migration to quenching centers, thereby reducing the luminescence efficiency. While moderate BaO incorporation enhances luminescence, excessive addition can negatively impact the structural integrity and optical performance of the phosphor, leading to the observed decline in PLmax intensity. Based on repeated experimental measurements, the PLmax intensities of M-E-SBMSO-x phosphors at 210 °C decreased to approximately 87.0% ± 1.9%, 83.5% ± 2.2%, 86.5% ± 2.0%, 86.9% ± 1.9%, and 86.5% ± 2.1% for x = 0.3, 0.6, 0.9, 1.2, and 1.5, respectively, relative to their initial values at room temperature.
This, in turn, leads to a decrease in both emission intensity and the overall efficiency of the fabricated LEDs. The measured PLE and PL spectra are presented in
Figure 3 and
Figure 5, respectively. Furthermore, the temperature-dependent behavior of the M-E-SBMSO-
x phosphors was evaluated over a temperature range of 30 °C to 210 °C in 30 °C increments. These measurements were conducted at suboptimal emission and excitation wavelengths, also indicated in
Figure 3 and
Figure 5, to examine the effect of temperature on variations in the PLE and PL spectra, as well as on their peak intensities.
Figure 5 further illustrates that, as the temperature increases from room temperature to 210 °C, the PL peak wavelengths (PLmax) for x values of 0.3, 0.6, 0.9, 1.2, and 1.5 shifted from 454, 445, 437, 431, and 430 nm to 458, 454, 442, 430, and 434 nm, respectively. Notably, with an increase in BaO content from
x = 0.6 to
x = 1.5, the M-E-SBMSO-
x phosphors demonstrate improved thermal stability while retaining the desired emission wavelengths. The absolute photoluminescence quantum yield (PLQY) is used as an indicator of the emission efficiency of the synthesized phosphors [
18]. To ensure accuracy, PLQY errors were calculated based on the standard deviation of eight independent measurements for each x value. The resulting PLQY values for
x = 0.3, 0.6, 0.9, 1.2, and 1.5 were 0.234 ± 0.019, 0.475 ± 0.027, 0.683 ± 0.029, 0.865 ± 0.031, and 0.818 ± 0.030, respectively.
For M-E-SBMSO-x phosphors (x = 0–1.5), when x = 0.9, a subtle emission peak appeared at approximately 515 nm, and this emission peak became more pronounced as x increases to 1.2 and 1.5. The subtle emission peak observed at around 515 nm in M-E-SBMSO-x phosphors when x = 0.9, which becomes more prominent as the BaO content increases to x = 1.2 and 1.5, can be attributed to the electronic transitions of Mn2+ ions in the crystal lattice. This phenomenon occurs primarily because the progressive substitution of SrO by BaO atoms alters the local crystal field environment surrounding the manganese activator ions. Since Ba2+ has a larger ionic radius than Sr2+, its incorporation causes lattice expansion and modifies the coordination geometry around Mn2+ ions. These structural changes affect the energy levels of the Mn2+ 4T1→6A1 transition, which is responsible for the green emission at approximately 515 nm. Additionally, the increased BaO content may enhance energy transfer pathways between Eu2+ and Mn2+ ions, leading to more efficient excitation of the Mn2+ centers. The gradual structural transformation of the host lattice with increasing BaO content likely creates a more favorable environment for this specific emission, possibly by reducing non-radiative relaxation pathways or optimizing the distribution of activator ions across crystallographic sites that favor green emission characteristics. These cumulative effects result in the gradual enhancement of the 515 nm emission peak as the BaO concentration increases from x = 0.9 to x = 1.5 in the phosphor composition.
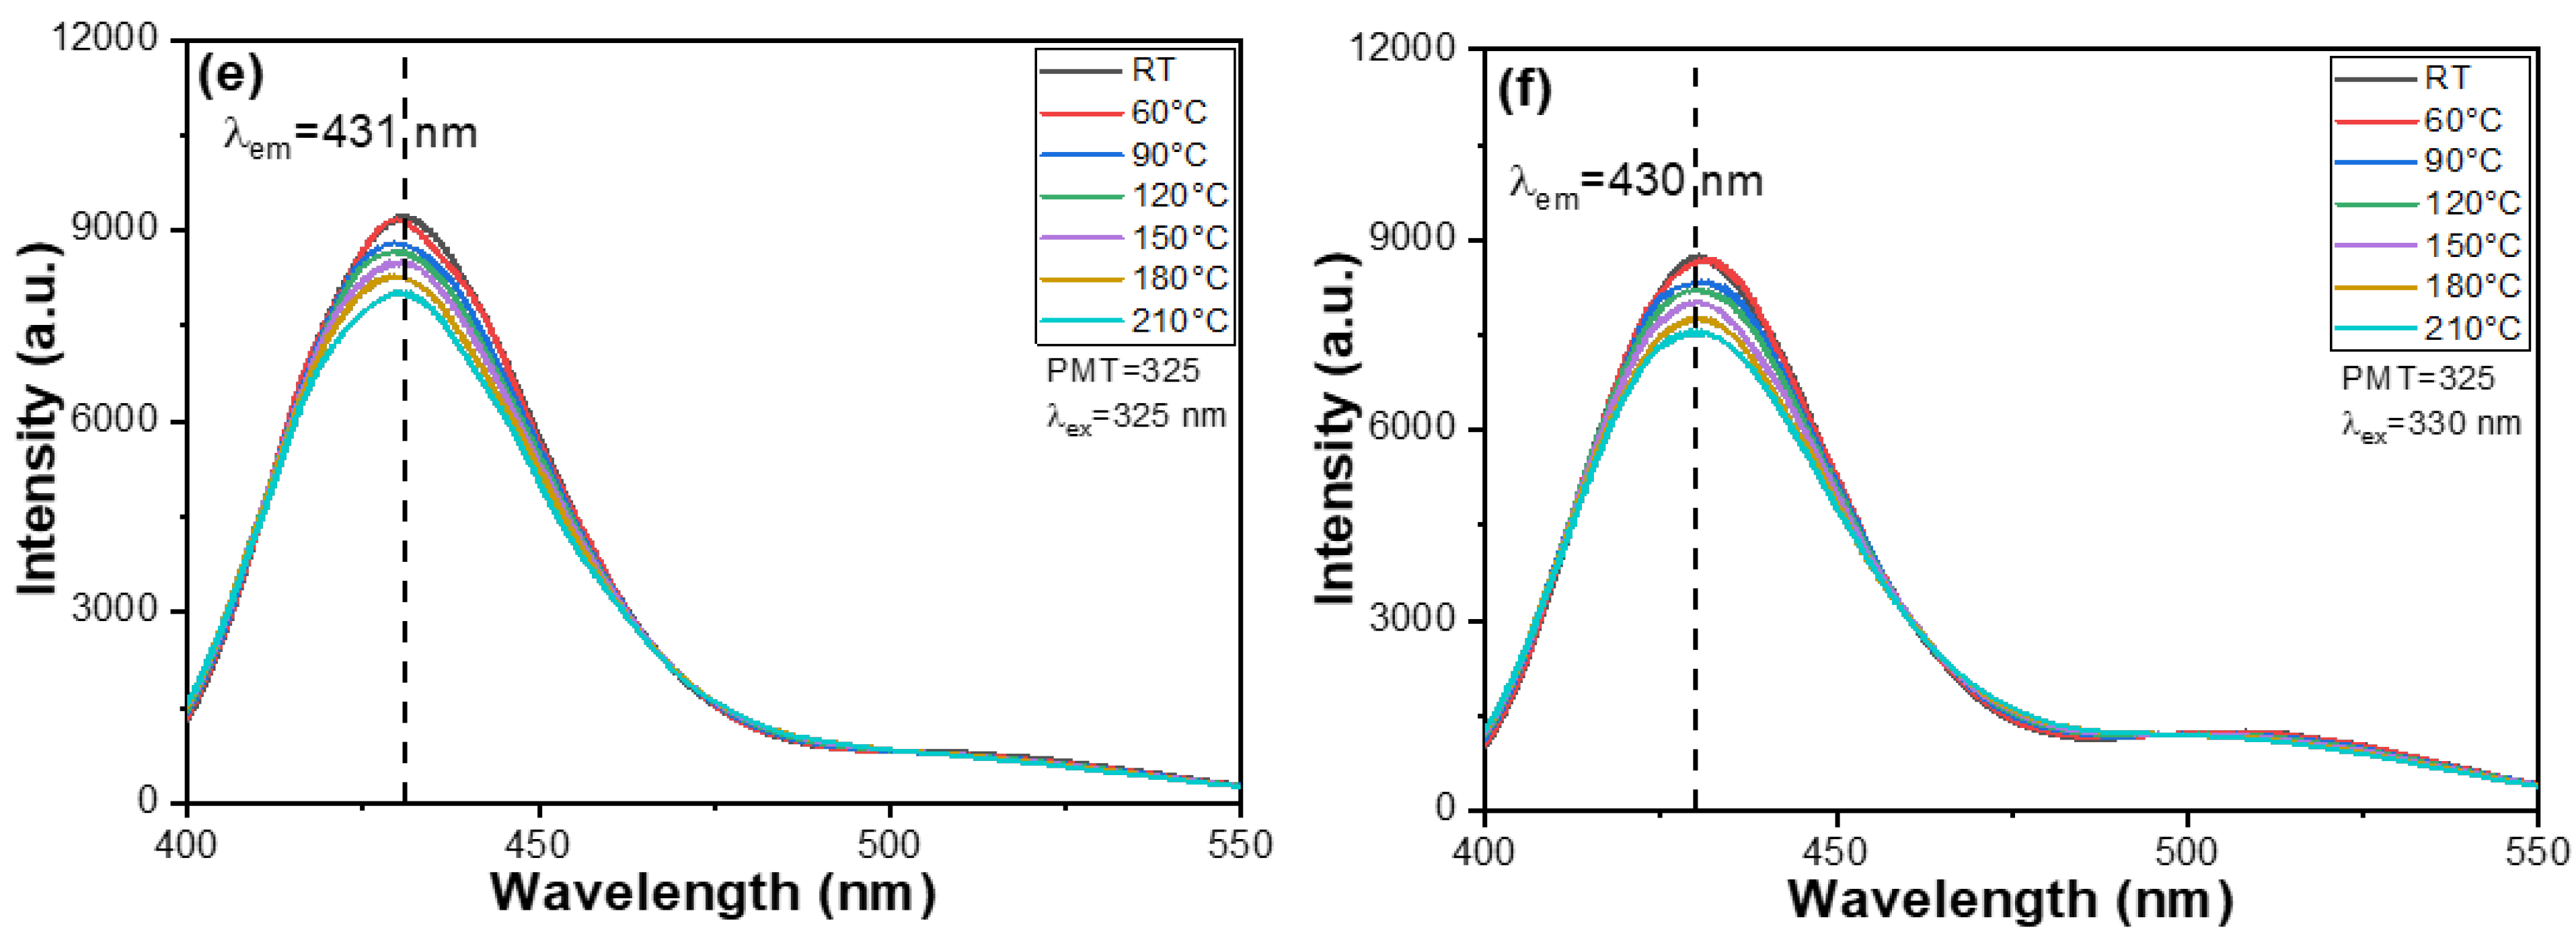
The chromaticity coordinates (CIE) analysis chart is a valuable tool for understanding the color properties of the materials, particularly the synthesized phosphors. It allows for the visualization of emitted light colors and facilitates comparisons across different phosphor concentrations. In this study, the phosphor’s position within the blue region of the CIE chart indicates blue light emission, consistent with the results obtained from PL measurements. This correlation further confirms the material’s fluorescence characteristics.
Figure 7 presents the CIE analysis chart showing the fluorescence spectra of M-E-SBMSO-
x phosphors with varying BaO content. The CIE values were as follows, (0.1770, 0.2264) at
x = 0; (0.1645, 0.1677) at
x = 0.3; (0.1566, 0.06616) at
x = 0.6; (0.1617, 0.06804) at
x = 0.9; (0.1617, 0.06055) at
x = 1.2; and (0.16197, 0.08377) at
x = 1.5. Notably, as the BaO content increases from 0.3 to 1.5, the emission peaks (PLmax) shift from 454 to 430 nm. Despite this shift, all corresponding CIE coordinates remain within the blue region, confirming that all M-E-SBMSO-
x phosphors emit blue light. This finding is significant for applications requiring specific color emissions, such as in display technologies, lighting systems, and various optical devices.
In this study, the decay time of M-E-SBMSO-
x phosphors is defined as the time required for the photoluminescence (PL) intensity to decrease from its maximum value to 1/e (approximately 36.8%) of that maximum. The M-E-SBMSO-0 and M-E-SBMSO-0.3 samples were excluded from comparison due to their low emission intensities. The optimal excitation wavelengths for the M-E-SBMSO-
x phosphors were found to be 332, 327, 327, 326, and 328 nm for x values of 0.3, 0.6, 0.9, 1.2, and 1.5, respectively, corresponding to their respective excitation peaks. Emission intensity decay measurements were conducted at wavelengths of 454, 445, 437, 431, and 430 nm for the same x values, chosen to align with their emission peaks and best represent their luminescence behavior.
Figure 8a,b present the decay curves for M-E-SBMSO-1.2 and M-E-SBMSO-1.5. The measured decay times for
x = 0.3, 0.6, 0.9, 1.2, and 1.5 were 0.333, 0.322, 0.319, 0.323, and 0.329 ms, respectively. These results indicate that the decay time initially decreases as the BaO content increases, reaching a minimum at
x = 0.9, and then increases with further additions of BaO. These two figures show that when the measured temperature changes, the variation in the displayed decay time is minimal. Moreover, the data in
Figure 8 indicate that decay time remains largely unaffected by BaO content and measured temperature, underscoring the excellent thermal stability of the M-E-SBMSO-
x phosphors.
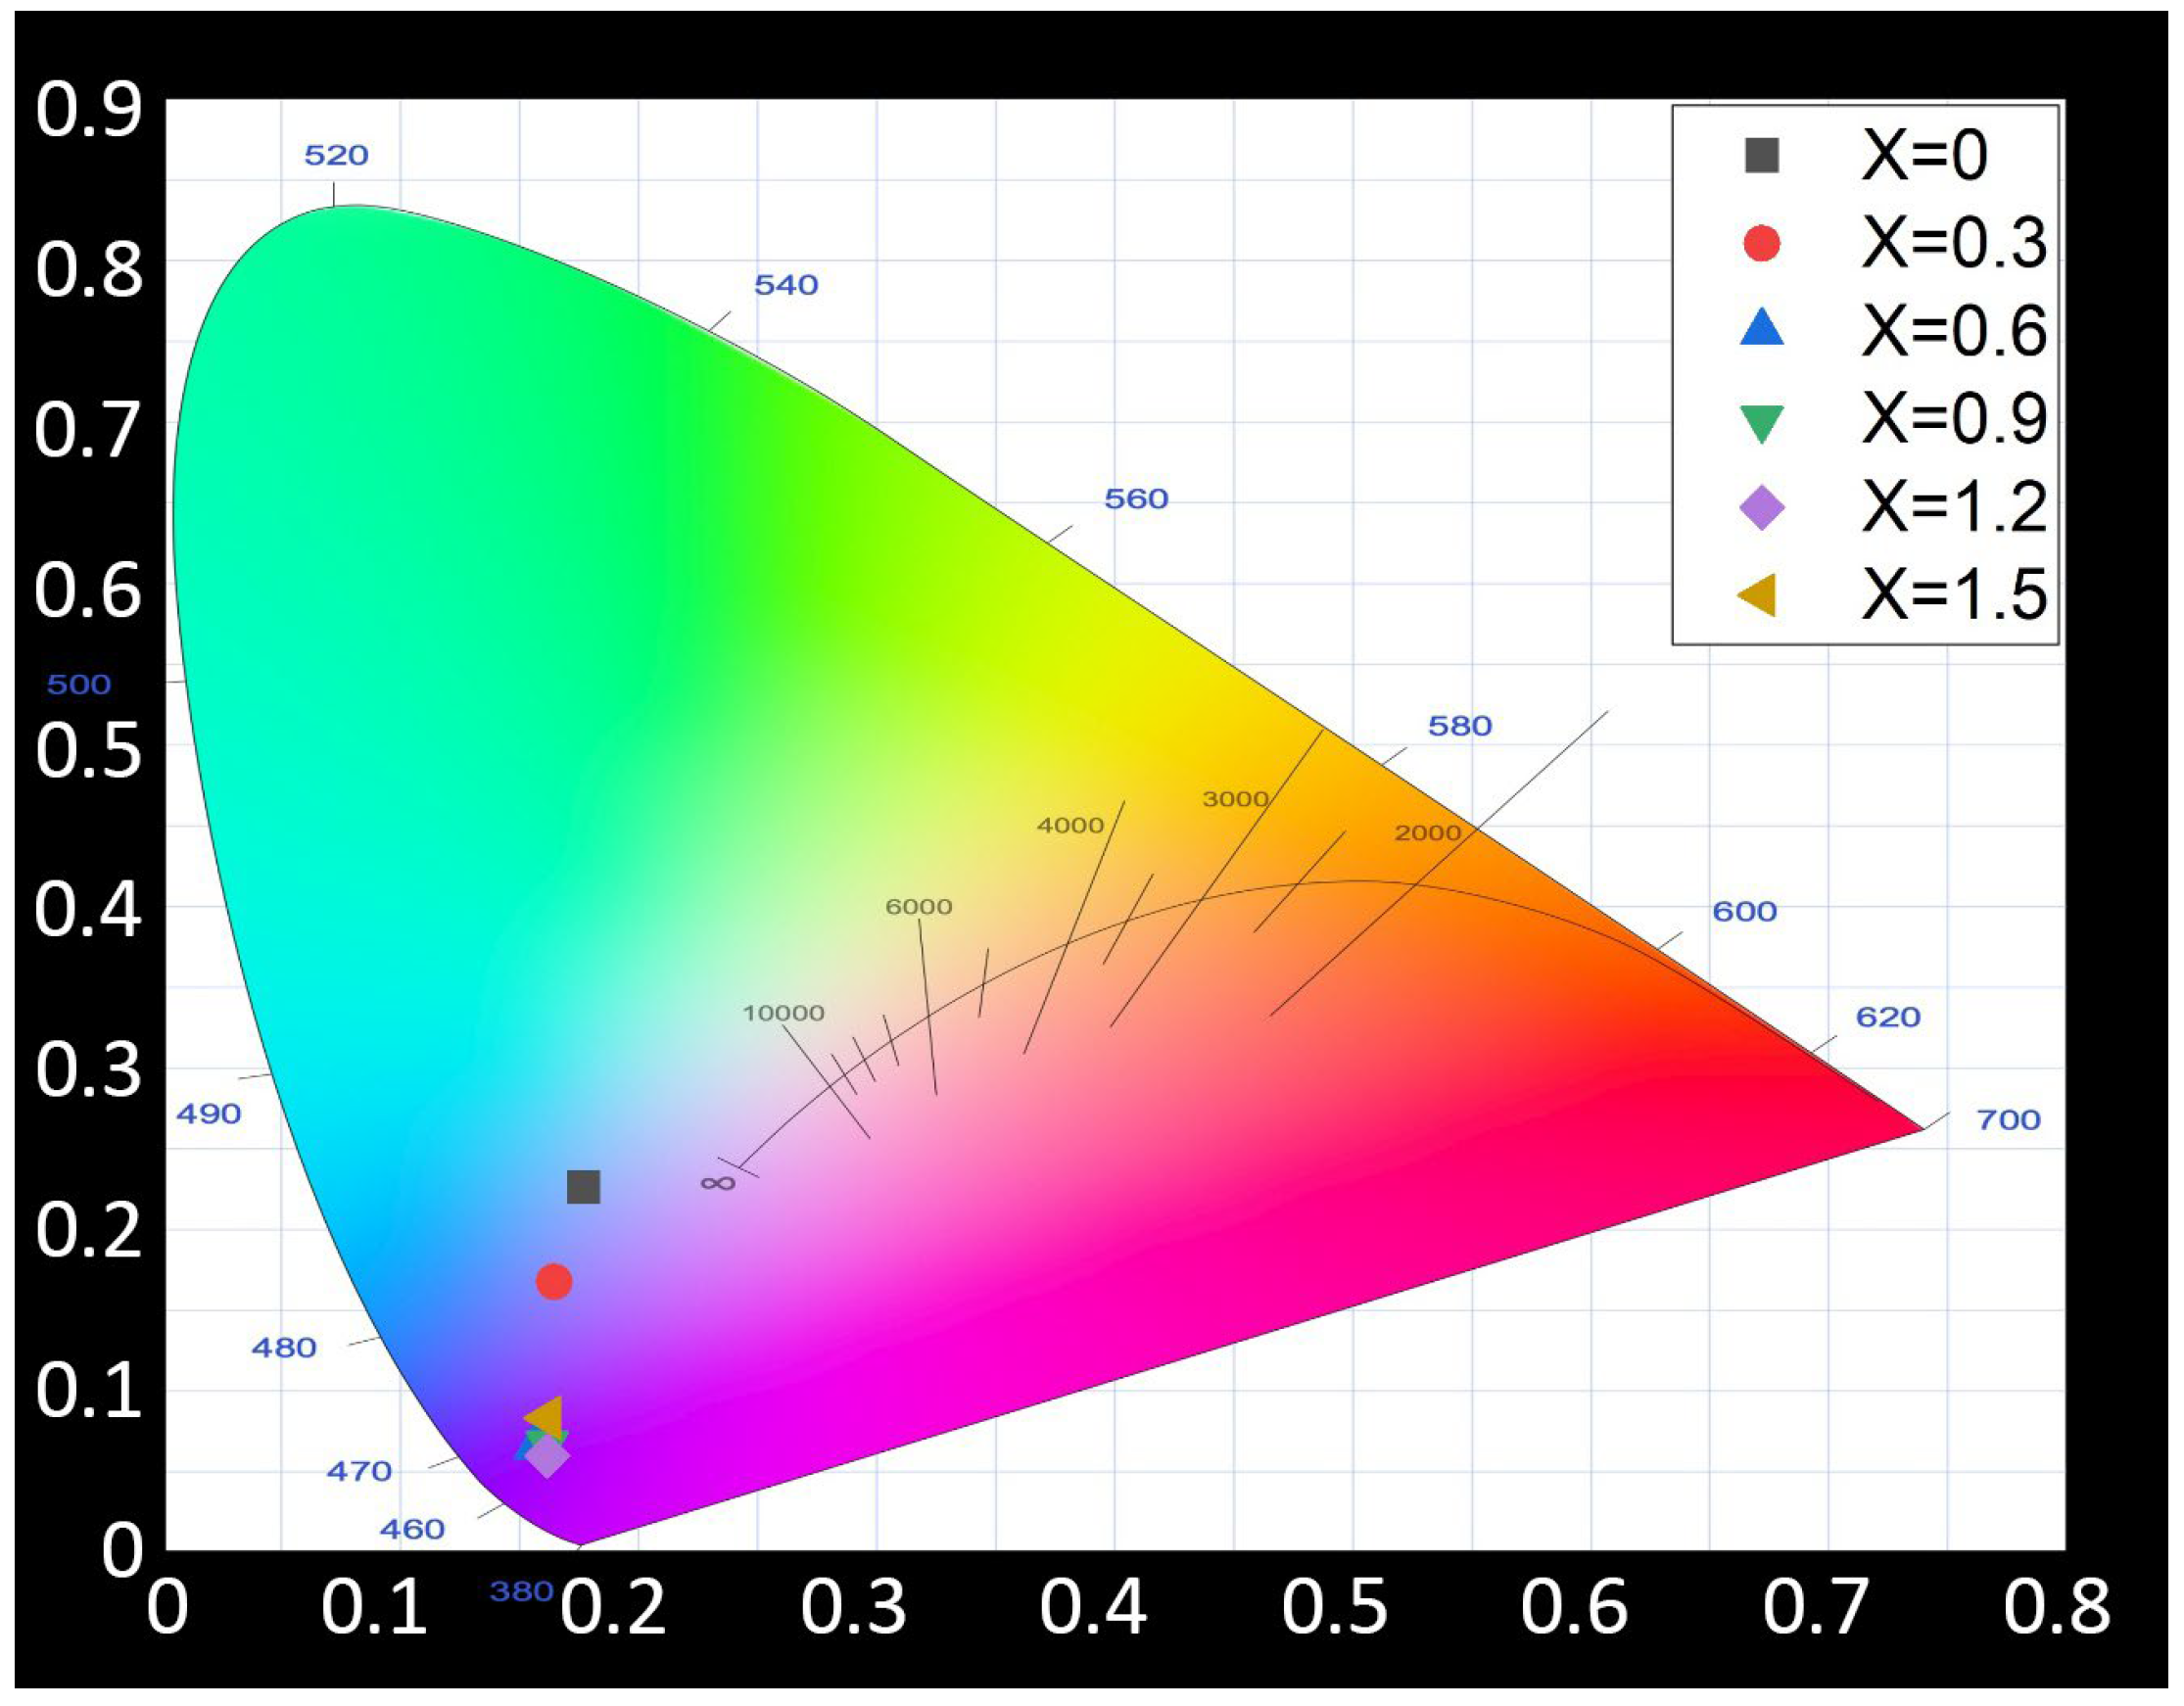
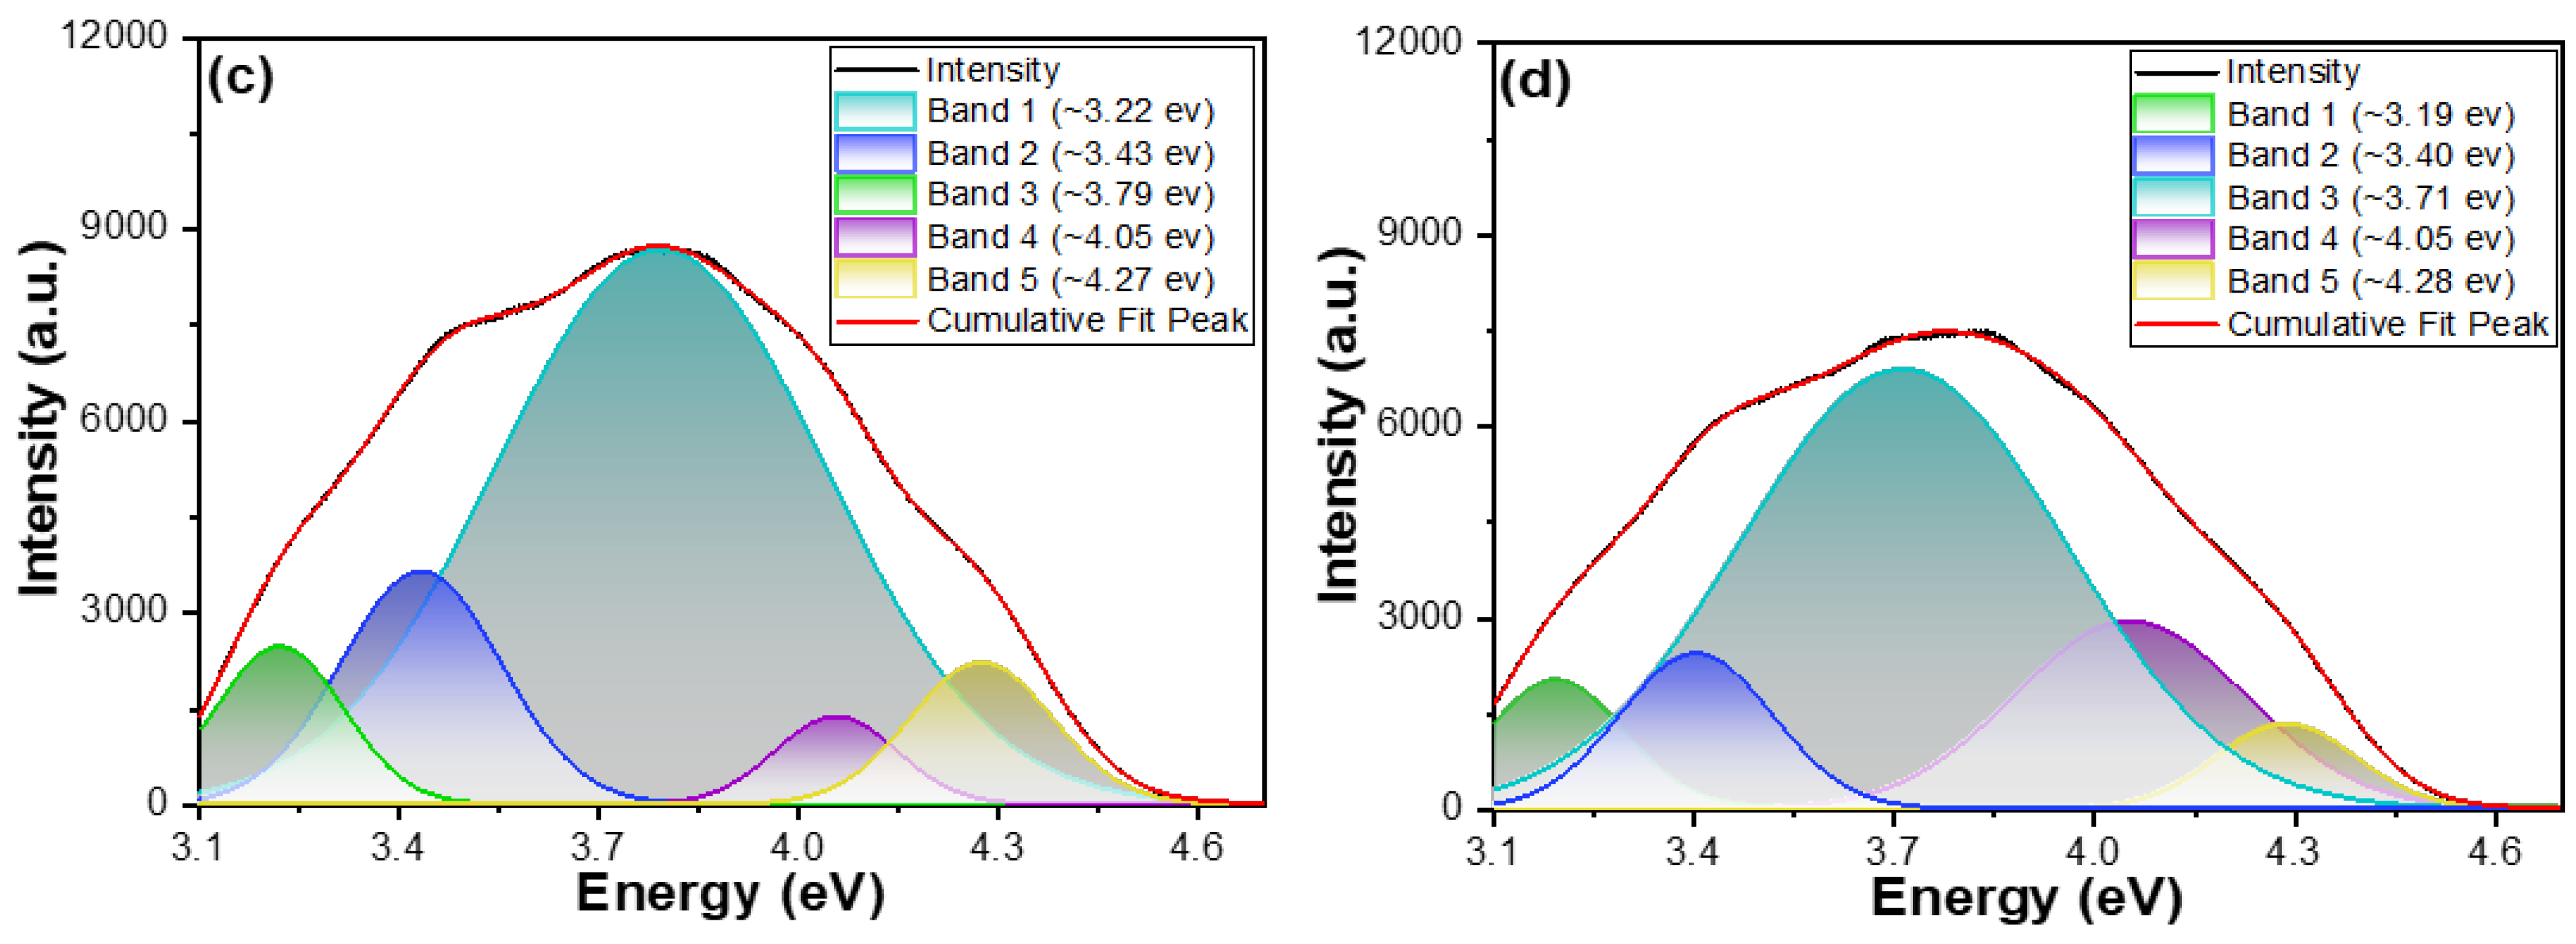
As shown in
Figure 3, the PLE spectra are clearly composed of multiple distinct peaks, prompting the use of Gaussian fitting for detailed analysis. The PLE spectra of M-E-SBMSO-1.2 and M-E-SBMSO-1.5 phosphors measured at different temperatures are shown in
Figure 9, with energy plotted on the x-axis instead of wavelength for better clarity. The f-d excitation transitions of Eu
2+ ions are complex and influenced by several factors. One key factor is the crystal field splitting of the 5d orbitals in the 4f
65d excited state. Additionally, spin-orbit coupling causes the 4f
6 configuration of Eu
2+ to split into seven
7F
j multiplets (j = 0–6), further broadening each excited band. The interaction between the 4f
6 core electrons and the 5d electrons also contributes to this broadening. As a result, the 4f
7 → 4f
65d
1 transition produces multiple overlapping bands in the excitation spectrum of the M-E-SBMSO-
x phosphors. The data in
Figure 8 confirm that these phosphors exhibit broad excitation features with two to three less pronounced peaks. To better interpret these spectra, the excitation data have been replotted against energy and analyzed using Gaussian fitting. This method helps reveal the underlying causes of spectral broadening and provides a clearer understanding of the excitation processes in the material.
When the PLE spectra of M-E-SBMSO phosphors are analyzed using Gaussian functions, a clear redshift in peak positions is observed as the temperature increases. In evaluating the quality of the Gaussian fitting applied to the PLE spectra, the coefficient of determination (R
2) is used as a key statistical indicator. R
2 measures how well the fitting model explains the variance in the experimental data, with values ranging from 0 to 1. An R
2 value of 1 indicates a perfect fit. As shown in
Figure 9, all fitting results exhibit R
2 values above 0.999, demonstrating an excellent agreement between the fitted Gaussian curves and the experimental PLE spectra. This strong correlation confirms the reliability of the fitting model in capturing the key spectral features. For the M-E-SBMSO-1.2 phosphor, the PLE spectrum at room temperature consists of five distinct peaks located at 3.23 eV, 3.44 eV, 3.77 eV, 4.04 eV, and 4.26 eV. At an elevated temperature of 210 °C, these peaks are 3.18 eV, 3.40 eV, 3.76 eV, 4.04 eV, and 4.26 eV, respectively. The two lower-energy peaks exhibit a noticeable redshift, with the transitions at 3.23 eV and 3.44 eV shifting to 3.18 eV and 3.40 eV. A similar trend is seen in the M-E-SBMSO-1.5 phosphor. At room temperature, its PLE spectrum shows peaks at 3.22 eV, 3.43 eV, 3.79 eV, 4.05 eV, and 4.27 eV. When measured at 210 °C, the peaks shift to 3.19 eV, 3.40 eV, 3.71 eV, 4.05 eV, and 4.28 eV. In this case, three of the peaks shift toward lower energies, indicating a slightly stronger thermal influence on this composition compared to M-E-SBMSO-1.2.
Although the spectra were deconvoluted using Gaussian functions tailored to two different phosphor compositions, the resulting five sub-peaks identified in each case exhibit very similar energy positions. This suggests that the fundamental excitation processes are comparable between the two materials, with only subtle differences in their thermal responses. The results presented in
Figure 8 also clearly highlight the excellent high-temperature stability of the M-E-SBMSO-
x phosphors. The bandgap of semiconductor materials tends to decrease as the temperature increases, leading to a redshift in the corresponding absorption or emission energies. This phenomenon is primarily driven by two physical mechanisms. First, lattice expansion occurs as the material heats up; thermal expansion increases the average atomic spacing, which in turn alters the electronic band structure. Second, electron–phonon interactions become more pronounced at elevated temperatures due to enhanced lattice vibrations (phonons), which affect the energy levels and their spacing. Together, these effects result in a narrowing of the bandgap, which shifts the excitation-related transitions in photoluminescence excitation (PLE) spectra to lower energies. This temperature dependence of the bandgap can be quantitatively described by the Varshni equation:
where Eg(T) is the bandgap at temperature T, and α and β are material-specific constants. Interestingly, only the lower-energy peaks in the PLE spectrum exhibit a noticeable redshift, while higher-energy peaks (such as those at 3.77 eV, 4.04 eV, and 4.26 eV) remain relatively unchanged. This behavior suggests that these higher-energy peaks originate from higher-order electronic states or excitonic transitions, or possibly from transitions involving defect or interface states. These states tend to be less sensitive to temperature-induced changes in the band structure or may arise through mechanisms unrelated to direct bandgap variations, thereby maintaining relatively stable energy positions despite the temperature increase.
The Stokes shift refers to the energy or wavelength difference between a material’s absorption and emission spectra. It is a key optical property used to understand how a phosphor re-emits light after absorbing excitation energy. Specifically, the Stokes shift describes how the emitted light has lower energy (longer wavelength) than the absorbed light, indicating that the phosphor absorbs higher-energy (shorter wavelength) photons and emits lower-energy photons in return. For the M-E-SBMSO-x phosphors for x = 0.3–1.5, the emission bands are sharp and centered at approximately 2.731 eV (454 nm for x = 0.3), 2.787 eV (445 nm for x = 0.6), 2.838 eV (437 nm for x = 0.9), 2.877 eV (431 nm for x = 1.2), and 2.884 eV (430 nm for x = 1.5), with corresponding full width at half maximum (FWHM) values of about 0.352 eV, 0.293 eV, 0.284 eV, 0.261 eV, and 0.259 eV. For M-E-SBMSO-x (x = 0–1.5) phosphors, the FWHM values of their PL spectra decrease with increasing BaO content. This phenomenon can be attributed to the following key factors:
(1) Enhanced lattice symmetry and reduced lattice strain: When Ba2+ ions (ionic radius ~1.35 Å) substitute for Sr2+ ions (ionic radius ~1.18 Å), the larger ionic size of Ba2+ induces a more relaxed and symmetric crystal structure. This structural modification leads to a more uniform local crystal field around the luminescent centers (e.g., Mn2+ and Eu2+), thereby reducing crystal field inhomogeneities and related energy level splitting. As a result, the likelihood of non-radiative transitions and phonon participation is decreased, contributing to a narrower emission bandwidth.
(2) Converged energy level distribution: The incorporation of Ba2+ can cause the energy levels of dopant ions to become more centralized. For Mn2+, a d-electron transition metal ion, the emission typically involves the spin-forbidden transition from the 3T2 to 3A2 state, which is highly sensitive to the strength and uniformity of the crystal field. A more consistent crystal field leads to a narrower energy distribution of emission peaks, thereby reducing the FWHM.
(3) Reduce the crystallinity of secondary phases: The presence of BaO may reduce the crystallinity of secondary phases in the host material and decrease the number of defects. This improvement helps minimize defect-related energy level broadening and band tailing effects, thereby contributing to a narrower PL emission.
(4) More efficient energy transfer mechanism: Ba2+ doping may also influence the energy transfer dynamics between Mn2+ and Eu2+ ions. A more efficient and streamlined energy transfer process can lead to sharper and more concentrated emission peaks, resulting in a reduced FWHM.
The gradual enhancement of the 515 nm green emission from Mn2+ with increasing BaO concentration in the M-E-SBMSO-x phosphors provides strong evidence for the existence of energy transfer from Eu2+ to Mn2+ ions. As Ba2+ incorporation leads to lattice expansion and structural modifications around Mn2+, it not only alters the Mn2+ energy levels but also facilitates more efficient energy transfer pathways between Eu2+ and Mn2+. The increased Mn2+ emission intensity, despite Mn2+ not being the primary absorber of excitation energy, suggests that Eu2+ ions act as sensitizers, absorbing energy and transferring it non-radiatively to Mn2+ centers. This behavior, coupled with the structural optimization that reduces non-radiative losses and improves ion distribution, supports the conclusion that energy transfer is a key mechanism contributing to the enhanced Mn2+ emission in this codoped phosphor system.
The Stokes shift refers to the difference in energy or wavelength between a substance’s absorption and emission spectra. It is a key optical property, often used to explain how a phosphor re-emits light after absorbing excitation energy. The Stokes shift is characterized by the emission spectrum having lower energy, or a longer wavelength, than the absorption spectrum. At room temperature, the estimated lowest 5d excitation bands for x = 0.3, 0.6, 0.9, 1.2, and 1.5 are 3.18 eV, 3.25 eV, 3.22 eV, 3.23 eV, and 3.22 eV, respectively. By calculating the energy differences between the emission peaks and the lowest 5d excitation bands, the Stokes shifts for x = 0.3, 0.6, 0.9, 1.2, and 1.5 are found to be approximately 0.449 eV, 0.412 eV, 0.382 eV, 0.353 eV, and 0.336 eV, respectively. These values highlight a trend of decreasing Stokes shift with increasing barium content. In the M-E-SBMSO-x phosphors (x = 0.3–1.5), an increase in BaO content causes the PL emission wavelength to blue shift from 454 nm to 430 nm, while the Stokes shift decreases from 0.449 eV to 0.336 eV.
This behavior is primarily attributed to the gradual substitution of Sr2+ by Ba2+ ions. Since Ba2+ has a larger ionic radius (1.35 Å) compared to Sr2+ (1.18 Å), the replacement induces a lattice expansion within the host structure. This expansion alters the local crystal field environment surrounding the luminescent centers, particularly affecting the 5d energy levels of Eu2+ ions. Specifically, the weakened crystal field caused by lattice expansion reduces the splitting of the 5d levels and raises their overall energy. As a result, the energy gap between the 4f and 5d levels increases, leading to a blue shift in the emission wavelength from 454 nm to 430 nm. Moreover, the more rigid lattice structure, resulting from the enlarged lattice and incorporation of Ba2+, suppresses lattice relaxation in the excited state. This structural rigidity reduces the difference in equilibrium geometries between the ground and excited states, thereby decreasing the Stokes shift from 0.449 eV to 0.336 eV. The reduction in Stokes shift indicates a smaller configurational displacement between the two states, which is closely related to the larger ionic size and the increased structural stiffness introduced by Ba2+. Such phenomena are commonly observed in rare-earth-doped luminescent materials, where the substitution of host cations with ions of different sizes can significantly influence the optical properties of the activator ions.


