Abstract
Quantitative assessments of the geometric influence on catalytic activity are crucial for catalyst design and understanding reaction mechanisms. In this study, we synthesized a series of catalysts comprising TiO2-supported Pt nanoparticles with varying particle sizes, which were systematically evaluated in representative hydrogenation reactions. A consistent size–activity relationship is established, wherein overall turnover frequency (TOF) values (TOFoverall: calculated as moles of reactant converted per mole of Pt per hour) are modeled as functions of the average diameter of the supported Pt particles, yielding slope values consistently near −1 across a variety of common substrates. This finding underscores that catalytic activity predominantly originates from surface sites on the Pt nanoparticles rather than from interfacial, edge, or corner active sites.
1. Introduction
Hydrogenation is among the central themes of the petrochemical, coal chemical, and fine chemical industries. For example, in the petrochemical industry, processes like hydro-reforming and hydro-isomerization are pivotal for enhancing the octane value of gasoline, while the hydrogenation of benzene to cyclohexane is a critical step in the production of nylon intermediates. Noble metals are extensively employed in these hydrogenation reactions due to their exceptional catalytic activity. However, given the high cost and limited availability of noble metals, there is an urgent need to develop highly active and efficient catalysts for hydrogenation reactions. In past research, a widely accepted yet simplified notion is that smaller noble metal nanoparticles yield higher overall activity per unit of noble metal loading [1,2]. Consequently, researchers have shown great interest in strategies to reduce the size of supported noble metal nanoparticles and to elucidate the catalytic performance differences arising from size variation, emphasizing the essential need to understand the structure–activity relationship [3,4,5].
Current studies on the structure–activity relationship in the hydrogenation of supported noble metal catalysts primarily focus on the selectivity of nanoparticles of different sizes or provide nonquantitative insights into how nanoparticle diameter affects catalytic activity [2,4,6]. Notable examples include hydrogenation reactions such as cinnamyl aldehyde hydrogenation [7,8,9], ethene semi-hydrogenation [10,11,12,13], and nitroaromatic hydrogenation [5,14,15,16,17,18,19,20,21,22,23,24,25,26,27]. However, detailed quantitative investigations into the relationship between nanoparticle size and catalytic activity remain scarce. Given the frequent comparisons of catalytic performance across nanoparticles of varying sizes in heterogeneous hydrogenation catalysis, we highlight the urgent need for rigorous quantitative evaluations to clarify the geometric influence on catalytic activity.
Quantitatively described size–activity relationships in catalytic reactions, such as CO oxidation and low-temperature water–gas shift (LWGS), have been elegantly demonstrated by the groups of M. Cargnello and M. Shekhar [28,29,30,31], respectively. By theoretical simulation and CO oxidation catalyzed by CeO2-supported metal, the groups of M. Cargnello correlated the ceria–metal interface sites with slope of overall turnover frequency (TOF) and the size of supported metal particles (unless otherwise specified, all TOF values refer to the overall TOF, calculated as moles of reactant converted per mole of Pt per hour). Concretely speaking, the overall TOF calculated based on all metal located on support and catalyst dispersion was put aside. Then, the slope value of the linear fitting equation of l n (overall TOF) and l n (metal size) should correspond with which part active catalytic sites are located. Inspired by these pioneering studies, we sought to adopt analogous analytical paradigms to elucidate the geometric influence on catalytic activity in representative hydrogenation reactions. Herein, we synthesized a series of TiO22-supported Pt nanoparticles with systematically varied particle sizes and rigorously evaluated their performance across representative hydrogenation reactions. A robust size–activity relationship was observed, with turnover frequency (TOF) values modeled as functions of the average diameter of the Pt nanoparticles, consistently yielding slope values near −1 across a range of common substrates. These findings highlight that catalytic activity is predominantly derived from surface sites on the Pt nanoparticles rather than from interfacial, edge, or corner sites, offering new insights into the fundamental structure–activity relationship in these systems.
2. Results
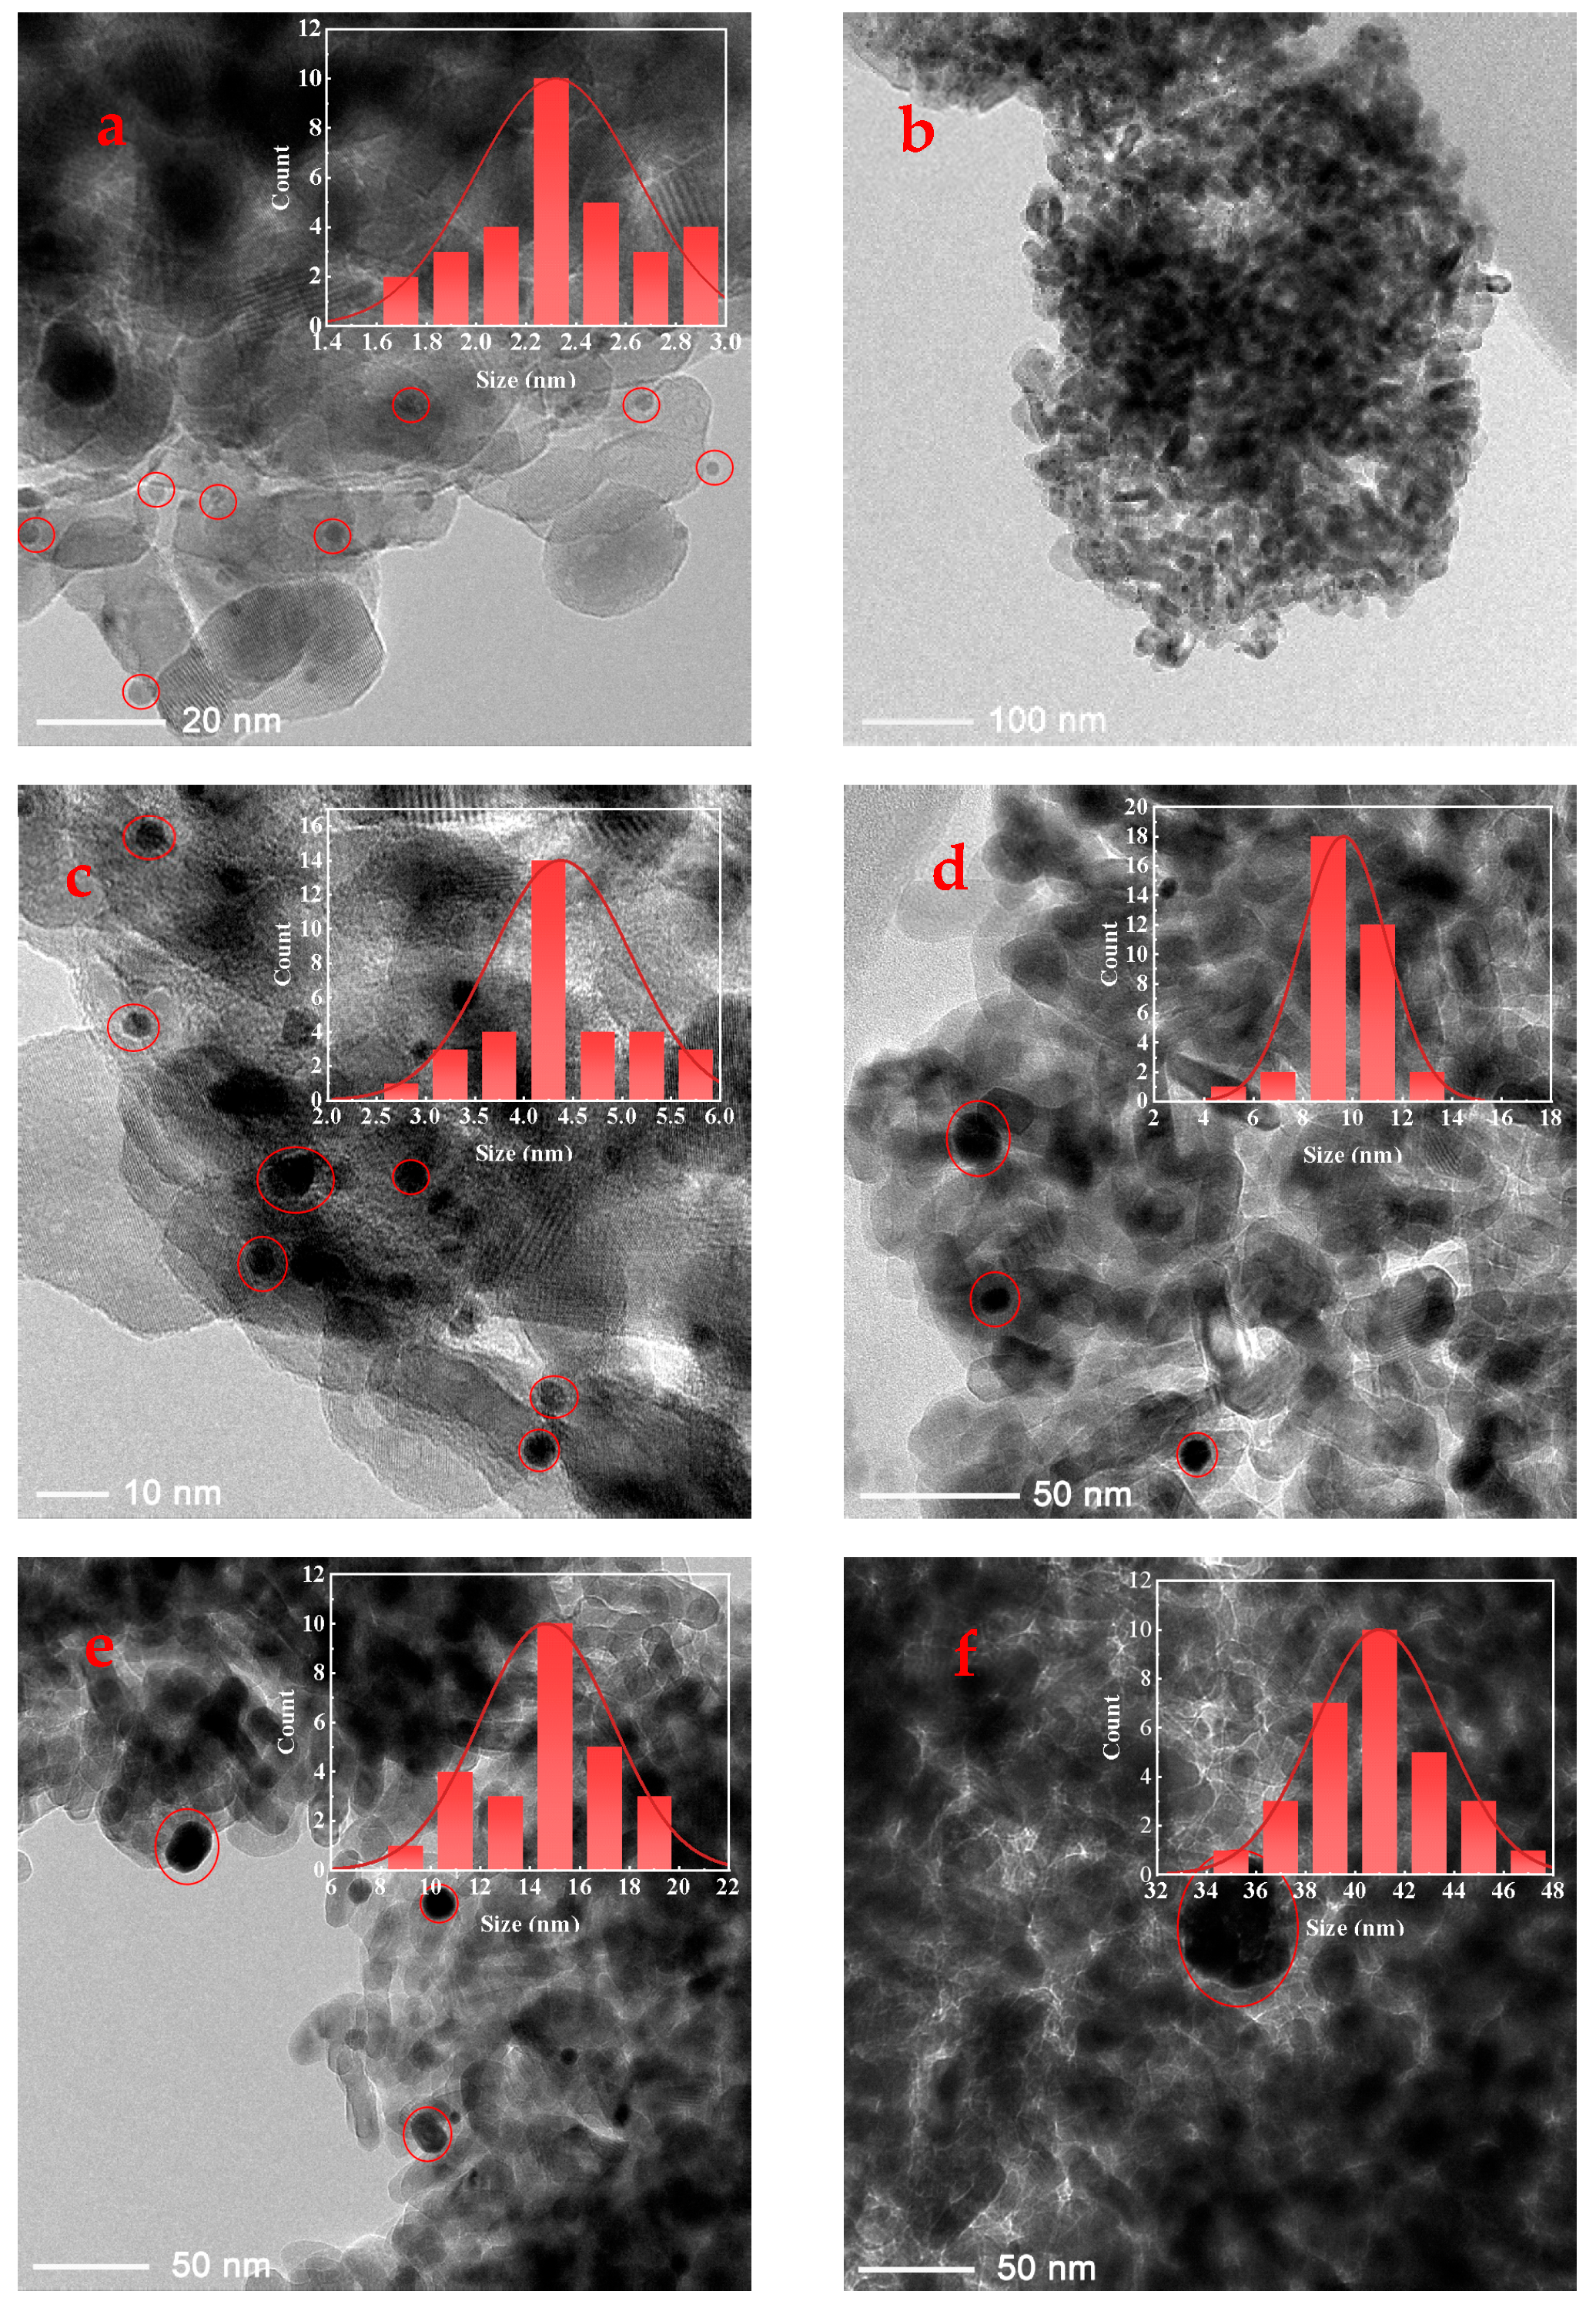
In this work, a series of catalysts consisting of TiO2-supported Pt nanoparticles with average sizes of approximately 2.32 nm, 4.38 nm, 9.63 nm, 14.64 nm, and 40.98 nm were synthesized (details provided in the Supporting Information). Inductively coupled plasma optical emission spectrometry (ICP-OES) analysis indicated Pt loading rates of approximately 1 wt% for all prepared Pt/TiO2 catalysts (detailed data provided in Table S1). These average sizes were determined from transmission electron microscopy (TEM) images, with representative TEM images shown in Figure 1 (additional images are available in Figure S1). Each size variant was supported on TiO2 and labeled accordingly: 2-Pt/TiO2, 4-Pt/TiO2, 10-Pt/TiO2, 15-Pt/TiO2, and 41-Pt/TiO2. In addition, the TEM images revealed similar sub-globular shapes for the supported Pt nanoparticles across the series. In addition, attempts to further determine the particle sizes by X-ray diffraction (XRD) (Figure 2) were unsuccessful owing to the low Pt loading. All five nanoparticle size fractions, each displaying sub-spherical Pt morphology, were prepared by the same polyol colloidal route under identical surfactant and reduction conditions, and TEM and XRD confirm the absence of sintering necks or irregular aggregates in every sample.

Figure 1.
TEM images and particle size statistical results of 2-Pt/TiO2 (a) and (b), 4-Pt/TiO2 (c), 10-Pt/TiO2 (d), 15-Pt/TiO2 (e) and 41-Pt/TiO2 (f) catalysts, respectively.
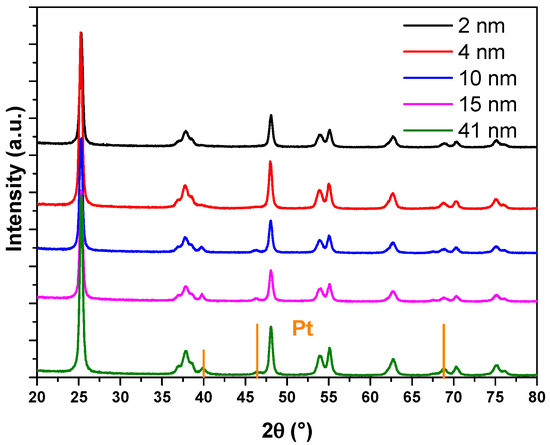
Figure 2.
XRD characterization of 2-Pt/TiO2, 4-Pt/TiO2, 10-Pt/TiO2, 15-Pt/TiO2 and 41-Pt/TiO2 catalysts.
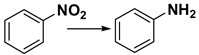
Nitrobenzene hydrogenation is a fundamental catalytic reaction with broad applications in fine chemical production. Numerous studies have explored Pt-based catalysts for this transformation, underscoring their efficacy and versatility [27,32,33,34]. In this work, we evaluated the performance of the synthesized Pt/TiO2 catalysts in nitrobenzene hydrogenation using H2.
Hydrogenation experiments were systematically conducted under varying reaction conditions using 4-Pt/TiO2 as the initial catalyst. Initial control experiments using TiO2 as the catalyst confirmed its inactivity for the reaction, as no conversion was observed even after 6 h (Table 1, entry 1). In sharp contrast, the introduction of Pt nanoparticles onto the TiO2 support markedly enhanced catalytic activity, achieving approximately 21% conversion within just 1 h (Table 1, entry 2). Interestingly, a moderate increase in reaction temperature to 30 °C (Table 1, entry 3) further boosted the conversion to 31%, with a concomitant rise in the turnover frequency (TOF) from 669.8 h−1 (Table 1, entry 1) to 1012.8 h−1. However, as the reaction temperature was increased further (Table 1, entries 4 and 5), the incremental improvements in TOF became less pronounced, suggesting a saturation effect at higher temperatures. Prolonging the reaction time to enhance the conversion (Table 1, entry 6) led to a significant decrease in TOF. This decline is likely attributed to kinetic limitations arising from substrate depletion during the later stages of the reaction.

Table 1.
Performance of 4-Pt/TiO2 at various reaction conditions for nitrobenzene hydrogenation.
Based on the above findings, a reaction temperature of 25 °C was selected for further studies. At this temperature, the conversion of nitrobenzene remains sufficiently low, minimizing the impact of substrate depletion on the reaction rate. Additionally, the mild conditions are expected to enhance the stability of the supported Pt catalyst, ensuring prolonged performance with high reliability. Reusability tests were conducted with the 4-Pt/TiO2 catalyst, and no significant loss in overall TOF was observed after five consecutive cycles, as illustrated in Figure 3. These results demonstrate the robustness and stability of the catalyst under the chosen reaction conditions.
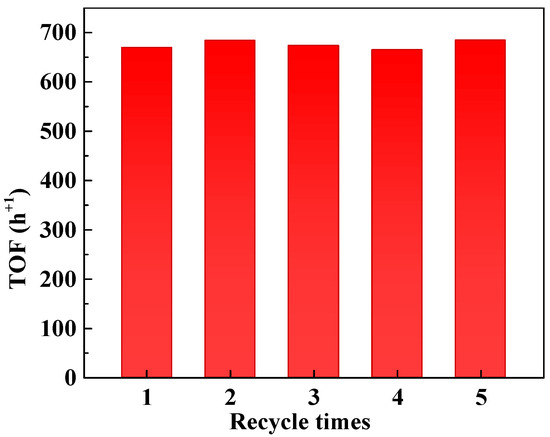
Figure 3.
Catalyst recycling experiment. Reaction conditions: nitrobenzene, 1 mmol; 10 mL ethanol; 5 mg 4-Pt/TiO2 catalyst; H2 pressure, 0.1 MPa; reaction time, 1 h. TOF values refer to the overall TOF, calculated as moles of reactant converted per mole of Pt per hour.
A qualitative relationship between the apparent reaction rate and Pt nanoparticle size was observed, indicating that the overall TOF decreased as the average Pt particle diameter increased, the trend shown in Table 2. To ensure the nitrobenzene conversion remained sufficiently low and comparable across all entries in Table 2, thereby equalizing the impact of reaction kinetics on TOF calculations, the reaction times were adjusted accordingly. Therefore, the reaction times of 2-Pt/TiO2 and 4-Pt/TiO2, 10-Pt/TiO2, 15-Pt/TiO2 and 41-Pt/TiO2 are increased with the overall TOF reduced.
Table 2.
Performance of NPs Pt with different average sizes supported by TiO2 for hydrogenation of nitrobenzene [a].
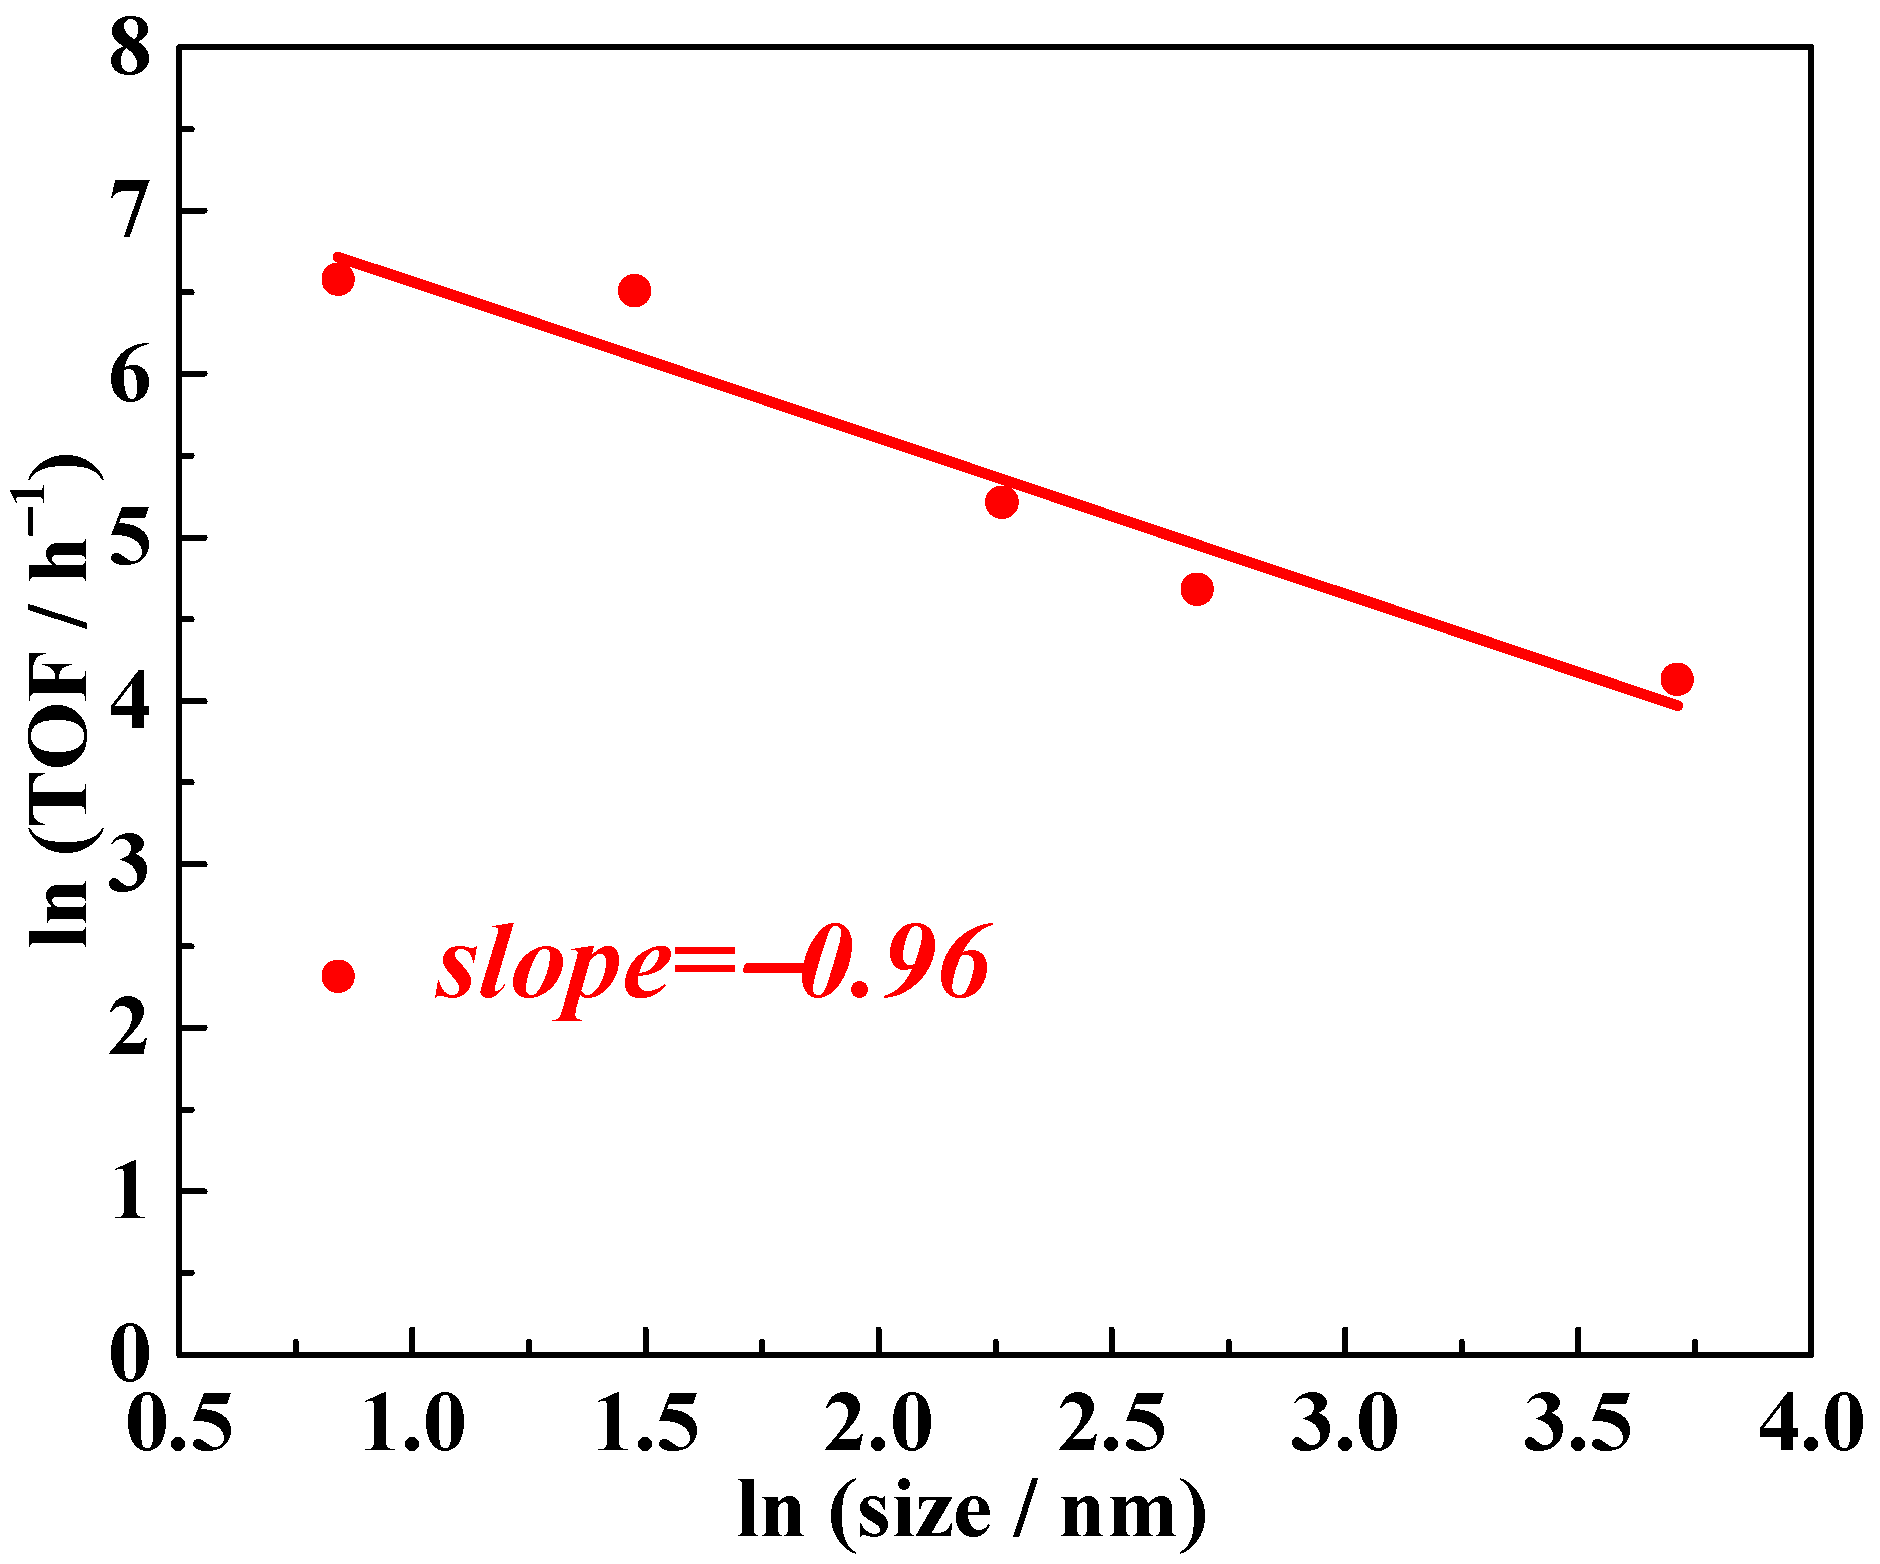
Building on the model proposed by Matteo Cargnello, which establishes a quantitative relationship between overall TOF and different supported crystalline metal grains with uniform packing structures, we developed a simplified version to create a highly generalized reference framework that facilitates direct comparison. In this generalized model, logical deduction (details provided in the Supporting Information) demonstrates that the natural logarithm of the overall TOF and the natural logarithm of the supported metal particle diameter form a linear relationship. The slope of this linear function is directly linked to the distribution of active sites on the supported metal particles. Specifically, slope values of −1, −2, and −3 correspond to surface active sites, interfacial/edge active sites, and corner active sites, respectively. Using this simplified model, we applied logarithmic transformations to the TOF data from Table 2, treating TOF as the dependent variable and the average Pt particle diameter as the independent variable. Employing linear regression to plot the experimental data, the slope was determined to be approximately −1, as shown in Figure 4. This result suggests that the active sites on Pt particles are predominantly located on their surface.
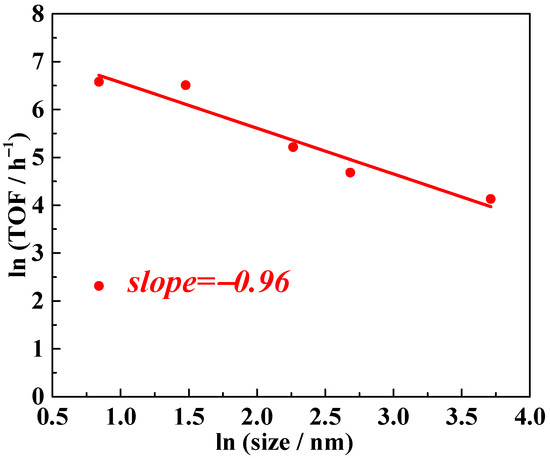
Figure 4.
Nitrobenzene hydrogenation activity of NPs Pt with different average sizes supported by TiO2. TOF values refer to the overall TOF, calculated as moles of reactant converted per mole of Pt per hour.
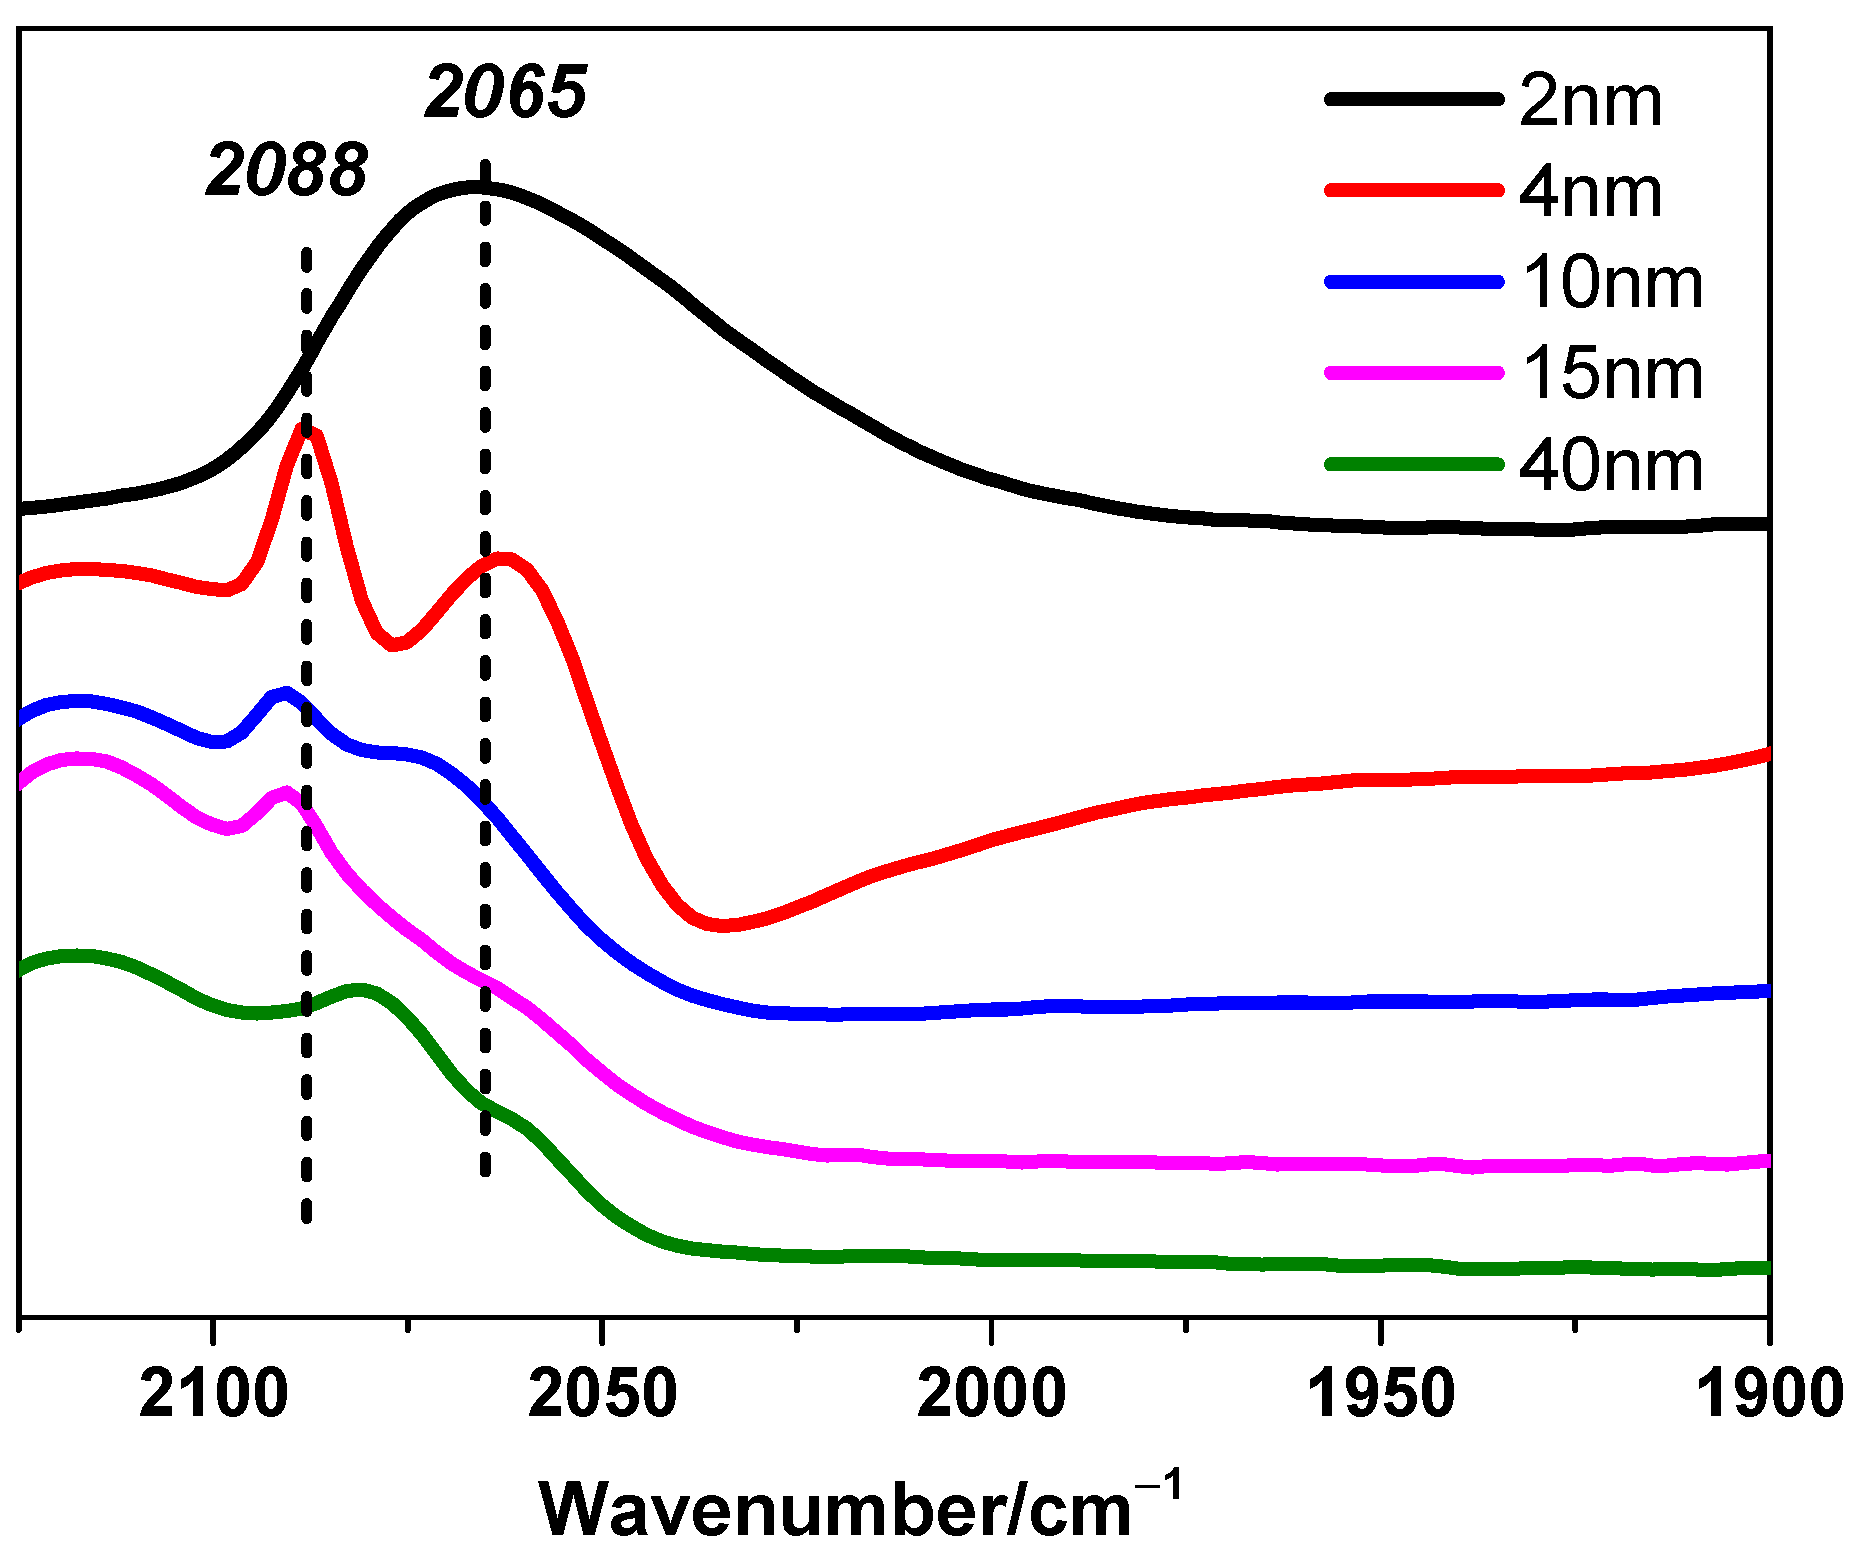
It should be noted that this inference is based on necessary but reasonable assumptions, which are crucial for the generalized model we proposed before. Supported crystalline metal grains should present similar figures and uniform packing structures even if the size changes. In addition, active sites that are located in the same kind of areas on Pt particles, to be more specific, including surface parts, interfacial/edge parts, or corner parts, should perform uniform or approximate activity, respectively. However, the assumption about uniform activity might correspond to all cases. Here is a typical counterexample reported that for CH4 reactions with CO2 or H2O over supported Pt clusters, CH4 turnover rates over surface Pt sites are different on Pt clusters with different sizes [3]. These two hypotheses may narrow the range of applicability but significantly enhance reliability. Fortunately, the CO-DRIFTS results shown in Figure 5 indicate that the Pt nanoparticles in this study exhibit relatively uniform adsorption behavior, supporting the rationale and necessity for the assumptions of uniform shape and activity. Linear CO adsorption signals were observed between 2000 and 2100 cm−1, with peaks around 2088 cm−1 and 2065 cm−1 corresponding to CO adsorption on Ptδ+ and Pt0 sites, respectively. Similar adsorption signals have been reported for other Pt-based catalysts [35,36], further validating these findings.

Figure 5.
CO-DRIFTS for Pt/TiO2 catalysts. 2-Pt/TiO2 (black), 4-Pt/TiO2 (red), 10-Pt/TiO2 (blue), 15-Pt/TiO2 (pink), and 41-Pt/TiO2 (green).
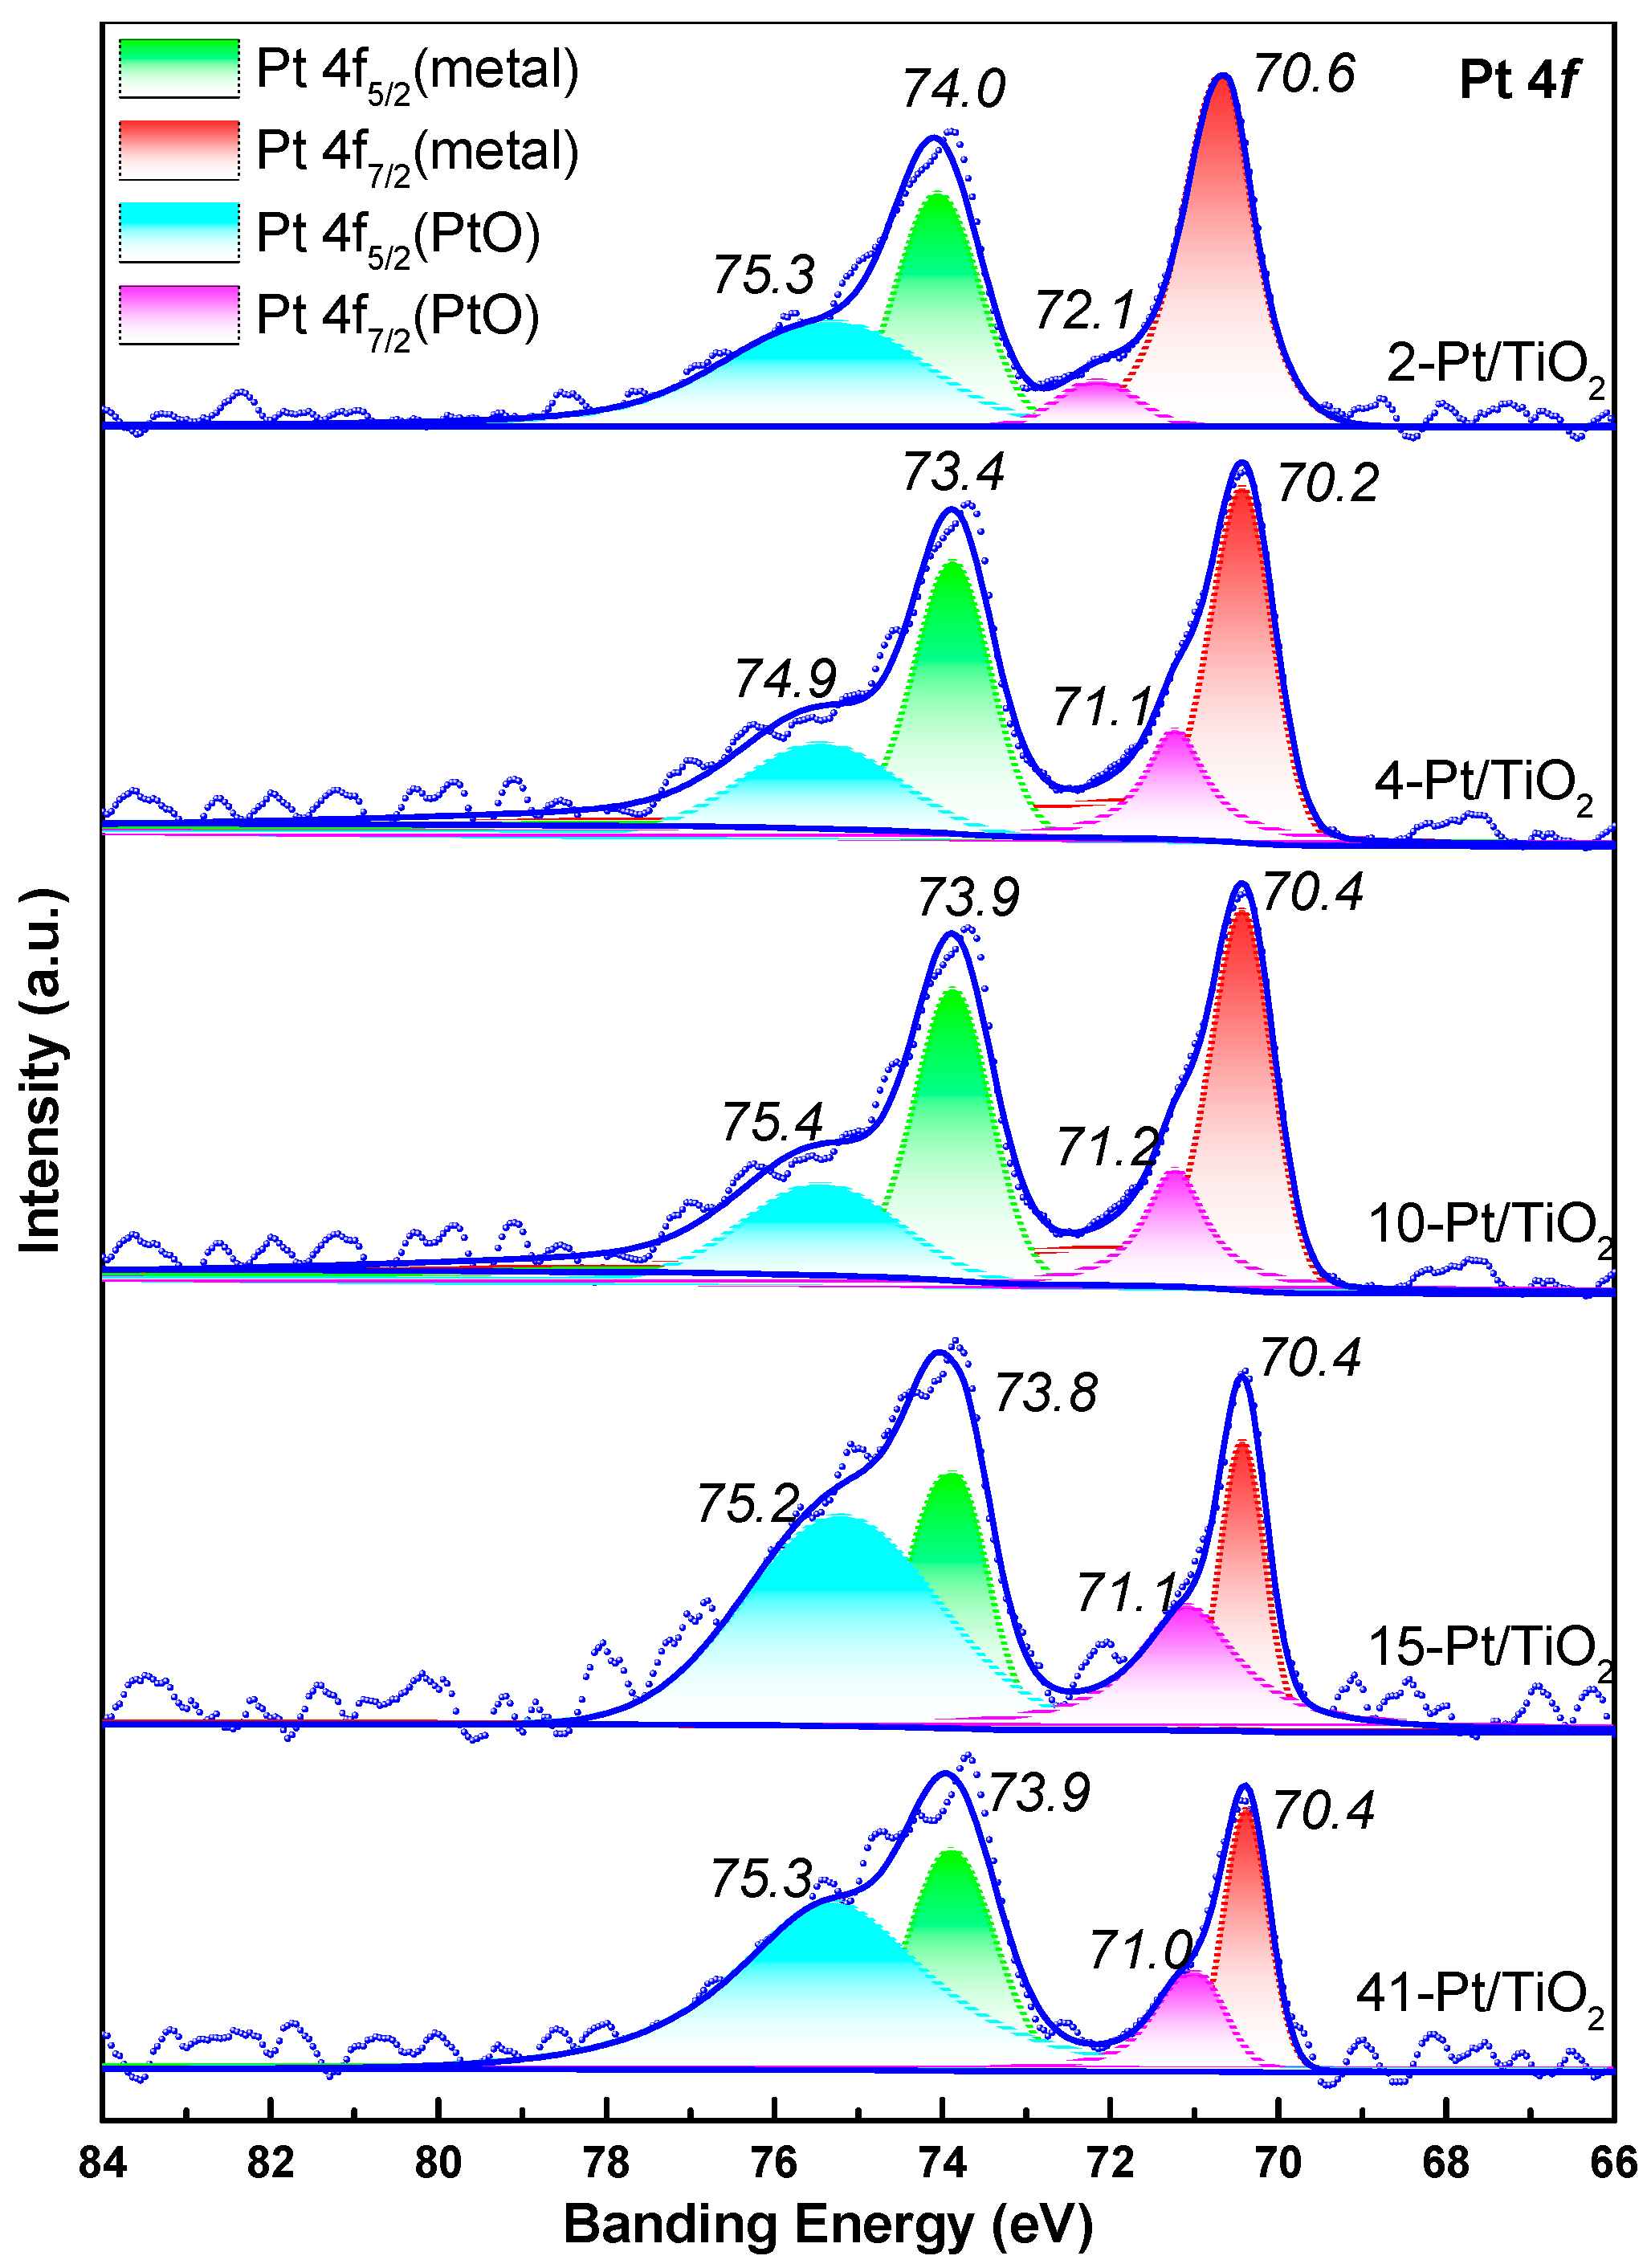
XPS analyses were also carried out, and peak–deconvolution of the Pt 4f region (Figure 6) shows virtually identical binding energies for both metallic Pt0 (4f7/2 ≈ 71.2 eV) and the slightly oxidized Ptδ+ component (4f7/2 ≈ 72.0 eV) across all Pt/TiO2 catalysts. This uniform valence–state distribution further substantiates our assumption of consistent particle morphology and comparable per-site activity.
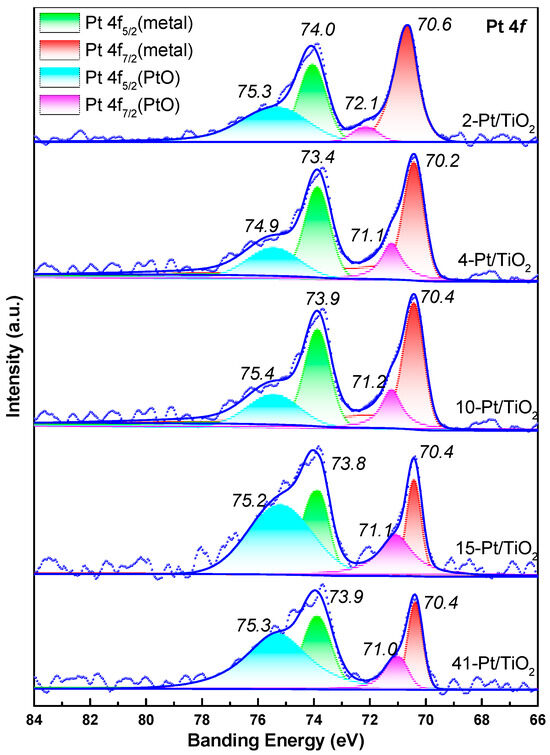
Figure 6.
XPS and results of peak–differentiating and imitating for Pt/TiO2 catalysts.
3. Discussion
To delve deeper, we propose that the dominant factor influencing catalyst performance in this work is the activation of H2 or substrates on the surface sites of Pt nanoparticles rather than the spillover of H2 or H atoms from Pt to TiO2. Literature reports suggest two common hydrogenation mechanisms for heterogeneous catalytic processes: direct hydrogenation and hydrogen spillover [37,38,39,40,41,42,43]. While it is challenging to exclude the coexistence of these two mechanisms in the hydrogenation reactions catalyzed by Pt/TiO2, certain inferences can be made. Hydrogen spillover involves the migration of hydrogen atom equivalents from metal nanoparticles to the support, implying that the interfacial sites between the Pt surface and TiO2 would serve as the active sites if spillover were the dominant mechanism. In such a case, the slope value of the linear relationship between TOF and Pt particle diameter would be expected to be −2. However, this is inconsistent with the experimental results for nitrobenzene hydrogenation. Instead, the observed slope value, approximately −1, suggests that surface sites on the Pt nanoparticles are the primary active sites (Figure 4). Thus, we conclude that the dominant parameter governing catalyst performance in this work is the activation of H2 or substrates on these surface sites rather than hydrogen spillover.
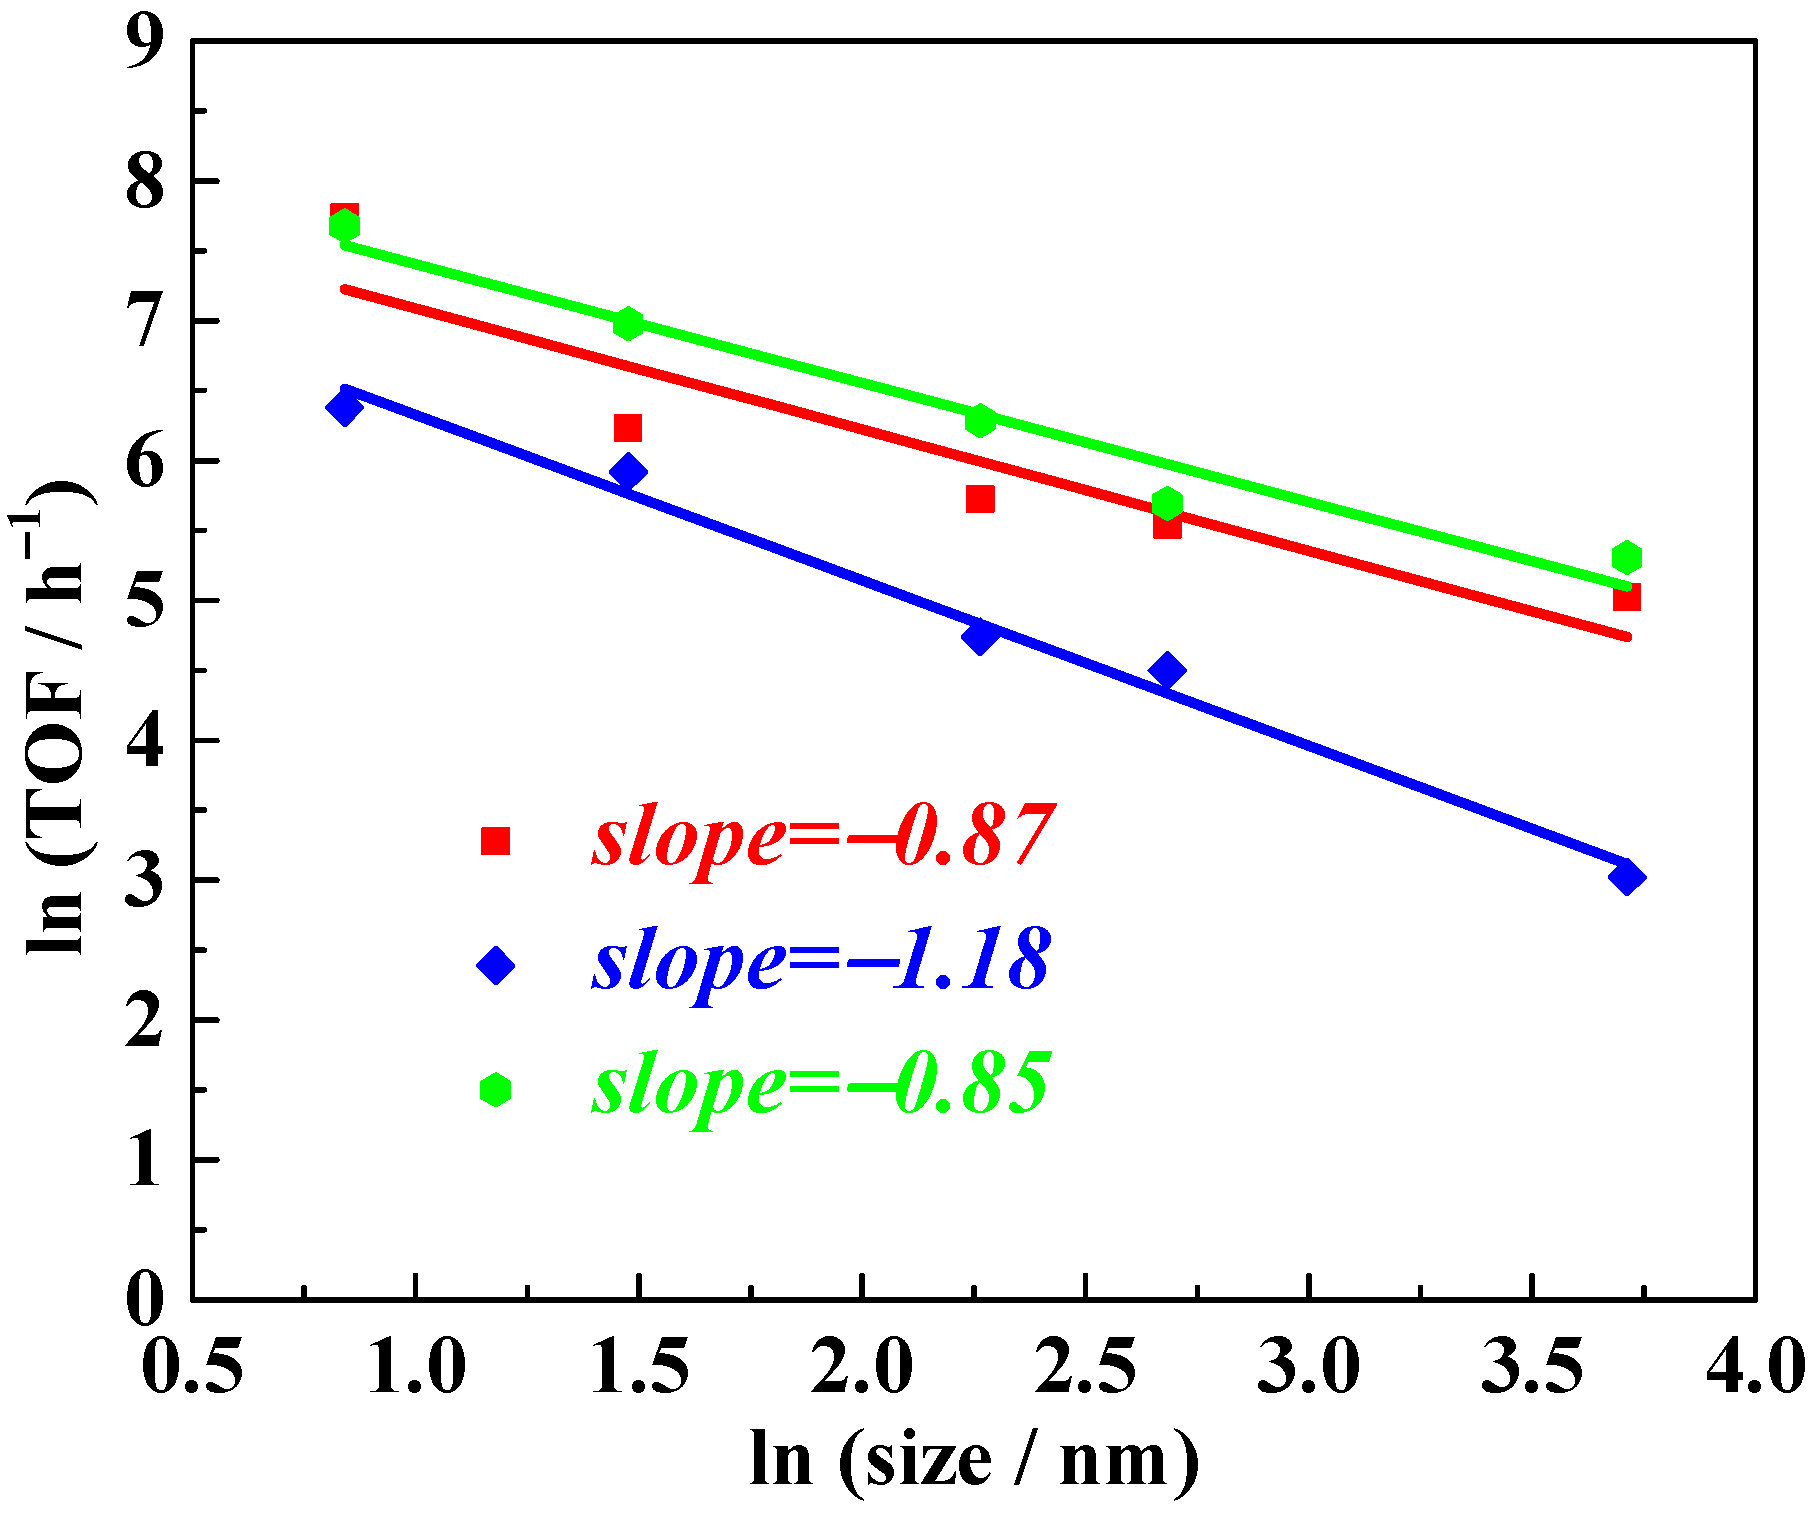
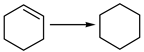
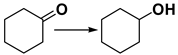
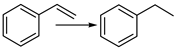
Considering the universality of the slope description for the size–activity relationship of Pt nanoparticles supported on TiO2, we extended the study to other typical unsaturated substrates, including cyclohexene, cyclohexanone, and styrene, under similar reaction conditions. Typical results are collected and shown in Table 3. Following logarithmic transformation and linear regression analysis of the experimental data (raw data provided in Tables S1–S4), the results, shown in Figure 7, revealed slope values close to −1, −0.87, −1.18, and −0.85 for cyclohexene, cyclohexanone, and styrene, respectively. These findings indicate that, for the hydrogenation of these typical unsaturated substrates, the active sites are located on the surface of the supported Pt nanoparticles, consistent with our inference for nitrobenzene hydrogenation.
Table 3.
Performance of 4-Pt/TiO2 for various substrate hydrogenations. [a].
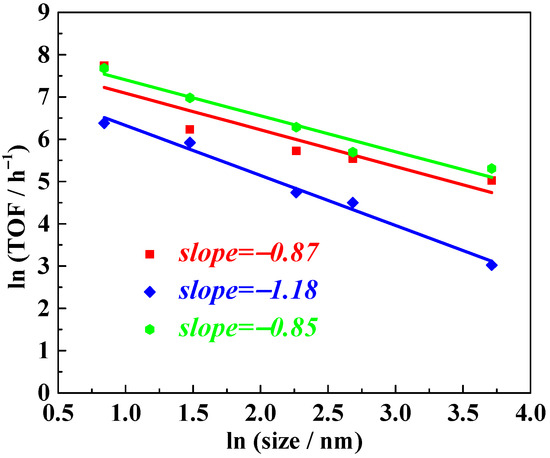
Figure 7.
Cyclohexene (red), cyclohexanone (blue), and styrene (green) hydrogenation activity of NPs Pt with different sizes. TOF values refer to the overall TOF, calculated as moles of reactant converted per mole of Pt per hour.
4. Materials and Methods
4.1. Preparation of the H2PtCl6 Aqueous Solution
Dissolve the purchased H2PtCl6 in deionized water (DIW) to obtain H2PtCl6 aqueous solution.
4.2. Preparation of the 2-Pt/TiO2 Catalyst
Measure 600 µL DIW and 600 µL H2PtCl6 aqueous solution into a test tube. Add 1 g TiO2 after fully mixing the solution into the test tube. Ultrasound for 0.5 h, quiet for 6 h, then dry the test tube in an oven. After the solid is dried, burn it in a muffle furnace at 400 °C for 5 h. Then, place the solid in a reaction vessel and add 10 mL ethanol, fill with 1.0 MPa hydrogen, and reduce it for 1 h at 200 °C. Obtain a 2-Pt/TiO2 catalyst after centrifugation and vacuum drying.
4.3. Preparation of the 4-Pt/TiO2 Catalyst
Add 1 g TiO2 and 100 mL DIW to the beaker. Add 100 mL DIW, 1 g of PVP, and 600 µL H2PtCl6 aqueous solution to the other beaker. Put the beaker into a water bath at 20 °C, turn on the magnetic stirring, and add 20 mL of aqueous solution containing 0.0102 g NaBH4 slowly. Then, pour the suspension from the previous beaker into this beaker. Stir for 12 h. After filtration, washing, and drying, burn the solid in a muffle furnace at 400 °C for 5 h. Then, place the solid in a reaction vessel and add 10 mL of ethanol, fill with 1 Mpa hydrogen, and reduce it for 1 h at 200 °C. Obtain 4-Pt/TiO2 catalyst after centrifugation and vacuum drying.
4.4. Preparation of the 10-Pt/TiO2 Catalyst
Add 1 g TiO2, 600 µL H2PtCl6 aqueous solution, 600 µL formaldehyde, and 100 mL DIW to the flask. Put the flask into oil bath at 120 °C, and stir for 12 h. After filtration, washing, and drying, burn the solid in a muffle furnace at 400 °C for 5 h. Then, place the solid in a reaction vessel and add 10 mL ethanol, fill with 1.0 MPa hydrogen, and reduce it for 1 h at 200 °C. Obtain 10-Pt/TiO2 catalyst after centrifugation and vacuum drying.
4.5. Preparation of the 15-Pt/TiO2 Catalyst
Add 1 g TiO2, 600 µL H2PtCl6 aqueous solution, 600 µL formaldehyde, and 100 mL DIW to the flask. Put the flask into oil bath at 120 °C, and stir for 24 h. After filtration, washing, and drying, burn the solid in a muffle furnace at 400 °C for 5 h. Then, place the solid in a reaction vessel and add 10 mL of ethanol, fill with 1.0 MPa hydrogen, and reduce it for 1 h at 200 °C. Obtain 15-Pt/TiO2 catalyst after centrifugation and vacuum drying.
4.6. Preparation of the 41-Pt/TiO2 Catalyst
Add 1 g TiO2, 600 µL H2PtCl6 aqueous solution, and 10 mL ethanol to the reaction kettle, fill with 1 Mpa hydrogen and reduce it for 1 h at 200 °C. After filtration, washing, and drying, burn the solid in a muffle furnace at 400 °C for 5 h. Then, place the solid in a reaction vessel and add 10 mL of ethanol, fill with 1 Mpa hydrogen, and reduce it for 1 h at 200 °C. Obtain 41-Pt/TiO2 catalyst after centrifugation and vacuum drying.
4.7. Catalytic Performance
The nitrobenzene hydrogenation was conducted in a branched reaction tube equipped with a magnetic bar. In a typical procedure, 5 mg catalyst, 1 mmol nitrobenzene, and 10 mL ethanol were subjected to the branched reaction, which was then flushed with 1 atm H2 five times and charged successively with 0.1 MPa H2. After the branched reaction was sealed, it was placed in water bath at 25 °C. After reaction, 150 µL anisole was added to 5 mL the reaction liquid as inner standard. The product was qualitatively analyzed by gas chromatography (GC) and quantitatively analyzed on an Agilent 6890B instrument equipped with an on-column injector (250 °C), an FID detector (250 °C), and an HP-5 capillary column (30 m × 0.32 mm × 0.25 mm). The conversion was calculated by gas chromatography.
The cyclohexene hydrogenation was conducted in a branched reaction tube equipped with a magnetic bar. In a typical procedure, 5 mg catalyst, 1 mmol cyclohexene, and 10 mL ethanol were subjected to the branched reaction, which was then flushed with 1 atm H2 five times and charged successively with 0.1 MPa H2. After the branched reaction was sealed, it was placed in water bath at 25 °C. After reaction, 150 µL anisole was added to 5 mL the reaction liquid as inner standard. The product was qualitatively analyzed by gas chromatography (GC) and quantitatively analyzed on an Agilent 6890B instrument equipped with an on-column injector (250 °C), an FID detector (250 °C), and an HP-5 capillary column (30 m × 0.32 mm × 0.25 mm). The conversion was calculated by gas chromatography.
The cyclohexanone hydrogenation was conducted in an autoclave equipped with a magnetic bar. In a typical procedure, 5 mg catalyst, 1 mmol cyclohexene, and 10 mL ethyl acetate were subjected to the autoclave, which was then flushed with 1 MPa H2 five times and charged successively with 1 MPa H2. After the autoclave was sealed, it was heated to 120 °C. After reaction, 150 µL benzaldehyde was added to 5 mL the reaction liquid as inner standard. The product was qualitatively analyzed by gas chromatography (GC) and quantitatively analyzed on an Agilent 6890B instrument equipped with an on-column injector (250 °C), an FID detector (250 °C), and an HP-5 capillary column (30 m × 0.32 mm × 0.25 mm). The conversion was calculated by gas chromatography.
The styrene hydrogenation was conducted in a branched reaction tube equipped with a magnetic bar. In a typical procedure, 5 mg catalyst, 1 mmol styrene, and 10 mL ethanol were subjected to the branched reaction, which was then flushed with 1 atm H2 five times and charged successively with 0.1 MPa H2. After the branched reaction was sealed, it was placed in water bath at 25 °C. After reaction, 150 µL anisole was added to 5 mL the reaction liquid as inner standard. The product was qualitatively analyzed by gas chromatography (GC) and quantitatively analyzed on an Agilent 6890B instrument equipped with an on-column injector (250 °C), an FID detector (250 °C) and an HP-5 capillary column (30 m × 0.32 mm × 0.25 mm). The conversion was calculated by gas chromatography.
The conversion of nitrobenzene was calculated as follows:
The conversion of cyclohexene was calculated as follows:
The conversion of cyclohexanone was calculated as follows:
The conversion of styrene was calculated as follows:
where Nan, Nni, Nca, Nce, Ncl, Nco, Net, and Nst represent mole amounts of aniline, nitrobenzene, cyclohexane, cyclohexene, cyclohexanol, acyclohexanone, ethylbenzene, and styrene, respectively.
The TOF refers to the overall TOF, calculated as moles of reactant converted per mole of Pt per hour was calculated as follows:
(6) Logical deduction about l n (TOF)-l n (size of NP Pt):
There are several premise assumptions:
I. Supported crystalline metal grains should present similar figures and uniform packing structure even if size changes.
II. Active sites that are located in the same kind of areas on Pt particles, to be more specific, including surface parts, interfacial/edge parts, or corner parts, should perform uniform or approximate activity, respectively.
For a certain Pt particle,
NV = λV × VPt = λV’ × R3
Ns = λS × SPt = λS’ × R2
NI = λI × PPt = λI’ × R
NC = λC = λI’ × R0
If active sites located at surface part,
then TOFreal = TOFoverall × NV/ Ns = λ’V/S × TOFoverall × R,
lnTOFoverall = ln (TOFreal/λV/S/R) = λS0−lnR,
so the slope about l n(TOF)−l n (size of NP Pt) is −1.
If active sites located at interfacial/edge part,
then TOFreal = TOFoverall × NV/NI = λ’V/I × TOFoverall × R2,
lnTOFoverall = l n (TOFreal/λV/I/R) = λI0−2lnR,
so the slope about l n (TOF)−l n (size of NP Pt) is −2.
If active sites located at corner part,
then TOFreal = TOFoverall × NV/NC = λ’V/C × TOFoverall × R3,
lnTOFoverall = l n (TOFreal/λV/C/R) = λC0−3lnR,
so the slope about l n (TOF)−l n (size of NP Pt) is −3.
NV, Ns, NI, and NC are Pt atom numbers counted for volume of Pt particle, surface part of Pt particle, interfacial/edge part of Pt particle, and corner part of Pt particle, respectively. VPt is volume of supported Pt particle. SPt is surface area of supported Pt particle. PPt is perimeter part contacted with support of supported Pt particle. λXXX are constants related to figures of Pt particles and size of a single Pt atom.
5. Conclusions
In conclusion, uniform, size-controlled Pt NPs from 2 to 40 nm were synthesized, and corresponding supported catalysts were used in certain typical hydrogenations. A consistent size–activity relationship can be summarized when overall TOF was modeled as a function of supported metal particles’ average diameter; the slope value of these functions is close to −1 consistently for a variety of common substrates. This size–activity relationship suggests that active sites are located at the surface part of supported Pt particles. A further inference is that the parameter that dominates the performance of the catalyst should not be hydrogen spillover from Pt nanoparticles to TiO2 support for these typical hydrogenations. This study briefly but fittingly demonstrates the quantitative size–activity relationship of nanoparticle Pt supported by TiO2 in certain typical hydrogenations, which might contribute to the design of related catalysts and research on other size–activity relationships of supported nanoparticle metals in heterogeneous catalysis.
Supplementary Materials
The following supporting information can be downloaded at: https://www.mdpi.com/article/10.3390/inorganics13060186/s1.
Author Contributions
Q.Z. (Qi Zhang): Experiment and Data Analysis. T.L.: Methodology, Data Analysis, and Writing. X.-T.M.: Writing and Editing. All other authors analyzed the experimental results and took part in discussions on manuscript preparation. All authors have read and agreed to the published version of the manuscript.
Funding
This work was financially supported by the National Key Research and Development Program of China (2021YFA1500503), the National Natural Science Foundation of China (22102210, 22302199, 22378079, 21961142006), and the Innovation and Entrepreneurship Doctor Program of Jiangsu Province (JSSCBS20211208).
Institutional Review Board Statement
Not applicable for studies not involving humans or animals.
Informed Consent Statement
Not applicable.
Data Availability Statement
The datasets analyzed or generated during this study are available from the authors.
Conflicts of Interest
The authors declare no conflicts of interest.
References
- Liang, S.; Hao, C.; Shi, Y. The Power of Single-Atom Catalysis. ChemCatChem 2015, 7, 2559. [Google Scholar] [CrossRef]
- Zhang, L.; Zhou, M.; Wang, A.; Zhang, T. Selective Hydrogenation over Supported Metal Catalysts: From Nanoparticles to Single Atoms. Chem. Rev. 2020, 120, 683. [Google Scholar] [CrossRef]
- Wei, J.; Iglesia, E. Mechanism and Site Requirements for Activation and Chemical Conversion of Methane on Supported Pt Clusters and Turnover Rate Comparisons among Noble Metals. J. Phys. Chem. B 2004, 108, 4094. [Google Scholar] [CrossRef]
- Kuhn, J.N.; Huang, W.; Tsung, C.-K.; Zhang, Y.; Somorjai, G.A. Structure Sensitivity of Carbon—Nitrogen Ring Opening: Impact of Platinum Particle Size from below 1 to 5 nm upon Pyrrole Hydrogenation Product Selectivity over Monodisperse Platinum Nanoparticles Loaded onto Mesoporous Silica. J. Am. Chem. Soc. 2008, 130, 14026. [Google Scholar] [CrossRef] [PubMed]
- Zhu, Z.; Tao, H.; Zhou, Y. Using Density Functional Theory To Unravel the Size-Dependent Effect of Au Nanoparticles and Au Single Atoms Adsorbed on Carbon Nitride for the Hydrogenation of Nitrobenzene. ACS Appl. Nano Mater. 2022, 5, 18753. [Google Scholar] [CrossRef]
- Vilé, G.; Albani, D.; Almora-Barrios, N.; López, N.; Pérez-Ramírez, J. Advances in the Design of Nanostructured Catalysts for Selective Hydrogenation. ChemCatChem 2016, 8, 21. [Google Scholar] [CrossRef]
- Meemken, F.; Baiker, A. Recent Progress in Heterogeneous Asymmetric Hydrogenation of C=O and C=C Bonds on Supported Noble Metal Catalysts. Chem. Rev. 2017, 117, 11522. [Google Scholar] [CrossRef] [PubMed]
- Bhogeswararao, S.; Srinivas, D. Intramolecular selective hydrogenation of cinnamaldehyde over CeO2–ZrO2-supported Pt catalysts. J. Catal. 2012, 285, 31. [Google Scholar] [CrossRef]
- Cao, Z.; Bu, J.; Zhong, Z.; Sun, C.; Zhang, Q.; Wang, J.; Chen, S.; Xie, X. Selective hydrogenation of cinnamaldehyde to cinnamyl alcohol over BN-supported Pt catalysts at room temperature. Appl. Catal. A Gen. 2019, 578, 105. [Google Scholar] [CrossRef]
- Guo, Y.; Huang, Y.; Zeng, B.; Han, B.; Akri, M.; Shi, M.; Zhao, Y.; Li, Q.; Su, Y.; Li, L.; et al. Photo-thermo semi-hydrogenation of acetylene on Pd1/TiO2 single-atom catalyst. Nat. Commun. 2022, 13, 2648. [Google Scholar] [CrossRef]
- Guo, Y.; Qi, H.; Su, Y.; Jiang, Q.; Cui, Y.-T.; Li, L.; Qiao, B. High Performance of Single-atom Catalyst Pd1/MgO for Semi-hydrogenation of Acetylene to Ethylene in Excess Ethylene. ChemNanoMat 2021, 7, 526. [Google Scholar] [CrossRef]
- Tiwari, G.; Sharma, G.; Verma, R.; Gakhad, P.; Singh, A.K.; Polshettiwar, V.; Jagirdar, B.R. Acetylene Semi-Hydrogenation at Room Temperature over Pd—Zn Nanocatalyst. Chem. A Eur. J. 2023, 29, e202301932. [Google Scholar] [CrossRef] [PubMed]
- Yang, L.; Guo, Y.; Long, J.; Xia, L.; Li, D.; Xiao, J.; Liu, H. PdZn alloy nanoparticles encapsulated within a few layers of graphene for efficient semi-hydrogenation of acetylene. Chem. Commun. 2019, 55, 14693. [Google Scholar] [CrossRef]
- Sun, S.; Du, M.; Zhao, R.; Jv, X.; Hu, P.; Zhang, Q.; Wang, B. Zn(0)-Catalysed mild and selective hydrogenation of nitroarenes. Green Chem. 2020, 22, 4640. [Google Scholar] [CrossRef]
- Li, M.; Chen, S.; Jiang, Q.; Chen, Q.; Wang, X.; Yan, Y.; Liu, J.; Lv, C.; Ding, W.; Guo, X. Origin of the Activity of Co–N–C Catalysts for Chemoselective Hydrogenation of Nitroarenes. ACS Catal. 2021, 11, 3026. [Google Scholar] [CrossRef]
- Shi, H.; Dai, X.; Liu, Q.; Zhang, T.; Zhang, Y.; Shi, Y.; Wang, T. Magnetic CuNi Alloy Nanoparticles for Catalytic Transfer Hydrogenation of Nitroarene. Ind. Eng. Chem. Res. 2021, 60, 16011. [Google Scholar] [CrossRef]
- Ishikawa, H.; Nakatani, N.; Yamaguchi, S.; Mizugaki, T.; Mitsudome, T. Robust Ruthenium Phosphide Catalyst for Hydrogenation of Sulfur-Containing Nitroarenes. ACS Catal. 2023, 13, 5744. [Google Scholar] [CrossRef]
- Yang, F.; Wang, M.; Liu, W.; Yang, B.; Wang, Y.; Luo, J.; Tang, Y.; Hou, L.; Li, Y.; Li, Z.; et al. Atomically dispersed Ni as the active site towards selective hydrogenation of nitroarenes. Green Chem. 2019, 21, 704. [Google Scholar] [CrossRef]
- Hajdu, V.; Muránszky, G.; Nagy, M.; Kopcsik, E.; Kristály, F.; Fiser, B.; Viskolcz, B.; Vanyorek, L. Development of High-Efficiency, Magnetically Separable Palladium-Decorated Manganese-Ferrite Catalyst for Nitrobenzene Hydrogenation. Int. J. Mol. Sci. 2022, 23, 6535. [Google Scholar] [CrossRef]
- Su, T.; Jiang, Y.; Xu, Y.; Luo, X.; Xie, X.; Qin, Z.; Ji, H. Ba-modified Ni-P amorphous alloy/acidified bentonite catalyst: Preparation and the catalytic hydrogenation of nitrobenzene to aniline. React. Kinet. Mech. Catal. 2020, 131, 805. [Google Scholar] [CrossRef]
- Wang, H.; Shi, F.; Pu, M.; Lei, M. Theoretical Study on Nitrobenzene Hydrogenation by N-Doped Carbon-Supported Late Transition Metal Single-Atom Catalysts. ACS Catal. 2022, 12, 11518. [Google Scholar] [CrossRef]
- Wang, W.; Wang, Y.; Zhao, X.; Li, Y.; He, H.; Lian, L.; Zeng, K.; Wu, L.; Deng, L.; Liu, Y.-N. Surface oxygen vacancies of TiO2−x enabled water transfer photocatalytic hydrogenation of nitrobenzene to aniline without use of co-catalyst. Chem. Eng. Sci. 2024, 285, 119645. [Google Scholar] [CrossRef]
- Liu, D.; Nadia, I.; Fang, C.; He, K.; Ge, B.; Chen, H.; Chen, Z. Photo enhanced catalytic activity for hydrogenation of nitrobenzene over Pt-Au/TiO2 heterojunction. Appl. Catal. A Gen. 2022, 645, 118840. [Google Scholar] [CrossRef]
- Yu, P.; Yang, Z.; Gu, Z.; Wong, H.-W. Catalytic reaction coupling of propane dehydrogenation with nitrobenzene hydrogenation over Pt/Al2O3. Catal. Commun. 2022, 166, 106449. [Google Scholar] [CrossRef]
- Jin, M.; Liu, Y.; Zhang, X.; Wang, J.; Zhang, S.; Wang, G.; Zhang, Y.; Yin, H.; Zhang, H.; Zhao, H. Selective electrocatalytic hydrogenation of nitrobenzene over copper-platinum alloying catalysts: Experimental and theoretical studies. Appl. Catal. B Environ. 2021, 298, 120545. [Google Scholar] [CrossRef]
- Xiong, W.; Wang, Z.; He, S.; Hao, F.; Yang, Y.; Lv, Y.; Zhang, W.; Liu, P.; Luo, H. Nitrogen-doped carbon nanotubes as a highly active metal-free catalyst for nitrobenzene hydrogenation. Appl. Catal. B Environ. 2020, 260, 118105. [Google Scholar] [CrossRef]
- Li, C.; Liu, S.; Yang, F.; Zhang, Y.; Gao, Z.; Yuan, X.; Zheng, X. Synthesis of γ-Al2O3–supported Pt nanoparticles using Al-based metal-organic framework as medium and their catalytic performance for total propene oxidation and selective nitrobenzene hydrogenation. Mater. Chem. Phys. 2020, 240, 122146. [Google Scholar] [CrossRef]
- Cargnello, M.; Doan-Nguyen, V.V.T.; Gordon, T.R.; Diaz, R.E.; Stach, E.A.; Gorte, R.J.; Fornasiero, P.; Murray, C.B. Control of Metal Nanocrystal Size Reveals Metal-Support Interface Role for Ceria Catalysts. Science 2013, 341, 771. [Google Scholar] [CrossRef]
- Williams, W.D.; Shekhar, M.; Lee, W.-S.; Kispersky, V.; Delgass, W.N.; Ribeiro, F.H.; Kim, S.M.; Stach, E.A.; Miller, J.T.; Allard, L.F. Metallic Corner Atoms in Gold Clusters Supported on Rutile Are the Dominant Active Site during Water—Gas Shift Catalysis. J. Am. Chem. Soc. 2010, 132, 14018. [Google Scholar] [CrossRef]
- Shekhar, M.; Wang, J.; Lee, W.-S.; Williams, W.D.; Kim, S.M.; Stach, E.A.; Miller, J.T.; Delgass, W.N.; Ribeiro, F.H. Size and Support Effects for the Water–Gas Shift Catalysis over Gold Nanoparticles Supported on Model Al2O3 and TiO2. J. Am. Chem. Soc. 2012, 134, 4700. [Google Scholar] [CrossRef]
- Shekhar, M.; Wang, J.; Lee, W.-S.; Cem Akatay, M.; Stach, E.A.; Nicholas Delgass, W.; Ribeiro, F.H. Counting Au catalytic sites for the water–gas shift reaction. J. Catal. 2012, 293, 94. [Google Scholar] [CrossRef]
- Wang, S.; Liu, Y.; Zhao, J. PtN3-Embedded graphene as an efficient catalyst for electrochemical reduction of nitrobenzene to aniline: A theoretical study. Phys. Chem. Chem. Phys. 2020, 22, 17639. [Google Scholar] [CrossRef]
- Shi, Y.; Wang, H.; Wang, Z.; Wu, T.; Song, Y.; Guo, B.; Wu, L. Pt decorated hierarchical Sb2WO6 microspheres as a surface functionalized photocatalyst for the visible-light-driven reduction of nitrobenzene to aniline. J. Mater. Chem. A 2020, 8, 18755. [Google Scholar] [CrossRef]
- Zhang, Q.; Bu, J.; Wang, J.; Sun, C.; Zhao, D.; Sheng, G.; Xie, X.; Sun, M.; Yu, L. Highly Efficient Hydrogenation of Nitrobenzene to Aniline over Pt/CeO2 Catalysts: The Shape Effect of the Support and Key Role of Additional Ce3+ Sites. ACS Catal. 2020, 10, 10350. [Google Scholar] [CrossRef]
- Macino, M.; Barnes, A.J.; Althahban, S.M.; Qu, R.; Gibson, E.K.; Morgan, D.J.; Freakley, S.J.; Dimitratos, N.; Kiely, C.J.; Gao, X.; et al. Tuning of catalytic sites in Pt/TiO2 catalysts for the chemoselective hydrogenation of 3-nitrostyrene. Nat. Catal. 2019, 2, 873. [Google Scholar] [CrossRef]
- LÜ, Z.; Zhu, S.; Dong, M.; Qin, Z.; Fan, W.; Wang, J. Synthesis of γ-Valerolactone through coupling of methyl levulinate hydrogenation with aqueous phase reforming of methanol over Pt/CoxAl catalyst. J. Fuel Chem. Technol. 2024, 52, 1266. [Google Scholar] [CrossRef]
- Dang, T.T.; Pham, V.H.; Vu, B.K.; Hur, S.H.; Shin, E.W.; Kim, E.J.; Chung, J.S. Clean and effective catalytic reduction of graphene oxide using atomic hydrogen spillover on Pt/γ-Al2O3 catalyst. Mater. Lett. 2012, 86, 161. [Google Scholar] [CrossRef]
- Lee, S.; Kim, H.; Ryoo, R.; Park, J.Y.; Choi, M. Hydrogen spillover in nonreducible oxides: Mechanism and catalytic utilization. Nano Res. 2022, 15, 10357. [Google Scholar] [CrossRef]
- Hülsey, M.J.; Fung, V.; Hou, X.; Wu, J.; Yan, N. Hydrogen Spillover and Its Relation to Hydrogenation: Observations on Structurally Defined Single-Atom Sites. Angew. Chem. Int. Ed. 2022, 61, e202208237. [Google Scholar] [CrossRef]
- Xing, S.; Xiong, M.; Zhao, S.; Zhang, B.; Qin, Y.; Gao, Z. Improving the Efficiency of Hydrogen Spillover by an Organic Molecular Decoration Strategy for Enhanced Catalytic Hydrogenation Performance. ACS Catal. 2023, 13, 4003. [Google Scholar] [CrossRef]
- Geng, Y.; Li, H. Hydrogen Spillover-Enhanced Heterogeneously Catalyzed Hydrodeoxygenation for Biomass Upgrading. ChemSusChem 2022, 15, e202102495. [Google Scholar] [CrossRef] [PubMed]
- Liu, K.; Yan, P.; Jiang, H.; Xia, Z.; Xu, Z.; Bai, S.; Zhang, Z.C. Silver initiated hydrogen spillover on anatase TiO2 creates active sites for selective hydrodeoxygenation of guaiacol. J. Catal. 2019, 369, 396. [Google Scholar] [CrossRef]
- Im, J.; Shin, H.; Jang, H.; Kim, H.; Choi, M. Maximizing the catalytic function of hydrogen spillover in platinum-encapsulated aluminosilicates with controlled nanostructures. Nat. Commun. 2014, 5, 3370. [Google Scholar] [CrossRef] [PubMed]


Disclaimer/Publisher’s Note: The statements, opinions and data contained in all publications are solely those of the individual author(s) and contributor(s) and not of MDPI and/or the editor(s). MDPI and/or the editor(s) disclaim responsibility for any injury to people or property resulting from any ideas, methods, instructions or products referred to in the content. |
© 2025 by the authors. Licensee MDPI, Basel, Switzerland. This article is an open access article distributed under the terms and conditions of the Creative Commons Attribution (CC BY) license (https://creativecommons.org/licenses/by/4.0/).