Article

Novel Trimethoprim-Based Metal Complexes and Nanoparticle Functionalization: Synthesis, Structural Analysis, and Anticancer Properties

1
Chemistry Department, Faculty of Science, Suez Canal University, Ismailia 41522, Egypt
2
Basic Sciences Department, Faculty of Dentistry, Sinai University, Kantara 41632, Egypt
3
Chemistry Department, College of Arts and Sciences, Cleveland State University, Cleveland, OH 44115, USA
4
Physical Science Department, Santa Monica College, Santa Monica, CA 90405, USA
*
Authors to whom correspondence should be addressed.
Inorganics 2025, 13(5), 144; https://doi.org/10.3390/inorganics13050144
Submission received: 18 March 2025 / Revised: 28 April 2025 / Accepted: 28 April 2025 / Published: 1 May 2025

Abstract

:
In this study, we synthesized a novel trimethoprim derivative, 4-(((2-amino-5-(3,4,5-trimethoxybenzyl) pyrimidine-4-yl)imino)methyl)benzene-1,3-diol (HD), by the reaction of trimethoprim with 2,4-dihydroxybenzaldehyde. We then prepared metal complexes of this derivative with Cu(II), Co(II), Ni(II), Ag(I), and Zn(II) and functionalized them with ZnO and Au nanoparticles. Their structures were confirmed through 1H NMR, mass spectrometry, FTIR, conductivity, thermal analysis, magnetic susceptibility, X-ray diffraction, UV-Vis spectroscopy, and TEM, revealing octahedral geometries for all complexes. Surface features were investigated using density functional theory (DFT) analysis. Pharmacokinetic parameters and target enzymes for HD and its complexes were computed using the SwissADME web tool, with the BOILED-Egg model indicating that HD and its Cu complex should be passively permeable via the blood-brain barrier and highly absorbed by the gastrointestinal tract (GIT), unlike the Ni, Co, Ag, and Zn complexes, which are predicted to show low GIT absorption. Molecular docking studies with the Caspase-3 enzyme (PDB code: 3GJQ) using the AutoDock 4.2 software demonstrated binding energies of −7.66, −8.36, −9.05, −8.62, −6.90, and −7.81 kcal/mol for HD and the Cu, Co, Ni, Ag, and Zn complexes, respectively, compared to −6.54 and −4.63 kcal/mol for TMP and 5-FU (5-fluorouracil), indicating a potential superior anticancer potential of the novel compounds. The anticancer activities of these complexes were evaluated using the MTT assay. The IC50 values for 5-FU, TMP, HD, Cu-HD, HD@ZnONPs, Cu-HD@ZnONPs, HD@AuNPs, and Cu-HD@AuNPs were found to be 32.53, 80.76, 114.7, 61.66, 77, 53.13, 55.06, and 50.81 µg/mL, respectively. Notably, all derivatives exhibited higher activity against the HepG-2 cancer cell line than TMP, except for HD, which showed similar effectiveness to TMP. Real-time PCR analysis revealed that the Au-HD@AuNPs and Cu-HD@AuNPs significantly increased caspase-3 inhibition by 4.35- and 4.5-fold and P53 expression by 3.05- and 3.41-fold, respectively, indicating enhanced pro-apoptotic gene expression and apoptosis induction in HepG2 cells. Our findings demonstrate that these novel derivatives possess significant anticancer properties, with some complexes showing superior activity compared to standard drugs such as 5-Fluorouracil (5-FU) and Trimethoprim (TMP). This study highlights the potential of these nanocomposites as promising candidates for cancer therapy.

1. Introduction

Given their biological significance as constituents of nucleic acids, pyrimidines have garnered much attention, and that functionality can be found in several critical pharmaceutical substances. Substituted 2,4-diaminopyrimidines are commonly utilized as inhibitors of metabolic pathways that create proteins and nucleic acids, and they are used as chemotherapeutic agents for treating neoplastic and malarial disorders [1]. The significance of metal ions in critical biological processes has been highlighted in numerous recent studies [2,3,4,5,6]. Additionally, many inorganic compounds are being utilized in therapeutics as antiviral, antibacterial, and anticancer drugs, indicating that inorganic pharmacology has become important [7,8,9,10].
A well-known antibiotic in the dihydrofolate reductase inhibitor class of drugs is trimethoprim. By preventing the synthesis of tetrahydrofolic acid, an essential component for the creation of bacterial DNA, RNA, and proteins, it is mostly used to treat bacterial infections. Trimethoprim has a bacteriostatic action, interfering with the folate pathway by inhibiting the enzyme dihydrofolate reductase. In clinical settings, trimethoprim-sulfamethoxazole (TMP-SMX or co-trimoxazole) is a commonly used medication combination that is used in conjunction with sulfamethoxazole, a sulfonamide antibiotic, to increase its efficacy. This combination is a mainstay in the treatment of lung infections, urinary tract infections, and some forms of diarrhea because it is especially efficient against a wide range of Gram-positive and Gram-negative bacteria. While trimethoprim is widely used, resistance to it has developed. This has led to the development of new derivatives and combination therapies to overcome bacterial resistance and broaden the drug’s therapeutic uses. Because of the pyrimidine ring’s nitrogen atoms, trimethoprim derivatives function well as ligands for metal ions [11,12,13].
Several studies have explored how TMP interacts with metal ions through the NH2 group on position 4 [1]. Sekhon et al. described trimethoprim as a monodentate ligand through the NH2 group in its complexes with Ag, Zn, Cd, Hg, and Ni [14]. TMP can act as a bidentate ligand as in its complexes with Fe(III), Au(III), Pt(IV), and Pd(II) through the two NH2 groups with octahedral geometry; the cytotoxicity of the Au complex was assessed against colon cancer (HCT-116) and hepatocellular carcinoma (HEPG2) cell lines, with IC50 values of 7.46 μg/mL and 9.30 μg/mL, respectively [15].
Nanoparticles, particularly zinc oxide (ZnO) and gold nanoparticles (AuNPs), have attracted much interest in biological research because of their unique features and possible uses in therapy, imaging, and drug delivery. ZnO nanoparticles are known for their excellent biocompatibility, high surface area, and intrinsic anticancer properties, which make them suitable carriers for drug delivery systems. ZnO nanoparticles can enhance the therapeutic efficacy of anticancer agents by improving their solubility, stability, and targeted delivery to cancer cells. Additionally, ZnO nanoparticles have been demonstrated to cause the production of reactive oxygen species (ROS), which cause cancer cells to undergo apoptosis [16,17,18]. Gold nanoparticles (AuNPs) also offer several advantages, including ease of functionalization, stability, and biocompatibility. AuNPs can be synthesized in various shapes and sizes, allowing precise control over their physicochemical properties. Their surfaces can be easily modified with biomolecules, drugs, or ligands, making them versatile platforms for targeted drug delivery and diagnostic applications. The potential of AuNPs to improve the delivery and effectiveness of anticancer drugs has been studied, as well as their potential to act as photothermal therapy agents by converting light into heat to kill cancer cells selectively [19,20].
As the demand for new cancer treatments continues to rise, this research presents novel metal complexes derived from trimethoprim. These complexes were designed to maximize therapeutic potential with enhanced precision and effectiveness. By combining molecular docking simulations with in vitro experiments, this study aims to connect theoretical insights with real-world therapeutic outcomes.
In this study, we synthesize and characterize a novel trimethoprim derivative (HD) and its metal complexes, including functionalization with zinc oxide (ZnO) and gold (Au) nanoparticles. Additionally, the study seeks to evaluate the anticancer properties of these derivatives and complexes against HepG2 cancer cell lines. This research also aims to determine the bioactivity, binding interactions, and potential therapeutic efficacy of the newly synthesized compounds, providing a foundation for future in vivo studies and comprehensive toxicity assessments to advance these compounds toward potential clinical applications.

2. Results and Discussion

2.1. HD Description

The Schiff base (HD), with molecular formula C21H22N4O5, was prepared by condensation of trimethoprim with 2,4-dihydroxybenzaldehyde. The HD crystals are brown, melt at 182 °C, and are soluble in various common organic solvents, including EtOH, MeOH, DMSO, and DMF. Table 1 contains data on all the characteristics of the forming ligand, including the CHN% analysis. HD was characterized using 1H NMR, FT-IR and UV-Vis spectroscopy, mass spectrometry, and thermal analysis.
The 1H NMR spectrum of the TMP free base (solubilized in DMSO) is displayed in Table S1. Two protons on the aromatic rings H-C15 and H-C11 occurred at 6.56 ppm, while one proton of the TMP heterocyclic ring H-C1 showed as a singlet at 7.53 ppm. The nine hydrogens in the three OCH3 groups exhibited two distinct peaks: (6H) at 3.73 ppm showed as a singlet, while (3H) at 3.63 ppm also appeared as a singlet. Two singlet peaks, corresponding to H2-N4 and H2-N2, occurred at 5.7 and 6.2 ppm, respectively, whereas the aliphatic (H2-C9) hydrogens showed a singlet at 3.54 ppm [21,22]. 1H NMR spectrum of HD shows a signal at δ 9.92 ppm, ascribed to the phenolic proton. The signal appearing at δ 8.29 ppm corresponds to the imine proton (-HC=N-). In addition, the aryl protons equal to 6H showed up about 7.98–7.06 ppm. There is one singlet peak at δ 6.24 ppm (H2-N7). The disappearance of H2-N8 at δ 5.7 ppm, along with the appearance of the phenolic OH, confirms the condensation of aldehyde with N8-H2 of TMP and the formation of the HD Schiff base. All data are shown in Table S1 and Figure S1.
The detected molecular ion peak in the mass spectrum matches the ligand HD’s empirical structure, which appears at m/z = 410.59 (16.73%), equal to the molecular weight of HD (Figure S2). The pathway fragmentation is listed in Table S2. Scheme S1 shows the stepwise fragmentation of the HD. The resulting fragments matched well with the observed data and validated the compound’s structure.
Table S3 and Figure 1, Figures S3 and S4 show the significant infrared absorption frequencies of HD and trimethoprim. The IR spectrum of TMP showed two bands at 3470 and 3318 cm−1, which were assigned to stretching vibrations in the two NH2 groups. The band at 3125 cm−1 was due to an aromatic C-H-stretch, and the band at 1653 cm−1 was due to the bending vibration of the NH2 group and the benzene ring [23].
The broad band centered at 3354 cm−1 in HD is caused by the stretching vibration of the OH group, and its broadness may be attributed to inter- or intramolecular hydrogen bonding [4]. The strong, sharp band as a double fork at 3449 and 3427 cm−1 for HD is due to the stretching vibration of the NH2 group [24]. The IR spectrum of the HD also showed bands at 3169 cm−1 due to aromatic CH stretching and at 1659 cm−1, which is due to the NH2 group’s deformation and stretching of the aromatic ring [25,26]. The band at 1593 cm−1 can be attributed to the stretching vibration of the (C=N) group [27].
The UV-visible spectrum of TMP has been obtained in the region of 230 to 400 nm. The spectrum exhibits two maxima at 287 nm and 257 nm [28]. The HD ligand’s UV-visible spectrum showed four bands, at λmax values of 289, 334, 388, and 514 nm, as seen in Figure S5 and Table S6. These signals are due to the π→π* and n→π* electronic transitions.
The thermal decomposition of HD demonstrates that mass loss occurs gradually. DTA and TGA data of the HD are presented in Tables S4 and S5 and Figure S6. Three decomposition phases are present in the ligand thermogram of 17–152, 152–490, and 490–650 °C, with midpoints of 108, 345, and 612 °C and mass loss percentages of 6.76, 33.12, and 61%, without any residue. ∆H values of −0.063 and −0.40 kcal/g show that the steps are exothermic at 405 and 572 °C, and the exothermic and spontaneous behavior of these steps are shown by their negative ∆H values [29]. The endothermic peak in the DTA data confirms the melting point of HD at 168 °C (∆H = 0.0.98 kcal/g), with no mass loss.

2.2. Complex Description

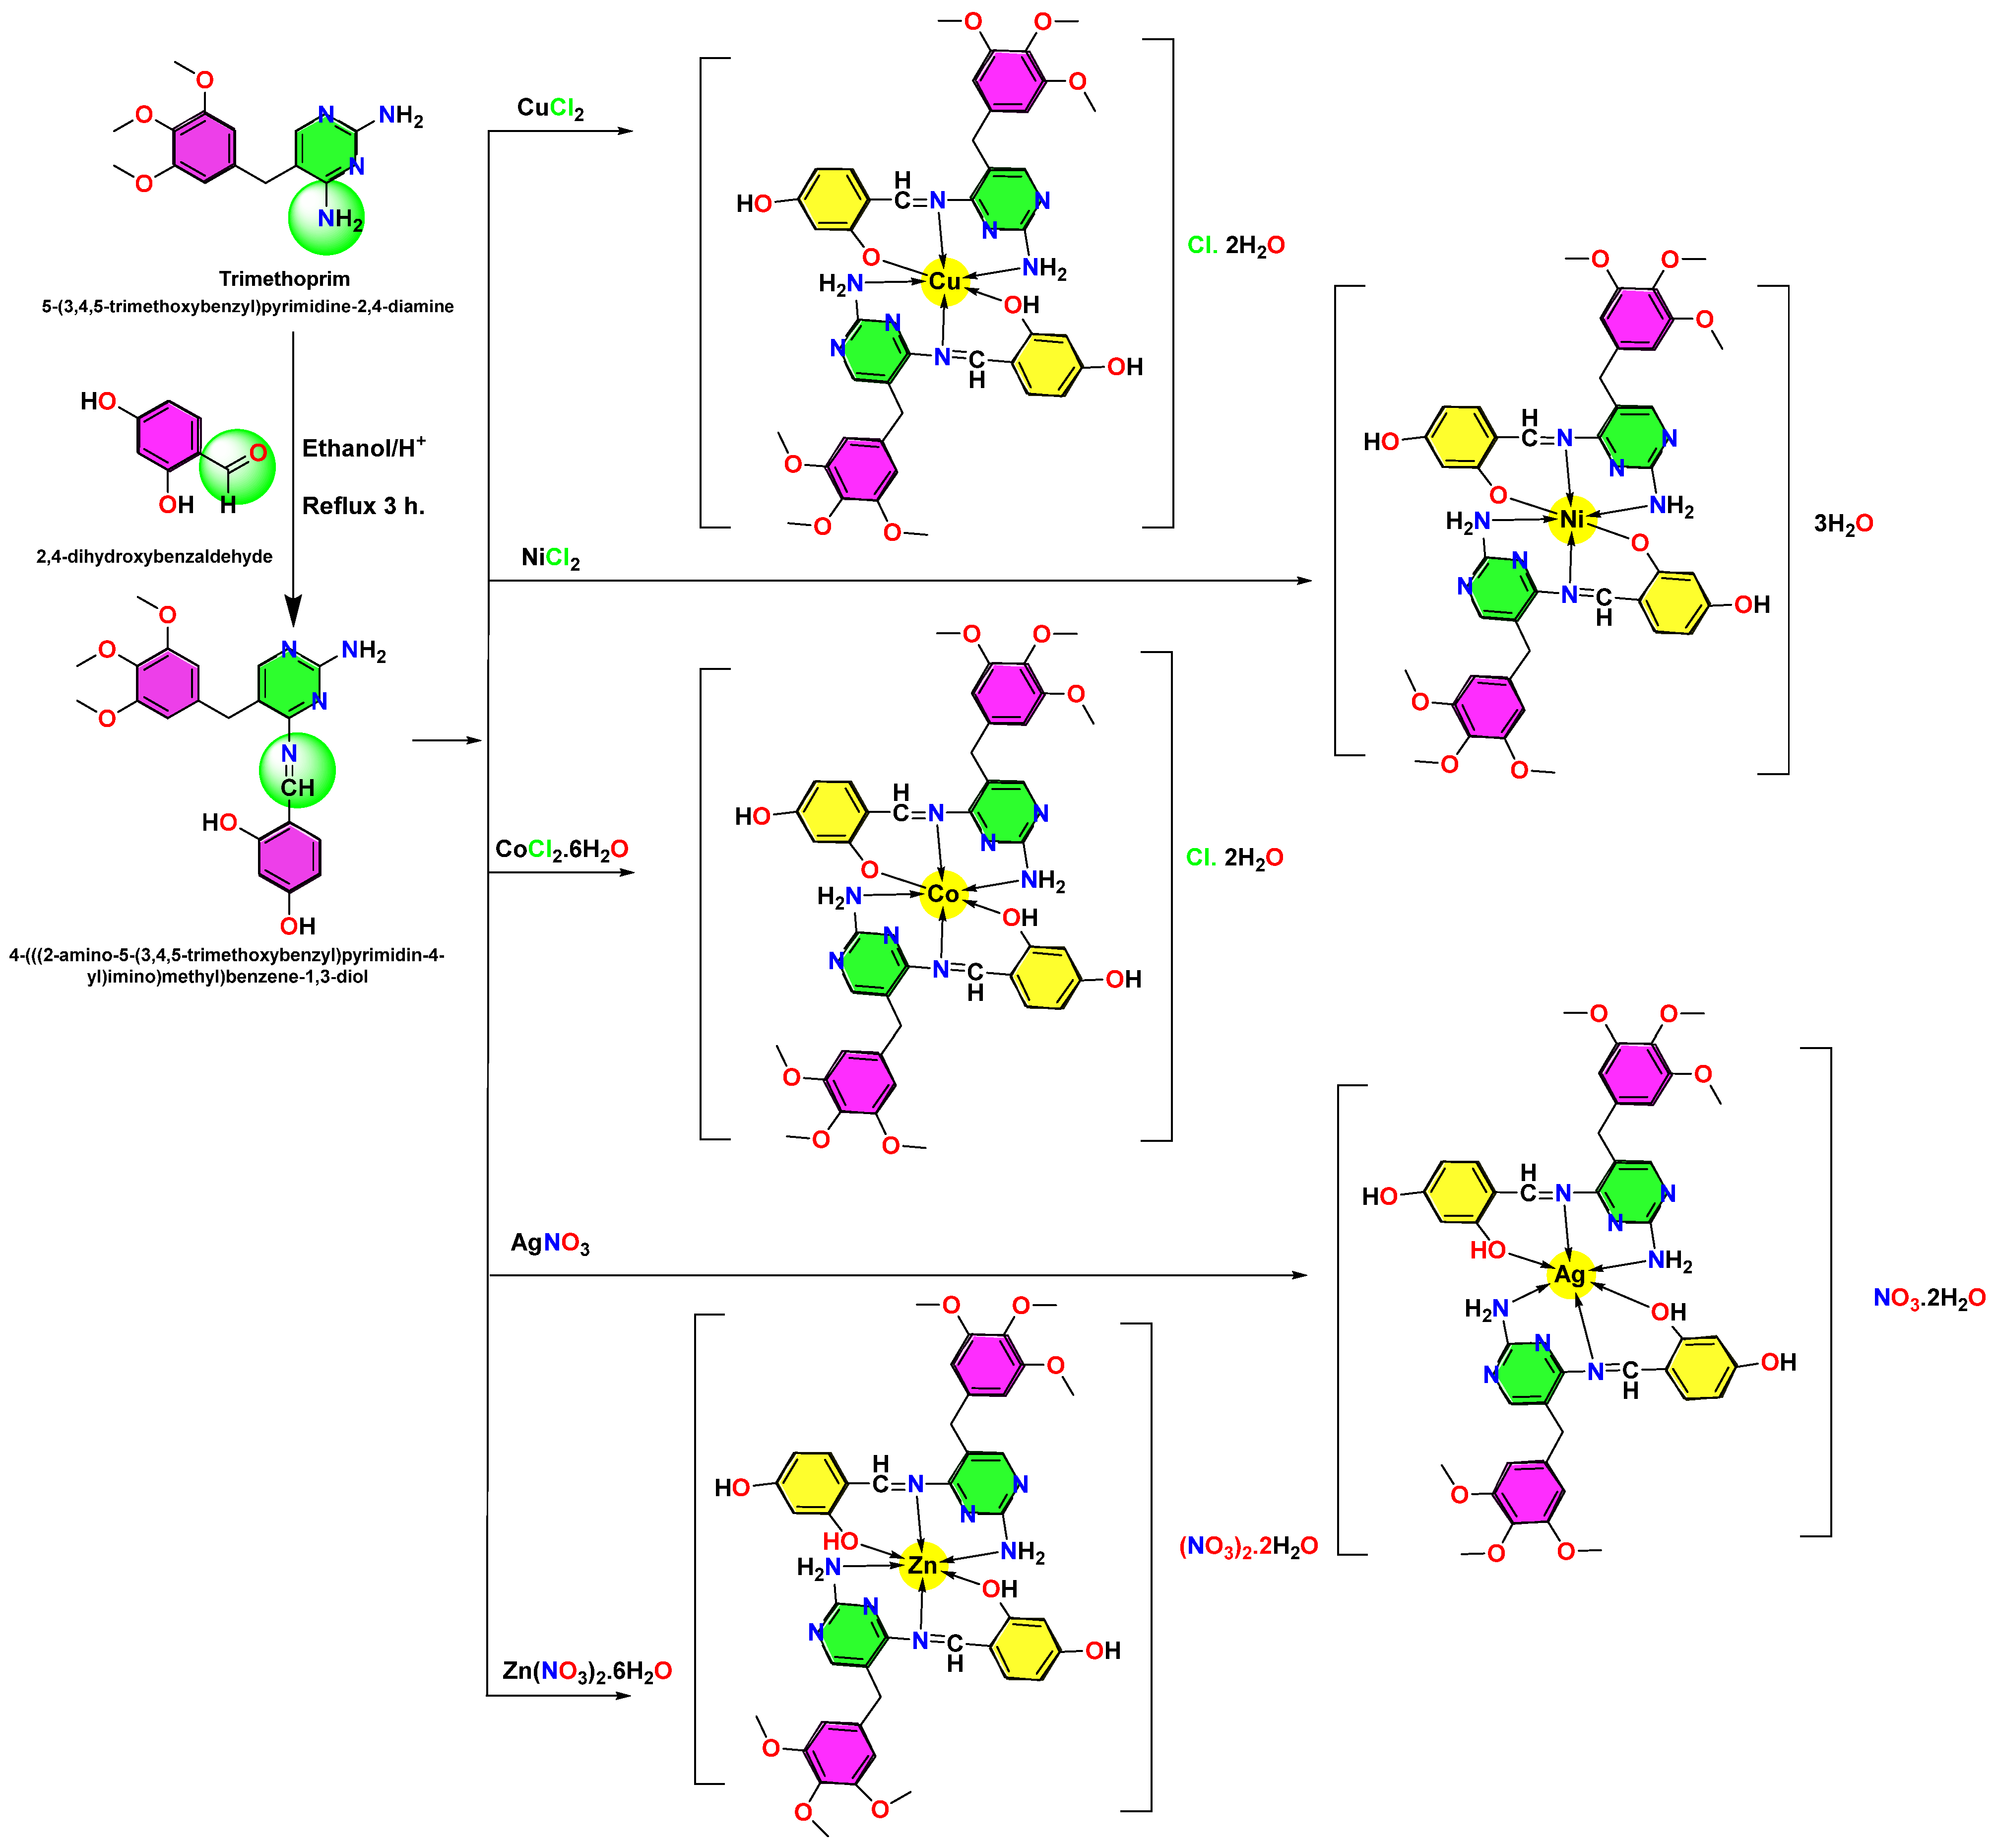
The related complexes have formulas which may be expressed as follows: [Cu(HD)2]Cl·2H2O, [Ni(HD)2]·3H2O, [Co(HD)2]Cl·2H2O, [Ag(HD)2]NO3·2H2O, and [Zn(HD)2](NO3)2·2H2O. These complexes were produced by the reactions of HD with Cu(II), Ni(II), Co(II), Ag(I), and Zn(II) salts. All complexes are crystalline, soluble in DMSO, and have higher melting points than HD (no melting was observed up to 250 °C).
The conductivity of the complexes was determined in DMSO (1 mM), and all complexes have an electrolytic nature with a 1:1 ratio, except for the Zn complex, which has a 1:2 ratio, and the Ni complex, which is neutral. The M% was determined using complexometric titration and thermogravimetry; the data of M% and CHN% confirm the proposed structure along with other analyses. The physical characteristics, analytical data, and conductivity measurements for HD and its metal complexes are summarized in Table 1.

2.2.1. FTIR Spectra

Identifying the possible coordination sites for chelation involves comparing the IR spectra of the free ligand (HD) and its corresponding metal complexes (Table S3 and Figure 1). Chelation typically induces shifts (Δ, cm−1) and/or intensity variations in characteristic vibrational bands.
The FTIR spectrum of HD showed bands at 3354, 3449, 3427, 3169, 1659, and 1593 cm−1, which could be identified as the O-H, N-H, aromatic C-H, NH2 stretching vibrations of the aromatic ring, and stretching vibration of the C=N group. Upon complexation, these bands exhibited noticeable shifts to lower/higher frequencies, suggesting coordination through the phenolic oxygen and imine nitrogen atoms. The existence of crystalline or coordinated water in the complexes was demonstrated by the appearance of bands in all complexes at 3327, 3329, 3325, 3341, and 3340 cm−1 for Cu-HD, Ni-HD, Co-HD, Zn-HD, and Ag-HD, respectively. The presence of strong, sharp bands at 3404, 3404, 3400, 3443, 3451, and 3400 cm−1 for Cu-HD, Ni-HD, Co-HD, Zn-HD, and Ag-HD, respectively, shows the stretching vibrations of the NH2 group, which were altered by complexation, suggesting that this group binds to the metals [30,31,32].
The bending vibration of the NH2 group and the benzene ring bands shifted from 3169 and 1659 cm−1 in the free ligand to 3190, 3181, 3192, 3185, and 3140 cm−1, and bands to 1638, 1643, 1638, 1653, and 1643 cm−1, for Cu-HD, Ni-HD, Co-HD, Zn-HD, and Ag-HD complexes, respectively, indicating slight perturbations of the aromatic system upon complex formation [23]. Additionally, the C=N stretching band shifted from 1593 cm−1 in HD to 1595, 1589, 1595, 1595, and 1593 cm−1 for Cu-HD, Ni-HD, Co-HD, Zn-HD, and Ag-HD, respectively, confirming the involvement of the azomethine nitrogen atom in metal coordination. The Zn-HD and Ag-HD complexes exhibit sharp bands at 1382 and 1392 cm−1, respectively; these bands can be assigned as arising from the NO3 groups [33].
Interestingly, for Cu-HD, Ni-HD, Co-HD, Zn-HD, and Ag-HD complexes, new bands attributed to M-O stretching vibrations are observed around 640, 638, 638, 613, and 643 cm−1, respectively. Additionally, M–N stretching bands appeared at 683, 681, 679, 683, and 667 cm−1 for Cu-HD, Ni-HD, Co-HD, Zn-HD, and Ag-HD complexes, respectively. These bands are crucial for confirming the chelation process, providing clear evidence of metal-ligand coordination. The M–O bands confirm coordination through oxygen donor atoms, while the M–N bands indicate coordination via nitrogen donor atoms, thus offering direct support for metal binding through both oxygen and nitrogen atoms.

2.2.2. 1H NMR

The feasibility of obtaining 1H NMR spectra for transition metal complexes largely depends on the magnetic properties of the metals involved. Since most transition metal complexes are paramagnetic, they generally do not yield clear 1H NMR spectra due to signal broadening and wide ranges of chemical shifts. In contrast, diamagnetic transition metal complexes produce sharp 1H NMR signals that are suitable for detailed analysis.
The 1H NMR spectra of HD and its diamagnetic complex (Zn-HD) were recorded in DMSO-d6 (Figures S1 and S7). On comparing the main peaks of HD with the Zn-HD complex, it is observed that all the peaks of HD are present in the spectra of the complex with changes in chemical shift upon binding of HD with the metal ion, such as (N7H2) from 6.24 to 6.59 ppm, and H-phenol (OH) from 9.92 to 9.77 ppm. The signal that appeared for the imine proton in HD at δ 8.29 ppm is shifted to 8.43 ppm in the Zn-HD complex, indicating the metal coordinates with this group in the complex.

2.2.3. Thermal Analysis

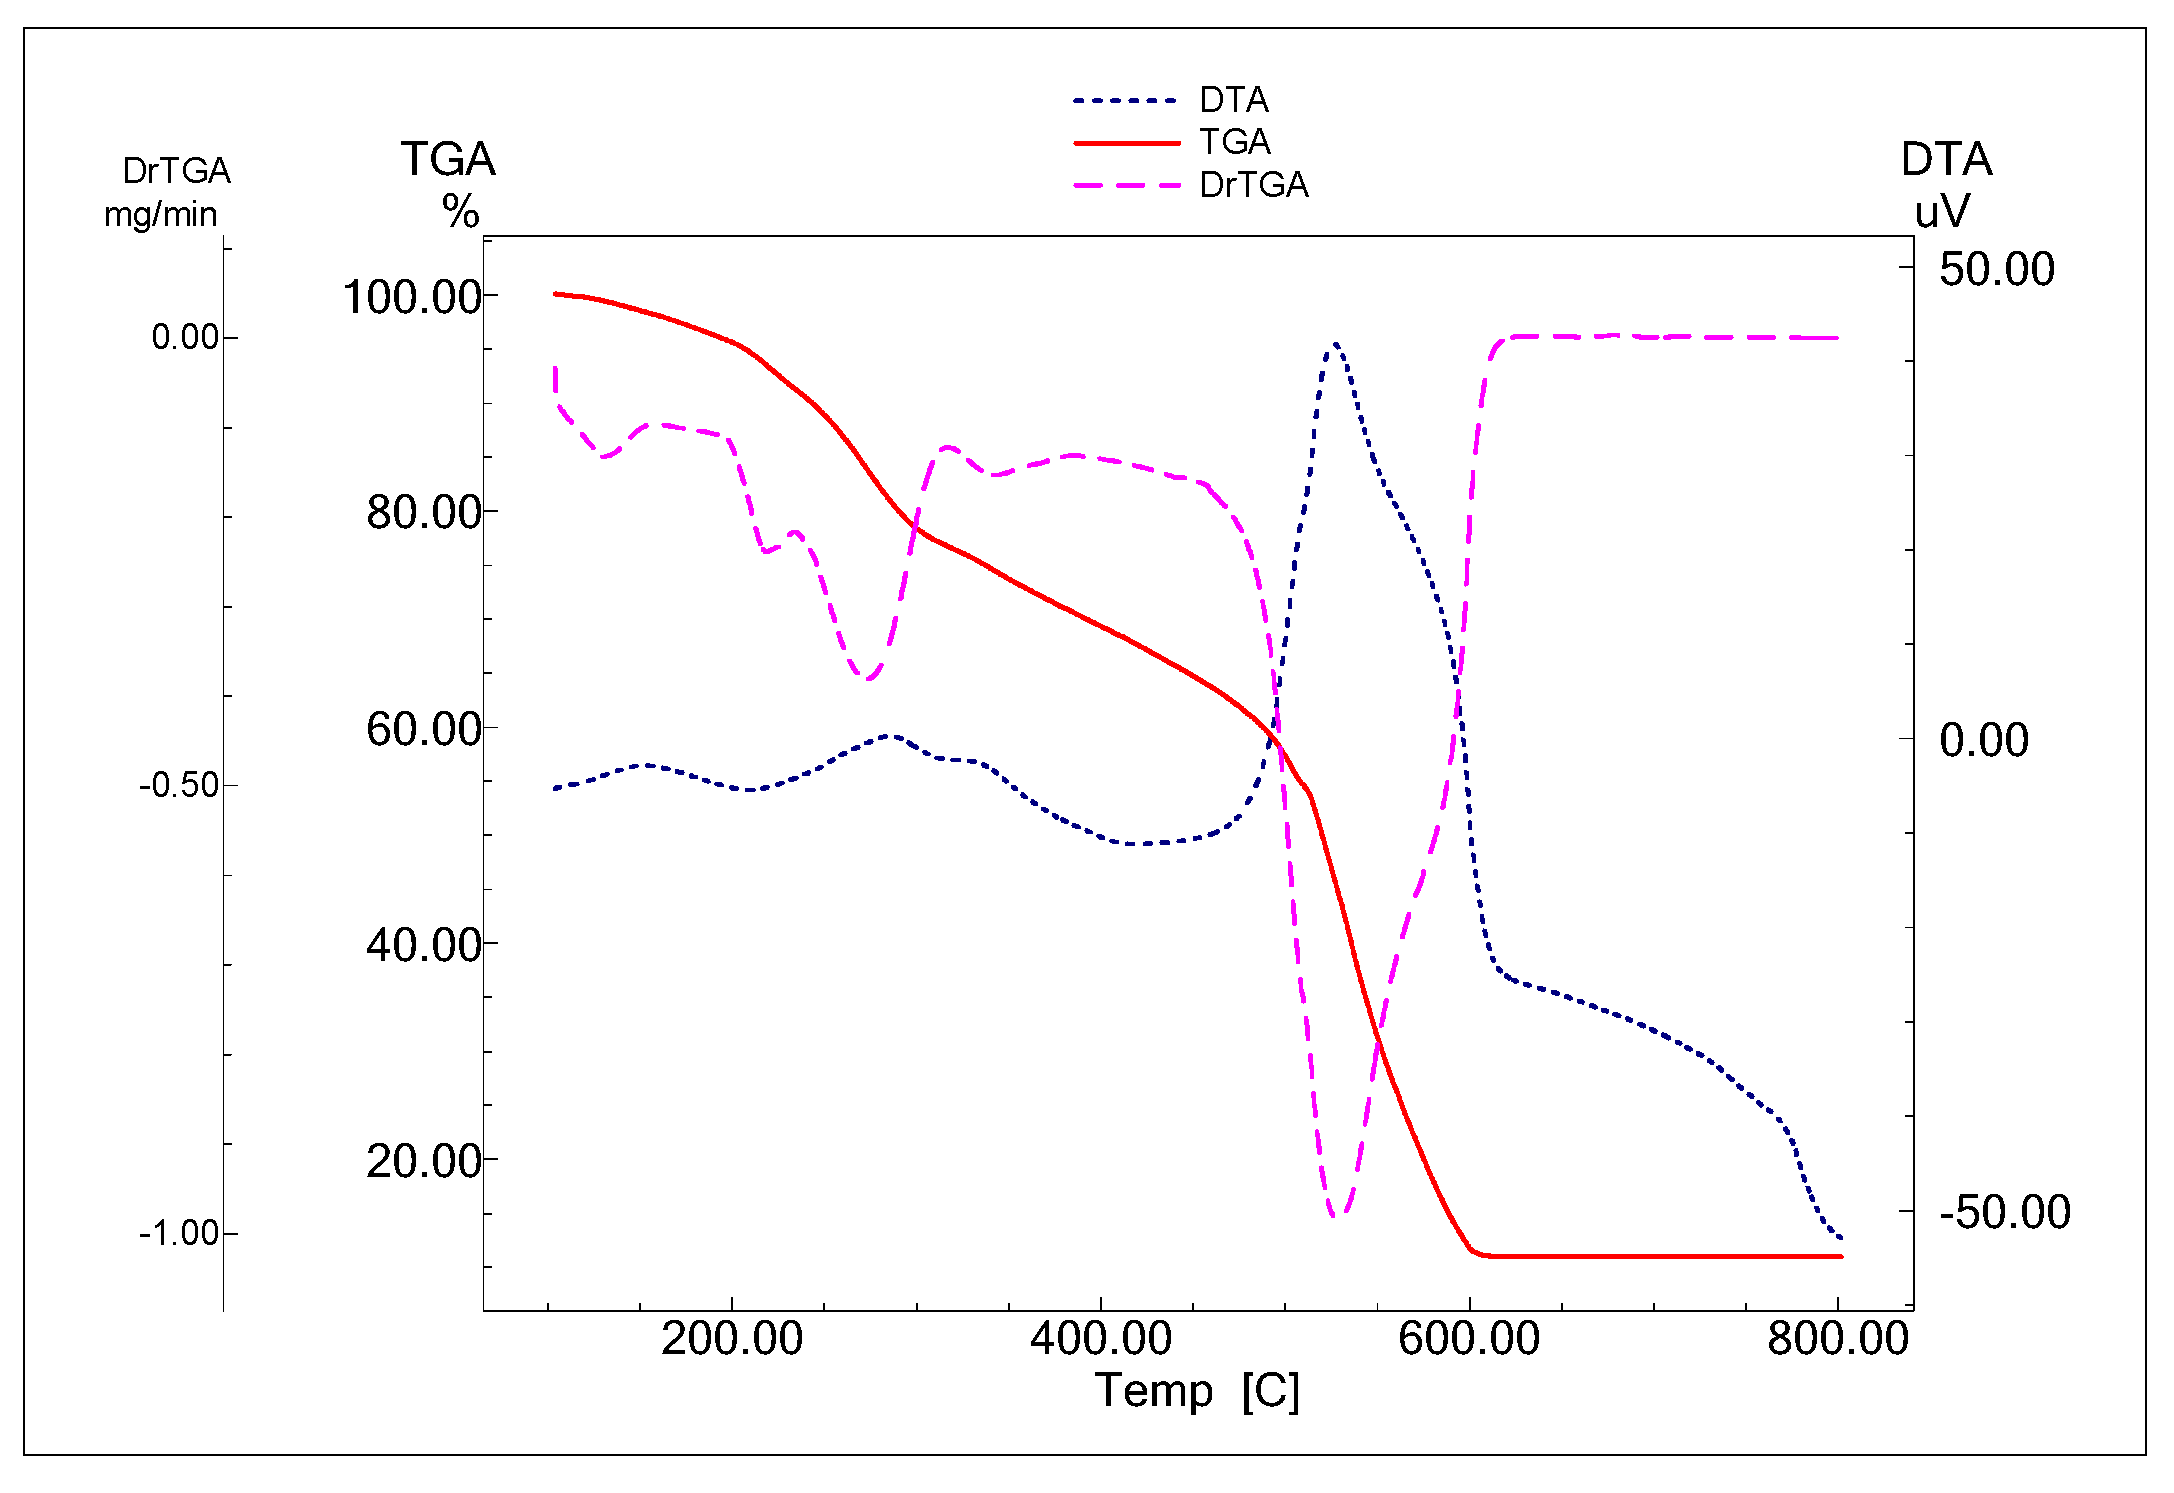
TG/DTG and DTA were used to study the thermal stability of the complexes, and Figure 2, Figure 3 and Figures S8–S10 and Tables S4 and S5 include the findings.
The first decomposition step includes dehydration of the complexes at 79, 73, 63, 128, and 108 °C. This step appeared to cause mass losses of 3.88, 5.95, 3.62, 3.81, and 3.61%, respectively, (Calc. 3.77, 5.8, 3.78, 3.68, and 3.44%), and it can be associated with endothermic DTA peaks at 56, 79, 76, 152, and 121 °C for Cu(II), Ni(II), Co(II), Ag(I), and Zn(II) complexes, respectively.
The decomposition of HD and the loss of the coordinated water and/or HCl are shown in the second step. The Cu, Ni, Co, Ag, and Zn complexes were shown in this step as a broad DTG band with one maximum at 273, 268, 273, 285, and 293 °C respectively. The mass loss was (found/calculated %) 33.67/33.62, 35.99/35.88, 29.84/29.69, 19.26/19.31, and 51.65/51.55, respectively, and DTA thermograms showed this step as exothermic DTA bands at 295, 299, 303, 285, and 308 °C for Cu, Ni, Co, Ag, and Zn complexes, respectively.
The third decomposition step appears as the second ligand loss and/or loss of HNO3; it begins at 375, 436, and 449 °C, with mass reductions (found/calculated %) of 40.9/41.1, 28.49/28.50, and 24.17/24.01, for Cu, Co, and Zn, respectively. The DTA thermograms showed exothermic DTA bands at 367, 468, and 459 °C, respectively.
The last step started at 513, 441, 514; 556, 529, and 540 °C, with mass reductions (found/calculated %) of 12.78/12.88, 48.19/48.21, 28.58/28.51, 65.8/64.9, and 12.92/12.83 for Cu, Ni, Co, Ag, and Zn complexes, respectively. The proposed process was the loss of the nitrate group in the Ag complex. The DTA thermograms displayed exothermic DTA bands at 516, 450, 520; 577, 526, and 459 °C for Cu, Ni, Co, Ag, and Zn, respectively. CuO, NiO, CoO, Ag, and ZnO are the hypothesized formulas that agree well with the residue percentage, with mass reductions (found/calculated %) of 8.79/7.28, 10/8.02, 9.65/7.88, 10.95/11.03, and 8.45/7.78, respectively.
The DTA data illustrate the complexes’ thermal behavior, which can be summed up as follows: All complexes exhibit nonspontaneous endothermic crystalline water liberation. All complexes undergo exothermic thermal decomposition processes (spontaneous at a given temperature), including liberation of the coordinated water molecules and ligand decomposition.

2.2.4. Magnetic Moment and UV-Visible Spectra

The magnetic measurements, the electronic absorption spectra, and the peak assignments for complexes in DMSO and Nujol mull [34] are summarized in Table S6 and displayed in Figure 4 and Figures S11–S14.
Complex formation was established by the difference in absorption band wavelength between the ligand and the complexes. The bands due to d-d transitions on the metal centers may be obscured by high-intensity ligand-based bands. Electronic transitions indicate the interaction between the ligand and the metal ions and indicate complex formation. Table S6 displays the computed 10 Dq values for the d-d electronic transitions, which indicate that the ligand under consideration has a moderate strength [35].
The absorptions attributed to the π→π* and n→π* transitions for HD at 289, 334, and 388 nm display a hypsochromic (blue shift) effect followed by a hyperchromic or hypochromic shift in complexation, which indicates the ligation with the metal ion in the complex.
The Cu-HD, Ni-HD, and Co-HD complexes show octahedral structures with magnetic moment = 1.52, 2.82, and 3.65 B.M, respectively. The absorption bands for Cu-HD appeared at 280, 325, 335, 365, and 512 nm due to π→π*, n→π*, and 2A1g2T2g transitions, while the transitions π→π*, n→π*; and 3A2g(F)→3T1g(P), and 3A2g(F)→3T1g(F) occurred at 290, 340, 348, 392, and 498 nm for the Ni-HD complex, and for Co-HD the bands appeared at 290, 335, 350, 385, and 515 nm due to the transitions π→π*, n→π*; 4T1g(F)→4T1g(P), and 4T1g(F)→4T2g(F), confirming the octahedral geometry around the metal ions [36,37].
The absorption bands appeared for Ag and Zn complexes at 288; 336; and 288; 334; 520 nm due to π→π*, n→π*, π→π*, n→π*, and charge transfer (CT) transitions.

2.2.5. X-Ray Diffraction Studies (XRD)

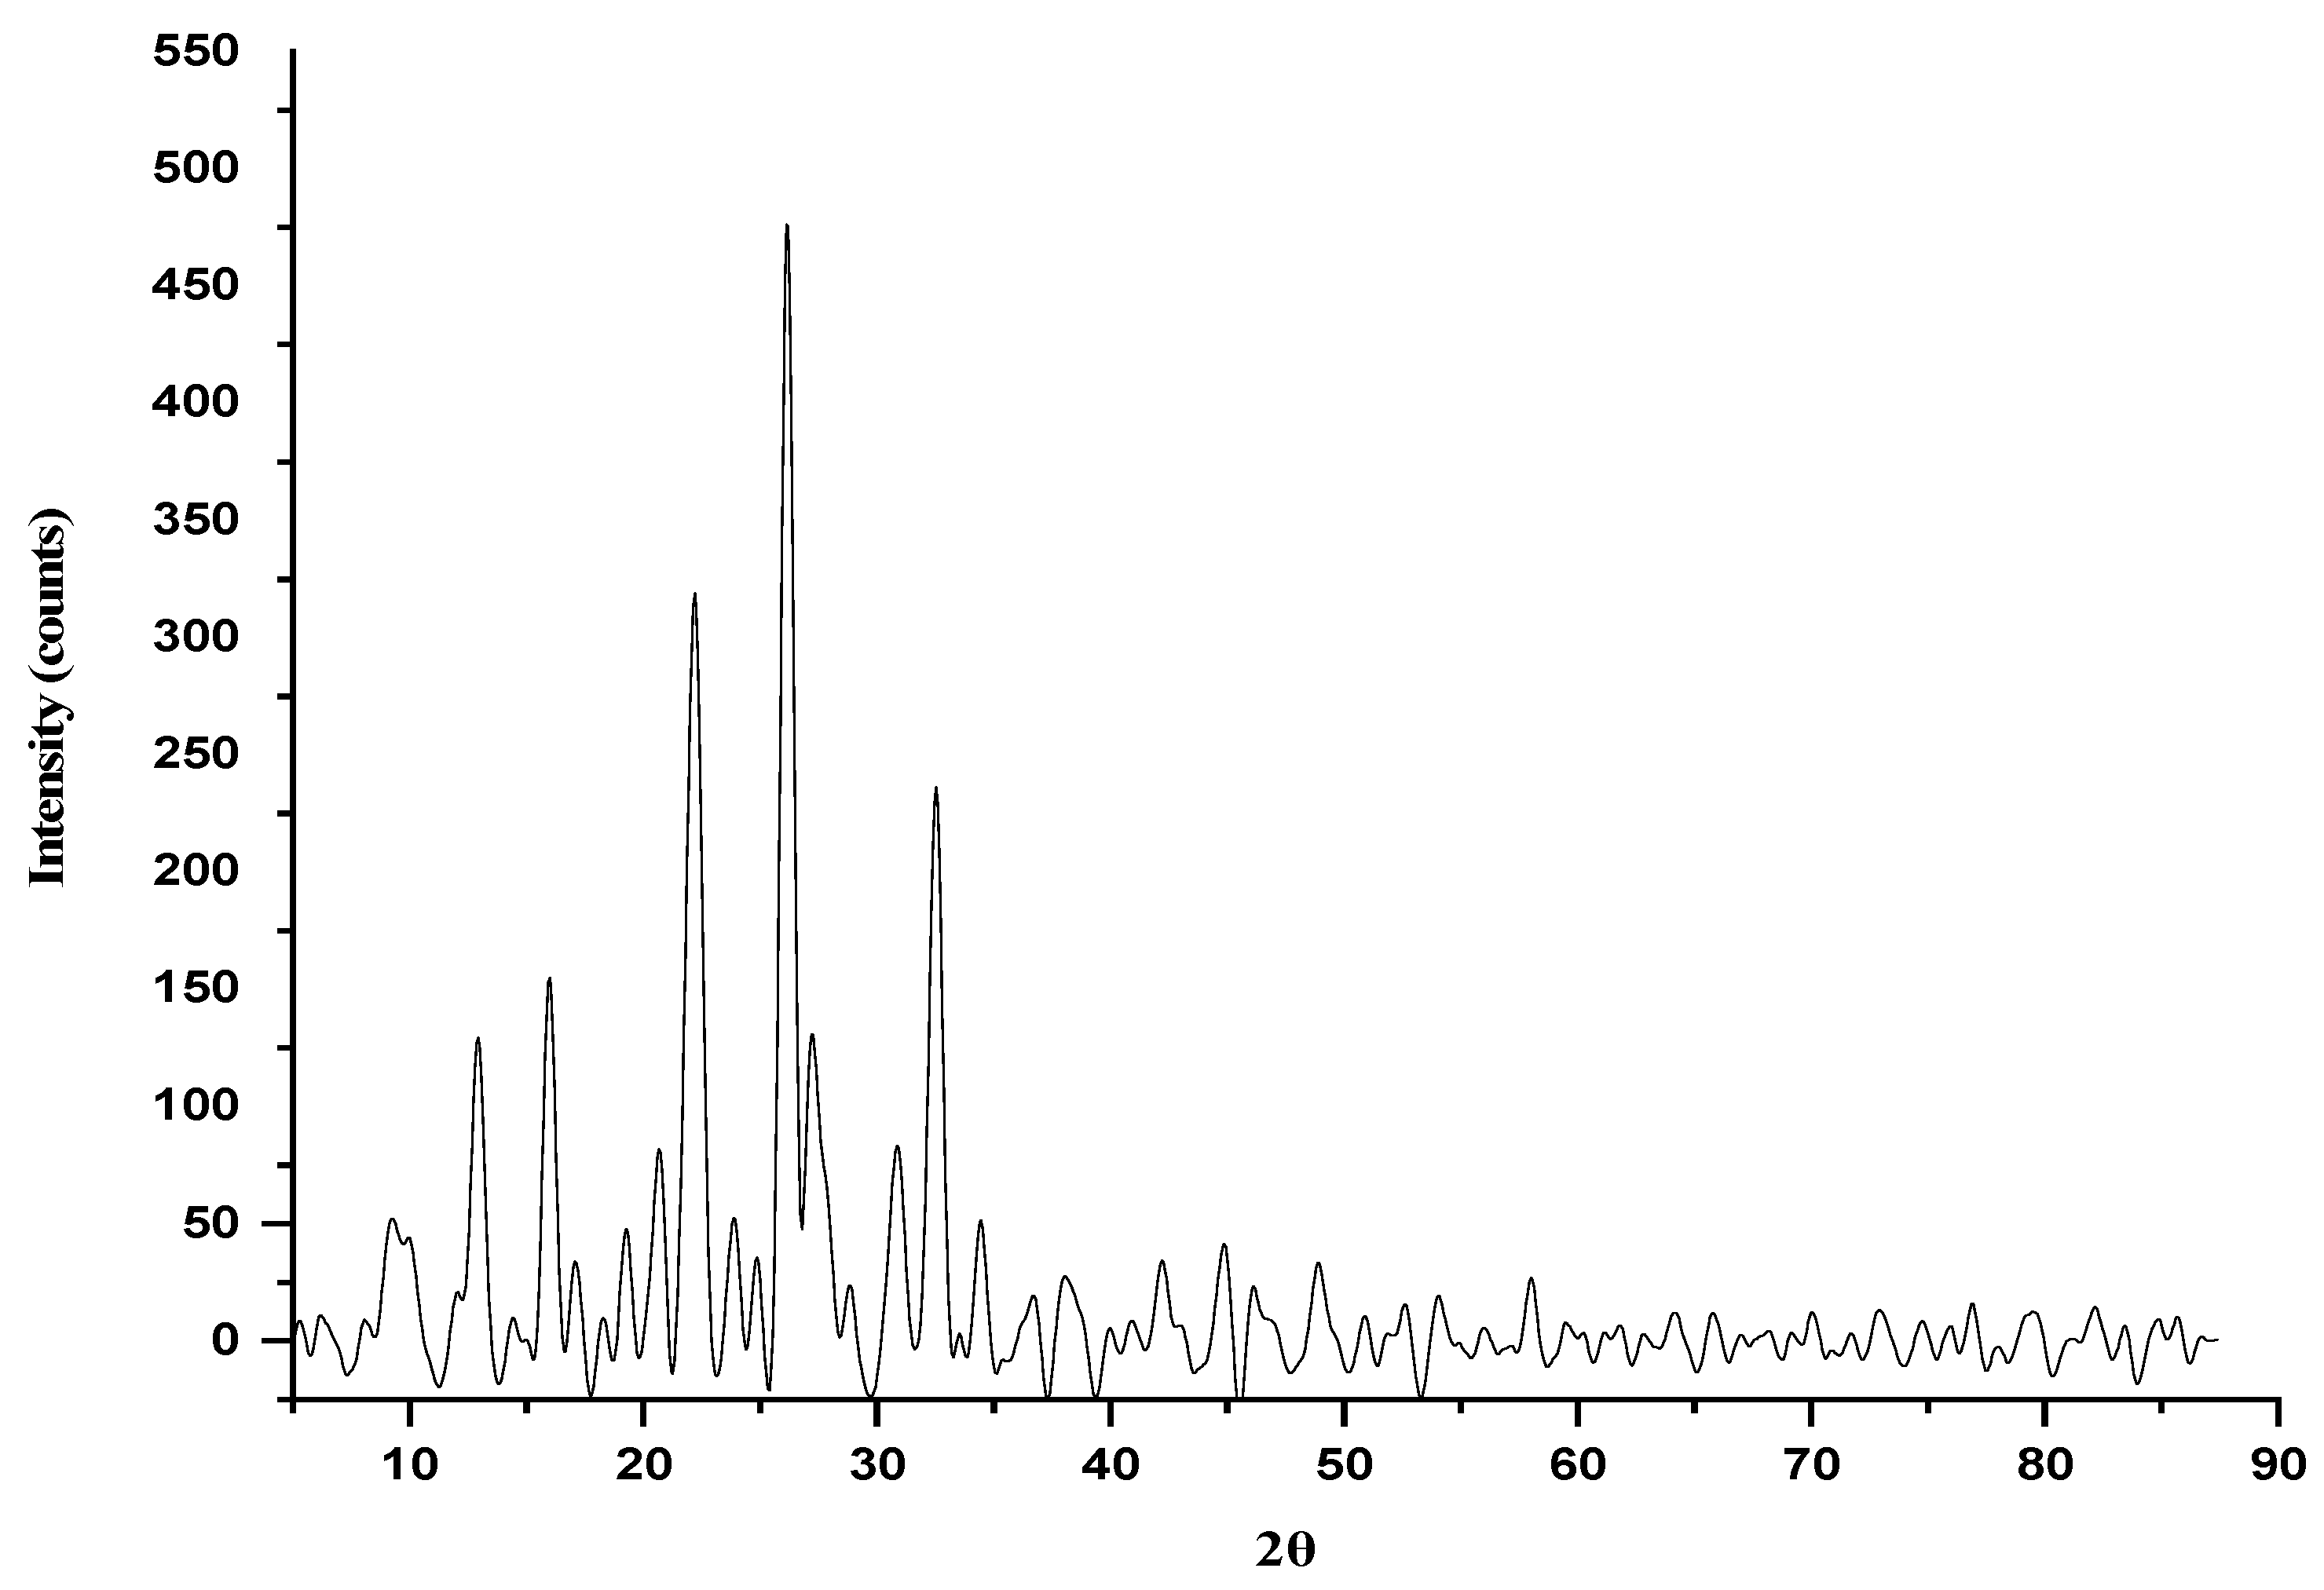
Cu-HD has an average particle size of ζ = 17.41 nm with a δ value range of 1.10–8.44 × 10⁻³ (Table S9 and Figure 5). The results indicated the production of nanoscale complexes, which is a promising development, since nanomaterials have promising activity and distinctive properties used in many applications.
Expo2014 software was used to perform semi-empirical calculations on the X-ray diffraction data [38]. Using various loops, empirical results were revised and updated for the Expo 2014 program. Table S10 provides the Miller indices, d-spacing, unit cell diameters, and crystal structure. The Expo2014 program was used to refine and fit the calculated unit cell and package configurations. The findings are shown in Figure 6.
Analytical techniques, such as 1H NMR, CHNM%, FTIR, thermal analysis, magnetic characteristics, molar conductivity, and UV-visible spectra, were used to determine the complexes’ structure and spatial order, as presented in Scheme 1.

2.3. Characterization of the Nanoparticles

2.3.1. UV–Vis Spectra for ZnONPs

The UV-vis spectra (Figure S15) of the produced ZnO nanoparticles (ZnONPs) exhibited a prominent absorbance peak at 371 nm, corresponding to particle sizes ranging from 2 to 100 nm. This single, narrow peak in the spectra confirms the formation of ZnONPs. The size and shape of the nanoparticles influence the UV-Vis absorption spectrum. Notably, metal nanoparticles that exhibit surface plasmon resonance (SPR) tend to show a red shift in their absorbance spectra as particle size increases. Changes in the nanoparticle size and structure can result in either a blue or red shift in the absorbance peak wavelength [39,40,41].
The electronic spectrum of the ZnO NPs shows a peak at 371 nm, attributed to SPR. The electronic spectrum of HD@ZnO NPs shows peaks at 286, 332, and 396 nm, and that of Cu-HD@ZnO NPs shows peaks at 287, 328, 376, and 508 nm; these peaks are attributed to n→π* transitions. The spectra, peak wavelengths, and their assignments are given in Figures S15–S17 and Table S7.

2.3.2. UV–Vis Spectral for GNPs

Gold nanoparticles (AuNPs) display a distinct absorption band in the visible spectrum, attributed to SPR. The UV-visible spectrum shows a sharp peak at 520 nm, confirming the formation of the nanoparticles. The concentration of the gold nanoparticles (15 nM) was determined using Beer’s Law, with a molar extinction coefficient of 2.43 × 10⁸ M−1 cm−1 [42,43,44]. The electronic transitions of Au, HD@AuNPs, and Cu-HD@AuNPs appear at 526, 289; 330; 520, and 279; 321; 510 nm, respectively (Figures S18–S20 and Table S7).

2.3.3. TEM

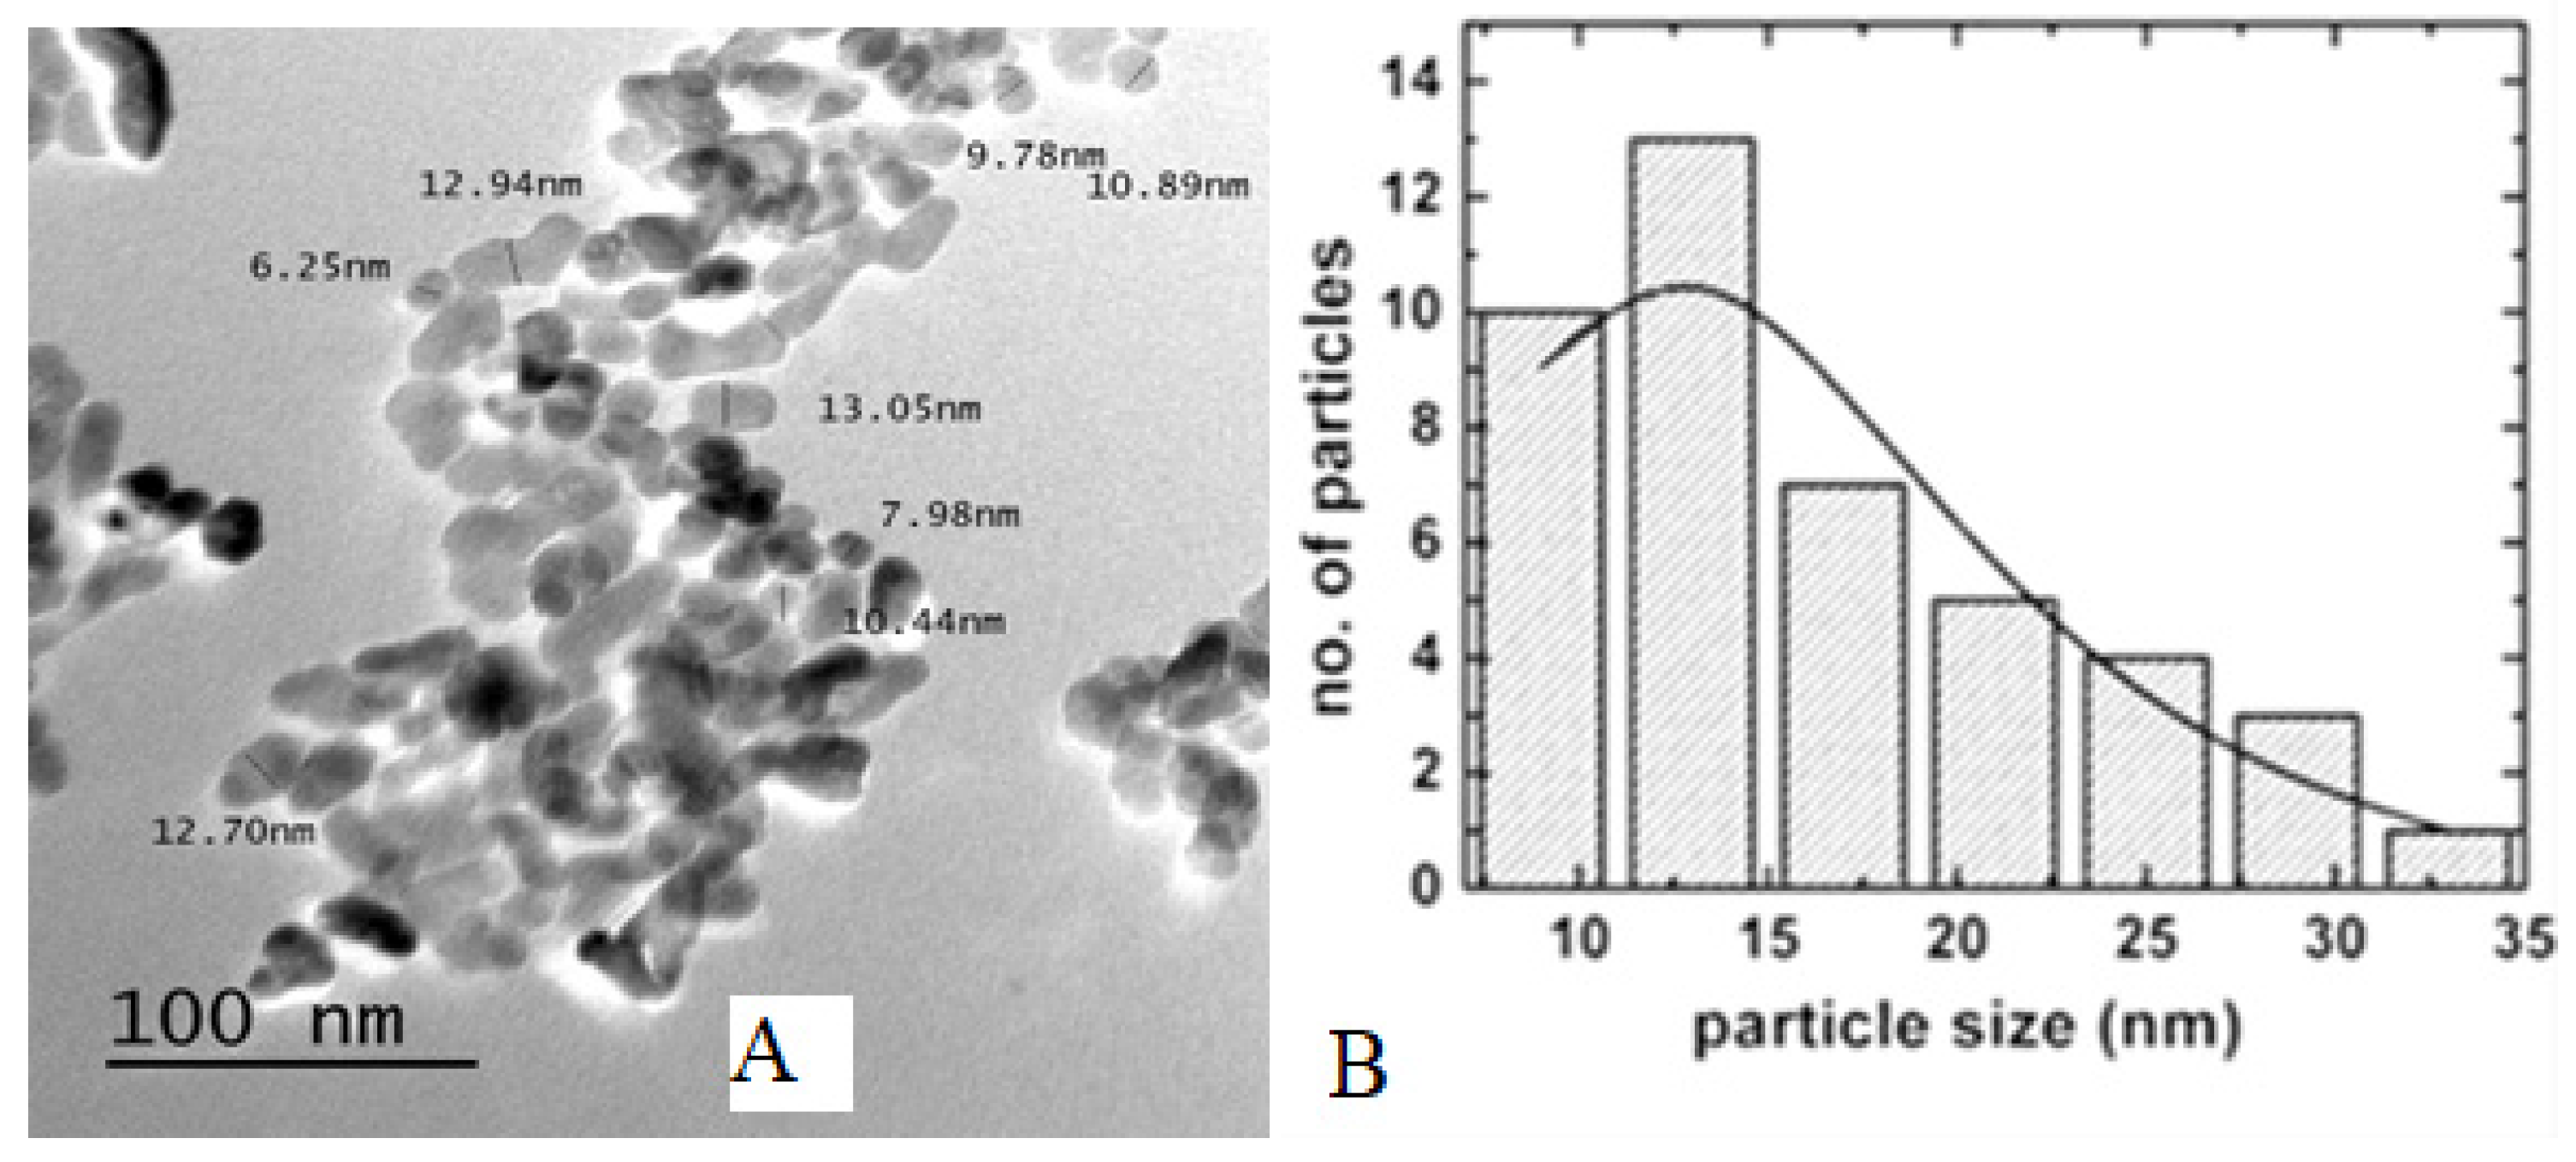
The TEM and size histograms provide detailed insights into the morphology and size distribution of the ZnO and Au nanoparticles, shown in Figure 7 and Figure 8. For ZnO nanoparticles, the TEM image reveals a well-defined, roughly spherical shape with an average particle size that appears uniformly distributed, as indicated by the histogram. The histogram further confirms a narrow size distribution, which suggests consistent synthesis conditions. Similarly, the TEM for the Au nanoparticles show distinct, spherical shapes, and the corresponding histogram indicates a relatively narrow size range, consistent with precise control over nanoparticle formation. Both ZnO and Au nanoparticles demonstrate considerable uniformity in size and shape, which is essential for applications requiring consistent optical and catalytic properties [45,46].

2.3.4. X-Ray Diffraction Studies (XRD)

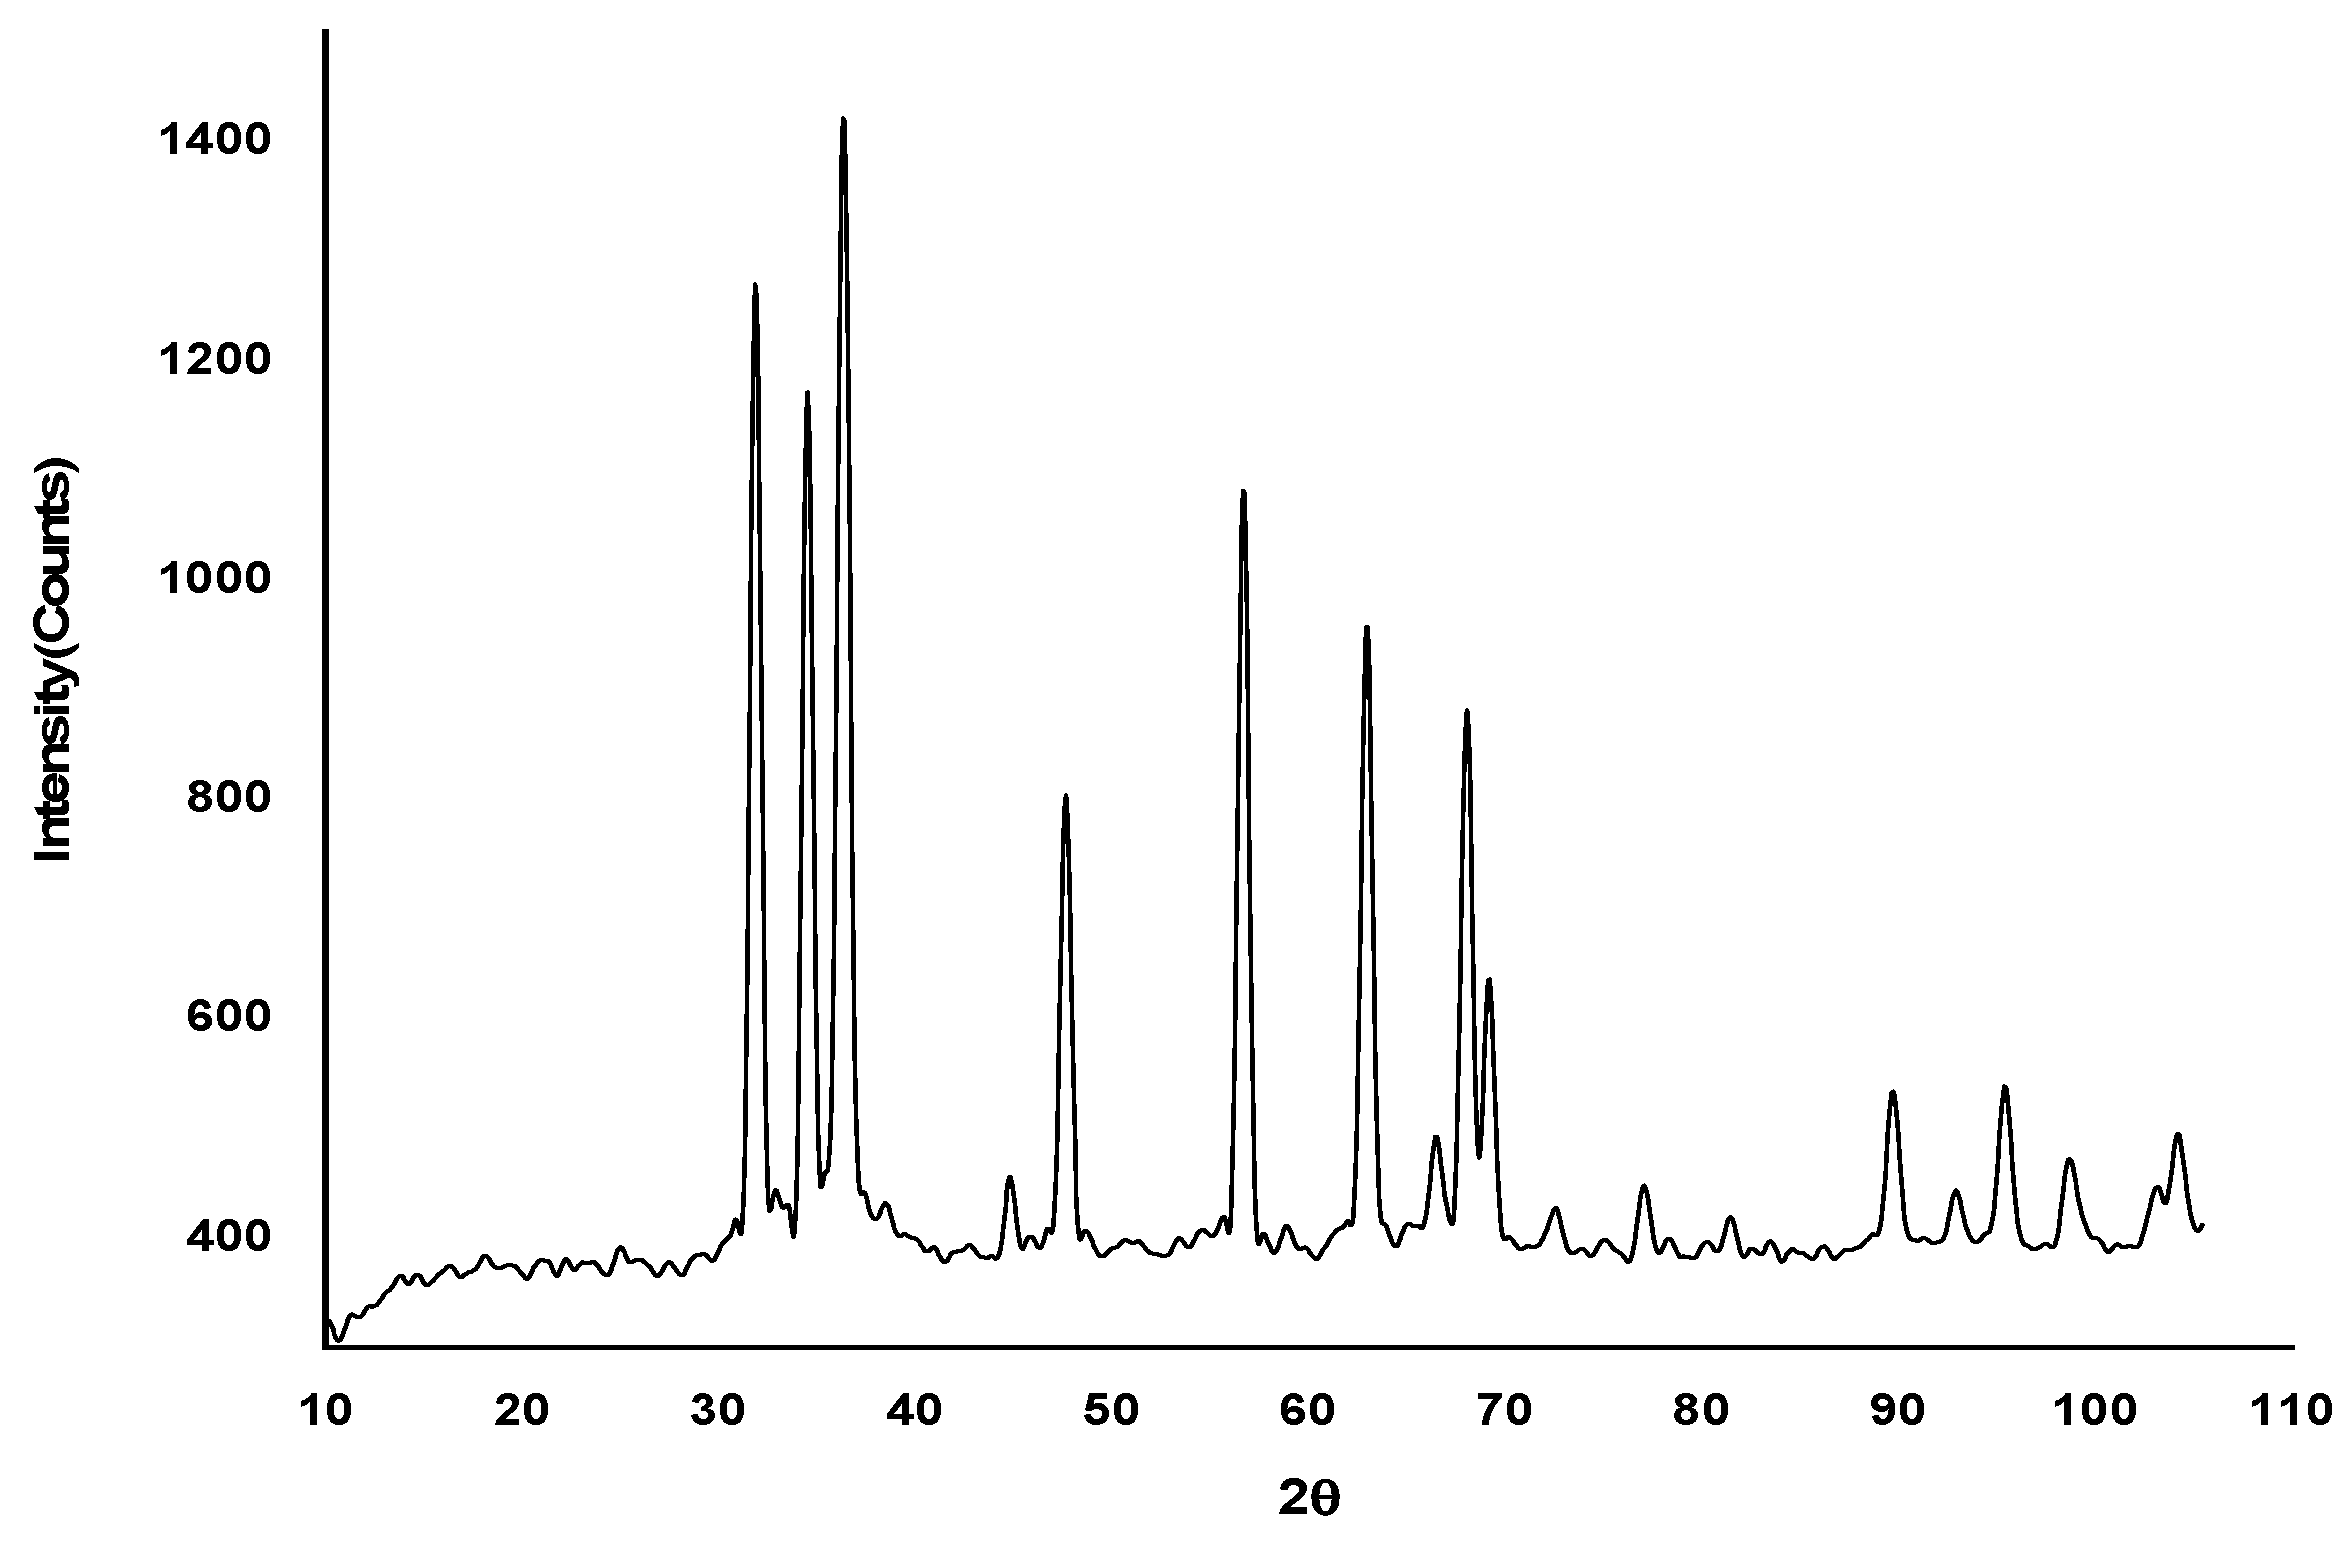
The synthesized ZnO nanoparticles were characterized using X-ray Diffraction (XRD) to confirm their crystalline structure, phase purity, and particle size. The XRD pattern (Figure 9 and Table S8) exhibits prominent peaks at various 2θ values, including approximately 31.8°, 34.4°, 36.2°, 47.5°, 56.6°, 62.9°, and 68.0°. These peaks correlate with the (100), (002), (101), (102), (110), (103), and (112) planes, which are characteristic of the hexagonal wurtzite structure of ZnO. The positions of these diffraction peaks align closely with the standard reference data for ZnO (JCPDS card no. 36-1451), confirming the phase purity of the nanoparticles.
The narrow, well-defined peaks in the XRD pattern indicate that the synthesized ZnO nanoparticles possess a high degree of crystallinity with no detectable secondary phases or impurities. This suggests that the synthesis process was successful in producing pure ZnO.
To estimate the average crystallite size, the Debye–Scherrer equation was applied to the most intense diffraction peak, observed at 2θ ≈ 36.2°. With a measured full width at half maximum (FWHM) of approximately 0.5° and using Cu Kα radiation (λ = 1.5406 Å), the average crystallite size was calculated to be around 16.7 nm. This nanoscale size confirms the successful synthesis of ZnO in nanoparticulate form, which is crucial for enhancing the surface area and, potentially, the material’s functional properties.
The results from the XRD analysis thus confirm that the synthesized ZnO nanoparticles exhibit a pure, crystalline structure with a particle size in the nanometer range. Such characteristics are desirable for catalysis, sensors, and biomedical applications, where high crystallinity and purity can enhance material performance [47,48].

2.3.5. FTIR

The Fourier-transform infrared (FTIR) spectrum of the synthesized ZnO nanoparticles is presented in Table S11 and Figures S21–S23. A broad absorption band is observed around 3400 cm−1, which is attributed to the stretching vibrations of hydroxyl (O-H) groups. This band indicates the presence of hydroxyl groups on the surface of the nanoparticles, likely due to adsorbed water molecules or surface hydroxylation during synthesis. In addition, a peak near 1600 cm−1 is evident, corresponding to the bending vibrations of O-H bonds, further supporting the presence of adsorbed water. The Zn-O bond vibrations are clearly seen as sharp peaks between 500 and 600 cm−1, characteristic of the Zn-O stretching modes typical of ZnO structures. These distinct Zn-O bands confirm the formation of ZnO nanoparticles.
The FTIR spectrum indicates a relatively pure ZnO sample, as no significant peaks associated with organic contaminants are detected. The presence of hydroxyl groups on the surface could enhance nanoparticle stability and facilitate interactions in applications like catalysis or environmental remediation. Other minor peaks may indicate traces of organic residues from the synthesis process or atmospheric contaminants. However, the spectrum does not show significant peaks related to impurities, suggesting a relatively pure ZnO sample.
The FTIR spectrum of HD@ZnONPs and Cu-HD@ZnONPs showed broad bands at 3368 and 3435 cm−1 belonging to the stretching vibration of OH and NH2 groups. The bands at 3930 and 2929 cm−1 are due to aromatic C-H and those at 1627 and 1627 cm−1 can be assigned as bending vibrations of the NH2 group and the benzene ring or bending vibrations of O-H bonds. The FTIR spectrum showed bands at 1520 and 1524 cm−1 that may be related to the stretching vibration of the C=N group, and the bands at 630 and 650 cm−1 show the stretching vibrations of Zn-O bonds. In the main bands of ZnO with HD@ZnONPs and Cu-HD@ZnONPs, it is observed that all the bands of ZnO nanoparticles are present in the spectrum of two compounds with minor changes and the presence of new bands, such as imine band (–C=N) and CH-aromatic. Hence, the FTIR analysis confirmed the presence of HD and Cu-HD on the surface of the ZnO nanoparticles.

2.4. Computational Study

The biological availability of drug candidates can be assessed by computational modeling of their electron density and their hydrophilicity vs. lipophilicity. To better understand a biological process, docking studies calculate the interactions between target biomolecules, such as proteins, and potentially therapeutic compounds. These compounds’ electron density, frontier molecular orbitals, and surface characteristics were all determined via DFT calculations.
Utilizing the Swiss Target Prediction online tool may additionally forecast the compounds’ optimal target. The ligand and its complexes were predicted by the BOILED-Egg model to have a high or low extent of absorption by the GIT and to be permeable through the BBB. The mechanism of molecule adsorption and geometric optimization on the surface of nanoparticles was analyzed using a suitable program. Through a docking study, the end method examined the interactions between TMP, HD, and its complexes with the Caspase-3 enzyme.

2.4.1. Molecular Mechanical Method (MM2)

Molecular mechanics calculations using the MM2 force field were carried out and discussed for TMP and TMP analogs. The minimum energetic structure was chosen as the target compound’s best structure. The results are described in Tables S12 and S13 and Figures S24–S26.
We selected the single bond between C9 and C10 to improve free rotation. Based on the lowest steric energy, the stability order is as follows: TMPe > TMPc > TMPa > TMPb > TMPd. This indicates that the TMPe conformation is the most stable and, therefore, the most abundant, while TMPd is the least stable. For HD, the stability order is HDc > HDe > HDa > HDb > HDd, with HDc being the most stable and abundant form and HDd the least. The total energies from MM2 calculations for TMP and HD were 27.30 and 30.77 kcal/mol, respectively, which indicated the order of stability (and which gave the lowest steric energy), so the TMP was more stable than HD.

2.4.2. The Surface Properties of HD

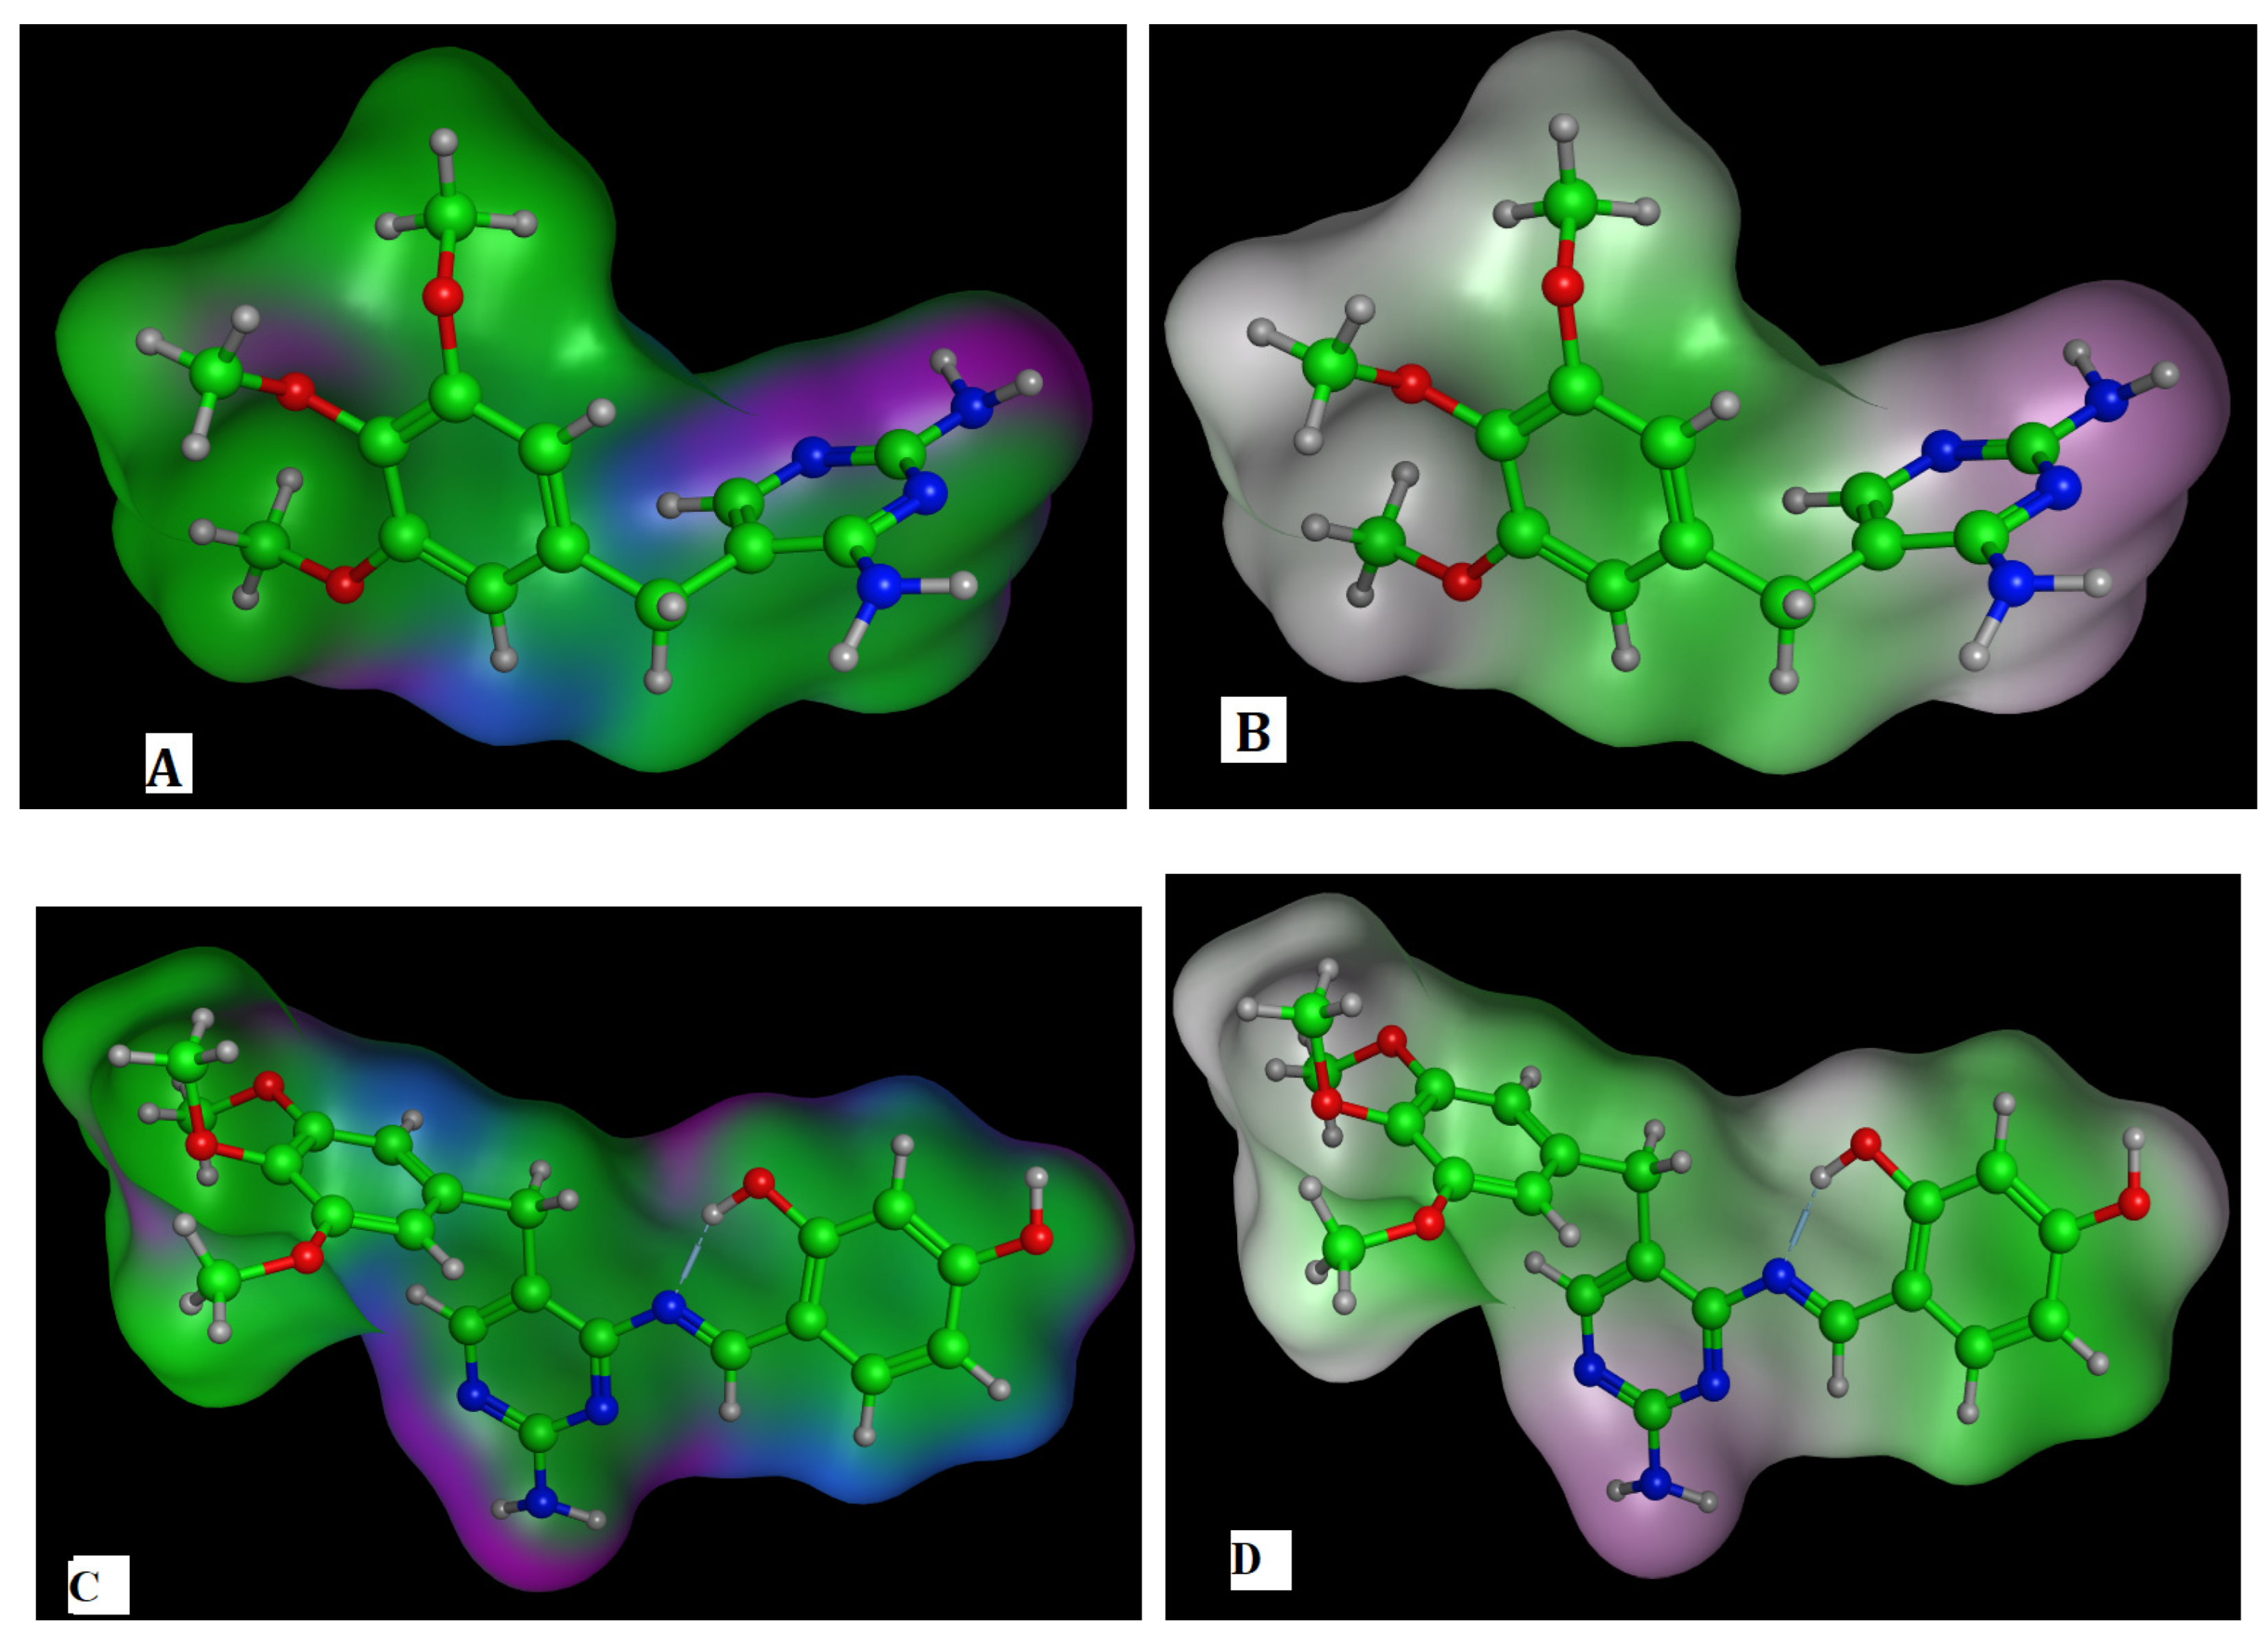
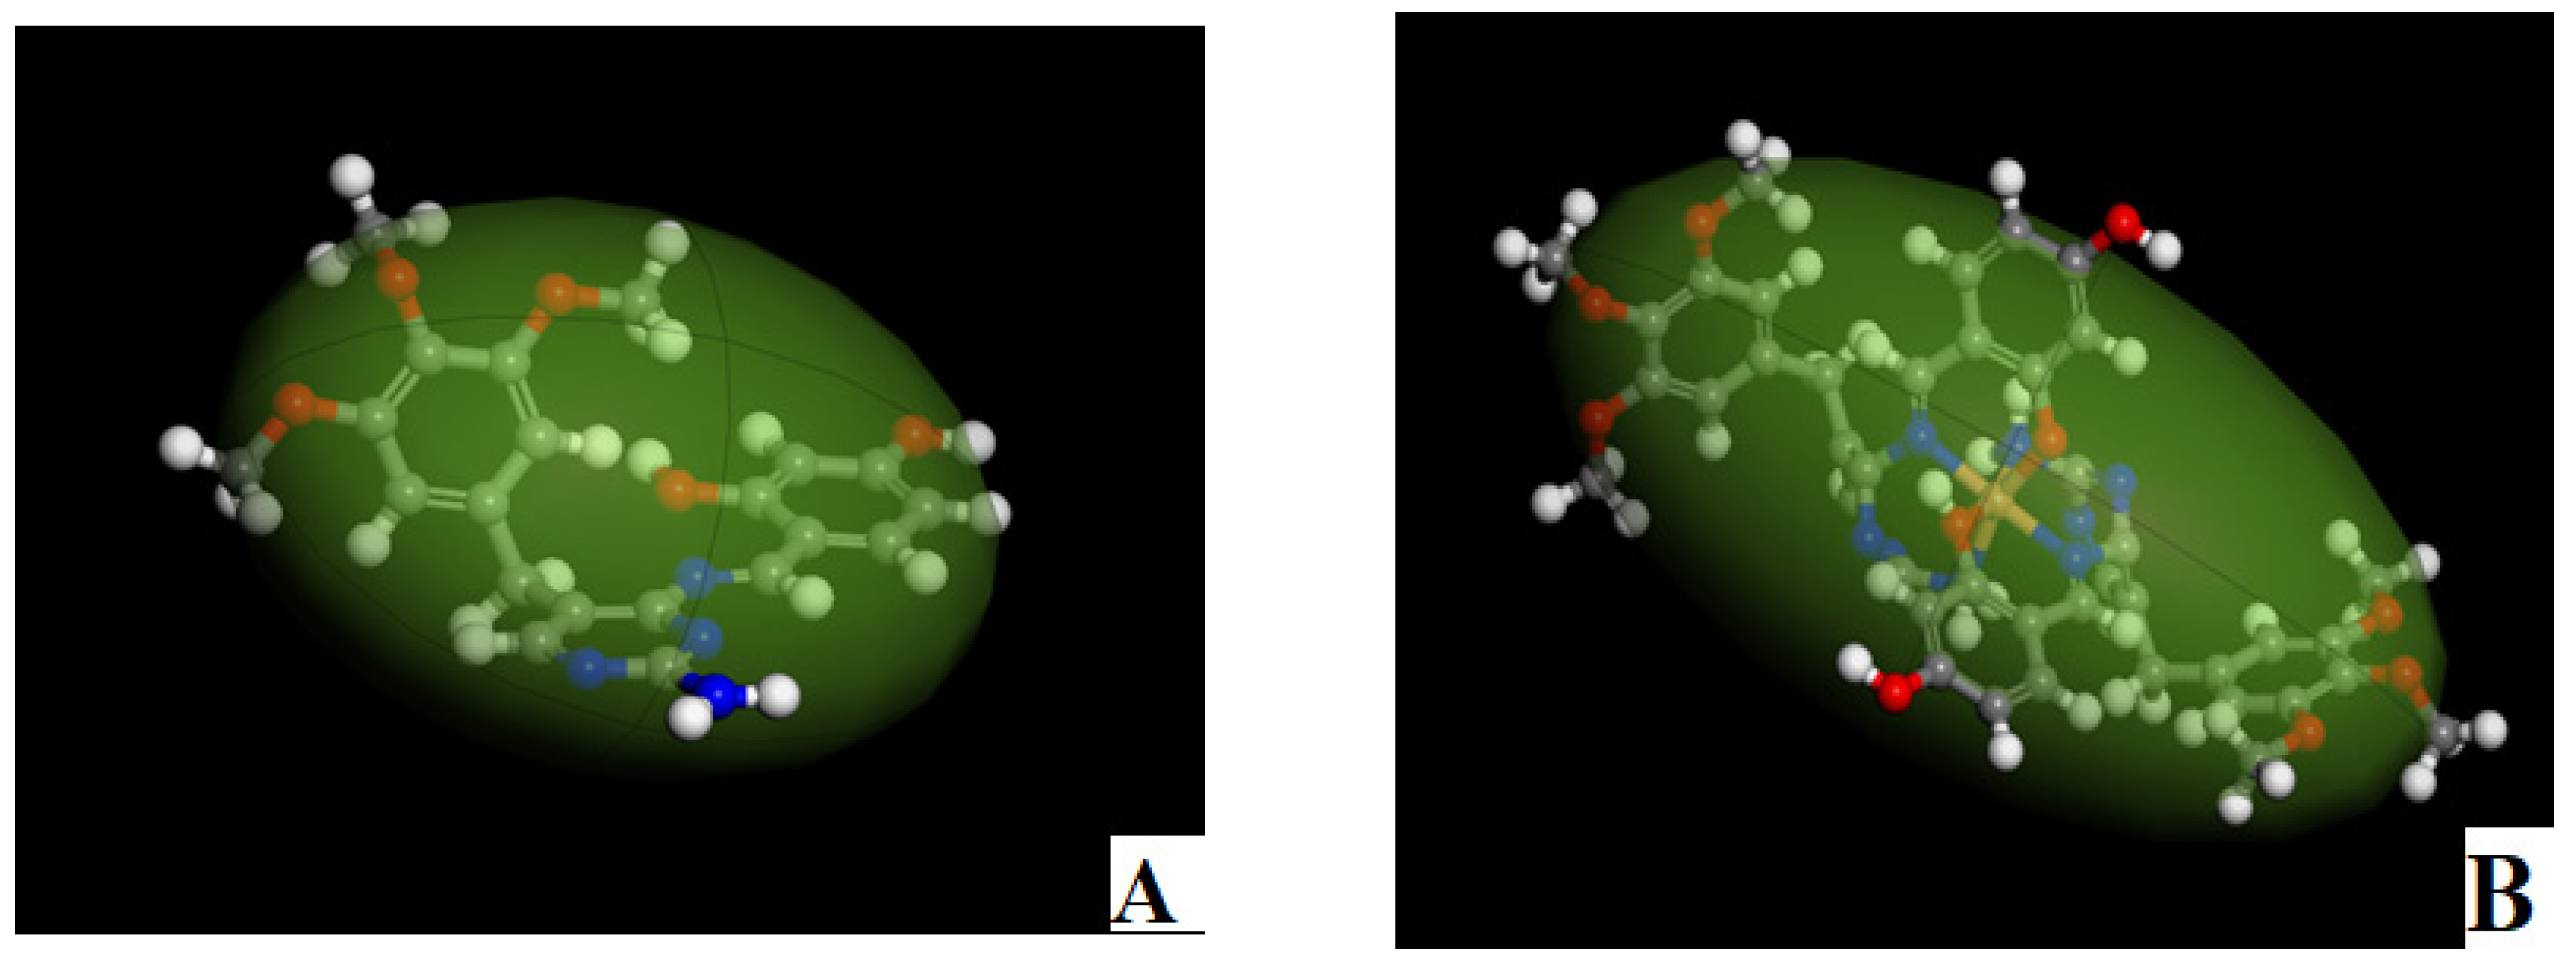
The surface properties of HD are key in determining its effectiveness as a drug. HD’s bioactivity highlights the presence of an active lone pair and lipophilic characteristics. The active lone pair map has three colors: blue for mild polarity, green for hydrophobicity, and violet for H-bonding. HD’s ability to form hydrogen bonds focuses on three specific sites. The lipophilic map also uses green for lipophilicity, white for neutrality, and violet for hydrophilicity. Figure 10 displays the surface properties of both TMP and HD [49].

2.4.3. The DFT for TMP and HD

Density Functional Theory (DFT) calculations for TMP and HD are presented in Figures S27–S29 and Table S14. The highest occupied molecular orbital (HOMO) and lowest unoccupied molecular orbital (LUMO) of each molecule, together known as the frontier molecular orbitals (FMOs), provide insights into the movement of electrons between FMOs, which is crucial for understanding the excitation-relaxation process. The significant contrast between occupied and unoccupied orbitals suggests that low energy is required for electron transition. TMP and HD show polarities of 1.29 and 1.36 D, respectively, which impacts drug behavior. The high number of orbitals and electrons suggests ample receptor interaction points, enhancing HD’s potential as a drug [50,51].
Density functional theory helped analyze the hardness and softness, showing that:
  • Changes between ground states outline local, non-local, and global hardness/softness functions.
  • Soft-soft and hard-hard interactions are favored, with interactions progressing toward maximum hardness under chemical potential.
  • These principles aid in understanding molecular behavior and response to different chemicals [52].

2.4.4. Target-Ligand Interaction Prediction

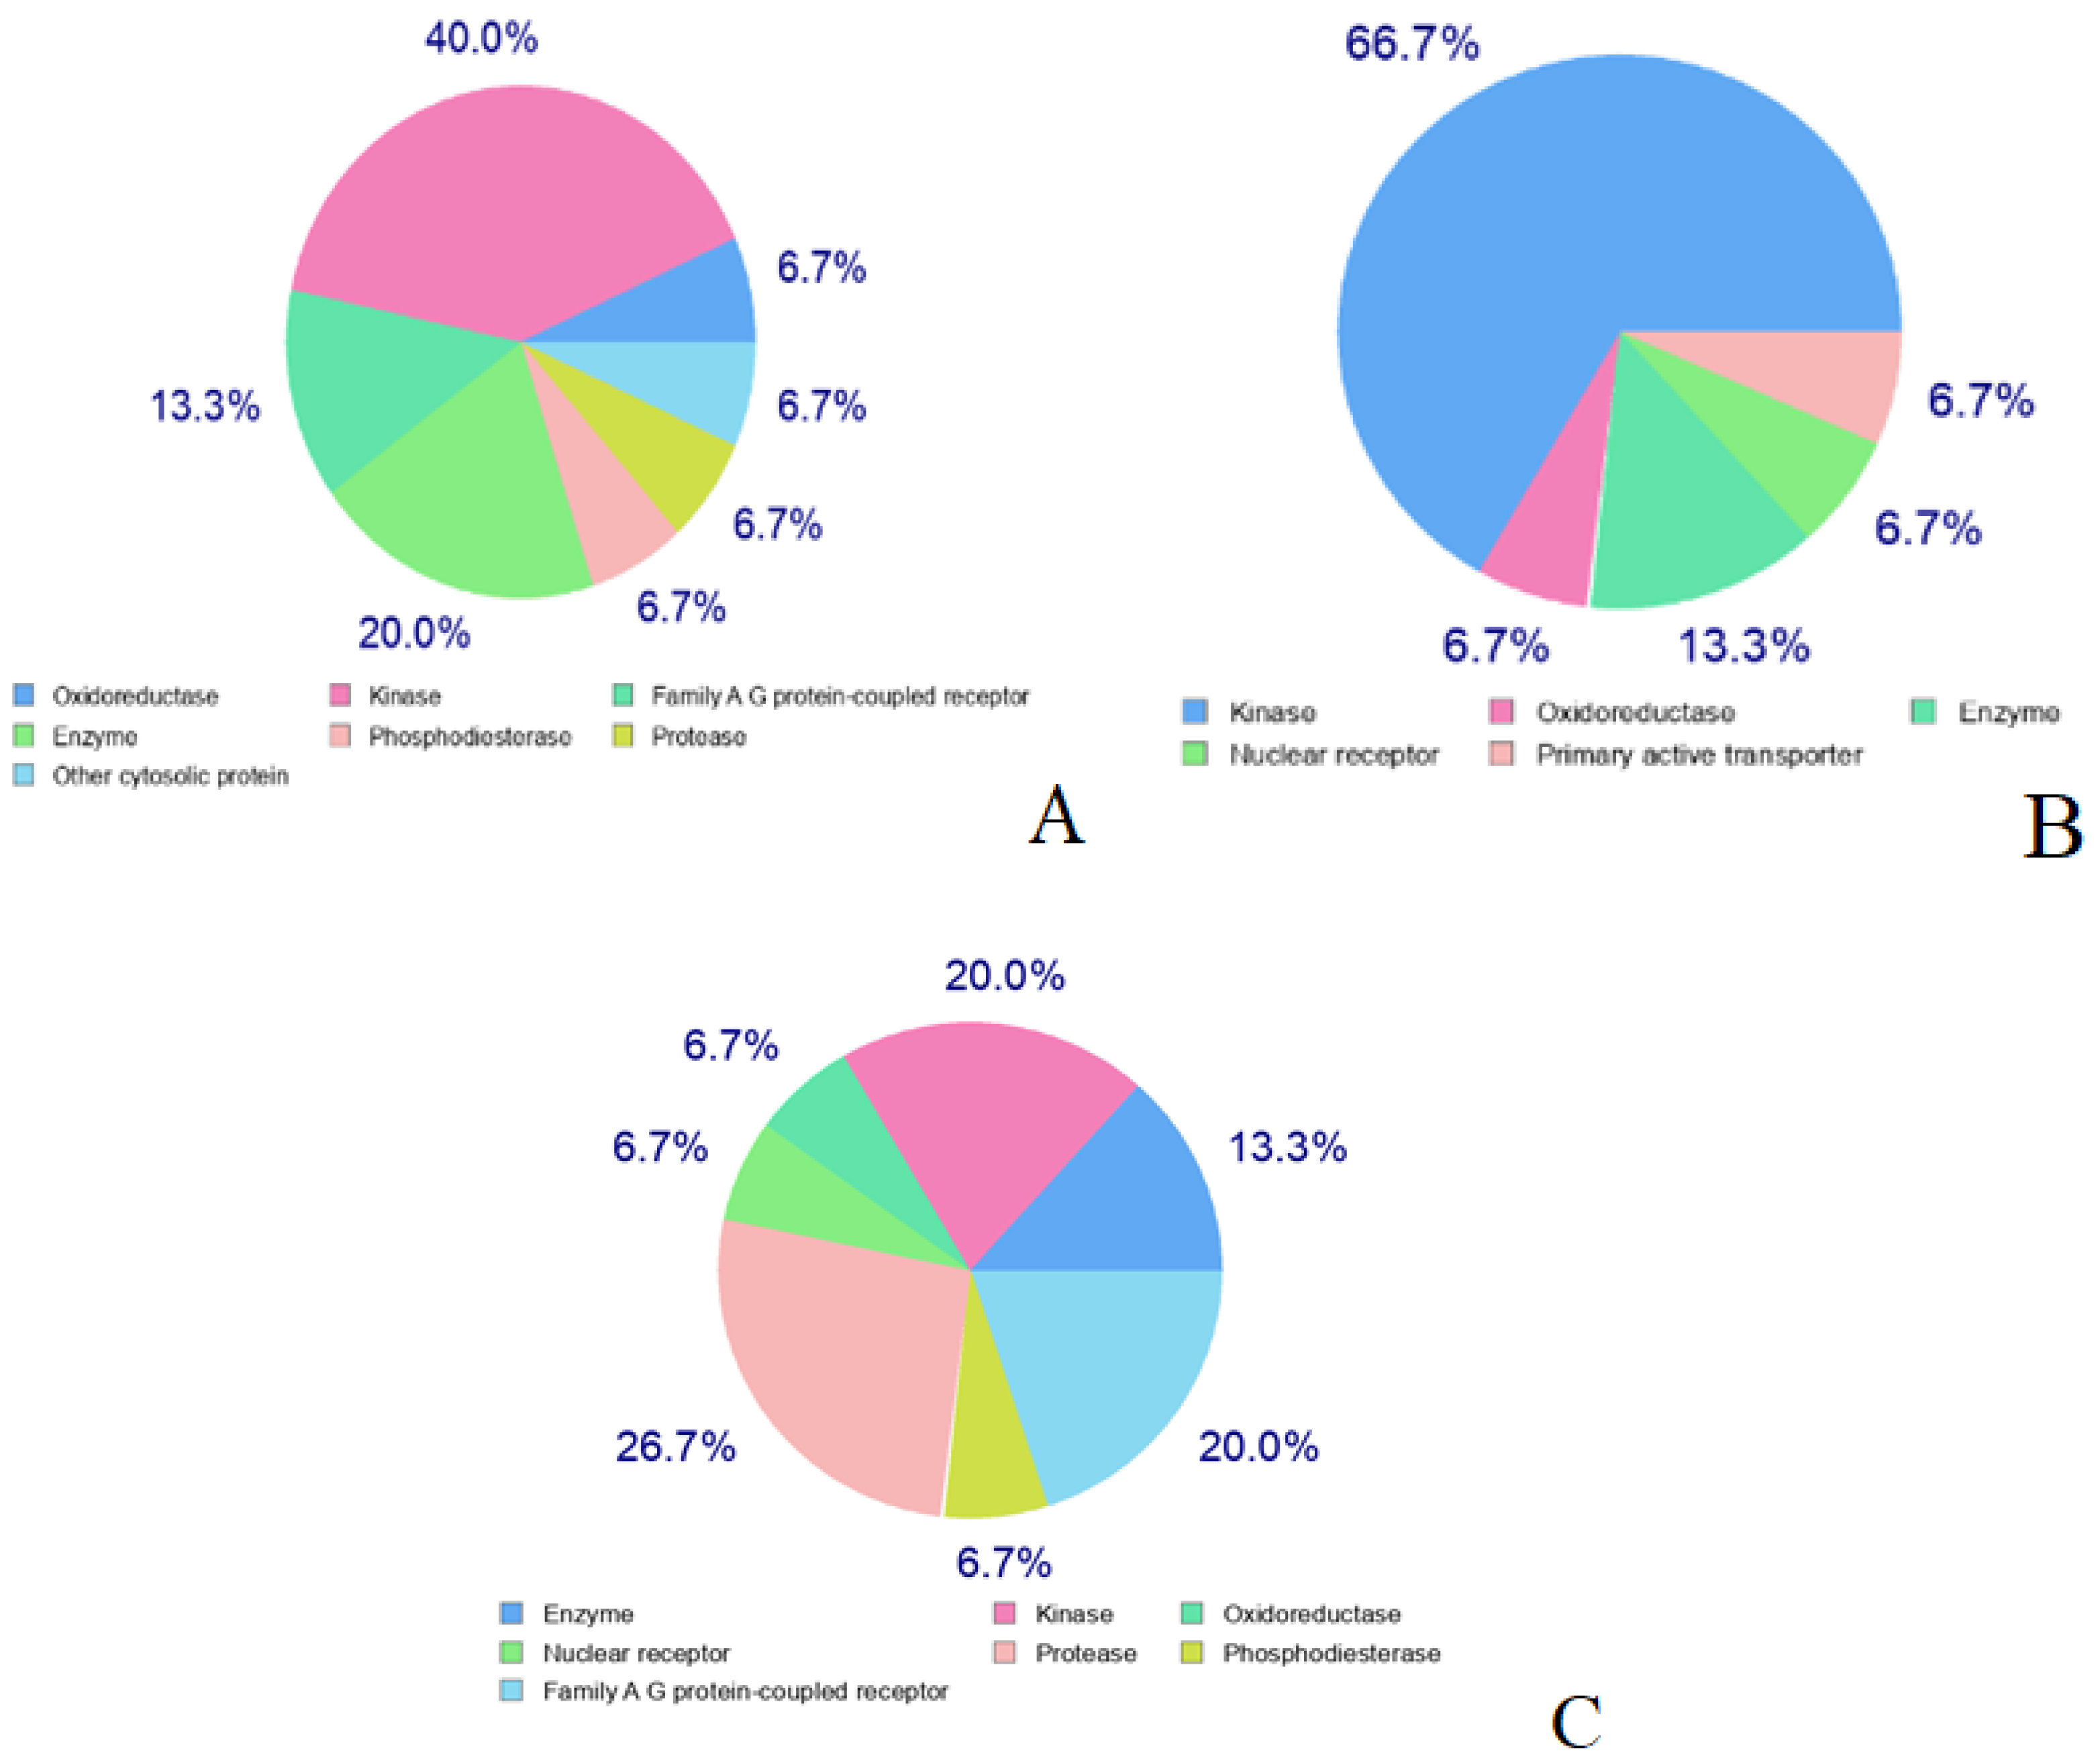
We determined the likely targets for TMP and HD using the Swiss Target Prediction tool. For TMP, predictions show a 40% chance of interaction with kinase receptors, 20% with enzymes, and 13.3% with family A G protein-coupled receptors, among others. HD has a 66.7% probability of binding to kinase receptors and a 13.3% probability with enzymes. The Zn-HD complex exhibited the highest affinity for protease and family A G protein-coupled receptors, indicating stronger inhibitory action than TMP (Figure 11 and Figures S30–S33 and Table S15).

2.4.5. Biological Availability Estimation

Various factors such as bioactivity, transport, and reactivity affect molecule behavior in organisms. Using SwissADME, we evaluated TMP, HD, and their complexes for their physicochemical properties. The XLogP3 method [53] helped predict characteristics like heavy atom count, H-bond donors/acceptors, and topological polar surface area (TPSA) (Table S16).
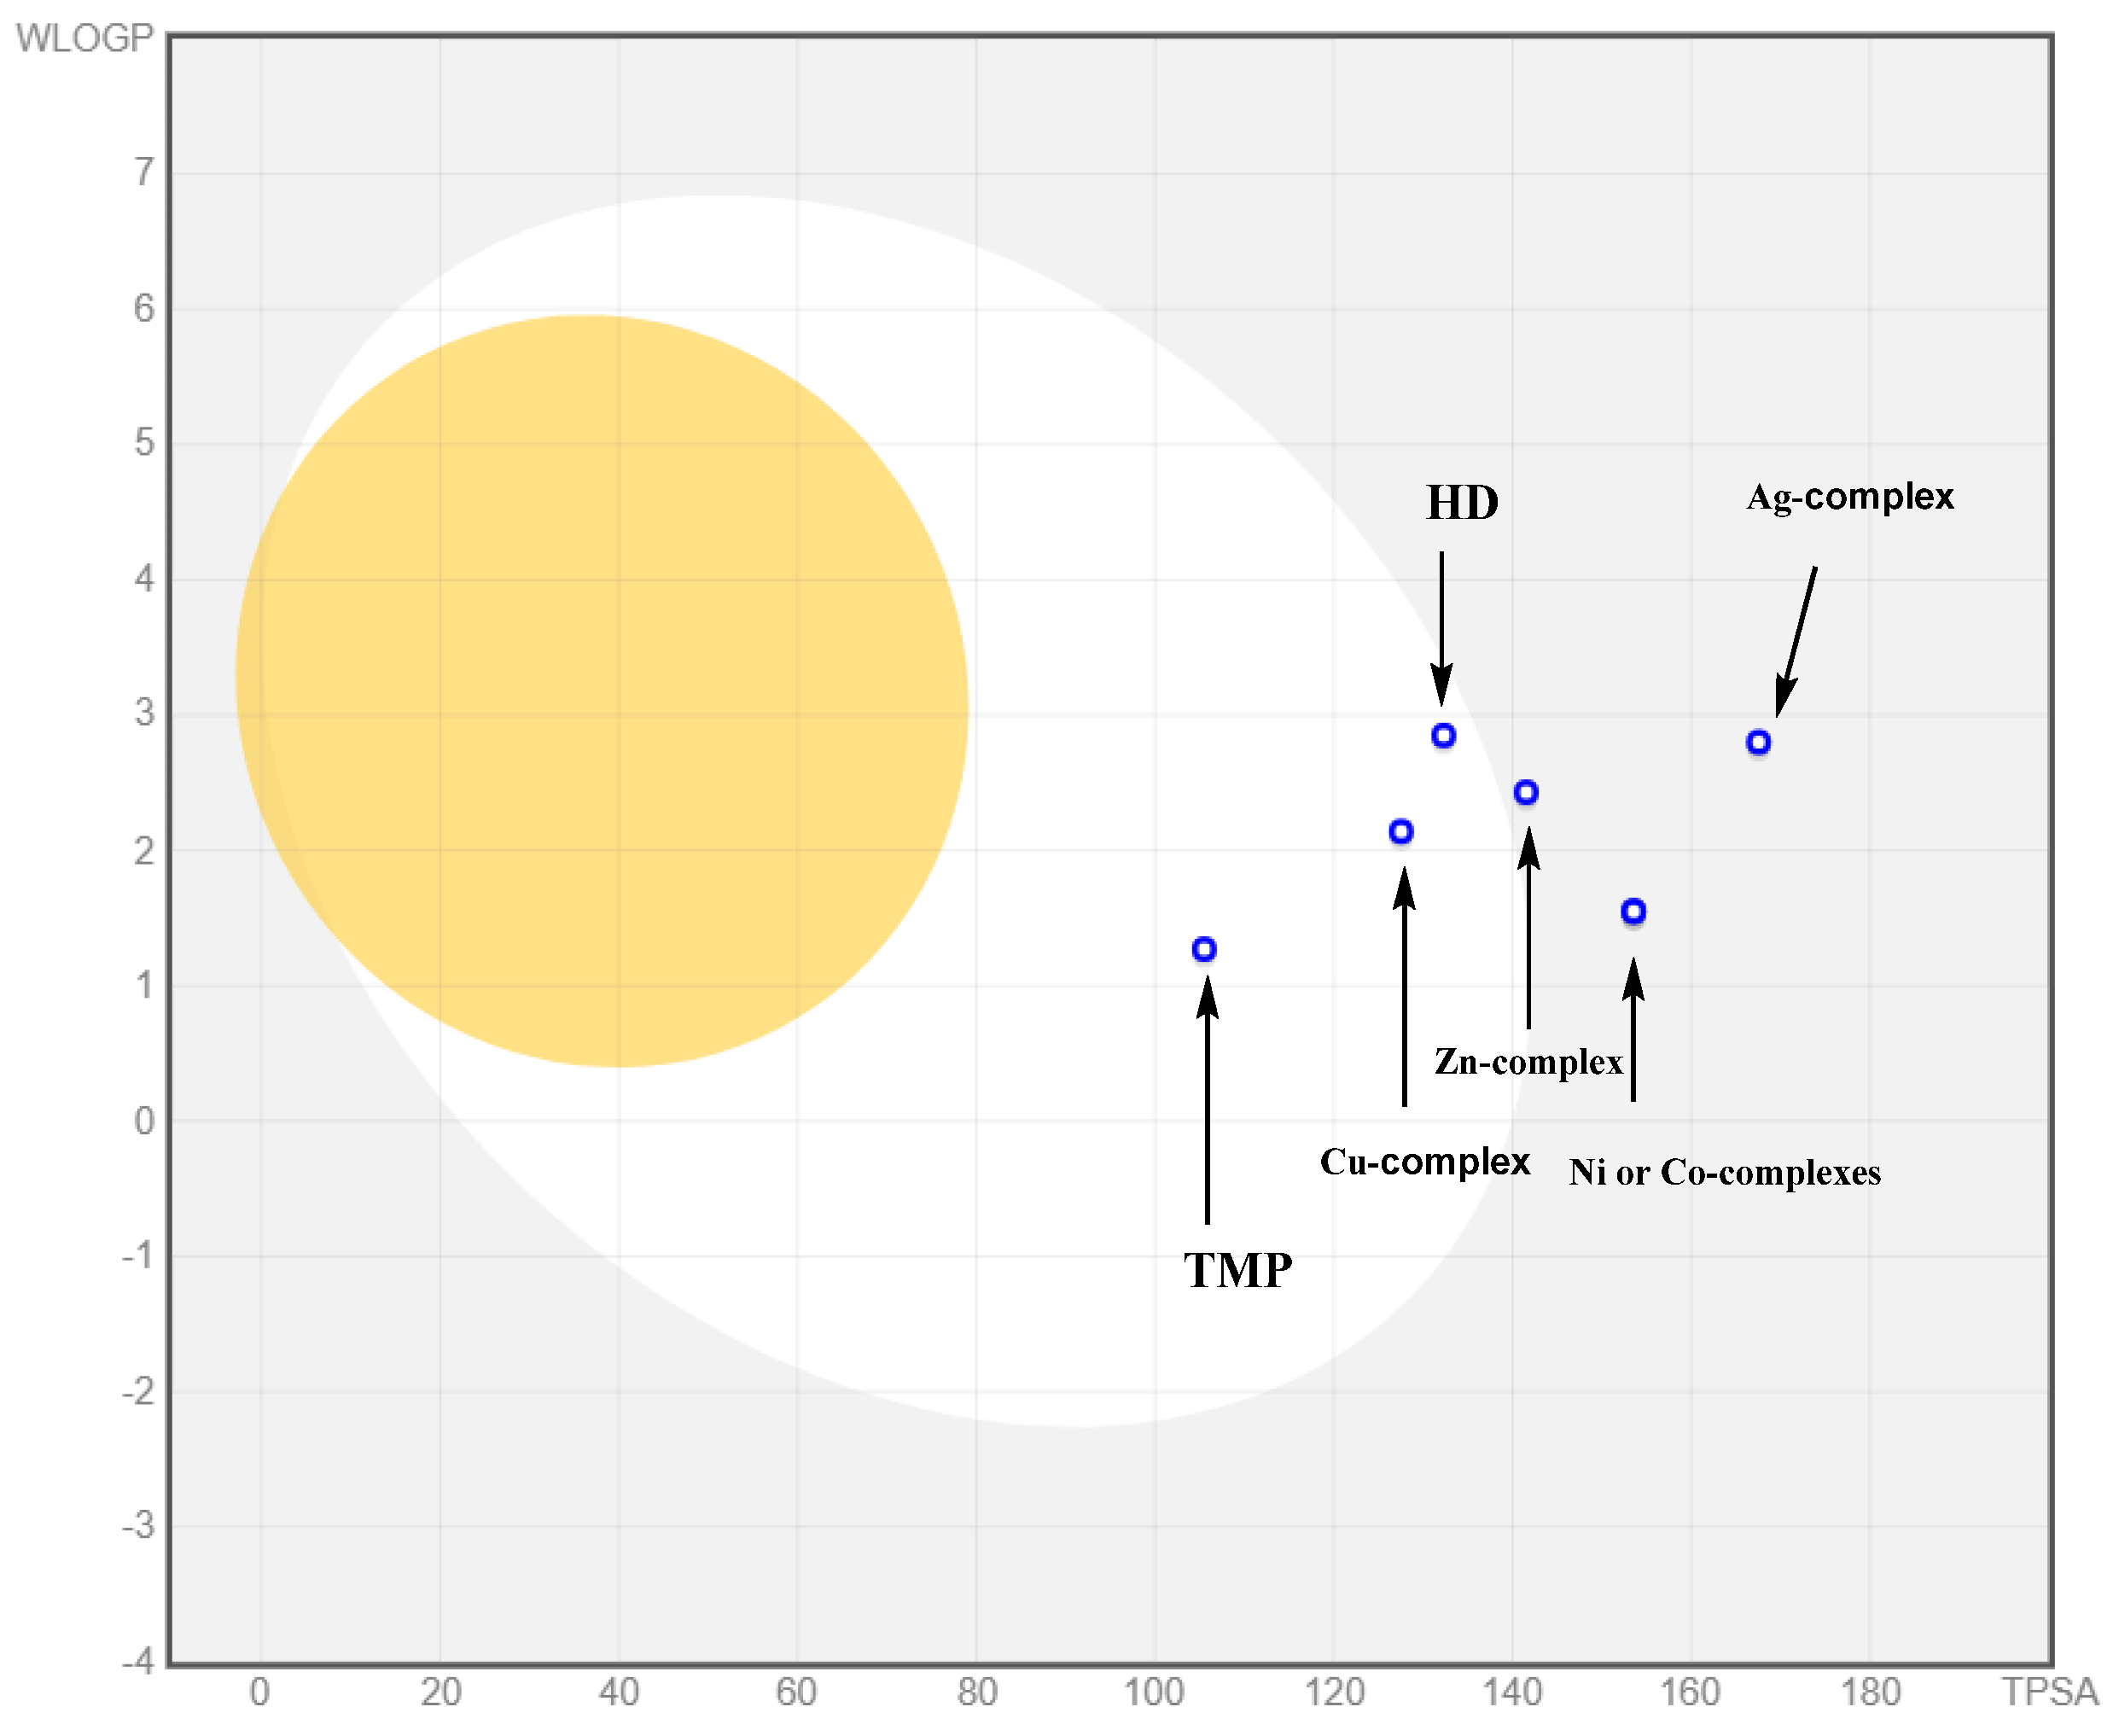
We used the BOILED-Egg model to predict gastrointestinal (GI) absorption and blood-brain barrier (BBB) penetration. In this model, yellow zones suggest BBB permeation, while white zones indicate GI absorption. The BOILED-Egg model suggests that while TMP and Cu-HD have high GI permeability, the Ni, Co, Ag, and Zn complexes show low GI absorption rates (Figure 12). All compounds showed low BBB permeability.
According to Veber’s rule, compounds with a polar surface area under 140 Å2 and fewer than 10 rotatable bonds are likely to have good bioavailability. Compounds without rule violations, shown in Table S16, are deemed suitable for bioactivity studies [54,55,56,57].

2.4.6. Pharmacokinetic Properties

Using the pkCSM platform, all new compounds are predicted to act as P-glycoprotein substrates, as illustrated in Table 2 [58].

2.4.7. Quantitative Structure-Activity Relationship (QSAR)

QSAR is a valuable computational method examining the connection between a molecule’s structure and biological activity. This analysis aims to establish a mathematical relationship between biological action and various structural descriptors [59].

D-QSAR Model

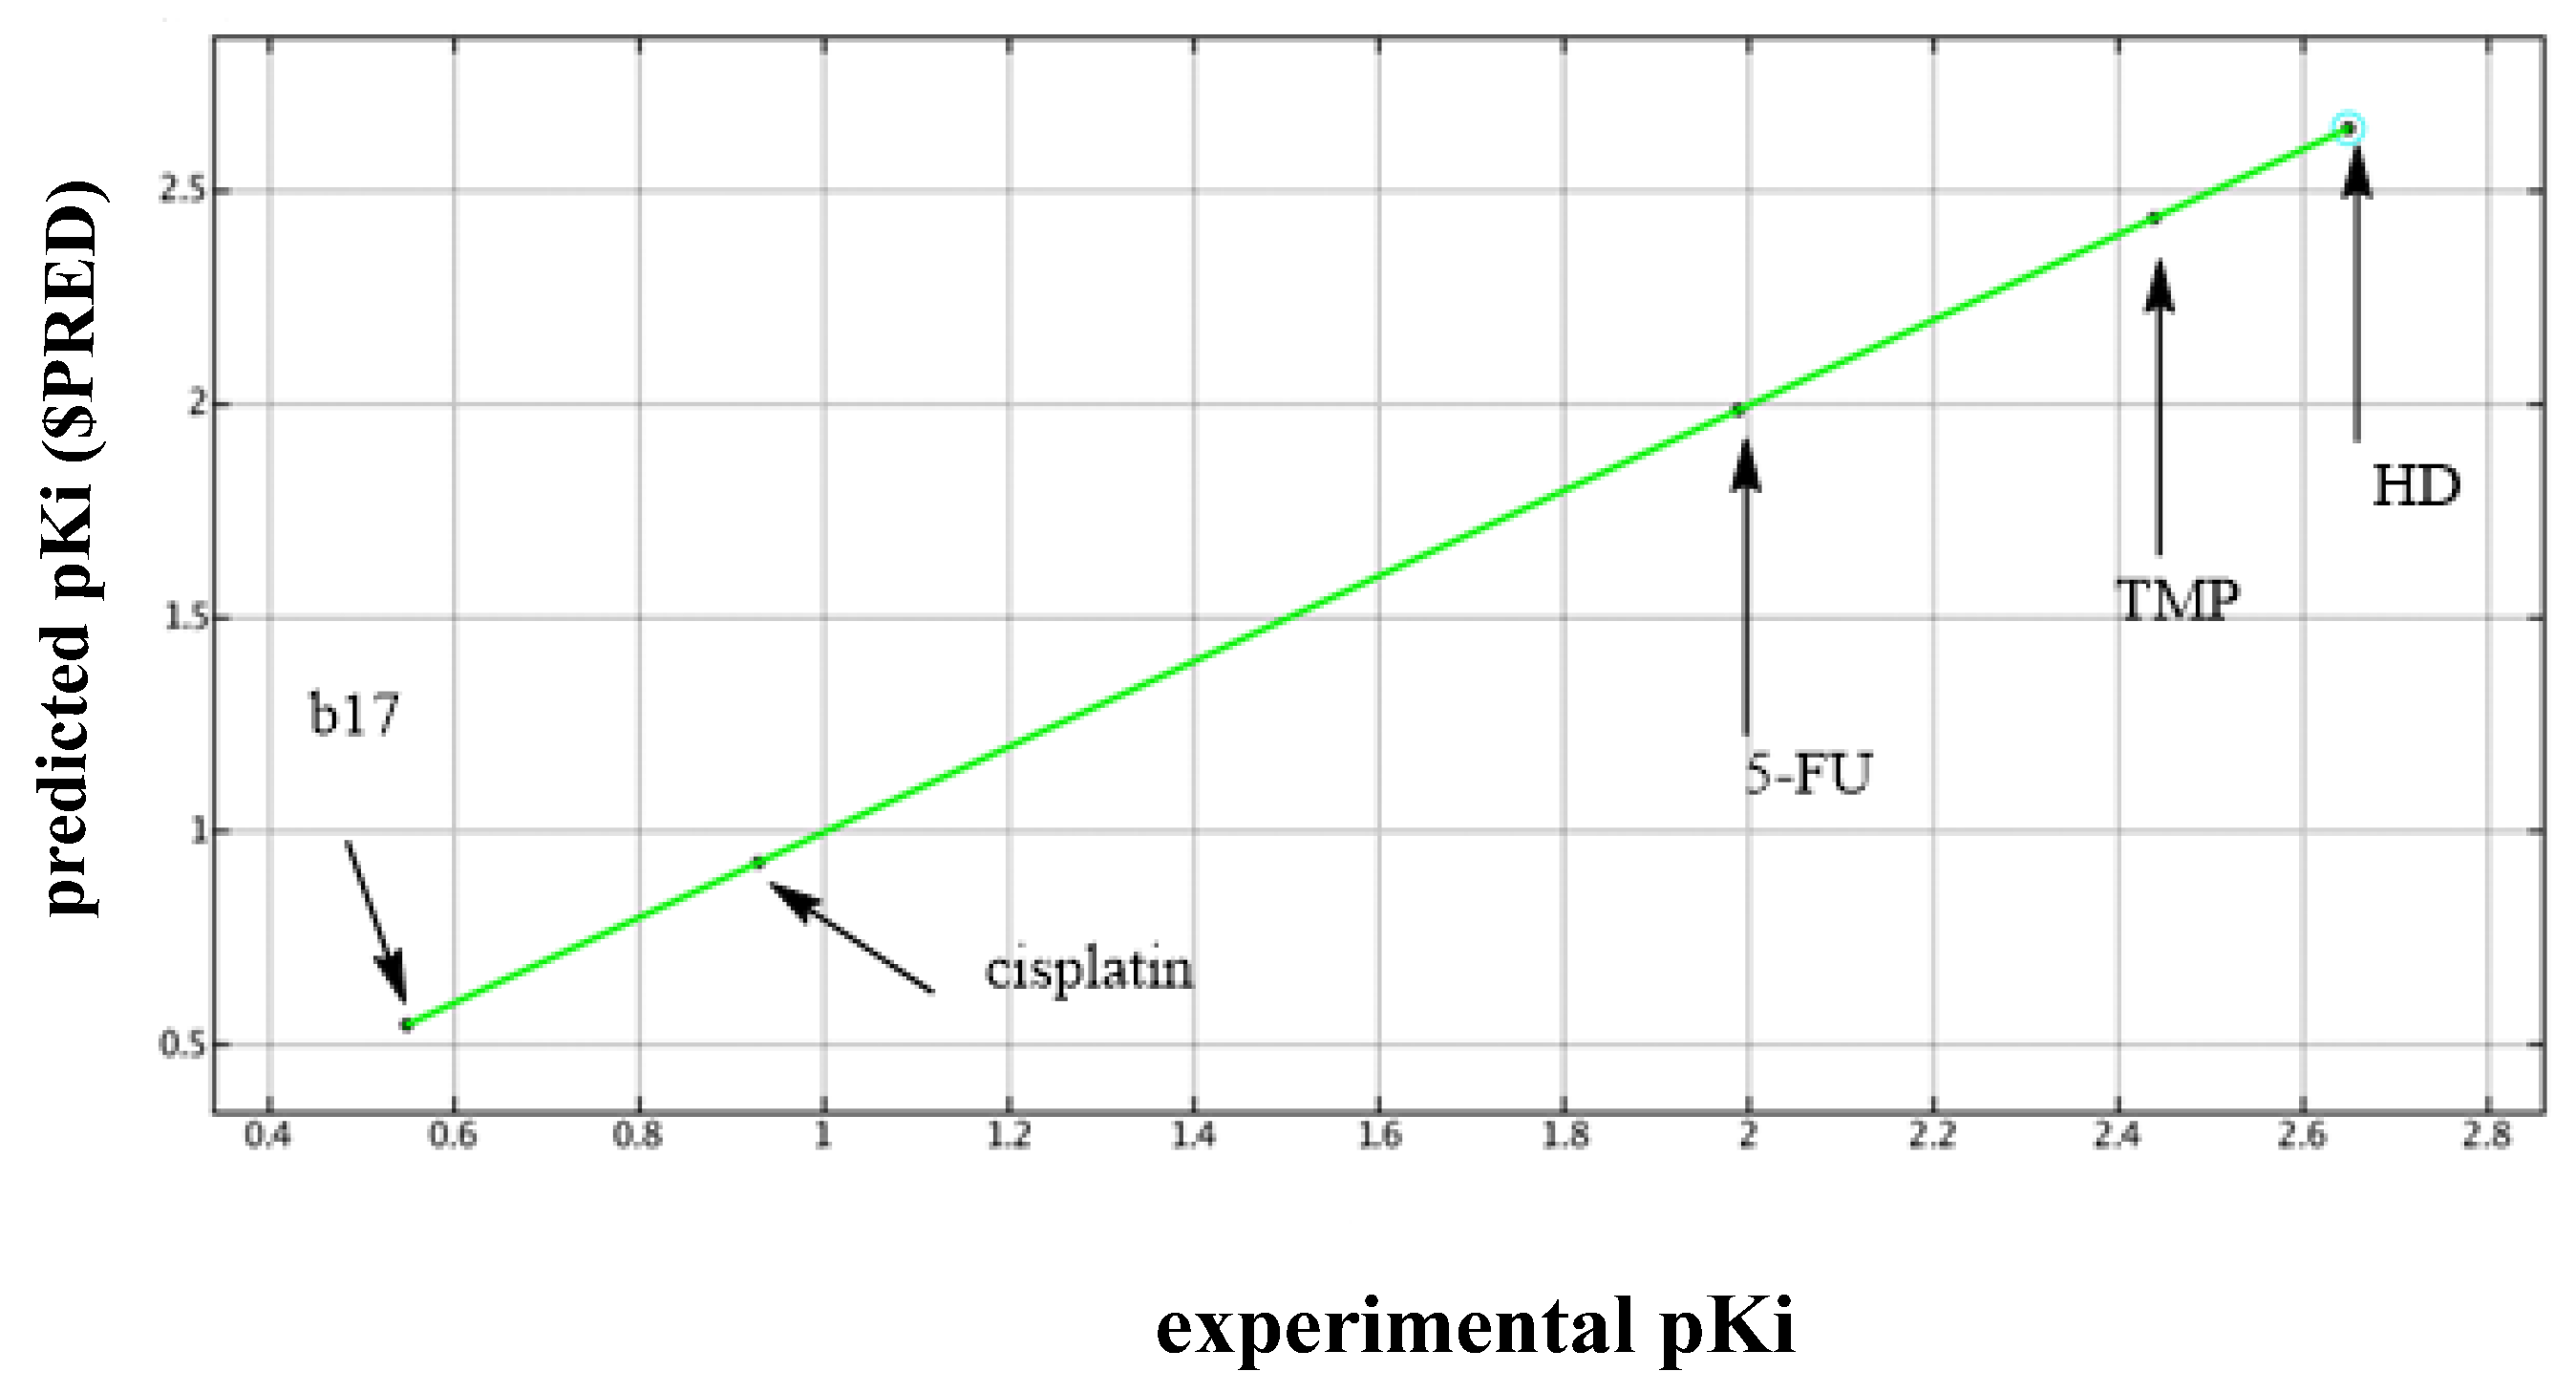
We used the MarvinBeans/JChem (ChemAxon) 24.1.3 software to build the ligand structures [60]. Plug-ins facilitated calculations of parameters such as inhibitory constant (pKi), which indicate the biologic binding affinity; hydrogen bond donors and acceptors, which affect solubility and molecular interactions; rotatable bonds, which determine molecular flexibility and binding efficiency; and topological polar surface area (TPSA), which influences drug absorption and transport across membranes. Lipophilicity, represented by Log P and Log D, impacts membrane permeability and solubility, while dipole moment and molar refractivity (SMR) provide information on molecular polarity and electronic properties that affect binding affinity and reactivity [61,62]. An initial 3D-QSAR model was applied to TMP derivatives and specific anticancer inhibitors against HepG-2 cells to enhance predictive accuracy and inhibitor enrichment (Table S17). HD has the highest hydrogen bonding (11) and rotatable bonds (7), enhancing solubility but potentially restricting membrane permeability. Its TPSA (212 Å2) suggests moderate permeability, while Log P (1.88) and Log D (1.72) indicate a well-balanced hydrophilic-lipophilic profile. Compared to b17 (Log P = 5.35), HD is more hydrophilic but exhibits strong molecular refractivity (SMR = 11.24), which may enhance interactions with biological targets. Overall, HD’s properties support aqueous solubility but could limit passive diffusion across membranes. The regression analysis (R2 = 0.89, p < 0.05) showed that lipophilicity and TPSA were the most influential factors in determining anticancer activity, followed by steric and electronic properties.
The model included comparisons with 5-fluorouracil (IC50 = 99.32 µM, pKi = 1.99), (b17, IC50 = 3.57 µM, pKi = 0.55) [63,64] and cisplatin (IC50 = 8.45 µM, pKi = 0.93) [65], common chemotherapeutic agents. MTT assays showed TMP had an IC50 of 277.96 µM and pKi of 2.44, while HD had an IC50 of 279.46 µM and pKi of 2.65, suggesting a close correlation between TMP, TMP derivative, and anticancer inhibitors and between predicted and experimental activities (Figure 13 and Figure S34 and Table S17).

Principal Component Analysis (PCA)

PCA is a statistical approach used to reduce data dimensions by identifying key components as linear combinations of variables. While the revised QSAR model involves 12 descriptors, three-dimensional plots cannot display them all simultaneously. PCA uses the three most significant descriptors to represent the data in 3D Euclidean space, minimizing accuracy loss. PCA reduced the dimensionality by linearly transforming molecular descriptor data [66,67].
Figure 14 and Figure S35 illustrate a 3D plot of three main components: the first principal component (PCA1) accounted for 55% of the variance and was primarily associated with lipophilicity and molecular weight. The second principal component (PCA2), explaining 30% of the variance, correlated with electronic charge distribution and dipole moment, crucial for metal-ligand interactions. The third principal component (PCA3), which accounted for the remaining 15% variance, was primarily influenced by the number of rotatable bonds and steric hindrance factors, which impact molecular flexibility and receptor binding affinity.
In Figure 14, TMP, HD, and b17 are clustered closely together, indicating that these compounds share similar physicochemical characteristics, whereas 5-FU and cisplatin were more distantly positioned, reflecting their distinct steric and electronic properties. The unique placement of cisplatin suggests an alternative interaction mechanism compared to the tested compounds. The strong alignment between QSAR predictions and PCA clustering validates the influence of molecular descriptors on cytotoxic potential, reinforcing the potential of the TMP derivative as a promising anticancer agent.

2.4.8. Prediction of Mechanical Properties of Nanoparticles

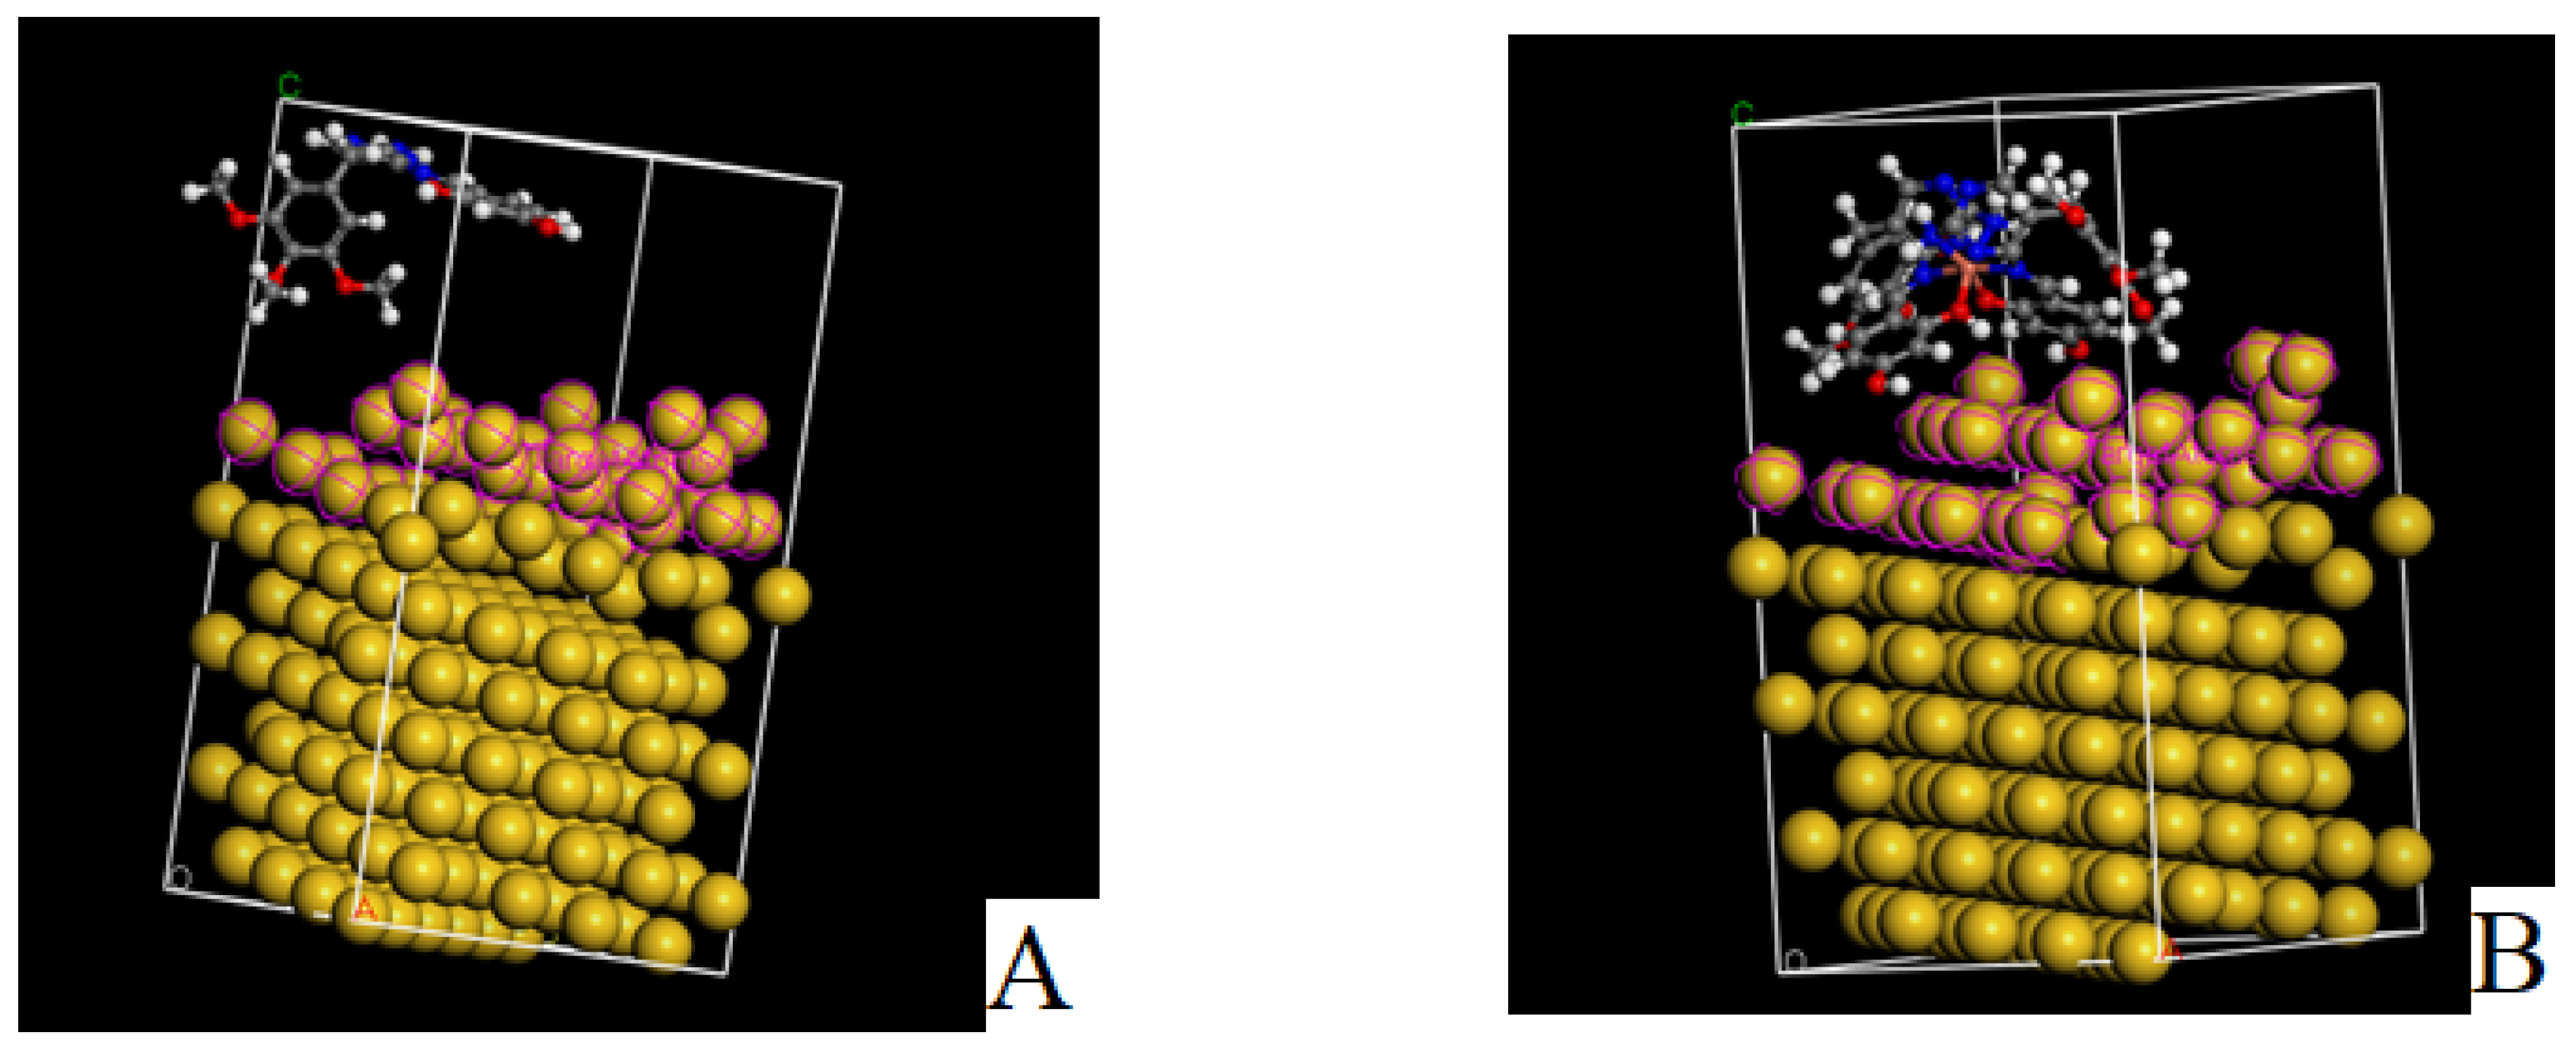
In this study, the mechanical properties of nanoparticles were predicted using Material Studio V.2020 [68], in which nanoparticle crystal models were optimized through the Smart algorithm and Forcite module. This approach enabled the analysis of molecular interactions with nanoparticle surfaces, providing key insights into the adsorption mechanisms and geometry optimizations of molecules on these surfaces [69,70]. Following dynamic simulations, energy minimization and shape optimization were achieved. The computational conditions for Forcite Dynamics are detailed in Tables S18 and S19 and Figure 15, Figure 16, Figure 17 and Figure S36. This methodology offers valuable improvements for understanding the adsorption behavior of HD and Cu-HD molecules on the surfaces of ZnO and Au nanoparticles.
Adsorption studies revealed that HD and Cu-HD interactions with ZnO and Au nanoparticles resulted in significantly higher total energy values (13.85, 138.05, 15.43, and 140.33 kcal/mol for HD@AuNPs, Cu-HD@AuNPs, HD@ZnONPs, and Cu-HD@ZnONPs, respectively) compared to the isolated ZnONPs and AuNPs (−4.33 and −15.32 kcal/mol). HD@AuNPs and HD@ZnONPs, with lower energy values, are more stable, while Cu-HD@AuNPs and Cu-HD@ZnONPs, with higher energy values, are less stable. These findings underscore the strong adsorption potential of the molecules and highlight the critical role of surface area in the adsorption process [71]. The increased surface area of ZnONPs and AuNPs and their strong ionic interactions contributed to their enhanced adsorption capacity.
The binding energy is essential for applications that need stable adsorbate-surface interactions, such as catalysis or sensing, as outlined in Table S19 [72,73]. The binding energy of a molecule to a surface reflects its adsorption strength. The stability of the adsorption systems is determined by their binding energy, with lower or negative values (exothermic reaction) indicating stronger binding and higher stability. For AuNPs, HD@AuNPs (3.66 kcal/mol) and Cu-HD@AuNPs (1.01 kcal/mol) have positive binding energies, reflecting weaker interactions and lower stability, though Cu-HD@AuNPs is slightly more stable. For ZnONPs, HD@ZnONPs (−0.71 kcal/mol) and Cu-HD@ZnONPs (−0.42 kcal/mol) have negative binding energies, showing stronger interactions and greater stability. Among these, HD@ZnONPs is the most stable due to its lower (more negative) binding energy. All compounds exhibited adsorption on both ZnO and Au nanoparticle surfaces, indicating their potential effectiveness in cancer diagnosis and targeted drug delivery applications. However, the deep interaction observed in the HD@ZnONPs complex suggests it may not be as suitable for drug delivery [18,19].

2.4.9. Molecular Docking

In addition to making connections between the theoretical and experimental approaches, docking simulations were used to study how the target compounds interacted with certain proteins. The crystal structure of Caspase-3 (PDB code: 3GJQ) (Figure S37) was obtained from the RCSB Protein Data Bank [74].

Docking of 5-Fluorouracil and Trimethoprim with Caspase-3 (PDB Code: 3GJQ)

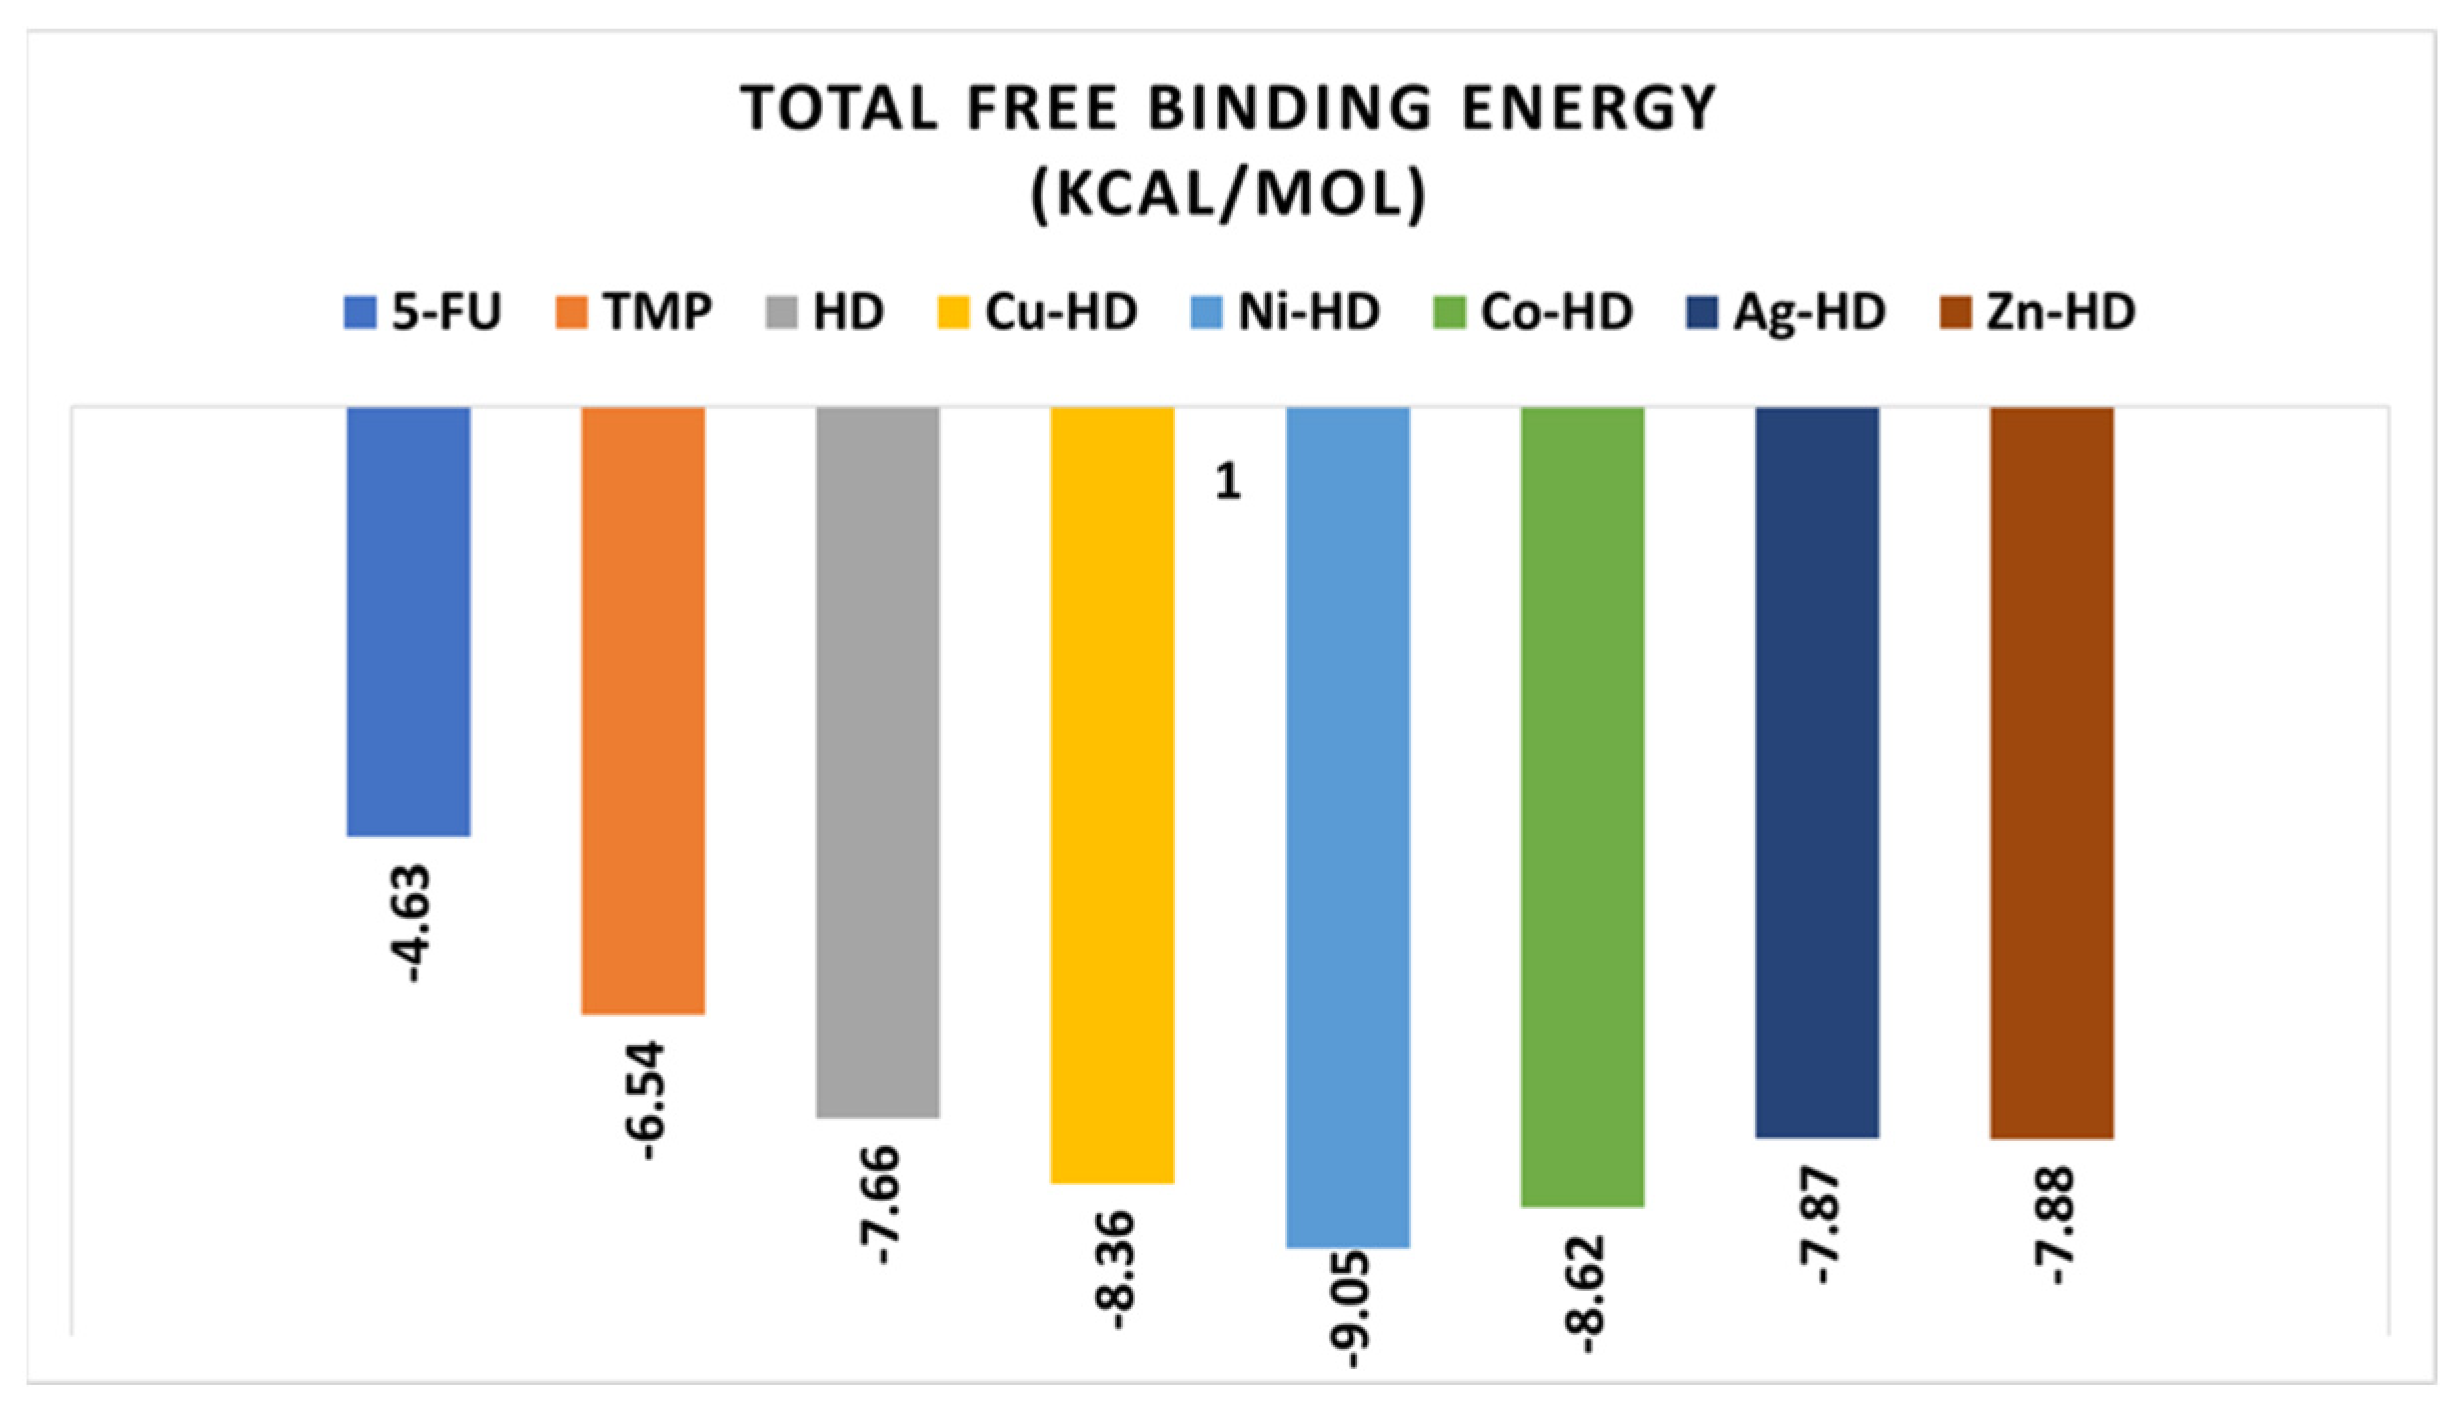
Given the known anticancer properties of 5-fluorouracil (5-FU), its docking with Caspase-3 was performed alongside TMP and its derivatives for comparative purposes (Table S20 and Figure S38). The docking results revealed that 5-FU interacted strongly with the target protein through two hydrogen bonds: one between oxygen (O3) and nitrogen (N4) with arginine (Arg) A64 and serine (Ser) A120 residues of Caspase-3. The binding energy of 5-FU was calculated to be −4.63 kcal/mol.
In contrast, the docking of TMP showed a single hydrogen bond between nitrogen (N7) and Arg A64, along with a hydrophobic interaction between TMP’s 6-membered ring and Arg A64. TMP exhibited a stronger binding energy of −6.54 kcal/mol compared to 5-FU (−4.63 kcal/mol). This suggests that TMP interacts more favorably with Caspase-3, potentially offering a better inhibitory effect than 5-FU.

Docking of HD and Its Complexes with Caspase-3 (PDB Code: 3GJQ)

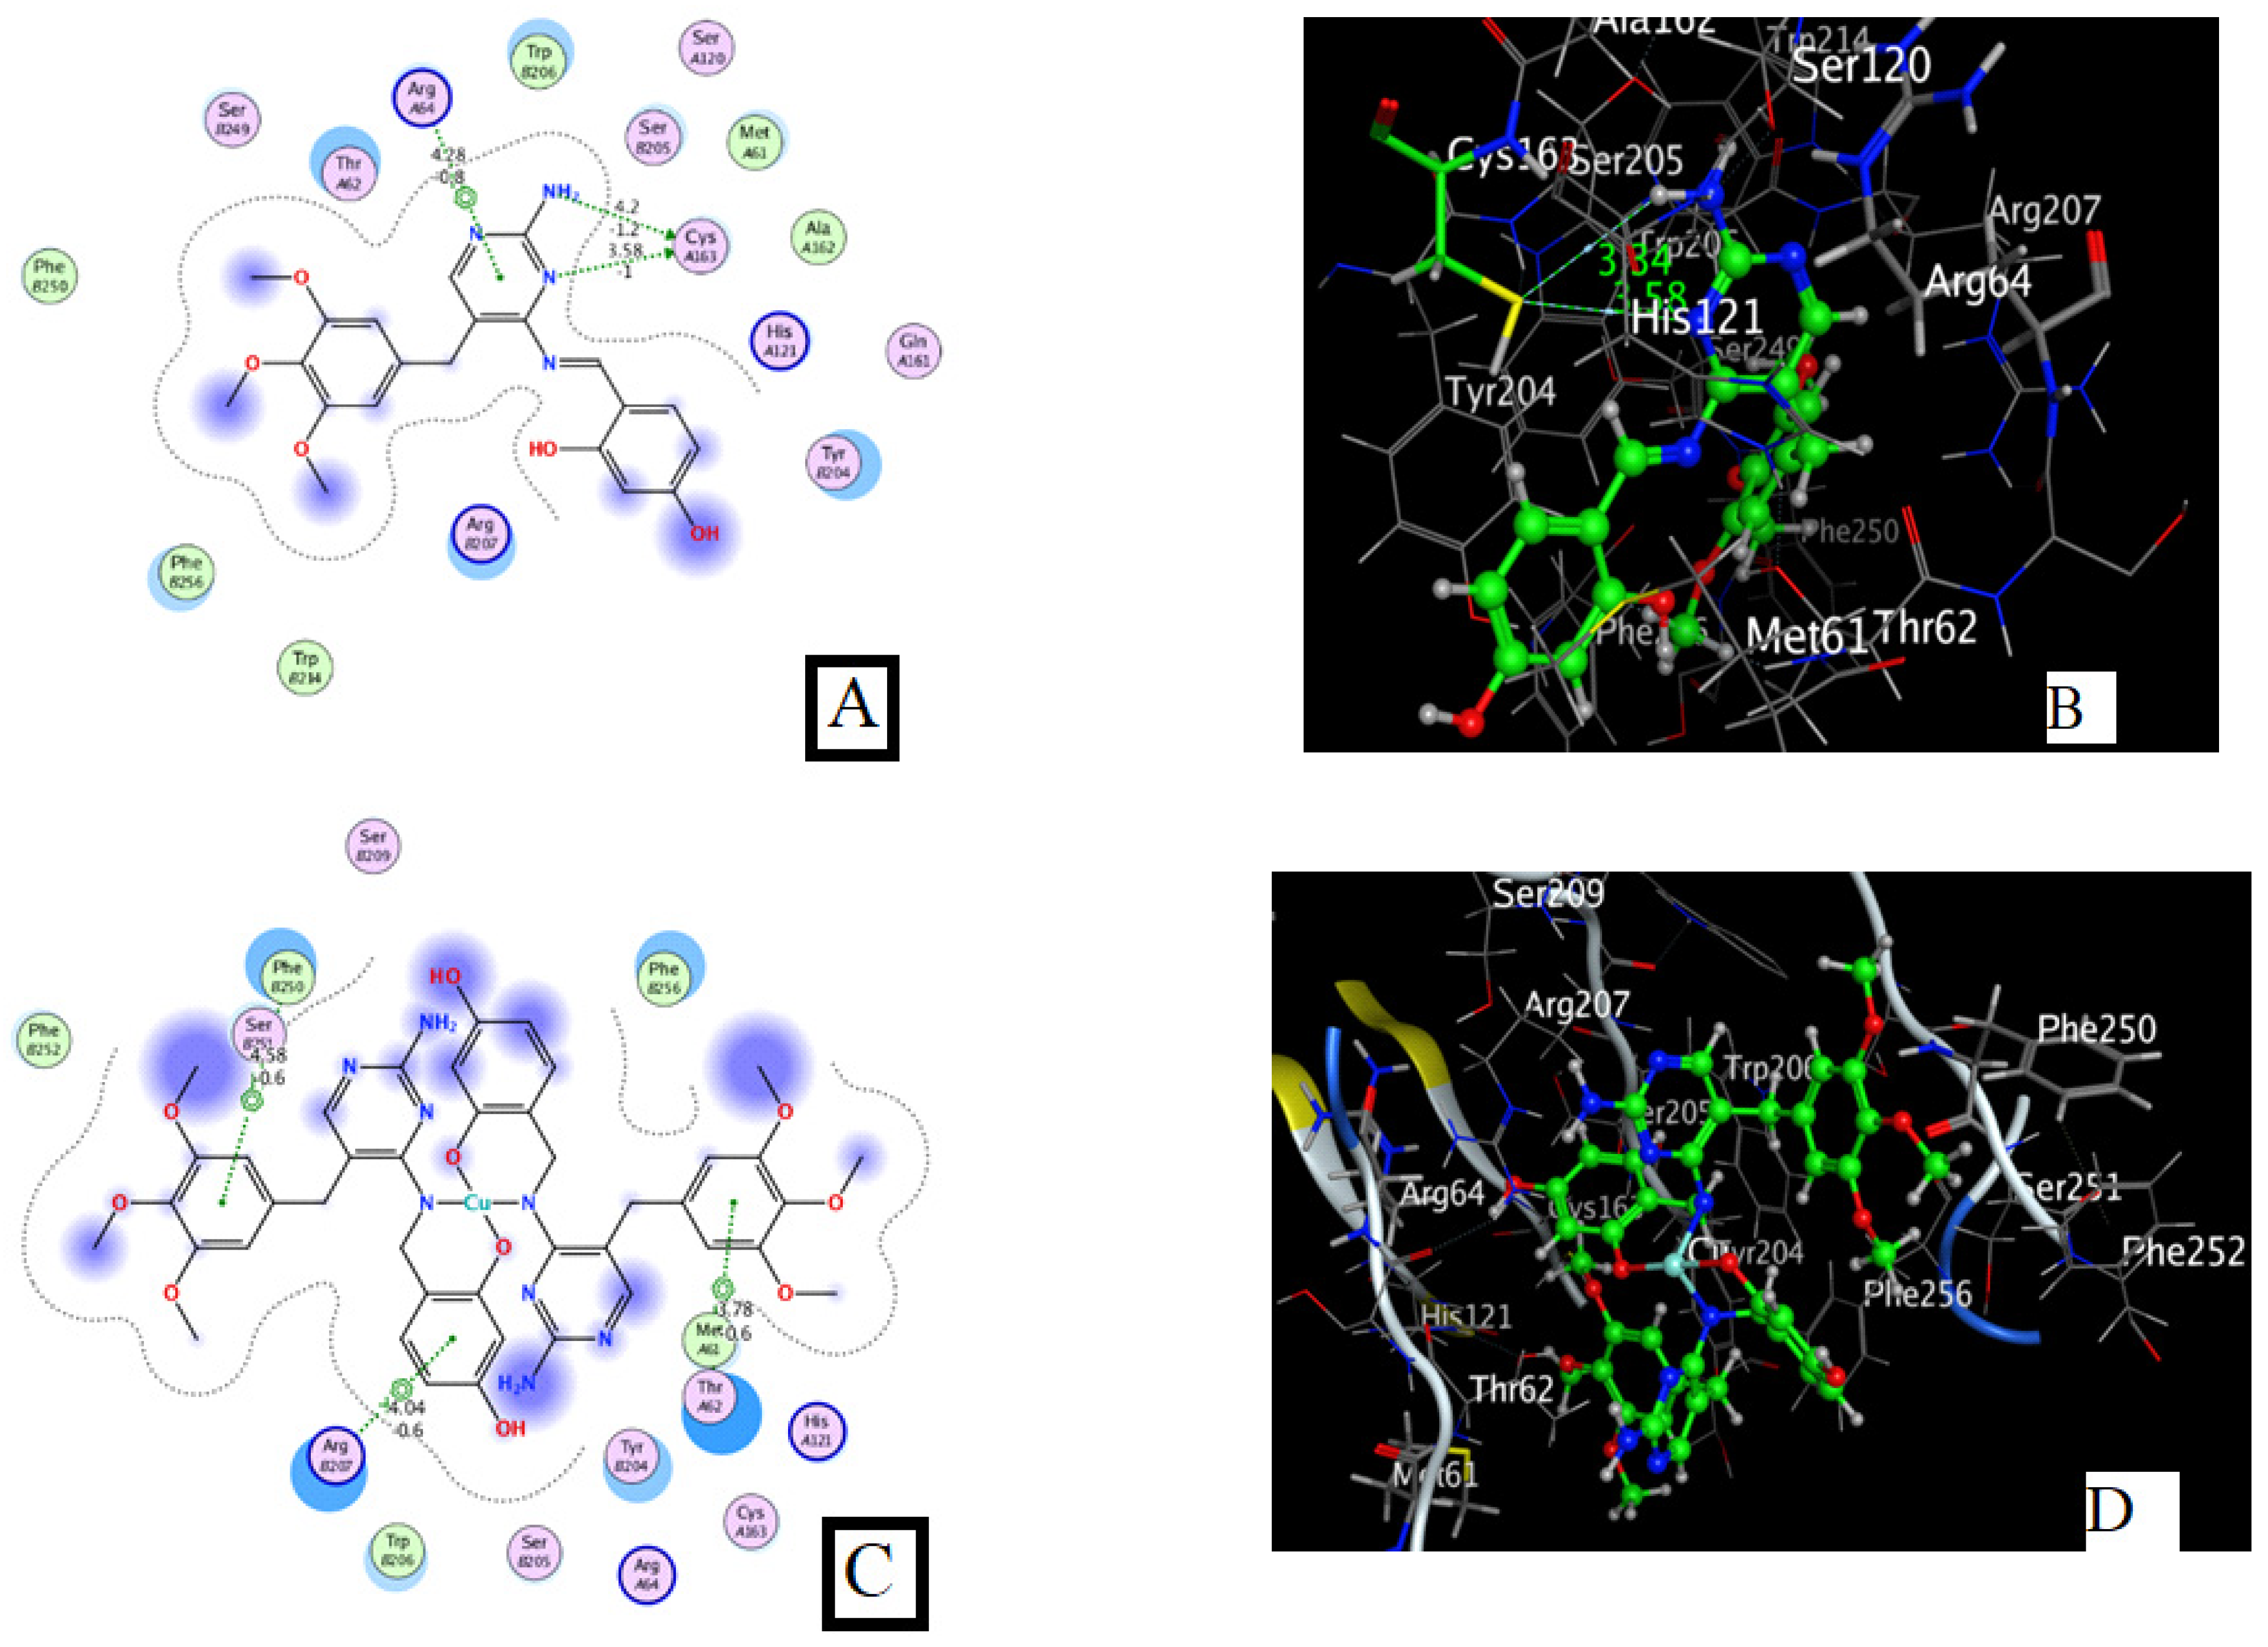
The docking of HD and its metal complexes with Caspase-3 was examined, with detailed results in Figure 18, Figure 19, Figure 20 and Figures S39–S41 and Table S20. The selected docking poses of HD revealed the formation of two hydrogen bonds: one between nitrogen (N 4) and cysteine (Cys) A163, along with a hydrophobic interaction between HD’s 6-membered ring and arginine (Arg) A64 of Caspase-3 (Figure 19). The binding energy for this interaction was −7.66 kcal/mol, surpassing that of both TMP and 5-FU (Table S20).
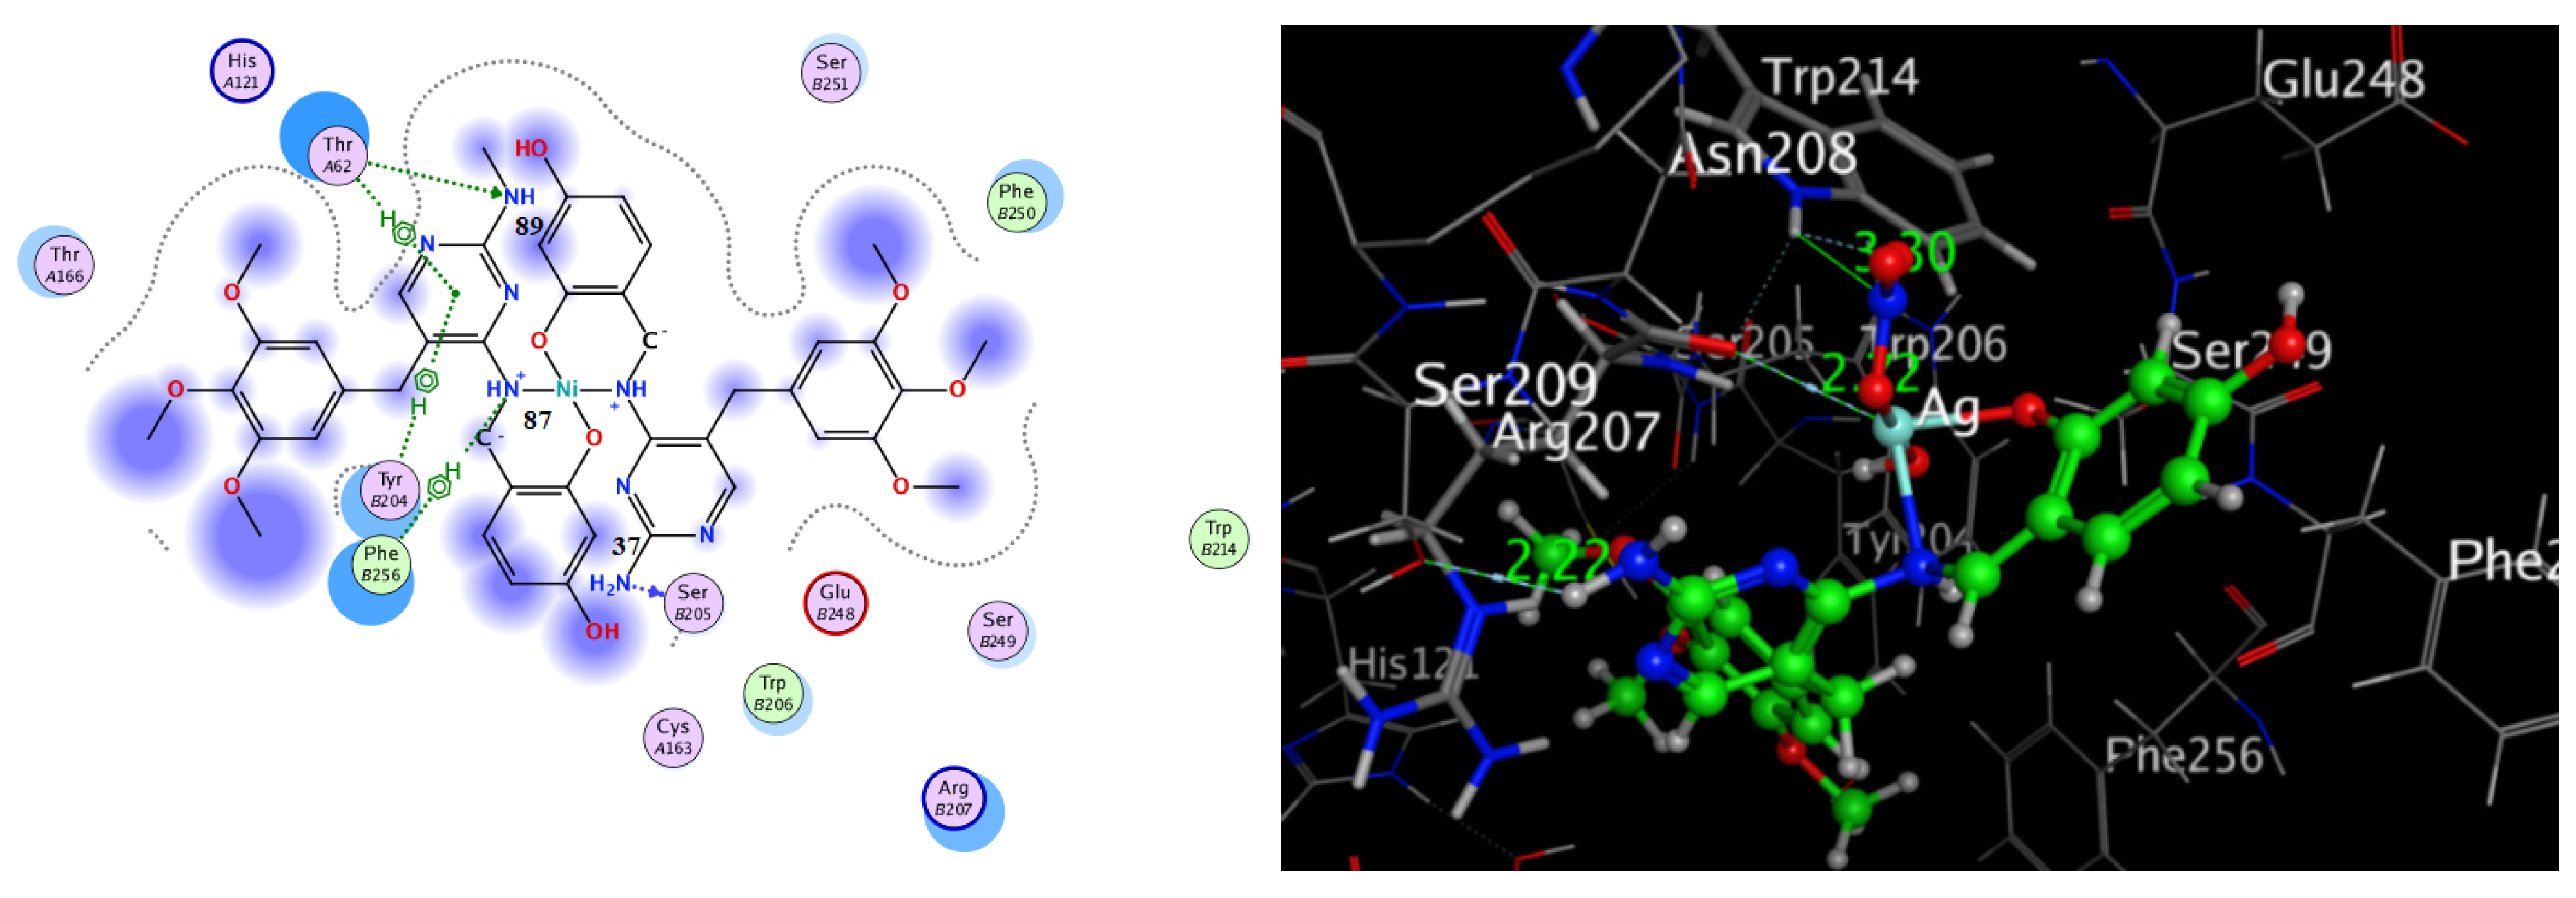
For the HD complexes, the docking analysis revealed the presence of two to five interactions involving hydrogen and hydrophobic bonds with the target protein. Specifically, Cu-HD formed hydrophobic interactions with phenylalanine (Phe) B250, arginine (Arg) B207, and methionine (Met) A61, while Ni-HD showed hydrogen bonds between oxygen (O31) and serine (Ser) B209 and nitrogen (N3) and Arg B207. Co-HD exhibited interactions involving nitrogen (N83 and N7) with serine (Ser) B209 and arginine (Arg) B208, as well as hydrophobic interaction with Phe B250. The binding energies of Cu-HD, Ni-HD, and Co-HD were −8.36, −9.05, and −8.62 kcal/mol, respectively, all of which were significantly stronger than those of 5-FU (−4.21 kcal/mol) and TMP (−6.54 kcal/mol). Ag-HD formed five interactions: three hydrogen bonds with serine (Ser) B205, threonine (Thr) A62, and phenylalanine (Phe) B256, as well as two arene-H bonds with tyrosine (Tyr) B204 and Thr A62 (Figure 20). The binding energy for Ag-HD was −7.87 kcal/mol. Zn-HD, on the other hand, displayed two interactions: one hydrogen bond between oxygen (O57) and Thr A62 and one hydrophobic bond with Arg B207, resulting in a binding energy of −7.81 kcal/mol (Figure S41).
All TMP derivatives’ overall binding energies and interaction sites were higher or comparable to TMP, suggesting a more potent inhibitory effect on Caspase-3 than TMP and 5-FU (Figure 19). This enhanced interaction is attributed to the modified molecular structure of TMP derivatives, which increases their affinity for protein binding [75]. Consequently, TMP derivatives exhibited significantly improved inhibitory potential against Caspase-3, with enhanced in vitro activity.

2.5. In Vitro Antitumor Activity

2.5.1. In Vitro Anticancer Activity by MTT Assay

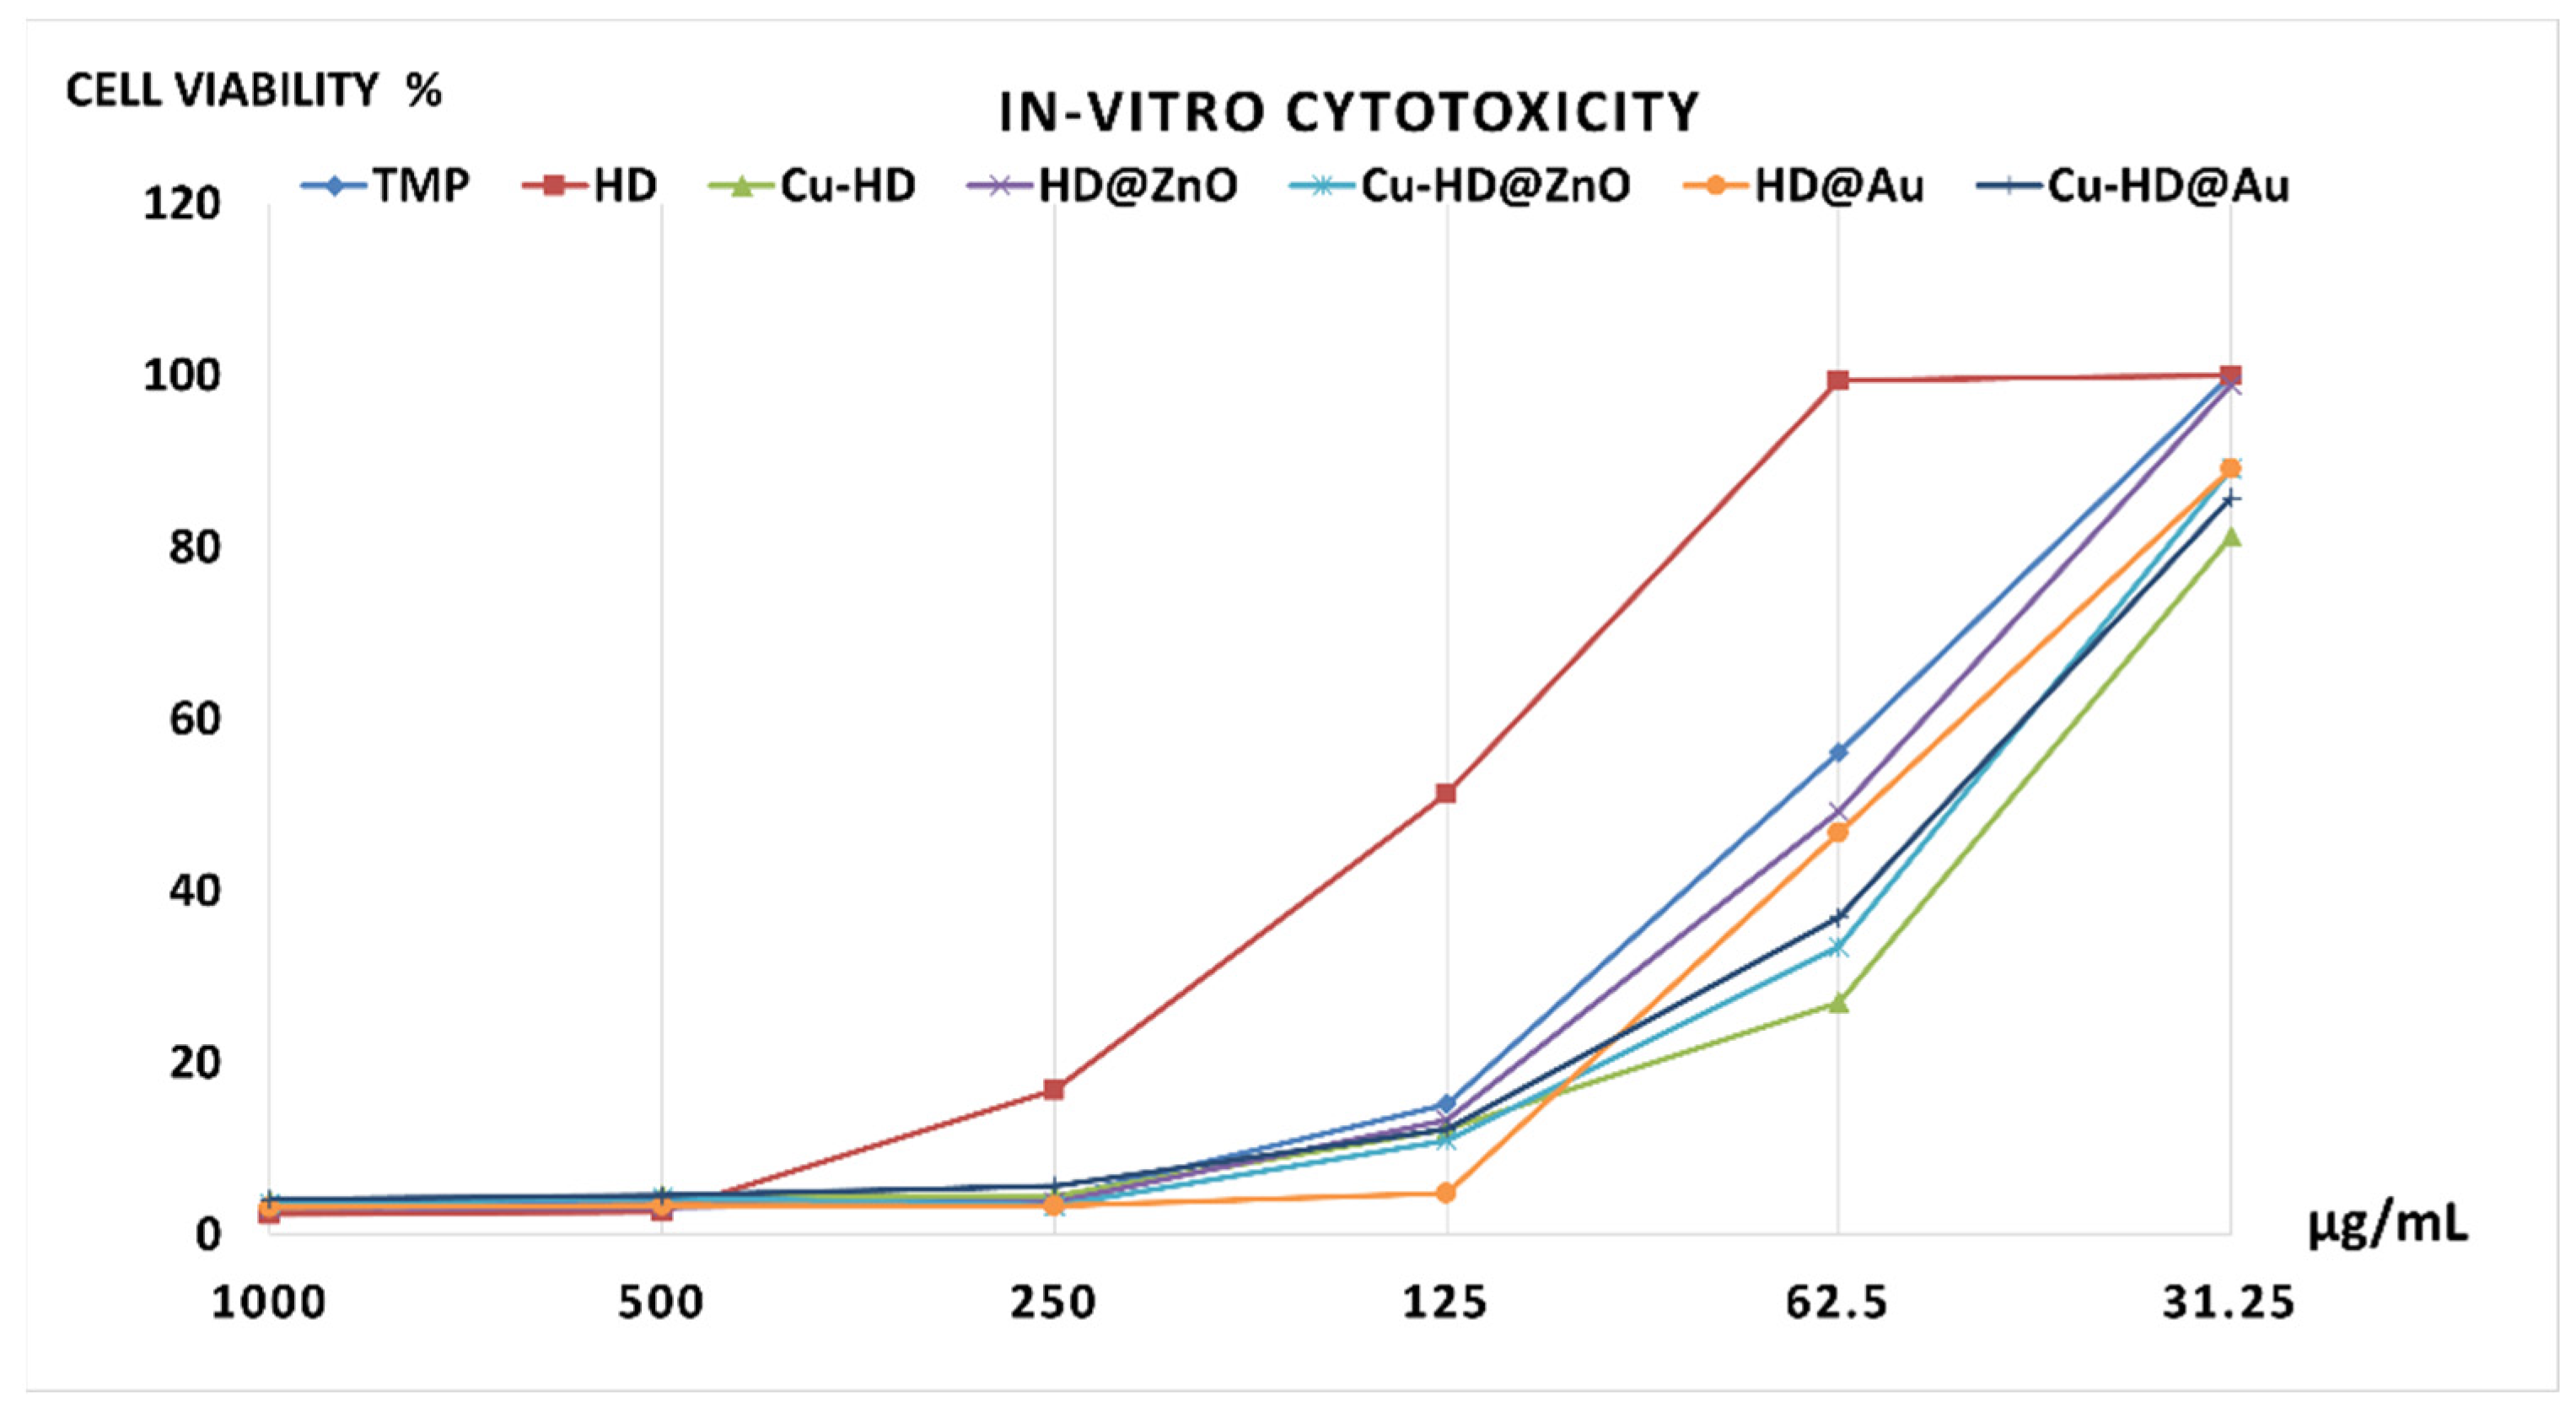
The anticancer efficacy of TMP derivatives was tested in vitro on HepG-2 cancer cell lines. The 5-FU, TMP, HD, Cu-HD, HD@ZnONPs, Cu-HD@ZnONPs, HD@AuNPs, and Cu-HD@AuNPs showed significant activity, with IC50 values of 32.53 [76], 80.76, 114.7, 61.66, 77, 53.13, 55.06, and 50.81 µg/mL, respectively. All TMP derivatives exhibited higher activity against the HepG2 cancer cell line compared to TMP, except HD. The results also showed that the compounds were close in effectiveness with anticancer drug 5-FU. Table S21 and Figure 21 and Figures S42–S50 provide detailed results.
Notably, introducing ZnO and Au nanoparticles significantly enhanced the anticancer efficacy of the derivatives. Cu-HD@ZnONPs and Cu-HD@AuNPs exhibited lower IC50 values (53.13 µg/mL and 50.81 µg/mL, respectively) compared to Cu-HD (61.66 µg/mL) and HD (114.7 µg/mL), indicating that nanoparticle conjugation improved the potency of these derivatives. The increase in activity is likely due to the nanoparticles’ large surface area and ionic interactions, which enhanced cellular uptake and drug delivery efficiency.

2.5.2. Quantitative Real-Time PCR

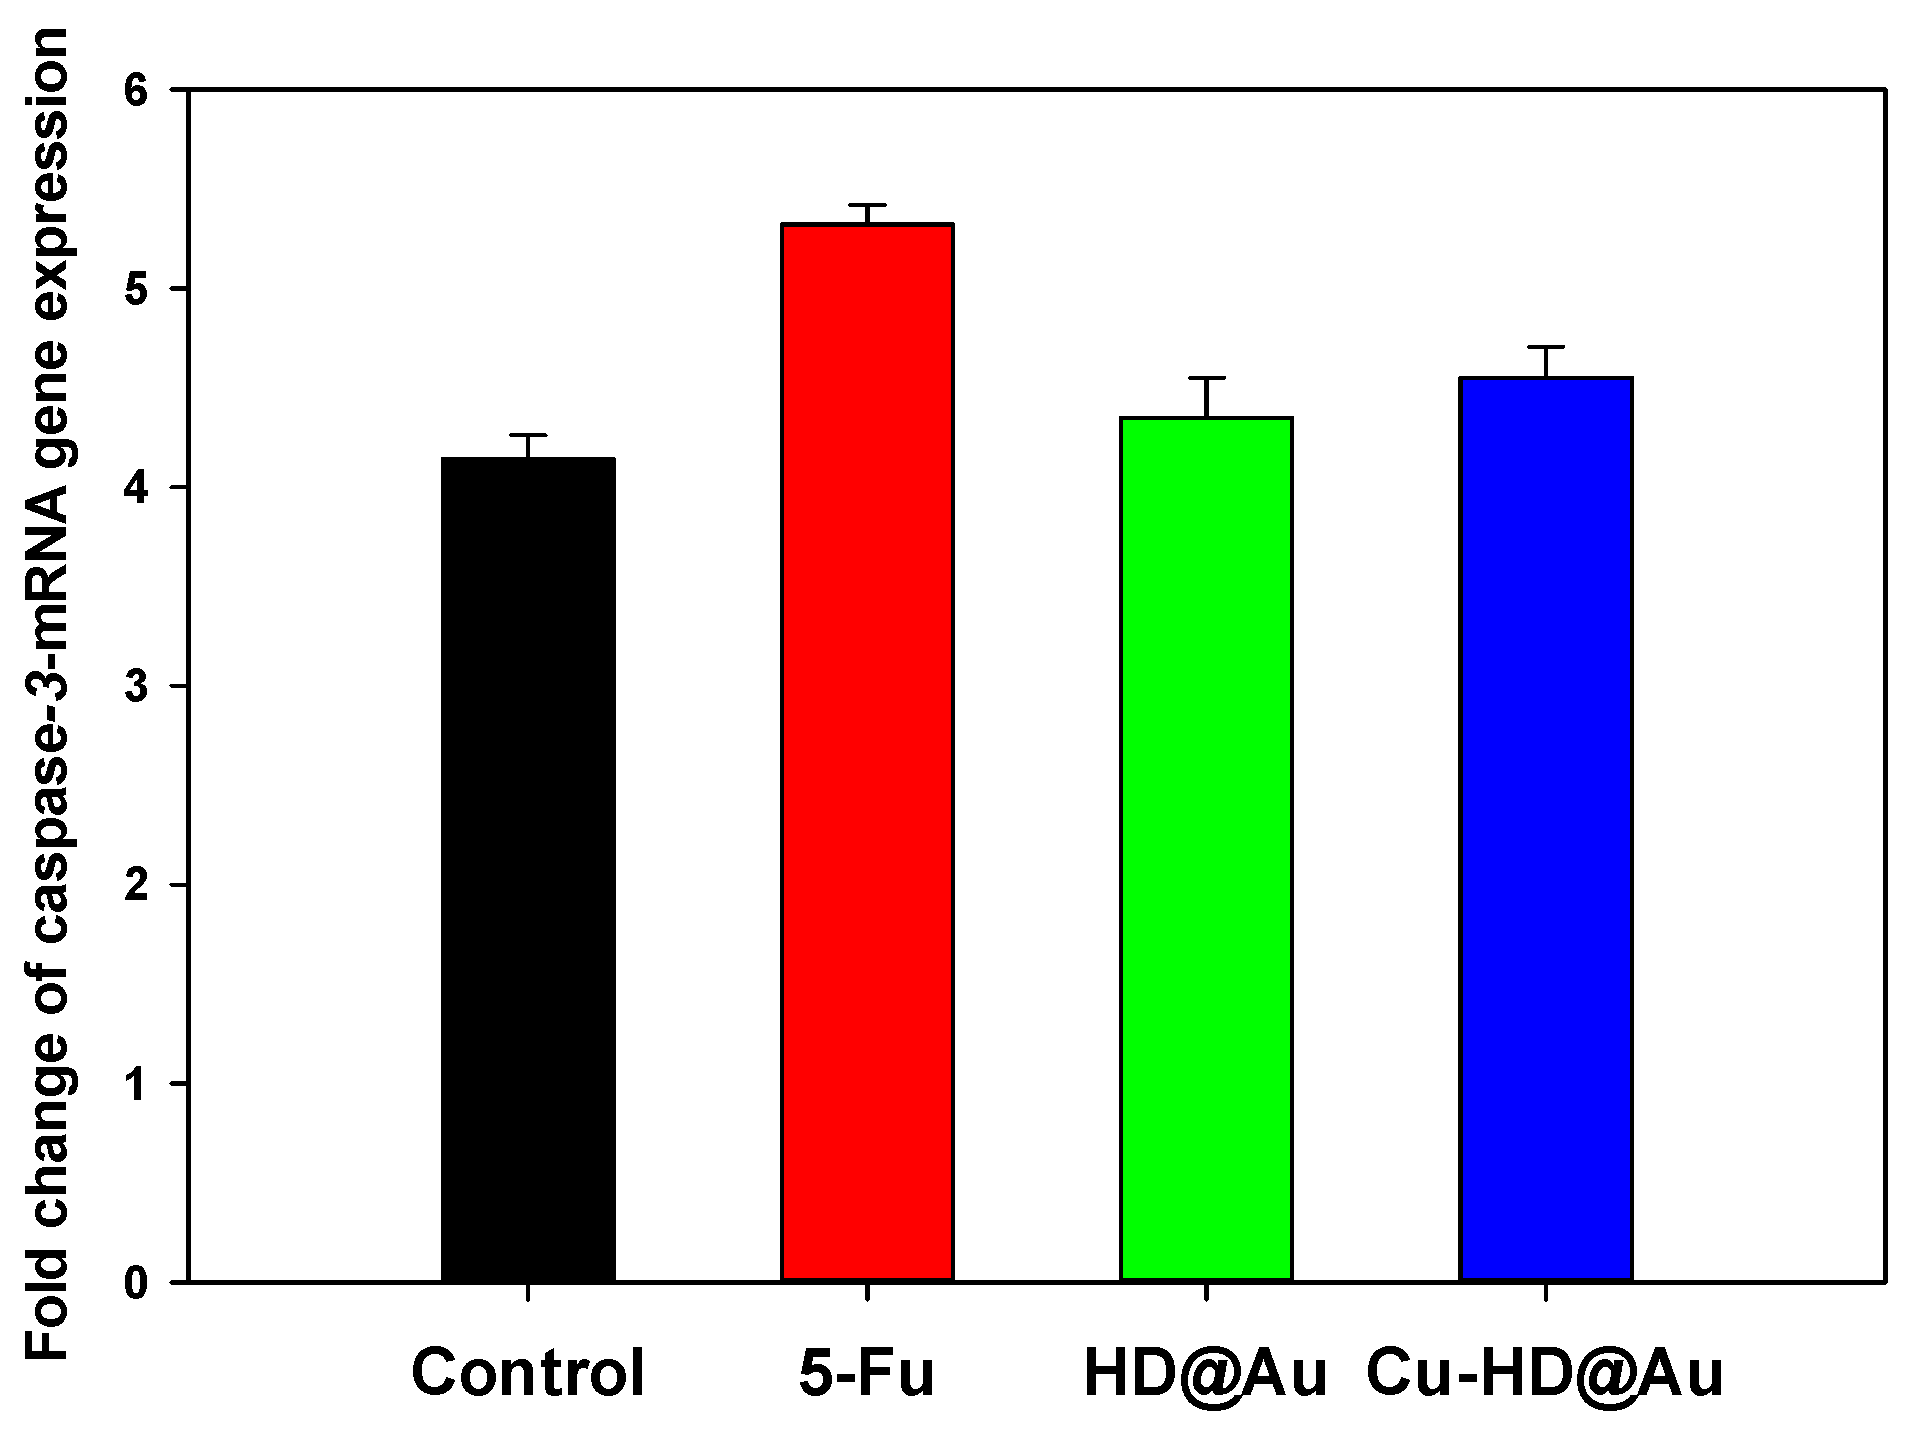
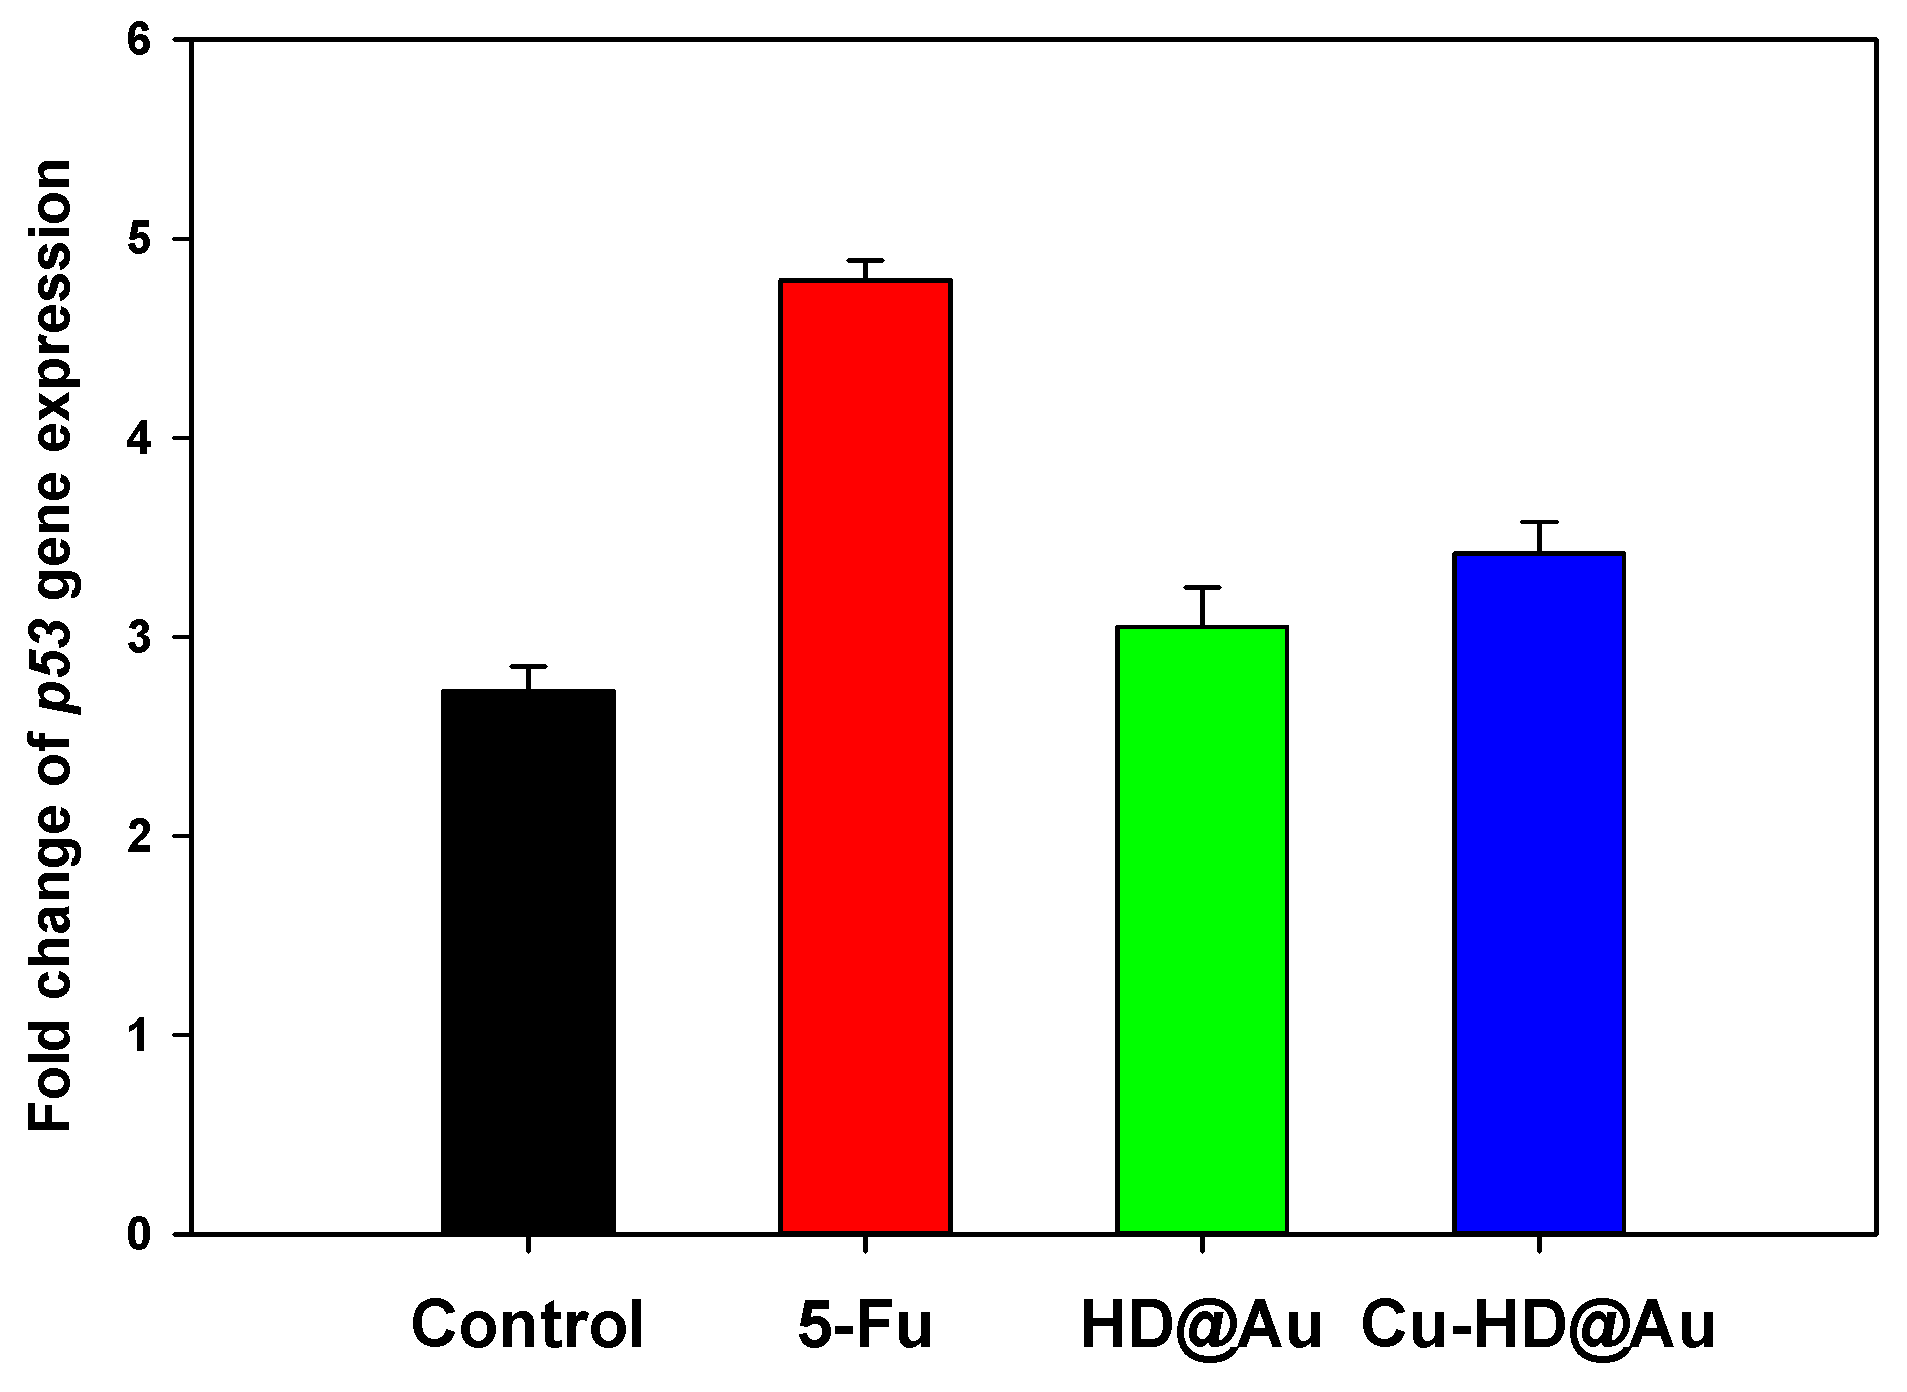
The expression levels of key apoptosis-related genes in HepG2 cells were analyzed using quantitative real-time PCR (qRT-PCR) to investigate the molecular mechanisms of apoptosis induced by TMP derivatives. Caspase-3 and P-53, two critical proteins in programmed cell death, were found to be significantly upregulated in treated cells. Compared to untreated control cells and the anticancer drug 5-FU, caspase-3 expression increased by 4.14 to 5.3 fold and P-53 expression by 2.73 to 4.79 fold. Specifically, HD@AuNPs and Cu-HD@AuNPs induced the expression of caspase-3 by 4.35 and 4.5 folds and P-53 by 3.05 and 3.41 folds, respectively, relative to the mRNA expression of the housekeeping gene β-actin (Tables S22 and S23, Figure 22 and Figure 23).
These results confirmed the pro-apoptotic potential of HD@AuNPs and Cu-HD@AuNPs, which significantly enhanced caspase-3 and P-53 expression levels compared to 5-FU (p < 0.009 and p < 0.028, respectively). The substantial increase in these pro-apoptotic genes suggests that the TMP derivatives, particularly when conjugated with nanoparticles, have a similar or potentially superior capacity to induce apoptosis as 5-FU, a widely used anticancer drug [77].
One limitation of the current study is the absence of toxicity testing on normal cells. While the findings indicate that TMP derivatives and their metal complexes effectively inhibit HepG2 cell proliferation, further studies are necessary to assess their toxicity in normal cell lines. Future research will focus on comprehensive toxicity evaluations to determine the therapeutic safety and establish the clinical applicability of these compounds. For instance, measurement of IC50 values for human embryonic kidney cells as a general model for toxicity towards healthy cells will be one way of toxicity evaluation.
The promising results presented here lay the groundwork for further optimization of TMP derivatives as anticancer agents. Subsequent studies will include detailed in vivo assessments and toxicity analyses to advance these compounds toward potential clinical trials.

3. Experimental

3.1. Chemicals and Instrumentation

Every reagent that is utilized is of analytical grade. Trimethoprim was obtained in its pure state and was purchased from Sigma Aldrich Darmstadt, Germany.
All data about the analytical instruments used in this study are summarized in the Supplementary Materials.

3.2. Synthesis

3.2.1. The HD Synthesis

Ethanolic solutions of Trimethoprim (C14H18N4O3, one mmol, 0.29 g, 20 mL) and 2,4-dihydroxy benzaldehyde (1 mmol, 0.41 g, 20 mL) were mixed dropwise and maintained at reflux for three hours. The reaction progress was monitored by thin-layer chromatography (TLC) using silica gel 60 F254 plates (Merck, Darmstadt, Germany) with an ethyl acetate: ethanol (9:1, v/v) mobile phase. Aliquots (2 μL of 1% w/v solutions) were analyzed at 30-min intervals, with visualization under UV 254/365 nm and iodine vapor. The Rf values were found to be 0.65 ± 0.02 for Trimethoprim, 0.42 ± 0.02 for 2,4-dihydroxybenzaldehyde, and 0.52 ± 0.02 for the HD product. Reaction completion was confirmed by the disappearance of the starting material spots and the stabilization of the product spot intensity. After the solution’s volume was decreased by evaporation to about 1/10 of its original volume, it was cooled to room temperature. The resulting canary-yellow precipitate was filtered, washed with methanol, and desiccated under anhydrous CaCl2 (Scheme 2).

3.2.2. The Complex Synthesis

The heated ethanolic solutions (20 mL) containing 0.1 mmol each of CuCl2 (0.067 g), NiCl2 (0.0648 g), CoCl2·6H2O (0.1189 g), AgNO3 (0.085 g), and Zn(NO3)2·6H2O (0.149 g) were added gradually to 20 mL 0.2 mmol HD solution (0.41 g), with stirring for 2–3 h to produce the stable metal complexes. The pH of the complexes was adjusted to 7–8 [75]. The volume of the solution was reduced by heating, producing various colored solid complexes. The solid residue was filtered, washed with methanol, and dried in desiccators.

3.2.3. ZnO Nanoparticles

Then, 100 mL of 0.2 M potassium hydroxide solution and 100 mL of 0.1 M zinc acetate dihydrate were mixed and kept at room temperature with steady stirring using a Teflon-coated magnet on a magnetic stirrer. A vortex of stirring was observed when the Teflon-coated magnet’s revolution was altered in response to the mixture’s increased viscosity. After that, the mixture was stirred for a further twenty minutes. Following precipitation, the zinc hydroxide was filtered and repeatedly cleaned with distilled water. The resultant product was burned at 150 °C in a hot air oven for eight hours. The obtained zinc hydroxide was suspended in distilled water to obtain suspension of ZnO nanoparticles. The ZnO particles had spherical diameters between 10 and 15 nm [78,79].

3.2.4. The Au Nanoparticles

All glassware was cleaned with nitric acid and then rinsed with double-distilled water. AuNPs were prepared following the previous procedures [80,81]. A 250 mL flask was filled with 125 mL of deionized water and heated to a boil. Next, 2 mL of 1% HAuCl4 was added. Gradually adding 10 milliliters of 0.05 M sodium citrate while stirring and heating the mixture continuously was necessary to cause the color of the solution to shift from pale yellow to a deep red hue after approximately 10 min, signifying the formation of GNPs. The gold nanoparticles were formed as citrate-reduced Au(III) to Au(0), as indicated by the red hue. After being cooled to ambient temperature, the GNP solution was kept at 4 °C. Absorption spectroscopy was used at room temperature to track the gold nanoparticle stability studies over a period. The analysis was conducted over 10 days to check for the precipitation of GNPs using the distinctive absorption peaks λmax and Δλ.

3.2.5. Functionalization @ZnO or @Au Nanoparticles

The Schiff base or complex (1 mM) in an ethanolic solution (50 mL) was stirred at ambient temperature in the typical synthesis [78,81]. The ethanolic suspension of ZnO (0.1 M) (50 mL) or 10 mL of Au nanoparticles was added to the previous solution, and the combination was allowed to stir up for 2–6 h.

3.3. In Silico Studies

The SwissADME web tool evaluated drug likeness, pharmacokinetics, and physicochemical characteristics in silico [82]. Molecular docking studies were conducted to investigate how the synthesized compounds interact with target proteins. The preparation of protein structures involved adding hydrogen atoms and removing water molecules. All non-essential atoms, except those in the active site, were excluded. The ligand structures were optimized using Marvin Sketch 19.21.7 software to generate their 3D conformations, which were then formatted into PDBQT using AutoDock Tools. Gasteiger charges were assigned to the ligands, and nonpolar hydrogen atoms were combined. A grid box was defined around the active site to ensure enough space for the ligands to explore different binding conformations. The top docking poses were chosen based on their lowest binding free energy and were visually inspected to confirm plausible binding modes. Caspase-3 enzyme (PDB code: 3GJQ), obtained from the Protein Data Bank (PDB), was used for docking with the AutoDock 4.2 tool. Minimizations were performed using the Merck molecular force field (MMFF94) until an RMSD gradient of 0.01 kcal/mol and a satisfactory total score function (S) were achieved [83].

3.4. Antitumor Activity Evaluation

After incubating for 24 h at 37 °C, a monolayer of 1 × 10⁵ cells/mL (100 µL/well) was generated in a 96-well tissue culture plate. Once a confluent cell sheet was obtained, the monolayer underwent two rounds of washing with wash media, and the growth medium was removed. The examined samples were diluted twice in the RPMI medium containing 2% serum (maintenance medium). Following each dilution (0.1 mL) to a distinct well, three wells functioned as controls and were simply given maintenance media. During the 37 °C incubation time, toxicity signs such as cell rounding, shrinkage, granulation, and partial or complete loss of the monolayer were monitored.
The plate was incubated at 37 °C with 5% CO2 for 1–5 h to allow for MTT metabolism after adding 5 mg/mL of MTT solution to each well. After removing the media, the formazan, an MTT metabolic product, was diluted using 200 µL of DMSO. The optical density at 560 nm was the optical density observed after the background at 620 nm was subtracted. Correlations between the number of cells and optical density values were direct [84,85].

3.5. Quantitative Real-Time PCR

Using a mixture of 60 µg/mL dichloromethane and methanol extracts, HEPG2 cells (1.5 × 10⁶) were grown in 96-well plates and treated for a full day. All RNA in the cell pellets was extracted using the Roche Diagnostics GmbH high pure RNA isolation kit and the manufacturer’s guidelines. RNA was converted into cDNA using the RevertAidTM first-strand synthesis kit (Fermentase, originally developed by Fermentas, Vilnius, Lithuania, USA). Following reverse transcription, the amount of cDNA was measured using an iCycler iQ multi-color real-time PCR detection system (Bio-Rad, Foster City, CA, USA) using a SYBR Green PCR Master Mix (ABI, Foster City, CA, USA).
The primers were arranged as follows: Caspase-3 forward 5{-CAGTG-GAGGCCGACTTCTTG-3}, reverse 50-TGGCACAAAGCGACTGGAT-3}; β-actin forward 5{-TCCCTGGAGAAGAGCTACG-3}, and reverse 5{-GTAGTTTCGTGGATGCCACA-3}. On an Applied Biosystems 7500 apparatus (Thermo Fisher Scientific Inc., Waltham, MA, USA), quantitative real-time polymerase chain reaction (qRT-PCR) was performed using the SYBR Green RT-PCR kit (Thermo Fisher Scientific Inc., Waltham, MA, USA). The typical temperature profile is 94 °C for 60 s, followed by 40 cycles of 55 °C for 60 s and 95 °C for 4 min [86,87]. By calculating 2−DDCt using the delta–delta cycle threshold (Ct) method, the fold differences in gene expression between the treatment and control groups were calculated [88].

4. Conclusions

In this study, a novel trimethoprim-based derivative, 4-(((2-amino-5-(3,4,5-trimethoxybenzyl)pyrimidin-4-yl)imino)methyl)benzene-1,3-diol (HD) was synthesized, along with its metal complexes containing Cu(II), Co(II), Ni(II), Ag(I), and Zn(II) ions. The complexes were further functionalized with ZnO and Au nanoparticles to enhance their anticancer properties. Structural confirmation of these compounds was achieved using a range of analytical techniques, including 1H NMR, FTIR, mass spectrometry, thermal analysis, and UV-Vis spectroscopy, which revealed octahedral geometries for all complexes. SwissADME and BOILED-Egg model predictions indicated that HD and its Cu complex could permeate the blood-brain barrier (BBB) and would be highly absorbed by the gastrointestinal tract, unlike the other metal complexes. Such results suggest that HD and its Cu complex are promising as drug candidates. Docking studies with Caspase-3 showed strong binding affinities, with binding energies of −7.66 kcal/mol for HD and up to −9.05 kcal/mol for the Ni complex, outperforming standard drugs like TMP (−6.54 kcal/mol) and 5-FU (−4.63 kcal/mol). The MTT assay demonstrated the anticancer potential of the compounds. The IC50 values for TMP, HD, Cu-HD, HD@ZnONPs, Cu-HD@ZnONPs HD@AuNPs, and Cu-HD@AuNPs were 80.76, 114.7, 61.66, 77, 53.13, 55.06, and 50.81 µg/mL, respectively. Notably, Cu-HD@AuNPs exhibited the highest activity, surpassing TMP and showing comparable efficacy to 5-FU (IC50 = 32.53 µg/mL). In terms of pro-apoptotic gene expression, real-time PCR analysis revealed that Au-HD@AuNPs and Cu-HD@AuNPs significantly upregulated caspase-3 and P53 expression by 4.35 and 4.5 folds and 3.05 and 3.41 folds, respectively, confirming their enhanced apoptotic effects in HepG2 cells.
These results demonstrate that the newly synthesized compounds possess significant anticancer potential, with several metal complexes, particularly those functionalized with Au and ZnO nanoparticles, exhibiting superior activity compared to TMP and 5-FU. The functionalization with nanoparticles not only improved drug uptake but also enhanced the therapeutic efficacy of the complexes.
Future research should focus on comprehensive in vivo studies and toxicity evaluations to further establish these novel compounds’ therapeutic potential. Investigating the mechanisms underlying their anticancer effects and their use in drug delivery systems could open new avenues for cancer therapy. These promising results lay the groundwork for developing these nanocomposites as potent candidates in clinical cancer treatment.

Supplementary Materials

The following supporting information can be downloaded at: https://www.mdpi.com/article/10.3390/inorganics13050144/s1, Table S1: The ^1^HNMR analysis of the HD. Figure S1: The ^1^HNMR spectrum of HD. Table S2: The m/z (%) and Molecular ion peak of the HD under consideration. Figure S2: The mass spectra of HD. Scheme S1: The chromatogram of pathway fragmentation of HD ligand. Figure S3: FTIR spectrum of the Trimethoprim drug. Figure S4: FTIR spectrum of HD ligand. Figure S5: UV-Vis. spectrum of the ligand HD. Figure S6: Thermal decomposition of Schiff base HD. Table S3: Significant IR frequencies (cm−1) for HD Schiff base and its complexes. Figure S7: ^1^H-NMR of Zn-HD complex. Table S4: TGA and DTG of Complexes derived from HD. Table S5: DTA of Complexes derived from HD. Figure S8: Ni-HD complex TGA/TG and DTA curves. Figure S9: Co-HD complex TGA/TG and DTA curves. Figure S10: Zn-HD complex TGA/TG and DTA curves. Table S6: The magnetic properties and electronic spectra of HD ligand and its complexes. Figure S11: UV-Vis spectra of Ni-HD. Figure S12: UV-Vis spectra of Co-HD. Figure S13: UV-Vis spectra of Ag-HD. Figure S14: UV-Vis spectra of Zn-HD. Figure S15: UV-Vis spectra of **ZnONPs. Figure S16: UV-Vis spectra of HD@ZnONPs. Figure S17: UV-Vis spectra of Cu-HD@ZnONPs. Figure S18: UV-Vis spectra **AuNPs. Figure S19: UV-Vis spectra of HD@AuNPs. Figure S20: UV-Vis spectra Cu-HD@AuNPs. Table S7: The electronic absorption spectra of ZnONPs and AuNPs. Table S8:X-ray diffraction data for ZnO. Table S9:X-ray diffraction data for Cu-HD. Table S10: The calculated crystallographic parameters for ZnO and Cu-complex. Table S11: Significant IR frequencies (cm-1) for ZnONPs. Figure S21: FTIR spectra of the ZnONPs. Figure S22: FTIR spectra HD@ZnONPs. Figure S23: FTIR spectra of Cu-HD@ZnONPs. Table S12: The MM2 energy types and values for TMP. Table S13: The MM2 energy types and values for HD. Figure S24: The 3D of TMP (a), TMP~e~ (b) and the 3D of HD (C), TD~C~ (D). Figure S25: The dihedral driver conformational energy graph of TMP. Figure S26: The dihedral driver conformational energy graph of HD. Figure S27: The DFT simulation for TMP. [A] 3D view, [B] HOMO and [C] LUMO. Figure S28: The HOMO and LUMO for HD. Figure S29: The DFT simulation for HD. [A] 3D view, [B] HOMO and [C] LUMO. Table S14: The DFT simulation data and ligand propertied of synthesized compounds. Table S15: Target Prediction for HD and its complexes. Figure S30: Target prediction of the Ni-HD. Figure S31: Target prediction of the Co-HD. Figure S32: Target prediction of the Ag-HD. Figure S33: Target prediction of the Zn-HD. Table S16: Predicted physicochemical variables for TMP, HD, and complexes derivatives from HD. Figure S34: Plot of observed versus calculated pKi value of TMP with anticancer inhibitors. Figure S35: 3D plot of PCA1, PCA2, and PCA3 for TMP. Table S17: inhibitory constants (pKi) of TMP derivatives and selective anticancer inhibitors. Table S18: The total energy of geometry optimization for AuNPs, ZnONPs, HD, and Cu-HD. Table S19: The Total and binding energies of adsorption for compounds on nanoparticles surface. Figure S36: The geometry optimization of A) ZnO and B) Au. Figure S37: 3D of Caspase-3 (PDB: 3GJQ). Table S20: The interaction parameters of 5-FU, TMP and TMP derivatives with Caspase-3 (PDB code: 3GJQ). Figure S38: The docking with Caspase-3 (PDB: 3GJQ). A, B: 2D and 3D diagram of 5FU, and C, D: 2D and 3D of TMP. Figure S39: 2D and 3D interaction of molecular docking of Caspase-3 (PDB: 3GJQ) with Ni-HD. Figure S40: 2D and 3D interaction of molecular docking of Caspase-3 (PDB: 3GJQ) with Co-HD. Figure S41: 2D and 3D interaction of molecular docking of Caspase-3 (PDB: 3GJQ) with Zn-HD. Table S21. The in vitro inhibition % and IC~50~ of the TMP drug derivatives on HepG-2 cell line. Figure S42: Control HepG-2 cells, Organism: homo sapiens, human, Tissue: liver, Cell type: epithelial, Culture properties: adherent, Diseases: hepatocellular carcinoma, ATCC: HB-8065. Figure S43: Effect of TMP on HepG2 cells at different concentrations. Figure S44: Effect of HD on HepG2 cells at different concentrations. Figure S45: Effect of Cu-HD on HepG2 cells at different concentrations. Figure S46: Effect of HD@ZnONPs on HepG2 cells at different concentrations. Figure S47: Effect of Cu-HD@ZnONPs on HepG2 cells at different concentrations. Figure S48: Effect of HD@AuNPs on HepG2 cells at different concentrations. Figure S49: Effect of Cu-HD@AuNPs on HepG2 cells at different concentrations. Figure S50: Effect of the TMP derivatives on HepG-2 cells with Toxicity at different conc. Table S22: compounds HD@AuNPs and Cu-HD@AuNPs against Caspase-3. Table S23: compounds HD@AuNPs and Cu-HD@AuNPs against P53.

Author Contributions

Conceptualization, A.S.O. and A.M.A.; Methodology, A.S.O., A.M.A. and H.K.; Software, A.S.O. and H.H.N.; Validation, A.S.O. and A.M.A.; Formal analysis, A.M.A., H.H.N. and A.A.; Investigation, A.M.A., A.S.O. and H.H.N.; Writing—original draft, A.M.A. and H.H.N.; Writing—review & editing, A.M.A., W.C.B. and H.K.; Visualization, W.C.B. and H.H.N.; Supervision, A.M.A., A.S.O. and A.A.; Project administration, A.S.O. and A.M.A. All authors have read and agreed to the published version of the manuscript.

Funding

This research received no external funding.

Institutional Review Board Statement

Not applicable.

Informed Consent Statement

Not applicable.

Data Availability Statement

Data are contained within the article and Supplementary Materials.

Acknowledgments

During the preparation of this work, the authors used ChatGPT 4.0 only for proofreading some sections of the manuscript. After using this tool/service, authors reviewed and edited the content as needed and have complete responsibility for the final publication.

Conflicts of Interest

The authors declare no conflict of interest.

References

  1. Ali, E.-S.; Abeer, O.; Sama, A.-A.; Omar, A.-S. Anti-Cancer and Anti-Microbial Activity Studies of Some Complexes of Trimethoprim. J. Cancer Res. Updates 2013, 2, 14–20. [Google Scholar] [CrossRef]
  2. Ott, I.; Gust, R. Non platinum metal complexes as anti-cancer drugs. Arch. Pharm. Int. J. Pharm. Med. Chem. 2007, 340, 117–126. [Google Scholar] [CrossRef]
  3. Abbas, A.M.; Aboelmagd, A.; Kishk, S.M.; Nasrallah, H.H.; Boyd, W.C.; Kalil, H.; Orabi, A.S. A Novel Ibuprofen Derivative and Its Complexes: Physicochemical Characterization, DFT Modeling, Docking, In Vitro Anti-Inflammatory Studies, and DNA Interaction. Molecules 2022, 27, 7540. [Google Scholar] [CrossRef]
  4. Abbas, A.M.; Fisal, S.R.; Orabi, A.S. Novel β-lactam antibiotic derivative and its complexes: DFT, frontier energy levels, DNA interaction, docking, physicochemical and antimicrobial properties. J. Mol. Struct. 2020, 1218, 128487. [Google Scholar] [CrossRef]
  5. Abbas, A.M.; Fisal, S.R.; Orabi, A.S. Enhancement of the biochemical activity of some market antibiotics by chemical modification: Synthesis, characterization, and biochemical evaluation. J. Chin. Chem. Soc. 2021, 68, 131–149. [Google Scholar] [CrossRef]
  6. Abbas, A.M.; Fisal, S.R.; Radwan, A.; Makhlouf, M.; Orabi, A.S. Novel action for ampicillin derivative and its complexes: Physicochemical, thermal analysis, DNA interaction, docking with FabH protein, in silico, and in vitro studies. J. Mol. Liq. 2022, 351, 118333. [Google Scholar] [CrossRef]
  7. Scozzafava, A.; Menabuoni, L.; Mincione, F.; Mincione, G.; Supuran, C.T. Carbonic anhydrase inhibitors: Synthesis of sulfonamides incorporating dtpa tails and of their zinc complexes with powerful topical antiglaucoma properties. Bioorg. Med. Chem. Lett. 2001, 11, 575–582. [Google Scholar] [CrossRef] [PubMed]
  8. Walsh, C. Enabling the chemistry of life. Nature 2001, 409, 226–231. [Google Scholar] [CrossRef]
  9. Bertini, I.; Gray, H.B.; Lippard, S.J.; Valentine, J.S. Bioinorganic Chemistry; University Science Books: Mill Valley, CA, USA, 1994. [Google Scholar]
  10. Mahmoud, M.A.; Sallam, S.A.; Abdelrahman, R.B.; Abbas, A.M. Studies of the molecular docking, antibacterial, antifungal, and DNA interaction of mixed-ligand Ni (II) complexes with gabapentin or pregabalin and diimine coligands. Inorg. Chim. Acta 2024, 564, 121959. [Google Scholar] [CrossRef]
  11. Ajibade, P.A.; Idemudia, O.G. Synthesis, Characterization, and Antibacterial Studies of Pd(II) and Pt(II) Complexes of Some Diaminopyrimidine Derivatives. Bioinorg. Chem. Appl. 2013, 2013, 549549. [Google Scholar] [CrossRef]
  12. Demirezen, N.; Tarınç, D.; Polat, D.; Çeşme, M.; Gölcü, A.; Tümer, M. Synthesis of trimethoprim metal complexes: Spectral, electrochemical, thermal, DNA-binding and surface morphology studies. Spectrochim. Acta Part A Mol. Biomol. Spectrosc. 2012, 94, 243–255. [Google Scholar] [CrossRef] [PubMed]
  13. Ahmed, M.Z.; Habib, U. DFT studies of temperature effect on coordination chemistry of Cu(II)-trimethoprim complexes. J. Coord. Chem. 2018, 71, 1102–1113. [Google Scholar] [CrossRef]
  14. Sekhon, B.S.; Randhawa, H.S.; Sahai, H.K. On the coordinating behaviour of trimethoprim towards some metal ions. Synth. React. Inorg. Met.-Org. Chem. 1999, 29, 309–321. [Google Scholar]
  15. Albedair, L.A. Iron(III), gold(III), platinum(IV) and palladium(II) trimethoprim drug complexes: Synthesis, spectroscopic, morphological and anticancer assessments. Rev. Roum. Chim. 2021, 65, 1145–1152. [Google Scholar] [CrossRef]
  16. Abdussalam-Mohammed, W. Comparison of chemical and biological properties of metal nanoparticles (Au, Ag), with metal oxide nanoparticles (ZnO-NPs) and their applications. Adv. J. Chem. Sect. A 2020, 3, 111–236. [Google Scholar]
  17. Achilonu, C.C.; Kumar, P.; Swart, H.C.; Roos, W.D.; Marais, G.J. Zinc Oxide: Gold Nanoparticles (ZnO: Au NPs) Exhibited Antifungal Efficacy Against Aspergillus niger and Aspergillus candidus. BioNanoScience 2024, 14, 799–813. [Google Scholar] [CrossRef]
  18. Anjum, S.; Hashim, M.; Malik, S.A.; Khan, M.; Lorenzo, J.M.; Abbasi, B.H.; Hano, C. Recent advances in zinc oxide nanoparticles (ZnO NPs) for cancer diagnosis, target drug delivery, and treatment. Cancers 2021, 13, 4570. [Google Scholar] [CrossRef]
  19. Siddique, S.; Chow, J.C.L. Gold Nanoparticles for Drug Delivery and Cancer Therapy. Appl. Sci. 2020, 10, 3824. [Google Scholar] [CrossRef]
  20. Kajani, A.A.; Bordbar, A.-K.; Esfahani, S.H.Z.; Razmjou, A. Gold nanoparticles as potent anticancer agent: Green synthesis, characterization, and in vitro study. RSC Adv. 2016, 6, 63973–63983. [Google Scholar]
  21. ElShaer, A.; Hanson, P.; Worthington, T.; Lambert, P.; Mohammed, A.R. Preparation and Characterization of Amino Acids-Based Trimethoprim Salts. Pharmaceutics 2012, 4, 179–196. [Google Scholar] [CrossRef]
  22. Florey, K.; Brittain, H.G.; Prankerd, R.J. Analytical Profiles of Drug Substances; Brittain, H.G., Ed.; Academic Press Inc.: Cambridge, MA, USA, 1993. [Google Scholar]
  23. Ungurean, A.; Leopold, N.; David, L.; Chiş, V. Vibrational spectroscopic and DFT study of trimethoprim. Spectrochim. Acta Part A Mol. Biomol. Spectrosc. 2013, 102, 52–58. [Google Scholar] [CrossRef]
  24. Subashchandrabose, S.; Krishnan, A.R.; Saleem, H.; Thanikachalam, V.; Manikandan, G.; Erdogdu, Y. FT-IR, FT-Raman, NMR spectral analysis and theoretical NBO, HOMO–LUMO analysis of bis(4-amino-5-mercapto-1,2,4-triazol-3-yl)ethane by ab initio HF and DFT methods. J. Mol. Struct. 2010, 981, 59–70. [Google Scholar] [CrossRef]
  25. Socrates, G. Infrared and Raman Characteristic Group Frequencies: Tables and Charts; John Wiley & Sons: Hoboken, NJ, USA, 2004; p. 386. [Google Scholar]
  26. Puviarasan, N.; Arjunan, V.; Mohan, S. FT-IR and FT-Raman Studies on 3-Aminophthalhydrazide and N-Aminophthalimide. Turk. J. Chem. 2002, 26, 4. [Google Scholar]
  27. Wang, L.; Cao, C.; Cao, C. Substituent effects on the stretching vibration of C═N in multi-substituted benzylideneanilines. J. Phys. Org. Chem. 2019, 32, e3969. [Google Scholar] [CrossRef]
  28. Manius, G.J. Trimethoprim. In Analytical Profiles of Drug Substances; Elsevier: Amsterdam, The Netherlands, 1978; Volume 7, pp. 445–475. [Google Scholar]
  29. Montazerozohori, M.; Musavi, S.A.; Masoudiasl, A.; Naghiha, A.; Dusek, M.; Kucerakova, M. Synthesis, spectral, crystal structure, thermal behavior, antimicrobial and DNA cleavage potential of two octahedral cadmium complexes: A supramolecular structure. Spectrochim. Acta Part A Mol. Biomol. Spectrosc. 2015, 137, 389–396. [Google Scholar] [CrossRef] [PubMed]
  30. Bravo, A.; Anacona, J.R. Synthesis and characterization of metal complexes with ampicillin. J. Coord. Chem. 1998, 44, 173–182. [Google Scholar] [CrossRef]
  31. El-Gamel, N.E.A. Metal chelates of ampicillin versus amoxicillin: Synthesis, structural investigation, and biological studies. J. Coord. Chem. 2010, 63, 534–543. [Google Scholar] [CrossRef]
  32. Abbas, A.; Salem, H.; Orabi, A. Synthesis, characterization, in vitro and in silico assessment of novel diclofenac derivative metal complexes. J. Mol. Struct. 2024, 1318, 139191. [Google Scholar] [CrossRef]
  33. Barszcz, B. Coordination properties of didentate N,O heterocyclic alcohols and aldehydes towards Cu(II), Co(II), Zn(II) and Cd(II) ions in the solid state and aqueous solution. Coord. Chem. Rev. 2005, 249, 2259–2276. [Google Scholar] [CrossRef]
  34. Yoshimura, T.; Miyake, C.; Imoto, S. Ultraviolet and Infrared Spectra of Cupferron and Neocupferron. Bull. Chem. Soc. Jpn. 1972, 45, 1424–1430. [Google Scholar] [CrossRef]
  35. Tong, M.M.; Brewer, D.G. Nature of the Coordination Bond in Metal Complexes of Substituted Pyridine Derivatives. VI. Electronic Spectra of Some Complexes of Copper(II). Can. J. Chem. 1971, 49, 102–104. [Google Scholar] [CrossRef]
  36. Dholakiya, P.P.; Patel, M.N. Preparation, magnetic, spectral, and biocidal studies of some transition metal complexes with 3, 5-dibromosalicylideneaniline and neutral bidentate ligands. Synth. React. Inorg. Met.-Org. Chem. 2002, 32, 819–829. [Google Scholar] [CrossRef]
  37. Al-Amiery, A.A.; Al-Majedy, Y.K.; Abdulreazak, H.; Abood, H. Synthesis, Characterization, Theoretical Crystal Structure, and Antibacterial Activities of Some Transition Metal Complexes of the Thiosemicarbazone (Z)-2-(pyrrolidin-2-ylidene)hydrazinecarbothioamide. Bioinorg. Chem. Appl. 2011, 2011, 483101. [Google Scholar] [CrossRef]
  38. Altomare, A.; Camalli, M.; Cuocci, C.; Giacovazzo, C.; Moliterni, A.; Rizzi, R. EXPO2009: Structure solution by powder data in direct and reciprocal space. J. Appl. Crystallogr. 2009, 42, 1197–1202. [Google Scholar] [CrossRef]
  39. Sharmila, G.; Thirumarimurugan, M.; Muthukumaran, C. Green synthesis of ZnO nanoparticles using Tecoma castanifolia leaf extract: Characterization and evaluation of its antioxidant, bactericidal and anticancer activities. Microchem. J. 2019, 145, 578–587. [Google Scholar] [CrossRef]
  40. Singh, G.; Babele, P.K.; Kumar, A.; Srivastava, A.; Sinha, R.P.; Tyagi, M.B. Synthesis of ZnO nanoparticles using the cell extract of the cyanobacterium, Anabaena strain L31 and its conjugation with UV-B absorbing compound shinorine. J. Photochem. Photobiol. B Biol. 2014, 138, 55–62. [Google Scholar] [CrossRef] [PubMed]
  41. Okamoto, T.; Yamaguchi, I. Optical Absorption Study of the Surface Plasmon Resonance in Gold Nanoparticles Immobilized onto a Gold Substrate by Self-Assembly Technique. J. Phys. Chem. B 2003, 107, 10321–10324. [Google Scholar] [CrossRef]
  42. Henglein, A. Physicochemical properties of small metal particles in solution: “microelectrode” reactions, chemisorption, composite metal particles, and the atom-to-metal transition. J. Phys. Chem. 1993, 97, 5457–5471. [Google Scholar] [CrossRef]
  43. Hasan, M.; Bethell, D.; Brust, M. The fate of sulfur-bound hydrogen on formation of self-assembled thiol monolayers on gold: 1H NMR spectroscopic evidence from solutions of gold clusters. J. Am. Chem. Soc. 2002, 124, 1132–1133. [Google Scholar] [CrossRef]
  44. Link, S.; El-Sayed, M.A. Spectral properties and relaxation dynamics of surface plasmon electronic oscillations in gold and silver nanodots and nanorods. J. Phys. Chem. B 1999, 103, 8410–8426. [Google Scholar] [CrossRef]
  45. Rattanawongwiboon, T.; Soontaranon, S.; Hemvichian, K.; Lertsarawut, P.; Laksee, S.; Picha, R. Study on particle size and size distribution of gold nanoparticles by TEM and SAXS. Radiat. Phys. Chem. 2022, 191, 109842. [Google Scholar] [CrossRef]
  46. Mayoral, Á.; Agúndez, J.; Pascual-Valderrama, I.M.; Pérez-Pariente, J. Generation of gold nanoparticles according to procedures described in the eighteenth century. Gold Bull. 2014, 47, 161–165. [Google Scholar] [CrossRef]
  47. Chandrappa, K.G.; Venkatesha, T.V.; Vathsala, K.; Shivakumara, C. A hybrid electrochemical–thermal method for the preparation of large ZnO nanoparticles. J. Nanopart. Res. 2010, 12, 2667–2678. [Google Scholar] [CrossRef]
  48. Mitra, P.; Mondal, S. Structural and Morphological Characterization of ZnO thin Films Synthesized by SILAR. Prog. Theor. Appl. Phys. 2013, 1, 17–31. [Google Scholar]
  49. Hisaindee, S.; Al-Kaabi, L.; Ajeb, S.; Torky, Y.; Iratni, R.; Saleh, N.i.; AbuQamar, S.F. Antipathogenic effects of structurally-related Schiff base derivatives: Structure–activity relationship. Arab. J. Chem. 2015, 8, 828–836. [Google Scholar] [CrossRef]
  50. Tyagi, P.; Tyagi, M.; Agrawal, S.; Chandra, S.; Ojha, H.; Pathak, M. Synthesis, characterization of 1,2,4-triazole Schiff base derived 3D-metal complexes: Induces cytotoxicity in HepG2, MCF-7 cell line, BSA binding fluorescence and DFT study. Spectrochim. Acta Part A Mol. Biomol. Spectrosc. 2017, 171, 246–257. [Google Scholar] [CrossRef]
  51. Rauf, A.; Shah, A.; Munawar, K.S.; Khan, A.A.; Abbasi, R.; Yameen, M.A.; Khan, A.M.; Khan, A.R.; Qureshi, I.Z.; Kraatz, H.-B.; et al. Synthesis, spectroscopic characterization, DFT optimization and biological activities of Schiff bases and their metal (II) complexes. J. Mol. Struct. 2017, 1145, 132–140. [Google Scholar] [CrossRef]
  52. Gázquez, J.L. Hardness and softness in density functional theory. In Chemical Hardness; Sen, K.D., Ed.; Springer: Berlin/Heidelberg, Germany, 1993; pp. 27–43. [Google Scholar]
  53. Cheng, T.; Zhao, Y.; Li, X.; Lin, F.; Xu, Y.; Zhang, X.; Li, Y.; Wang, R.; Lai, L. Computation of Octanol−Water Partition Coefficients by Guiding an Additive Model with Knowledge. J. Chem. Inf. Model. 2007, 47, 2140–2148. [Google Scholar] [CrossRef]
  54. Daina, A.; Zoete, V. A BOILED-Egg To Predict Gastrointestinal Absorption and Brain Penetration of Small Molecules. ChemMedChem 2016, 11, 1117–1121. [Google Scholar] [CrossRef]
  55. Wildman, S.A.; Crippen, G.M. Prediction of Physicochemical Parameters by Atomic Contributions. J. Chem. Inf. Comput. Sci. 1999, 39, 868–873. [Google Scholar] [CrossRef]
  56. Veber, D.F.; Johnson, S.R.; Cheng, H.-Y.; Smith, B.R.; Ward, K.W.; Kopple, K.D. Molecular Properties That Influence the Oral Bioavailability of Drug Candidates. J. Med. Chem. 2002, 45, 2615–2623. [Google Scholar] [CrossRef] [PubMed]
  57. Brito, M.A.d. Pharmacokinetic study with computational tools in the medicinal chemistry course. Braz. J. Pharm. Sci. 2011, 47, 797–805. [Google Scholar] [CrossRef]
  58. Pires, D.E.; Blundell, T.L.; Ascher, D.B. pkCSM: Predicting small-molecule pharmacokinetic and toxicity properties using graph-based signatures. J. Med. Chem. 2015, 58, 4066–4072. [Google Scholar] [CrossRef]
  59. Frimayanti, N. 2D, 3D-QSAR, and pharmacophore studies on thiazolidine-4-carboxylic acid derivatives as neuraminidase inhibitors in H3N2 influenza virus. Med. Chem. Res. 2014, 23, 1447–1453. [Google Scholar] [CrossRef]
  60. Karthikeyan, M.; Vyas, R.; Karthikeyan, M.; Vyas, R. Open-source tools, techniques, and data in chemoinformatics. In Practical Chemoinformatics; Springer: Berlin/Heidelberg, Germany, 2014; pp. 1–92. [Google Scholar]
  61. Ferrara, P.; Apostolakis, J.; Caflisch, A. Evaluation of a fast implicit solvent model for molecular dynamics simulations. Proteins Struct. Funct. Bioinform. 2002, 46, 24–33. [Google Scholar] [CrossRef]
  62. Ertl, P.; Rohde, B.; Selzer, P. Fast calculation of molecular polar surface area as a sum of fragment-based contributions and its application to the prediction of drug transport properties. J. Med. Chem. 2000, 43, 3714–3717. [Google Scholar] [CrossRef] [PubMed]
  63. Xu, S.-P.; Sun, G.-P.; Shen, Y.-X.; Wei, W.; Peng, W.-R.; Wang, H. Antiproliferation and apoptosis induction of paeonol in HepG2 cells. World J. Gastroenterol. WJG 2007, 13, 250–256. [Google Scholar] [CrossRef] [PubMed]
  64. Xu, T.; Guo, P.; Pi, C.; He, Y.; Yang, H.; Hou, Y.; Feng, X.; Jiang, Q.; Wei, Y.; Zhao, L. Synergistic Effects of Curcumin and 5-Fluorouracil on the Hepatocellular Carcinoma In vivo and vitro through regulating the expression of COX-2 and NF-κB. J. Cancer 2020, 11, 3955–3964. [Google Scholar] [CrossRef]
  65. Xu, W.; Pan, Y.; Wang, H.; Li, H.; Peng, Q.; Wei, D.; Chen, C.; Zheng, J. Synthesis and Evaluation of New Pyrazoline Derivatives as Potential Anticancer Agents in HepG-2 Cell Line. Molecules 2017, 22, 467. [Google Scholar] [CrossRef]
  66. Lange, J.H.; Reinders, J.-H.; Tolboom, J.T.; Glennon, J.C.; Coolen, H.K.; Kruse, C.G. Principal component analysis differentiates the receptor binding profiles of three antipsychotic drug candidates from current antipsychotic drugs. J. Med. Chem. 2007, 50, 5103–5108. [Google Scholar] [CrossRef]
  67. Ringnér, M. What is principal component analysis? Nat. Biotechnol. 2008, 26, 303–304. [Google Scholar] [CrossRef] [PubMed]
  68. Song, L.; Liu, W.; Xin, F.; Li, Y. “Materials Studio” Simulation Study of the Adsorption and Polymerization Mechanism of Sodium Silicate on Active Silica Surface at Different Temperatures. Int. J. Metalcast. 2021, 15, 1091–1098. [Google Scholar] [CrossRef]
  69. Tran, N.V.; Tieu, A.K.; Zhu, H.; Ta, H.T.T.; Ta, T.D.; Le, H.M. First-Principles Study of the Adsorption and Depolymerization Mechanisms of Sodium Silicate on Iron Surfaces at High Temperature. J. Phys. Chem. C 2018, 122, 20827–20840. [Google Scholar] [CrossRef]
  70. Liu, H.; Song, L. Materials Studio simulation for the adsorption properties of CO2 molecules at the surface of sodium silicate and potassium silicate solution under different pressure conditions. Int. J. Met. 2022, 16, 242–251. [Google Scholar] [CrossRef]
  71. Fan, L.; Luo, C.; Li, X.; Lu, F.; Qiu, H.; Sun, M. Fabrication of novel magnetic chitosan grafted with graphene oxide to enhance adsorption properties for methyl blue. J. Hazard. Mater. 2012, 215, 272–279. [Google Scholar] [CrossRef]
  72. Li, L.; Larsen, A.H.; Romero, N.A.; Morozov, V.A.; Glinsvad, C.; Abild-Pedersen, F.; Greeley, J.; Jacobsen, K.W.; Nørskov, J.K. Investigation of Catalytic Finite-Size-Effects of Platinum Metal Clusters. J. Phys. Chem. Lett. 2013, 4, 222–226. [Google Scholar] [CrossRef] [PubMed]
  73. Teobaldi, G.; Zerbetto, F. Adsorption of organic molecules on gold electrodes. J. Phys. Chem. C 2007, 111, 13879–13885. [Google Scholar] [CrossRef]
  74. RCSB Protein Data Bank. PDB—5IKT: The Structure of Tolfenamic Acid Bound to Human Cyclooxygenase-2. Available online: https://www.rcsb.org/structure/5IKT (accessed on 21 April 2025).
  75. Abbas, A.M.; Nasrallah, H.H.; Aboelmagd, A.; Kishk, S.M.; Boyd, W.C.; Kalil, H.; Orabi, A.S. Design, Synthesis, Anti-Inflammatory Activity, DFT Modeling and Docking Study of New Ibuprofen Derivatives. Int. J. Mol. Sci. 2024, 25, 3558. [Google Scholar] [CrossRef]
  76. Alnakib, N.; Abdel-Hamid, N.; El-Senduny, F.; EL-Gharieb, M. Assessment of Alpha-fetoprotein levels and the effect of 5-Fluorouracil on Cytotoxicity of HepG2 cell line. Alfarama J. Basic Appl. Sci. 2022, 3, 210–219. [Google Scholar] [CrossRef]
  77. Wu, X.-X.; Kakehi, Y.; Mizutani, Y.; Lu, J.; Terachi, T.; Ogawa, O. Activation of caspase-3 in renal cell carcinoma cells by anthracyclines or 5-fluorouracil. Int. J. Oncol. 2001, 19, 19–24. [Google Scholar] [CrossRef]
  78. Orabi, A.S.; Abou El-Nour, K.M.; Youssef, M.F.; Salem, H.A. Novel and highly effective composites of silver and zinc oxide nanoparticles with some transition metal complexes against different microorganisms. Arab. J. Chem. 2020, 13, 2628–2648. [Google Scholar] [CrossRef]
  79. Sangari, N.U. Synthesis and characterization of nano sized ZnO using conventional and microwave heating methods. Int. J. ChemTech Res. 2014, 7, 181. [Google Scholar]
  80. Tabrizi, A.; Ayhan, F.; Ayhan, H. Gold Nanoparticle Synthesis and Characterisation. Hacet. J. Biol. Chem. 2009, 37, 217–226. [Google Scholar]
  81. El-Nour, K.M.A.; Salam, E.T.A.; Soliman, H.M.; Orabi, A. Gold nanoparticles as a direct and rapid sensor for sensitive analytical detection of biogenic amines. Nanoscale Res. Lett. 2017, 12, 231. [Google Scholar] [CrossRef] [PubMed]
  82. Daina, A.; Michielin, O.; Zoete, V. SwissADME: A free web tool to evaluate pharmacokinetics, drug-likeness and medicinal chemistry friendliness of small molecules. Sci. Rep. 2017, 7, 42717. [Google Scholar] [CrossRef] [PubMed]
  83. Abdel-Rahman, L.H.; Abu-Dief, A.M.; Shehata, M.R.; Atlam, F.M.; Abdel-Mawgoud, A.A.H. Some new Ag (I), VO (II) and Pd (II) chelates incorporating tridentate imine ligand: Design, synthesis, structure elucidation, density functional theory calculations for DNA interaction, antimicrobial and anticancer activities and molecular docking studies. Appl. Organomet. Chem. 2019, 33, e4699. [Google Scholar] [CrossRef]
  84. Slater, T.F.; Sawyer, B.; Sträuli, U. Studies on succinate-tetrazolium reductase systems: III. Points of coupling of four different tetrazolium salts III. Points of coupling of four different tetrazolium salts. Biochim. Biophys. Acta 1963, 77, 383–393. [Google Scholar] [CrossRef]
  85. Van de Loosdrecht, A.A.; Beelen, R.H.J.; Ossenkoppele, g.; Broekhoven, M.G.; Langenhuijsen, M. A tetrazolium-based colorimetric MTT assay to quantitate human monocyte mediated cytotoxicity against leukemic cells from cell lines and patients with acute myeloid leukemia. J. Immunol. Methods 1994, 174, 311–320. [Google Scholar] [CrossRef]
  86. Alazzouni, A.S.; Dkhil, M.A.; Gadelmawla, M.H.; Gabri, M.S.; Farag, A.H.; Hassan, B.N. Ferulic acid as anticarcinogenic agent against 1,2-dimethylhydrazine induced colon cancer in rats. J. King Saud Univ.-Sci. 2021, 33, 101354. [Google Scholar] [CrossRef]
  87. Valiyari, S.; Jahanban-Esfahlan, R.; Shahneh, F.Z.; Yaripour, S.; Baradaran, B.; Delazar, A. Cytotoxic and apoptotic activity of Scrophularia oxysepala in MCF-7 human breast cancer cells. Toxicol. Environ. Chem. 2013, 95, 1208–1220. [Google Scholar] [CrossRef]
  88. Livak, K.J.; Schmittgen, T.D. Analysis of relative gene expression data using real-time quantitative PCR and the 2−ΔΔCT method. Methods 2001, 25, 402–408. [Google Scholar] [CrossRef] [PubMed]
Figure 1. FTIR spectra of HD and its complexes.
Inorganics 13 00144 g001
Figure 2. Cu-HD complex TGA/TG and DTA curves.
Inorganics 13 00144 g002
Figure 3. Ag-HD complex TGA/TG and DTA curves.
Inorganics 13 00144 g003
Figure 4. UV-Vis spectra of Cu-HD complex.
Inorganics 13 00144 g004
Figure 5. X-ray diffraction for Cu-HD complex.
Inorganics 13 00144 g005
Figure 6. (A) Calculated unit cell, (B) The calculated crystal structure of the package 2 2 1, and (C) the arrangement in the crystal lattice for Cu-HD complex.
Inorganics 13 00144 g006
Scheme 1. The postulated structures of HD complexes.
Inorganics 13 00144 sch001
Figure 7. (A) TEM image and (B) Histogram of the size for ZnONPs.
Inorganics 13 00144 g007
Figure 8. (A) TEM image, (B) Histogram of size for AuNPs.
Inorganics 13 00144 g008
Figure 9. X-Ray Diffraction of ZnONP.
Inorganics 13 00144 g009
Figure 10. The surface features of TMP and HD. (A,C) Active lone pair for TMP, HD, and (B,D) Hydrophilic and lipophilic maps for TMP, HD.
Inorganics 13 00144 g010
Figure 11. The target prediction of (A) TMP (B) HD (C) Cu-HD.
Inorganics 13 00144 g011
Figure 12. BOILED-Egg model for TMP, HD, and its complexes.
Inorganics 13 00144 g012
Figure 13. Plot of predicted ($PRED) versus experimental pKi value HD and TMP with anticancer inhibitors.
Inorganics 13 00144 g013
Figure 14. The principal component analysis (PCA) plot of HD and TMP with anticancer drugs shows three eigenvectors (PCA1, PCA2, and PCA3) ranging from −3 to +3.
Inorganics 13 00144 g014
Figure 15. The geometry optimization of (A) HD and (B) Cu-HD.
Inorganics 13 00144 g015
Figure 16. Adsorption of (A) HD and (B) Cu-HD on the surface of ZnONPs.
Inorganics 13 00144 g016
Figure 17. Adsorption of (A) HD and (B) Cu-HD on the surface of AuNPs.
Inorganics 13 00144 g017
Figure 18. The total binding energy of 5-FU, TMP, and TMP derivatives with Caspase-3.
Inorganics 13 00144 g018
Figure 19. The docking with Caspase-3 (PDB: 3GJQ). (A,B) 2D and 3D diagram of HD, and (C,D) 2D and 3D diagram of Cu-HD.
Inorganics 13 00144 g019
Figure 20. 2D and 3D interaction of molecular docking of Caspase-3 with Ag-HD.
Inorganics 13 00144 g020
Figure 21. Effect of the TMP derivatives on HepG-2 cells with Viability at different concentrations.
Inorganics 13 00144 g021
Figure 22. The Caspase-3 gene expression in HepG2 by PCR for HD@AuNPs and Cu-HD@AuNPs (Values mean ± SD at p ≤ 0.009).
Inorganics 13 00144 g022
Figure 23. The gene expression p-53 in HepG2 for TMP derivatives (p ≤ 0.028).
Inorganics 13 00144 g023
Scheme 2. Synthesis of HD.
Inorganics 13 00144 sch002
Table 1. The Physicochemical properties of TMP derivative (HD) and its complexes.
CompoundMolecular
Weight
ColorMelting Point
(°C)
Ω *CHNM%
C%H%N%M% **
Calc.
Found
Calc.
Found
Calc.
Found
ABCalc.
HD (C21H22N4O5)410.44Brown182---61.46
61.42
5.40
5.59
13.65
13.58
---------
[Cu(HD)2]Cl.2H2O
C42H47CuN8O12Cl
954.88Dirty green>2506552.83
52.23
4.96
4.85
11.74
11.77
6.697.026.81
[Ni(HD)2]3H2O
C42H49N8NiO13
932.59Apple green>2501054.09
54.11
5.30
5.25
12.02
12.11
6.897.866.30
[Co(HD)2]Cl.2H2O
C42H47ClCoN8O12
950.27Brick brown>2506853.09
53.15
4.99
5.05
11.79
11.85
6.697.596.20
[Ag(HD)2]NO3.2H2O
C42H48 AgN9O14
1026.76Brick brown>2506049.13
49.55
4.71
4.62
12.28
12.35
10.2510.9510.50
[Zn(HD)2](NO3)2.2H2O
C42H47N10O18Zn
1045.27Yellow-orange>25013048.26
48.35
4.53
4.56
13.40
13.45
6.866.786.24
* 10−3 M in DMSO, conductivity (ohm−1 cm2 mol−1). ** A is EDTA titration, and B is thermal analysis.
Table 2. The pkCSM online tool to predict P-glycoprotein substrates (A) HD and (B) Cu-HD complex.
PropertyModel NameTMPHDCu-HDNi-HDCo-HDAg-HDZn-HD
AbsorptionWater Solubility (log mol/L)−2.721−4.009−2.971−2.971−2.791−2.915−2.97
Caco2 permeability (log Papp in 10−6 cm/s)0.6490.1880.0850.0850.0850.0270.085
Intestinal absorption (%)76.82478.70570.23470.33270.28364.07769.826
Skin Permeability (Log Kp)−2.857−2.734−2.735−2.735−2.735−2.735−2.735
P-Glycoprotein substrateYesYesNoNoNoYesNo
P-Glycoprotein I inhibitorNoNoYesYesYesYesYes
P-Glycoprotein II inhibitorNoYesYesYesYesYesYes
Disclaimer/Publisher’s Note: The statements, opinions and data contained in all publications are solely those of the individual author(s) and contributor(s) and not of MDPI and/or the editor(s). MDPI and/or the editor(s) disclaim responsibility for any injury to people or property resulting from any ideas, methods, instructions or products referred to in the content.