Abstract
This paper delves into the impact of Y doping on In2O3 thermoelectric materials. Yttrium doping significantly modifies the properties of In2O3, with far-reaching implications for its thermoelectric performance and mechanical characteristics. In the electrical domain, Y3+ substitution for In3+ optimizes carrier concentration and mobility. The alteration of the electronic band structure leads to a balanced improvement in the Seebeck coefficient and electrical conductivity, boosting the power factor. Despite initial lattice distortion-induced mobility changes, carrier screening at suitable doping levels counteracts this, enhancing overall electrical conductivity. Regarding thermal conductivity, multiple factors act synergistically. Lattice distortion, along with the generation of point defects, dislocations, nanostructuring, and modulated electron–phonon interactions, jointly reduce heat transfer. This reduction is vital for maintaining a substantial temperature gradient, a prerequisite for efficient thermoelectric conversion. The observed increase in ZT (the thermoelectric device figure of merit) with the highest value from ~0.055 to ~0.275.
1. Introduction
Thermoelectric materials have attracted significant attention in recent decades due to their unique ability to directly convert heat into electricity and vice versa. This property makes them potentially valuable for various applications, such as waste heat recovery and solid-state refrigeration [1,2,3]. Traditional thermoelectric materials like Bi2Te3 [4,5], PbTe [6,7], and SiGe [8,9] have shown relatively good thermoelectric performance. However, they also have some limitations. For example, some contain toxic elements, and their high-temperature stability and cost-effectiveness need to be improved. Oxide thermoelectric materials have emerged as an important class of candidates. One of the key advantages of oxide thermoelectric materials is their excellent chemical and thermal stability [10,11,12]. This makes them more sustainable compared to some traditional thermoelectric materials [13,14]. In addition, the tunability of oxide materials’ properties through doping and nanostructuring offers great potential for optimizing their thermoelectric performance. For example, by doping different elements into In2O3, its electrical conductivity and Seebeck coefficient can be adjusted to enhance the overall thermoelectric figure of merit [15,16]. Oxide thermoelectric materials, with their unique advantages, hold great promise for the future development of thermoelectric technology. Although oxide thermoelectric materials possess certain advantages, they also have drawbacks. One major shortcoming is their relatively low electrical conductivity compared to some traditional thermoelectric materials. This leads to a lower power factor and thus restricts the overall thermoelectric performance.
Indium oxide (In2O3), as a thermoelectric material, has several advantages. In2O3 exhibits a relatively high electrical conductivity. This enables it to conduct electrons effectively, reducing internal resistance and thereby enhancing the power output efficiency during thermoelectric conversion [17,18]. Despite its advantages, In2O3 thermoelectric material also has some drawbacks in thermoelectric performance. One of the main limitations is its relatively low Seebeck coefficient compared to some other advanced thermoelectric materials. A lower Seebeck coefficient means it generates a less significant thermoelectric voltage for a given temperature difference, which restricts the overall thermoelectric conversion efficiency. Additionally, In2O3 has a relatively high thermal conductivity. High thermal conductivity leads to significant heat dissipation and reduces the temperature gradient across the material, which is essential for efficient thermoelectric energy conversion. As a result, a large portion of the heat is conducted away rather than being converted into electricity. Moreover, its figure of merit (ZT) value, which comprehensively evaluates the thermoelectric performance, is not as high as desired. This implies that improvements are needed in both electrical and thermal properties to make it more competitive in practical thermoelectric applications. Current research on the doping of In2O3 thermoelectric materials mainly focuses on improving its thermoelectric performance. For example, Ga doping has been studied to introduce nanopore structures, reducing thermal conductivity and enhancing the ZT value [15,19]. Other elements doping such as Mo doping [20], V doping [21], and Co doping [22] are also being explored to optimize carrier concentration and phonon scattering, aiming to further improve the efficiency of thermoelectric conversion. However, this kind of doping experiments have a certain degree of blindness and randomness, which has certain limitations on the mechanism research of indium oxide thermoelectric materials.
Yttrium (Y)-doped In2O3 thermoelectric materials exhibit some advantages and innovative features. Y doping can effectively modify the electronic structure of In2O3. By introducing additional electron carriers, it optimizes the electrical conductivity, enhancing the transport of charges and improving power generation efficiency. The innovation lies in its ability to simultaneously manipulate phonon scattering. Yttrium atoms create lattice distortions and point defects, which scatter phonons more effectively, thereby reducing the thermal conductivity. This decoupling of electrical and thermal transport properties is crucial. It allows for a significant increase in the thermoelectric figure of merit (ZT value), making Y-doped In2O3 a promising candidate for advanced thermoelectric applications, such as waste heat recovery systems and solid-state cooling devices, with potential to revolutionize energy conversion and utilization in a more efficient and sustainable manner. The combination of doping experimental studies and first-principles calculations can avoid the randomness and blindness of doping experiments. It significantly improves experimental efficiency. By using first-principles calculations, we can investigate the enhancement mechanism of the thermoelectric performance of indium oxide from a quantum microscopic perspective such as electrons. It helps to understand the interaction between dopants and the host lattice at an atomic level. We can predict the effects of different doping elements and concentrations on the electronic band structure, carrier concentration, and phonon scattering. This approach not only saves time and resources but also provides a deeper understanding and more accurate guidance for optimizing the thermoelectric properties of indium oxide, paving the way for the development of more efficient thermoelectric materials.
2. Experimental Section
The In2O3 (99.99%) powder and Y2O3 (99.99%) were meticulously combined in a predetermined molar ratio (YxIn2−xO3, x = 0, 0.005, 0.006, 0.007, 0.008, 0.009) and thoroughly ground to attain a homogeneous mixture. Subsequently, the blended powder underwent mechanical alloying within a ball mill. A stainless steel ball mill jar was used, thoroughly dried with sawdust and alcohol beforehand. Put the weighed powder into a ball milling tank for 10 h with a speed of 450 rpm and a ball/material ratio of 20:1, then add anhydrous ethanol, conduct ball milling with a planetary ball mill (QM-2SP12, Nanjing University Instrument Factory, Nanjing, China) for 1 h with a speed of 300 rpm, and then dry the obtained powder for more than 48 h at the temperature of 373 K. Then, place the obtained powder into a quartz tube, fill it with argon gas for protection, and seal it. Put it into a muffle furnace and calcine at 1473 K for 8 h. Crush the obtained sample and then perform discharge plasma sintering at the temperature of 1273 K with 30 min of insulation and a pressure of 60 MPa (ZPM-100E, Hubei Yangtze River Precision Materials Technology Co., Ltd., Ezhou, China). The volume density was measured by the Archimedes method. A diffractometer was used to characterize the phase structure of the material (Bruker AXS D8 diffractometer (Bruker AXS GmbH, Karlsruhe, Germany)). The diffraction analysis adopted Cu and rays with a wavelength of 1.5406 Å. Nickel plates were used as the substrate at the XRD sample stage with a diffraction angle range of 10–80°, a step size of 0.02°, a tube current of 20 mA, and a tube voltage of 40 kV. The electrical conductivity and Seebeck coefficient were tested using an electrical performance tester (ZEM-3, ULVAC KIKO, Tokyo, Japan). The carrier concentration and mobility at room temperature were measured by the van der Pauw method using the Hall-effect measurement system (HMS-5500, Ekopia, Seoul, Republic of Korea). The flash thermal conductivity tester used was LFA457 (Netzsch, Berlin, Germany), Germany, for thermal conductivity testing. The specific heat capacity (Cp) was determined by differential scanning calorimetry (DSC 404C, Netzsch, Berlin, Germany) under inert atmosphere. All the specimens were polished with two parallel planes and the plane close to the central part was utilized for Vickers hardness (HV) measurements, which were conducted on HV-10008 with a load of 25 g and a loading time of 15 s. Every sample was tested with 5 data points, and the average HV was used for characterizing mechanical properties. The uncertainty of the Vickers hardness was estimated to be within 5%. The uncertainty of the Seebeck coefficient and electrical conductivity measurements was 5%. The uncertainty of the thermal conductivity was estimated to be within 8%, considering the uncertainties regarding thermal diffusion coefficient, specific heat, and density. The combined uncertainty for all measurements involved in the calculation of ZT is less than 15%. The density functional calculation used here is the CASTEP 8.0 software package in the materials studio software 8.0, and the constructed 2 × 2 × 1 unit cell is calculated. The cut-off energy in plane wave expansion was 550 eV; the total energy was converged to less than 2.0 × 10⁻⁵ eV/atom. The maximum stress and maximum force were converged to less than 0.05 GPa and 0.3 eV/nm. The tolerance in the self-consistent field (SCF) calculation was set to 10−6 eV/atom. The specific experimental parameters and experimental instruments are described in the previous literature [23].
3. Results and Discussions
The relative densities were 97.13%, 97.21%, 97.19%, 97.26%, 97.22%, and 97.28% for x = 0, 0.005, 0.006, 0.007, 0.008, and 0.009, respectively. Figure 1 presents the XRD patterns and lattice constants of Y-doped In2O3 thermoelectric materials. Notably, the peaks fully matched the standard card of indium oxide (In2O3) (JCPDS No. 06-0416), indicating a high degree of phase purity. With Y doped in the matrix, the phonon scattering may change, potentially reducing the thermal conductivity [24,25]. Simultaneously, the modification of the electronic structure can impact the carrier concentration and effective mass, which in turn affect the electrical conductivity and Seebeck coefficient. The absence of impurity peaks validates the successful doping process and high sample quality. Y doping is a crucial factor that intricately correlates with the modifications in the thermoelectric properties of In2O3, opening avenues for further optimization and understanding of these materials for enhanced thermoelectric applications.
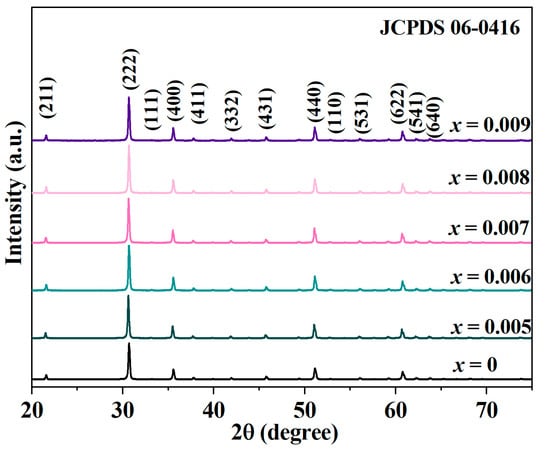
Figure 1.
X-ray diffraction characterization of yttrium-doped In2O3 thermoelectric materials.
In the context of Y-doped In2O3 thermoelectric materials, as depicted by Figure 2, an increase in electrical conductivity and carrier concentration is accompanied by a decrease in mobility. Yttrium doping serves as a powerful means to enhance the carrier concentration within the In2O3 lattice. In indium oxide (In2O3) thermoelectric materials, the increase in charge carrier concentration via isovalent substitution of In3+ by Y3+ is mainly attributed to donor levels induced by lattice defects, rather than the valence difference in traditional doping. The ionic radius of Y3+ (0.090 nm) is larger than that of In3+ (0.080 nm). After substitution, the surrounding lattice is squeezed. To balance lattice stress, some In3+ may deviate from lattice sites and form interstitial In. The outer electrons of interstitial In are not bound by lattice bonds and easily escape from atoms to become free electrons. This introduces donor levels in the band gap, significantly increasing electron carriers in the conduction band. This mechanism breaks the conventional understanding that “isovalent doping has no effect on carrier concentration” and realizes carrier regulation through structural defects rather than valence difference, which is a key path for optimizing the thermoelectric performance of In2O3-based materials. The substitution of In3+ ions with Y3+ ions acts as a source of additional electrons. Y3+, being a donor impurity, donates extra electrons to the conduction band (the band structure, density of states, and partial density of states are shown in Figure 3 and Figure 4). This supplementary electron supply substantially boosts the number of free carriers available for conduction [26,27]. As the doping intensity of Y rises, more Y3+ ions are integrated into the lattice structure, leading to a consistent elevation in carrier concentration. This increased carrier population forms the bedrock for the observed growth in electrical conductivity. In an electric field, a greater number of carriers implies a higher likelihood of electron movement and efficient charge transport, thereby directly translating into improved electrical conductivity. Y doping instigates profound modifications in the electronic band structure of In2O3. The alteration in lattice constant due to the incorporation of Y3+ ions triggers a cascade of changes in the interatomic distances and the potential energy distribution within the crystal. This, in turn, ripples through to the energy bands and the density of states. The modified band structure exerts a direct influence on the effective mass of carriers. A reduction in the effective mass endows carriers with enhanced mobility, as they experience diminished inertia and can navigate more freely within the lattice. Additionally, the perturbed band structure perturbs the position and contour of the Fermi level. This perturbation governs the carrier concentration and the probability of carrier excitation across the energy gap. The net outcome of these band structure modifications is a comprehensive readjustment of carrier properties, which is indelibly linked to the observed electrical conductivity and thermoelectric performance of Y-doped In2O3. Temperature emerges as a critical factor that intricately interacts with doping and the inherent material properties of Y-doped In2O3. At elevated temperatures, the intensity of lattice vibrations (phonons) surges. These phonons act as scattering agents for carriers, thereby curtailing mobility and, by extension, diminishing electrical conductivity. However, the carrier concentration also exhibits a temperature-dependent behavior. In specific instances, as the temperature ascends, additional carriers can be thermally excited from defect states or impurity levels. This thermal excitation can partially offset the reduction in mobility, presenting a complex interplay between temperature-induced changes in carrier concentration and mobility. In the context of Y-doped In2O3, the doping-induced alterations in lattice structure and carrier properties further complicate this relationship. The doping-induced changes can modify the temperature coefficient of electrical conductivity. For example, at particular doping levels, the material may exhibit a more stable electrical conductivity over a broader temperature range, a consequence of the harmonious equilibrium struck between carrier generation, mobility reduction, and lattice scattering. In summation, the observed trends in electrical conductivity, carrier concentration, and mobility of Y-doped In2O3 thermoelectric materials are the culmination of a complex web of interactions involving doping-induced carrier concentration increments, the dual-edged impact of lattice distortion on mobility, band structure modifications, and the nuanced interplay with temperature. A profound understanding of these mechanisms not only enriches our knowledge of the material’s fundamental physics but also paves the way for the strategic optimization of doping strategies and material properties. Looking at the electrical conductivity data under different Y doping amounts, as the temperature rises, the electrical conductivity of samples with each doping amount shows an upward trend, and the greater the Y doping amount, the more significant the increase in electrical conductivity. For example, at 300 K, the electrical conductivity of the sample with x = 0 is only 0.55 S·cm−1, while that of the sample with x = 0.009 reaches 161.02 S·cm−1, with a significant gap.
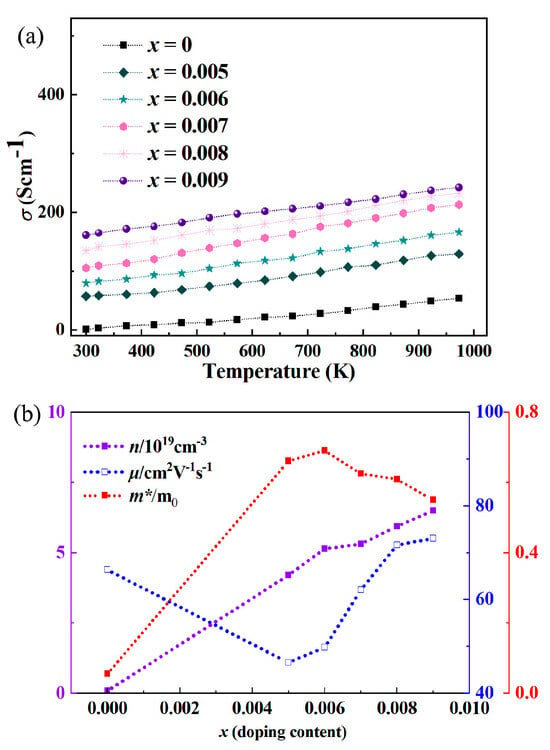
Figure 2.
(a) Electrical conductivity data and (b) electronic parameter analysis of yttrium-doped In2O3 thermoelectric materials.
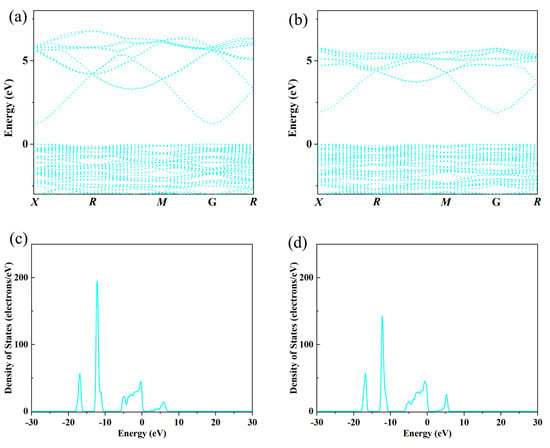
Figure 3.
Band structure and density of states: indium oxide (a,c) vs. Y-doped indium oxide (b,d) thermoelectric materials (the yttrium concentration is 0.00625).
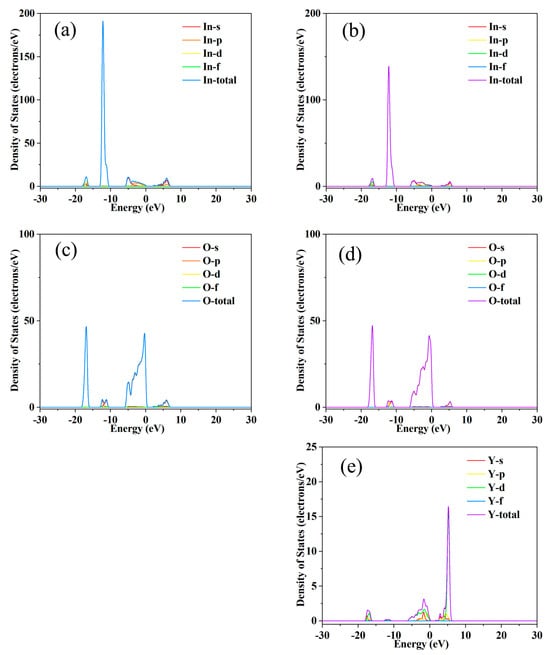
Figure 4.
Partial density of states calculation results for indium oxide thermoelectric materials (a,c) vs. Y-doped indium oxide (b,d,e) thermoelectric materials.
The Seebeck coefficient is a fundamental thermoelectric parameter that reflects the thermoelectric potential generated per unit temperature difference. In the context of Y-doped In2O3 thermoelectric materials, the observed decrease in the absolute value of the Seebeck coefficient, as depicted in Figure 5, can be attributed to several interrelated factors. (1) Excessive Carrier Concentration: Y doping leads to an increase in carrier concentration. However, when the carrier concentration becomes too high, it can cause a significant reduction in the Seebeck coefficient. At elevated carrier densities, carriers tend to interact more strongly with each other. These carrier–carrier interactions lead to energy equilibration among carriers, reducing the energy difference between them. The Seebeck effect relies on the energy difference of carriers in the presence of a temperature gradient to generate a thermoelectric voltage. With a diminished energy difference, the magnitude of the thermoelectric voltage generated per unit temperature difference decreases, resulting in a lower Seebeck coefficient. In Y-doped In2O3, if the doping level is not carefully controlled, the excessive introduction of carriers can overpower the beneficial effects of other factors and drive down the Seebeck coefficient. (2) Band Structure Degradation: Although Y doping initially modifies the band structure in ways that can enhance the Seebeck coefficient, over-doping or improper doping can lead to band structure degradation. The substitution of In3+ with Y3+ ions may introduce disorder in the lattice. This disorder can cause the broadening and flattening of energy bands near the Fermi level. A flattened band structure means a less pronounced variation in the density of states. As a result, the energy filtering effect, which is crucial for enhancing the Seebeck coefficient by preferentially scattering carriers with specific energies, becomes less effective. The weakened energy filtering leads to a more homogeneous distribution of carrier energies, reducing the ability to generate a significant thermoelectric voltage and, consequently, decreasing the Seebeck coefficient. (3) Enhanced Phonon–Electron Interaction: The lattice distortion caused by Y doping not only affects phonon scattering but also alters the phonon–electron interaction. In some cases, the increased scattering of phonons due to lattice distortion can lead to a stronger coupling between phonons and electrons. This enhanced interaction can cause carriers to lose their energy more quickly to the lattice vibrations. As carriers lose energy, their ability to contribute to the thermoelectric voltage generation based on the temperature gradient is compromised. The energy dissipation of carriers to the lattice via phonon–electron interactions reduces the effective energy available for thermoelectric transport, thereby leading to a decline in the Seebeck coefficient. (4) Temperature-Induced Effects: Temperature plays a significant role in modulating the Seebeck coefficient. At higher temperatures, the thermal energy can cause additional scattering mechanisms to come into play. For Y-doped In2O3, the lattice expansion with increasing temperature can further exacerbate the lattice distortion already caused by Y doping. This enhanced lattice distortion can disrupt the delicate balance of electronic and phonon properties that are essential for maintaining a high Seebeck coefficient. Additionally, the increased phonon population at higher temperatures can lead to more frequent phonon–carrier collisions, which not only reduce carrier mobility but also interfere with the thermoelectric voltage generation process. The cumulative effect of these temperature-induced changes is a decrease in the Seebeck coefficient, especially at elevated temperatures.
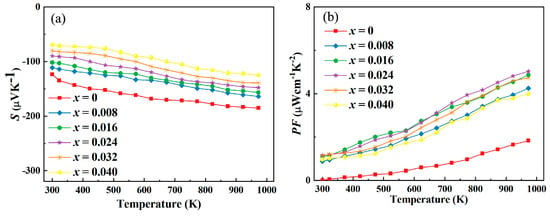
Figure 5.
(a). Variation in Seebeck coefficient and (b) calculated power factor for Y-doped In2O3 thermoelectric materials.
The observed increase in the power factor with the highest value from ~1.833 μW·cm−1·K−2 to ~4.983 μW·cm−1·K−2, as shown in Figure 5, can be attributed to several synergistic factors. Y doping effectively modulates the carrier concentration. By introducing an appropriate amount of Y3+ ions, the number of free carriers in the conduction band is adjusted to an optimal level. This optimization is crucial because it allows for a balance between electrical conductivity and the Seebeck coefficient. At the right carrier concentration, the electrical conductivity is enhanced without overly sacrificing the Seebeck coefficient. The increased number of carriers facilitates better charge transport, leading to an improvement in the overall power factor. In contrast to the situation where excessive carrier concentration might reduce the Seebeck coefficient, in this case, the doping level is carefully controlled to ensure a positive impact on the power factor. The incorporation of Y3+ ions not only tunes the carrier concentration but also impacts the mobility of carriers. Despite the fact that lattice distortion due to doping can initially introduce scattering centers, the overall effect on mobility can be mitigated. The increased carrier concentration can screen the scattering potential, resulting in a net increase in electrical conductivity. Higher electrical conductivity means more efficient transport of electrical charge in response to a temperature gradient, which directly contributes to a higher power factor. This enhanced conductivity, combined with a relatively stable Seebeck coefficient, leads to an overall improvement in the power factor of Y-doped In2O3. Y doping induces modifications in the electronic band structure. These alterations can lead to a more favorable distribution of electronic states near the Fermi level. The adjusted band structure can enhance the effective mass of carriers in a way that benefits both electrical conductivity and the Seebeck coefficient. A well-engineered band structure allows carriers to move more effectively and also contributes to a more pronounced thermoelectric effect.
The thermal conductivity of thermoelectric materials is a critical property that significantly impacts their overall thermoelectric performance. In the case of Y-doped In2O3 thermoelectric materials, as represented by Figure 6, the observed decrease in thermal conductivity can be attributed to several key factors. Y doping induces lattice distortion in the In2O3 crystal structure. The substitution of In3+ ions with Y3+ ions, which have different ionic radii, disrupts the regular lattice arrangement. This distortion creates numerous scattering centers for phonons, which are the carriers of heat in solids. Phonons experience more frequent collisions and scattering events as they propagate through the distorted lattice. These scattering processes impede the efficient transfer of heat, thereby reducing the thermal conductivity. The enhanced phonon scattering due to lattice distortion is a dominant mechanism contributing to the observed decline in thermal conductivity. As the doping concentration of Y increases, the extent of lattice distortion and, consequently, the phonon scattering probability also increase, leading to a more significant reduction in thermal conductivity. The introduction of Y3+ ions into the In2O3 lattice can generate point defects and dislocations. These imperfections act as additional barriers to phonon propagation. Point defects, such as vacancies or interstitial atoms, disrupt the continuity of the lattice and scatter phonons. Dislocations, which are line defects in the crystal structure, also introduce regions of local lattice strain and distortion. Phonons interacting with these dislocations experience scattering and energy dissipation. The combined effect of point defects and dislocations further inhibits the heat transfer process, contributing to the overall reduction in thermal conductivity. In Y-doped In2O3, the formation and density of these defects are influenced by the doping process and can be optimized to achieve the desired reduction in thermal conductivity for improved thermoelectric performance. Y doping may lead to the formation of nanostructures or influence the grain size and boundaries in the material. Nanostructures, such as nanoparticles or nanocrystals, introduce additional interfaces within the material. These interfaces act as effective phonon scattering sites. Grain boundaries, which separate different crystalline regions, also scatter phonons. The increased number and area of these interfaces due to nanostructuring or refined grain structure enhance the phonon scattering efficiency. Phonons find it more difficult to traverse across these interfaces, resulting in a decrease in thermal conductivity [24,28,29]. This effect can be harnessed to decouple the thermal and electrical transport properties in thermoelectric materials, as reducing thermal conductivity while maintaining or enhancing electrical conductivity is crucial for improving the thermoelectric figure of merit. Y doping can also modify the interaction between electrons and phonons. In a thermoelectric material, the movement of electrons and the propagation of phonons are interrelated. The altered electronic band structure due to Y doping can influence the coupling between electrons and phonons. In some instances, the doping may lead to a reduction in the electron–phonon interaction strength. This means that phonons are less likely to transfer their energy to electrons and vice versa. As a result, the heat carried by phonons is less likely to be dissipated through electronic channels, leading to a more efficient confinement of heat within the phonon subsystem and a consequent decrease in thermal conductivity. This modulation of the electron–phonon interaction provides an additional mechanism for controlling the thermal conductivity in Y-doped In2O3 thermoelectric materials. When yttrium (Y) is doped into indium oxide (In2O3) thermoelectric materials, the decrease in Young’s modulus as shown in Figure 7 exerts a notable influence on lowering thermal conductivity, which is critical for enhancing thermoelectric performance. Young’s modulus reflects a material’s stiffness. A reduced Young’s modulus indicates weakened atomic bonding strength in the doped system. This weaker bonding enhances lattice vibrations (phonon scattering).
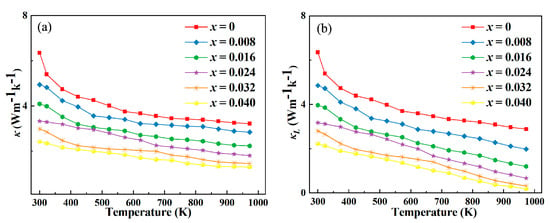
Figure 6.
(a). Variation in thermal conductivity (κ) and (b) lattice thermal conductivity (κL) for Y-doped In2O3 thermoelectric materials.
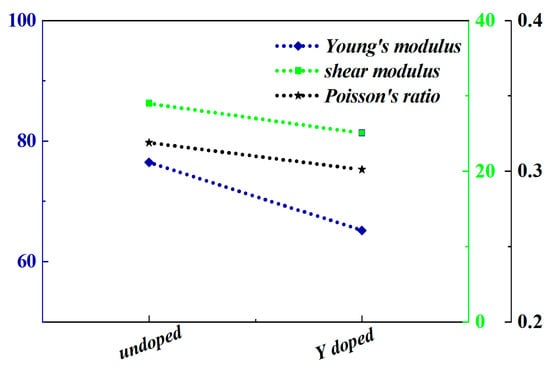
Figure 7.
The elastic parameters obtained through first-principles calculations of In2O3 before and after Y doping (the Yttrium concentration is 0.00625).
In the case of Y-doped In2O3 thermoelectric materials, the observed increase in ZT had the highest value from ~0.055 to ~0.275, as depicted in Figure 8a. When x = 0.008, the ZT value reaches the maximum in this system, which is one of the key characteristics of thermoelectric performance optimization in this study. From the perspective of carrier regulation, when x = 0.008, the moderate substitution of In3+ by Y3+ makes the carrier concentration of the material in the “optimal transmission range”—it not only avoids the low electrical conductivity caused by insufficient number of carriers at low concentration (x < 0.008), but also prevents the decrease in mobility caused by enhanced carrier scattering at high concentration (x > 0.008), realizing the optimal matching between electrical conductivity and Seebeck coefficient. From the perspective of heat transport, the lattice distortion introduced by an appropriate amount of Y doping can effectively scatter low-frequency and medium-frequency phonons, reducing the lattice thermal conductivity. However, when x exceeds 0.008, Y atoms may agglomerate locally, which instead weakens the phonon scattering effect and leads to a rise in lattice thermal conductivity. In addition, the synergistic effect of electrical conductivity, Seebeck coefficient, and thermal conductivity of the material at this concentration makes the ZT value (ZT = S2σT/κ, where S is Seebeck coefficient, σ is electrical conductivity, T is absolute temperature, and κ is total thermal conductivity) reach the peak. This is highly consistent with the core goal of this study, which is “optimizing the ZT value to improve thermoelectric performance”, and provides a key concentration reference for the subsequent performance regulation of Y-doped indium oxide thermoelectric materials. Y doping leads to an optimized power factor. As discussed earlier, it modulates carrier concentration and mobility, enhancing electrical conductivity while maintaining a reasonable Seebeck coefficient. The power factor, which is the product of the Seebeck coefficient and electrical conductivity, is thus improved. A higher power factor means the material can more effectively convert a temperature difference into electrical power. This directly contributes to the elevation of the ZT value. By carefully controlling the doping level and conditions, the power factor can be tuned to an optimal range, providing a strong foundation for enhancing the overall thermoelectric performance. The decrease in thermal conductivity, as analyzed previously, is another crucial factor. Lattice distortion, point defects, nanostructuring, and modified electron–phonon interactions all work together to impede heat transfer. A lower thermal conductivity ensures that a larger temperature gradient can be maintained across the material. This is vital as the thermoelectric effect relies on a significant temperature difference. With reduced heat dissipation, more of the temperature gradient is available for thermoelectric conversion, thereby enhancing the ZT value. The decoupling of electrical and thermal transport properties achieved through reducing thermal conductivity while enhancing electrical conductivity is a key strategy to boost the ZT value. Y doping-induced modifications in the band structure not only affect the power factor but also influence carrier transport and scattering. The adjusted band structure can optimize the energy distribution of carriers, reducing their scattering and improving their effective utilization for thermoelectric conversion. This fine-tuning of carrier behavior within the material further enhances the overall thermoelectric efficiency and contributes to the increase in ZT. The ability to engineer the band structure through doping provides a powerful means to manipulate the thermoelectric properties and achieve higher ZT values in Y-doped In2O3 materials. The enhancement of the dimensionless thermoelectric figure of merit in Y-doped In2O3 is a result of the combined effects of optimizing the power factor, reducing thermal conductivity, and engineering the band structure and carrier transport. These factors work in harmony to improve the material’s ability to convert heat into electricity efficiently, making Y-doped In2O3 a promising candidate for various thermoelectric applications where high-performance materials are required. The increase in Vickers hardness of Y-doped In2O3 thermoelectric materials, as shown in Figure 8b, can be attributed to multiple factors. Y doping induces lattice distortion. The substitution of In3+ with Y3+ ions, which have different ionic radii, disrupts the regular lattice arrangement. This distortion leads to an increase in internal stress within the crystal structure. The material’s resistance to deformation under an applied load is enhanced as a result, thereby increasing the hardness. They can act as reinforcing agents, impeding the movement of dislocations and enhancing the overall hardness [30,31]. The Vickers hardness of indium oxide thermoelectric material increased from ~172.1 HV to ~252 HV.
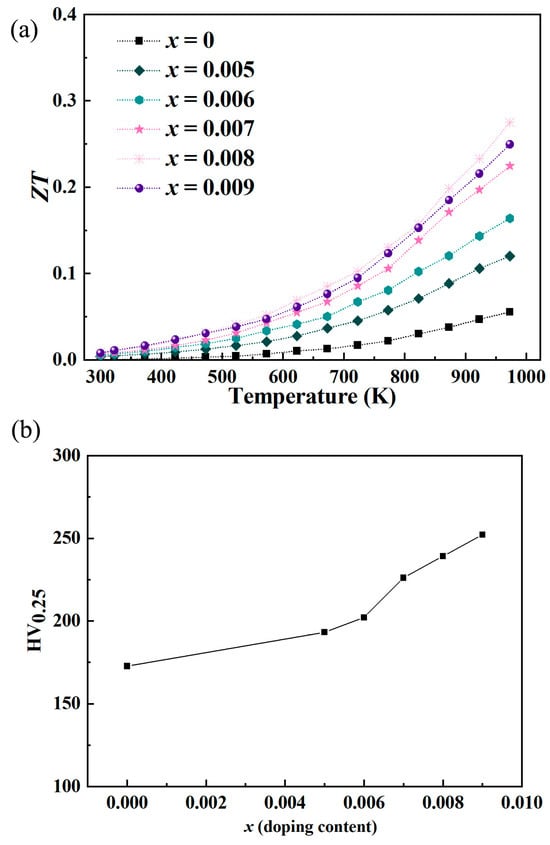
Figure 8.
(a) Variation in the dimensionless figure of merit (ZT) and (b) Vickers hardness for Y-doped In2O3 thermoelectric materials.
4. Conclusions
This study comprehensively investigated the influence mechanism of Y-doped In2O3 thermoelectric materials. Y doping exerts a profound impact on multiple aspects of the material’s properties. Regarding the electrical properties, Y doping optimizes the carrier concentration and mobility. By substituting In3+ with Y3+, it modifies the electronic band structure. This leads to an enhanced power factor, as the Seebeck coefficient and electrical conductivity are both favorably adjusted. The lattice distortion caused by doping, while initially affecting mobility, is mitigated by carrier screening at appropriate doping levels, resulting in improved electrical conductivity. In terms of thermal conductivity, the lattice distortion, formation of point defects and dislocations, nanostructuring, and modified electron–phonon interactions work in concert to reduce heat transfer. This decrease in thermal conductivity is crucial for maintaining a large temperature gradient, which is essential for efficient thermoelectric conversion. The mechanical property of Vickers hardness is also enhanced. Lattice distortion increases internal stress, and the formation of solid solutions, secondary phases, and refined grain structure due to Y doping all contribute to impeding dislocation movement and enhancing the material’s resistance to deformation. Y doping in In2O3 is a powerful strategy to decouple and optimize the electrical and thermal transport properties and improve mechanical robustness. This research provides valuable insights for the design and development of high-performance thermoelectric materials, paving the- way for their enhanced application in energy conversion and other related fields. Future work could focus on further fine-tuning the doping parameters and exploring additional doping elements to achieve even more remarkable thermoelectric performance.
Author Contributions
Methodology, B.Y., H.Z. and Y.C.; Software, B.Y., Z.H., T.T., H.Z. and Y.C.; Validation, Z.H. and T.T.; Formal analysis, J.Z., M.G., Z.Y., W.L. (Wenzheng Li) and S.Y.; Investigation, B.F., M.G., W.L. (Wenji Lv), Z.Y., W.L. (Wenzheng Li) and S.Y.; Resources, T.X., J.Z., B.F., S.P. and W.L. (Wenji Lv); Data curation, T.X. and S.P.; Writing—original draft, T.X., J.Z., B.Y., H.Z. and Y.C.; Writing—review & editing, J.Z., B.Y. and Y.C. All authors have read and agreed to the published version of the manuscript.
Funding
The work is supported by the Natural Science Foundation of Hubei Province (2021CFB009), the guiding project of Hubei Province in 2022 (B2022313), the Double Hundred Project of Hubei University of Science and Technology in 2023, Research on the Coordinated Development of Vocational Education and County Economy (HBZJ2022198), Empirical Study on the Collaborative Development Path of Health and Wellness Industry in Xianning City under the Background of “5 + 5” Industrial Upgrading (2025xj004), and the Key Teaching and Research Project of Hubei University of Science and Technology in 2023.
Institutional Review Board Statement
Not applicable.
Informed Consent Statement
Not applicable.
Data Availability Statement
The original contributions presented in this study are included in the article. Further inquiries can be directed to the corresponding author.
Conflicts of Interest
Author Bo Feng was employed by the Hubei Xiangcheng Weibo Technology Co., Ltd. and Hubei Numa New Energy Technology Co., Ltd. The remaining authors declare that the research was conducted in the absence of any commercial or financial relationships that could be construed as a potential conflict of interest.
References
- Huang, L.; Zheng, Y.; Xing, L.; Hou, B. Recent progress of thermoelectric applications for cooling/heating, power generation, heat flux sensor and potential prospect of their integrated applications. Therm. Sci. Eng. Prog. 2023, 45, 102064. [Google Scholar] [CrossRef]
- He, B.; Zhang, K.; Zhu, M. Engineering of copper sulfide-based nanomaterials for thermoelectric application. Green Energy Environ. 2025, 10, 619–688. [Google Scholar] [CrossRef]
- Prunet, G.; Pawula, F.; Fleury, G.; Cloutet, E.; Robinson, A.J.; Hadziioannou, G.; Pakdel, A. A review on conductive polymers and their hybrids for flexible and wearable thermoelectric applications. Mater. Today Phys. 2021, 18, 100402. [Google Scholar] [CrossRef]
- Kwon, C.; Lee, S.; Won, C.; Lee, K.H.; Kim, M.; Lee, J.; Yang, S.J.; Lee, M.; Lee, S.; Yoon, K.; et al. Multi-functional and stretchable thermoelectric Bi2Te3 fabric for strain, pressure, and temperature-sensing. Adv. Funct. Mater. 2023, 33, 2300092. [Google Scholar] [CrossRef]
- Yu, H.; Hu, Z.; He, J.; Ran, Y.; Zhao, Y.; Yu, Z.; Tai, K. Flexible temperature-pressure dual sensor based on 3D spiral thermoelectric Bi2Te3 films. Nat. Commun. 2024, 15, 2521. [Google Scholar] [CrossRef]
- Yu, Y.; Sheskin, A.; Wang, Z.; Uzhansky, A.; Natanzon, Y.; Dawod, M.; Abdellaoui, L.; Schwarz, T.; Scheu, C.; Wuttig, M.; et al. Ostwald ripening of Ag2Te precipitates in thermoelectric PbTe: Effects of crystallography, dislocations, and interatomic bonding. Adv. Energy Mater. 2024, 14, 2304442. [Google Scholar]
- Qin, C.; Cheng, L.; Xiao, Y.; Wen, C.; Ge, B.; Li, W.; Pei, Y. Substitutions and dislocations enabled extraordinary n-type thermoelectric PbTe. Mater. Today Phys. 2021, 17, 100355. [Google Scholar] [CrossRef]
- Toko, K.; Maeda, S.; Ishiyama, T.; Nozawa, K.; Murata, M.; Suemasu, T. Layer exchange synthesis of sige for flexible thermoelectric generators: A comprehensive review. Adv. Electron. Mater. 2024, 10, 2400130. [Google Scholar] [CrossRef]
- Shtern, M.Y.; Sherchenkov, A.A.; Shtern, Y.I.; Rogachev, M.S.; Babich, A.V. Thermoelectric properties and thermal stability of nanostructured thermoelectric materials on the basis of PbTe, GeTe, and SiGe. Nanobiotechnol. Rep. 2021, 16, 363–372. [Google Scholar] [CrossRef]
- Jan, R.; Fayaz, M.; Ayoub, N.; Islam, I.; Ghosh, S.; Rubab, S.; Khandy, S.A. Oxide thermoelectric materials: A review of emerging strategies for efficient waste heat recovery. J. Power Sources 2025, 654, 237806. [Google Scholar] [CrossRef]
- Zhang, P.; Lou, Z.; Gong, L.; Wu, Z.; Chen, X.; Xu, W.; Wang, Y.; Xu, J.; Dashevsky, Z.; Gao, F. Development and applications of thermoelectric oxide ceramics and devices. Energies 2023, 16, 4475. [Google Scholar] [CrossRef]
- Caballero-Calero, O.; Ares, J.R.; Martín-González, M. Environmentally friendly thermoelectric materials: High performance from inorganic components with low toxicity and abundance in the earth. Adv. Sustain. Syst. 2021, 5, 2100095. [Google Scholar] [CrossRef]
- Acharya, M.; Jana, S.S.; Ranjan, M.; Maiti, T. High performance (ZT > 1) n-type oxide thermoelectric composites from earth abundant materials. Nano Energy 2021, 84, 105905. [Google Scholar]
- Peng, L.; Miao, N.; Wang, G.; Zhou, J.; Elliott, S.R.; Sun, Z. Novel metal oxides with promising high-temperature thermoelectric performance. J. Mater. Chem. C 2021, 9, 12884–12894. [Google Scholar] [CrossRef]
- Wu, H.; Chen, L.; Ning, S.; Zhao, X.; Deng, S.; Qi, N.; Ren, F.; Chen, Z.; Tang, J. Extremely low thermal conductivity and enhanced thermoelectric performance of porous Gallium-doped In2O3. ACS Appl. Energy Mater. 2021, 4, 12943–12953. [Google Scholar] [CrossRef]
- She, X.; Xiong, T.; Wang, Z.; Cai, G.; Chen, Y.; Sun, Y.; Zheng, Z.; Zhou, G.; Feng, B. The influence mechanism of rare earth element doping on the electron/phonon transport performances of In2O3 based thermoelectric materials. Results Phys. 2024, 60, 107660. [Google Scholar] [CrossRef]
- Feng, B.; Xu, Y.; Yang, S.; Ruan, R.; Zhang, R. Correlation-based influence mechanism of aluminum doping on the thermoelectric properties of In2O3-based materials. J. Mater. Sci. Mater. Electron. 2025, 36, 253. [Google Scholar] [CrossRef]
- Hsin, C.L.; Hsiao, J.C.; Chen, Y.M.; Lee, S.W. Thermoelectric properties of Zn-and Ce-alloyed In2O3 and the effect of SiO2 nanoparticle additives. Nanotechnology. 2022, 33, 135712. [Google Scholar]
- Wang, D.; Wu, H.; Chen, X.; Qi, N.; Jiang, M.; Chen, Z. Enhanced Thermoelectric Performance in Ga-Doped In2O3 through Synergistic Optimization of Carrier Concentration and Lattice Thermal Conductivity. ACS Appl. Energy Mater. 2025, 8, 7467–7474. [Google Scholar] [CrossRef]
- Klich, W.; Ohtaki, M. Thermoelectric properties of Mo-doped bulk In2O3 and prediction of its maximum ZT. Ceram. Int. 2021, 47, 18116–18121. [Google Scholar] [CrossRef]
- Ahmad, A.; Hussain, M.; Zhou, Z.; Liu, R.; Lin, Y.-H.; Nan, C.-W. Thermoelectric performance enhancement of vanadium doped n-type In2O3 ceramics via carrier engineering and phonon suppression. ACS Appl. Energy Mater. 2019, 3, 1552–1558. [Google Scholar]
- Liu, Y.; Lin, Y.H.; Lan, J.; Xu, W.; Zhang, B.-P.; Nan, C.-W.; Zhue, H. Effect of transition-metal cobalt doping on the thermoelectric performance of In2O3 ceramics. J. Am. Ceram. Soc. 2010, 93, 2938–2941. [Google Scholar]
- Zhao, H.; Luo, X.; She, X.; An, Q.; Peng, Y.; Cai, G.; Liu, Y.; Tang, Y.; Feng, B. Study on the physical mechanism of thermoelectric transport on the properties of ZnO ceramics. Results Phys. 2023, 54, 107072. [Google Scholar] [CrossRef]
- Qian, X.; Zhou, J.; Chen, G. Phonon-engineered extreme thermal conductivity materials. Nat. Mater. 2021, 20, 1188–1202. [Google Scholar] [CrossRef]
- Yang, X.; Tiwari, J.; Feng, T. Reduced anharmonic phonon scattering cross-section slows the decrease of thermal conductivity with temperature. Mater. Today Phys. 2022, 24, 100689. [Google Scholar] [CrossRef]
- Shu, A.; Qin, C.; Li, M.; Zhao, L.; Shangguan, Z.; Shu, Z.; Yuan, X.; Zhu, M.; Wu, Y.; Wang, H. Electric effects reinforce charge carrier behaviour for photocatalysis. Energy Environ. Sci. 2024, 17, 4907–4928. [Google Scholar] [CrossRef]
- Meng, Z.; Zhang, T.; Zhang, C.; Dang, Z.M.; Chi, Q. Optimizing energy storage performance in polymer dielectrics through dual strategies: Constructing “peaked” barrieras and enhancing carrier scattering. Adv. Funct. Mater. 2024, 34, 2403402. [Google Scholar] [CrossRef]
- Zhao, Y.; Zeng, X.; Ren, L.; Xia, X.; Zeng, X.; Zhou, J. Heat conduction of electrons and phonons in thermal interface materials. Mater. Chem. Front. 2021, 5, 5617–5638. [Google Scholar] [CrossRef]
- Feng, T.; Zhou, H.; Cheng, Z.; Larkin, L.S.; Neupane, M.R. A critical review of thermal boundary conductance across wide and ultrawide bandgap semiconductor interfaces. ACS Appl. Mater. Interfaces 2023, 15, 29655–29673. [Google Scholar] [CrossRef] [PubMed]
- Kumar, J.; Linda, A.; Sadhasivam, M.; Pradeep, K.G.; Gurao, N.P.; Biswas, K. The effect of Al addition on solid solution strengthening in CoCrFeMnNi: Experiment and modelling. Acta Mater. 2022, 238, 118208. [Google Scholar]
- Wang, M.X.; Zhu, H.; Yang, G.J.; Liu, K.; Li, J.F.; Kong, L.T. Solid-solution strengthening effects in binary Ni-based alloys evaluated by high-throughput calculations. Mater. Des. 2021, 198, 109359. [Google Scholar] [CrossRef]
Disclaimer/Publisher’s Note: The statements, opinions and data contained in all publications are solely those of the individual author(s) and contributor(s) and not of MDPI and/or the editor(s). MDPI and/or the editor(s) disclaim responsibility for any injury to people or property resulting from any ideas, methods, instructions or products referred to in the content. |
© 2025 by the authors. Licensee MDPI, Basel, Switzerland. This article is an open access article distributed under the terms and conditions of the Creative Commons Attribution (CC BY) license (https://creativecommons.org/licenses/by/4.0/).