Article

Synthesis and Biological Evaluation of Novel Mixed-Ligand 99mTc-Labeled Anthraquinone Complexes as Potential DNA-Targeted Imaging Agents

by
Theofanis Matthaios Migkos
1,
Pigi Glykofridi
1,
Georgios Paparidis
1,
George Psomas
2,
Ioannis S. Vizirianakis
3,4,
Catherine Gabriel
5,6,
Dimosthenis Sarigiannis
5,6,
Ioannis Iakovou
7 and
Dionysia Papagiannopoulou
1,*
1
Laboratory of Pharmaceutical Chemistry, School of Pharmacy, Faculty of Health Sciences, Aristotle University of Thessaloniki, GR-54124 Thessaloniki, Greece
2
Department of General and Inorganic Chemistry, Faculty of Chemistry, Aristotle University of Thessaloniki, GR-54124 Thessaloniki, Greece
3
Laboratory of Pharmacology, School of Pharmacy, Faculty of Health Sciences, Aristotle University of Thessaloniki, GR-54124 Thessaloniki, Greece
4
Department of Health Sciences, School of Life & Health Sciences, University of Nicosia, Nicosia 1700, Cyprus
5
Environmental Engineering Laboratory, Department of Chemical Engineering, Aristotle University of Thessaloniki, GR-54124 Thessaloniki, Greece
6
HERACLES Research Center on the Exposome and Health, Center for Interdisciplinary Research and Innovation, Balkan Center, Bldg. B, 10th km Thessaloniki-Thermi Road, GR-57001 Thessaloniki, Greece
7
Laboratory of Nuclear Medicine, AHEPA General Hospital, Aristotle University of Thessaloniki, GR-54124 Thessaloniki, Greece
*
Author to whom correspondence should be addressed.
Inorganics 2025, 13(11), 368; https://doi.org/10.3390/inorganics13110368
Submission received: 30 September 2025 / Revised: 22 October 2025 / Accepted: 28 October 2025 / Published: 3 November 2025

Abstract

Anthraquinones are molecules with numerous biological properties that can act as DNA intercalators and topoisomerase IIa inhibitors. In this work, the development of technetium-99m radiotracers was pursued via the technetium-tricarbonyl “2 + 1” mixed-ligand approach, fac-[99mTc][TcI(CO)3(NN′)(N)]+, with a (N,N′) bidentate chelator and a N co-ligand. In one approach, the ligands used were 2,2′-bipyridine (bpy) and N-functionalized-imidazole, where imidazole was conjugated to an anthraquinone moiety. In the other approach, 2-picolylamine and imidazole were used as the mixed-ligand system, where picolylamine was conjugated to an anthraquinone moiety. The synthesis of the ligands was achieved by reaction of 2-picolylamine with a suitably functionalized anthraquinone (Aqpa) or anthrapyrazole (Appa) and imidazole with a suitably functionalized anthraquinone (Aqim). The rhenium reference compounds, fac-[ReI(CO)3(bpy)(Aqim)]+ with bpy as a bidentate chelator and fac-[ReI(CO)3(Aqpa or Appa)(Im)]+, with imidazole (Im) as a co-ligand, were synthesized and characterized with spectroscopic methods. The radiotracer technetium-99m complexes fac-[99mTc][Tc(CO)3(bpy)(Aqim)]+ and fac-[99mTc][Tc(CO)3(Aqpa or Appa)(Im)]+ were prepared and characterized with standard methods. The purified radiotracers displayed high stability (≥90%) after incubation 24 h in 1 mM L-histidine or rat plasma. The tracers’ cell uptake was evaluated in vitro in CT-26 cells, and their pharmacokinetic properties and tumor uptake were evaluated in vivo in CT26-tumor-bearing mice. The “2 + 1” technetium-tricarbonyl approach leads to in vitro stable tracers, and this mixed-ligand system shows promise for further evaluation.

1. Introduction

Technetium-99m is a radionuclide widely used in nuclear medicine with Single Photon Emission Computerized Tomography (SPECT) for diagnostic imaging due to the following advantages: its facile and low-cost production through the 99Mo/99mTc generators, its optimal nuclear properties (t1/2 = 6.02 h, = 141 keV) and its versatile chemical behavior. It can form structurally distinct complexes in various oxidation states, such as the oxotechnetium complexes in oxidation state V with a variety of donor atoms and ligands forming square planar, trigonal bipyramidal or octahedral complexes. This oxidation state has been used at large for the development of 99mTc radiopharmaceutical kits for the functional or anatomical imaging of many organs and tissues [1,2,3].
Technetium-99m tricarbonyl complexes, another extensively studied area of technetium chemistry, are formed from the organometallic fac-[99mTc][Tc(CO)3(H2O)3]+ precursor, where the metal is in oxidation state I and adopts a low-spin d6 configuration. The precursor contains three kinetically inert Tc-CO bonds and three labile H2O ligands that can be replaced by mono-, bi- or tridentate ligands—with a variety of donor atoms. The preparation of these complexes is achieved in high yields and purities, and these complexes exhibit excellent in vitro and in vivo stability. These features make tricarbonyl-based Tc(I) core a flexible and potent foundation for the development of target-specific SPECT radiopharmaceuticals [4,5,6]. As a result, a lot of effort has been poured into the development of 99mTc-tricarbonyl radiopharmaceuticals for a wide range of applications [7]. Specifically, the most notable example of clinical success is 99mTc-MIP-1404, a complex of the general structure of tricarbonyltechnetium(N,N,N-bis(imidazolylmethyl)amine), substituted with a moiety suitable for targeting the prostate-specific membrane antigen (PSMA). This radiotracer has been under clinical evaluation for the molecular imaging of prostate cancer and was recently approved by the Medicines and Healthcare products Regulatory Agency (MHRA), making it the first tricarbonyltechnetium licensed radiopharmaceutical [8,9,10].
The family of anthraquinone-based molecules includes anthracenediones such as mitoxantrone and pixantrone, anthracyclines such as doxorubicin and plant-derived anthraquinones like emodin. Anthraquinones are bioactive molecules with a planar structure suitable for intercalation between the base pairs of the double-stranded DNA, while they may also act as DNA topoisomerase II poisons or generate cytotoxic reactive oxygen species and inhibit kinases [11,12]. Extensive evaluation of anthraquinones has indicated a plethora of actions in various critical cellular systems that lead to cell-cycle arrest and apoptosis. Therefore, anthraquinones’ biological activity combines DNA-directed cytotoxicity, signal-modulatory activity and redox reactivity, making them attractive scaffolds for antitumor drug development with improved therapeutic indices [13,14].
Anthraquinone-based scaffolds have been exploited for the development of diagnostic radiopharmaceuticals. Their planar π-systems exhibit high DNA intercalating affinity, which has been used to image necrosis via exposed DNA-binding, for the detection of heart infarcts, as, for example, with 131I-rhein [15,16,17]. 99mTc-labeled anthraquinones and other planar scaffolds with DNA-binding affinities have been exploited for tumor imaging as well as radiotherapy via the emission of Coster–Kronig electrons [18,19,20]. Anthraquinones can be readily labeled with a plethora of radioisotopes; they exhibit rapid blood clearance and suitable pharmacokinetics for SPECT or PET images [21,22]. In addition, significant efforts have been made to develop anthraquinone-based molecules, such as anthrapyrazoles and doxorubicin, conjugated to suitable chelators for tricarbonyltechnetium-99m labeling. The nonradioactive rhenium analogs of these complexes have shown promise for their biological activities, a fact that justifies further interest in their exploitation [23,24].
In our recent work, we developed a series of tricarbonylrhenium anthrapyrazole complexes and studied them as DNA-intercalators and cytotoxic agents [24]. Out of this series, the complex where anthrapyrazole was conjugated to picolylamine (N,N′) bidentate chelator, fac-[Re(CO)3(κ2-Ν.Ν′)Br], exhibited high cytotoxicity, and its 99mTc-analog exhibited a promising in vitro and in vivo tumor uptake. In continuation, the goal herein is to evaluate the biological and pharmacokinetic properties of a series of 99mTc-tricarbonyl anthraquinone and anthrapyrazole complexes as tumor imaging agents. For this study, we utilized the mixed-ligand platform of the general formula fac-[99mTc][Tc(CO)3(N,N′)(N)]+, where (N,N′) is picolylamine or 2,2′-bipyridine and where (N) is an imidazolyl ligand. The introduction of the monodentate N-donating ligand is considered beneficial to improve the pharmacokinetics of the corresponding complexes, given the fact that [99mTc][Tc(CO)3(N,N′)]+ exhibits slower blood clearance and high hepatobiliary uptake [25]. Furthermore, in this work, we evaluated the efficiency of the [99mTc][Tc(CO)3(N,N′)(N)]+ platform to accommodate the anthraquinone or anthrapyrazole pharmacophore, conjugated either on the bidentate chelator or on the monodentate chelator (Figure 1).

2. Results and Discussion

2.1. Synthesis and Spectroscopic Characterization of Rhenium Complexes
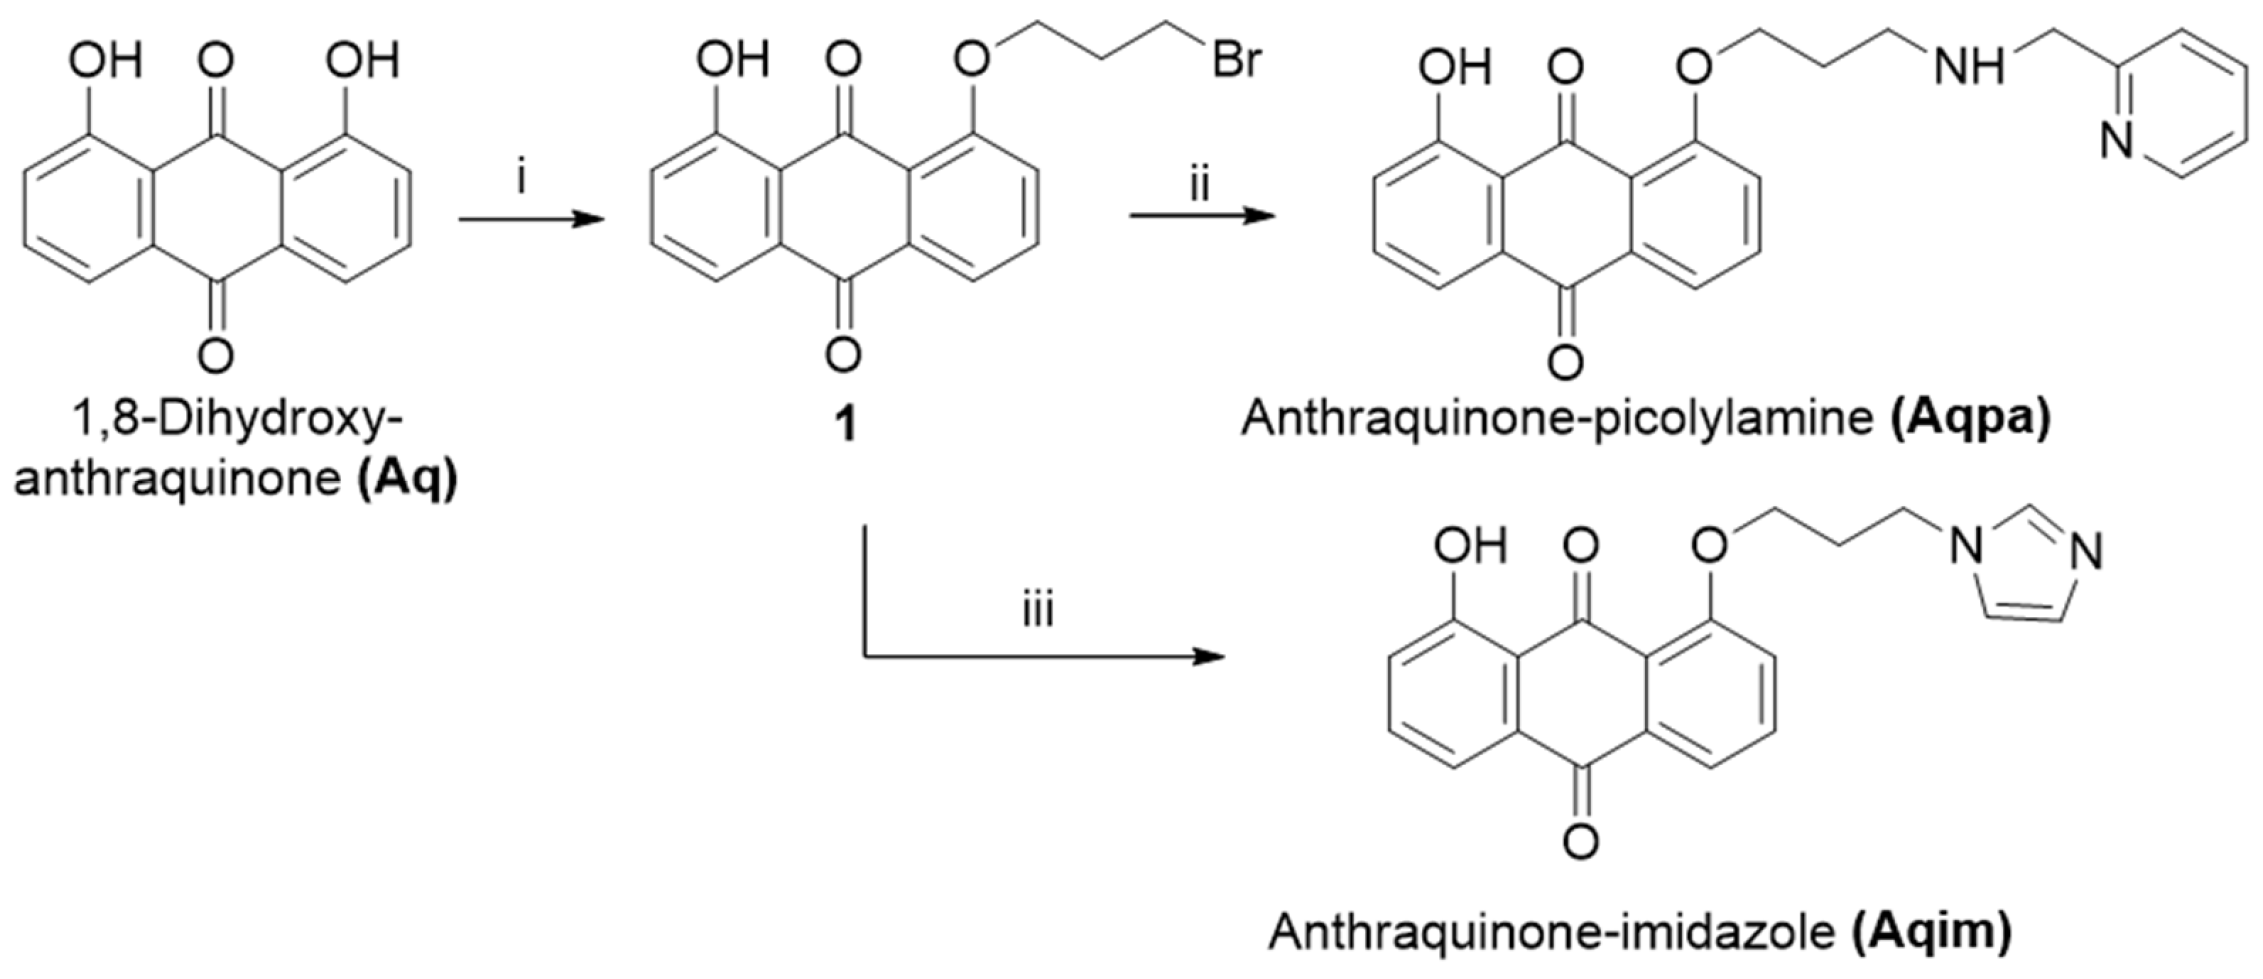
The anthraquinone ligands were synthesized from 1,8-dihydroxy-anthraquinone (Aq) by reaction with 1,3-dibromopropane, and the monosubstituted product 1 was obtained. This intermediate product was then conjugated on 2-picolylamine (Pa) to form the bidentate ligand Aqpa or on imidazole (Im) to form the monodentate ligand Aqim. The synthesis of the ligands is shown in Scheme 1.
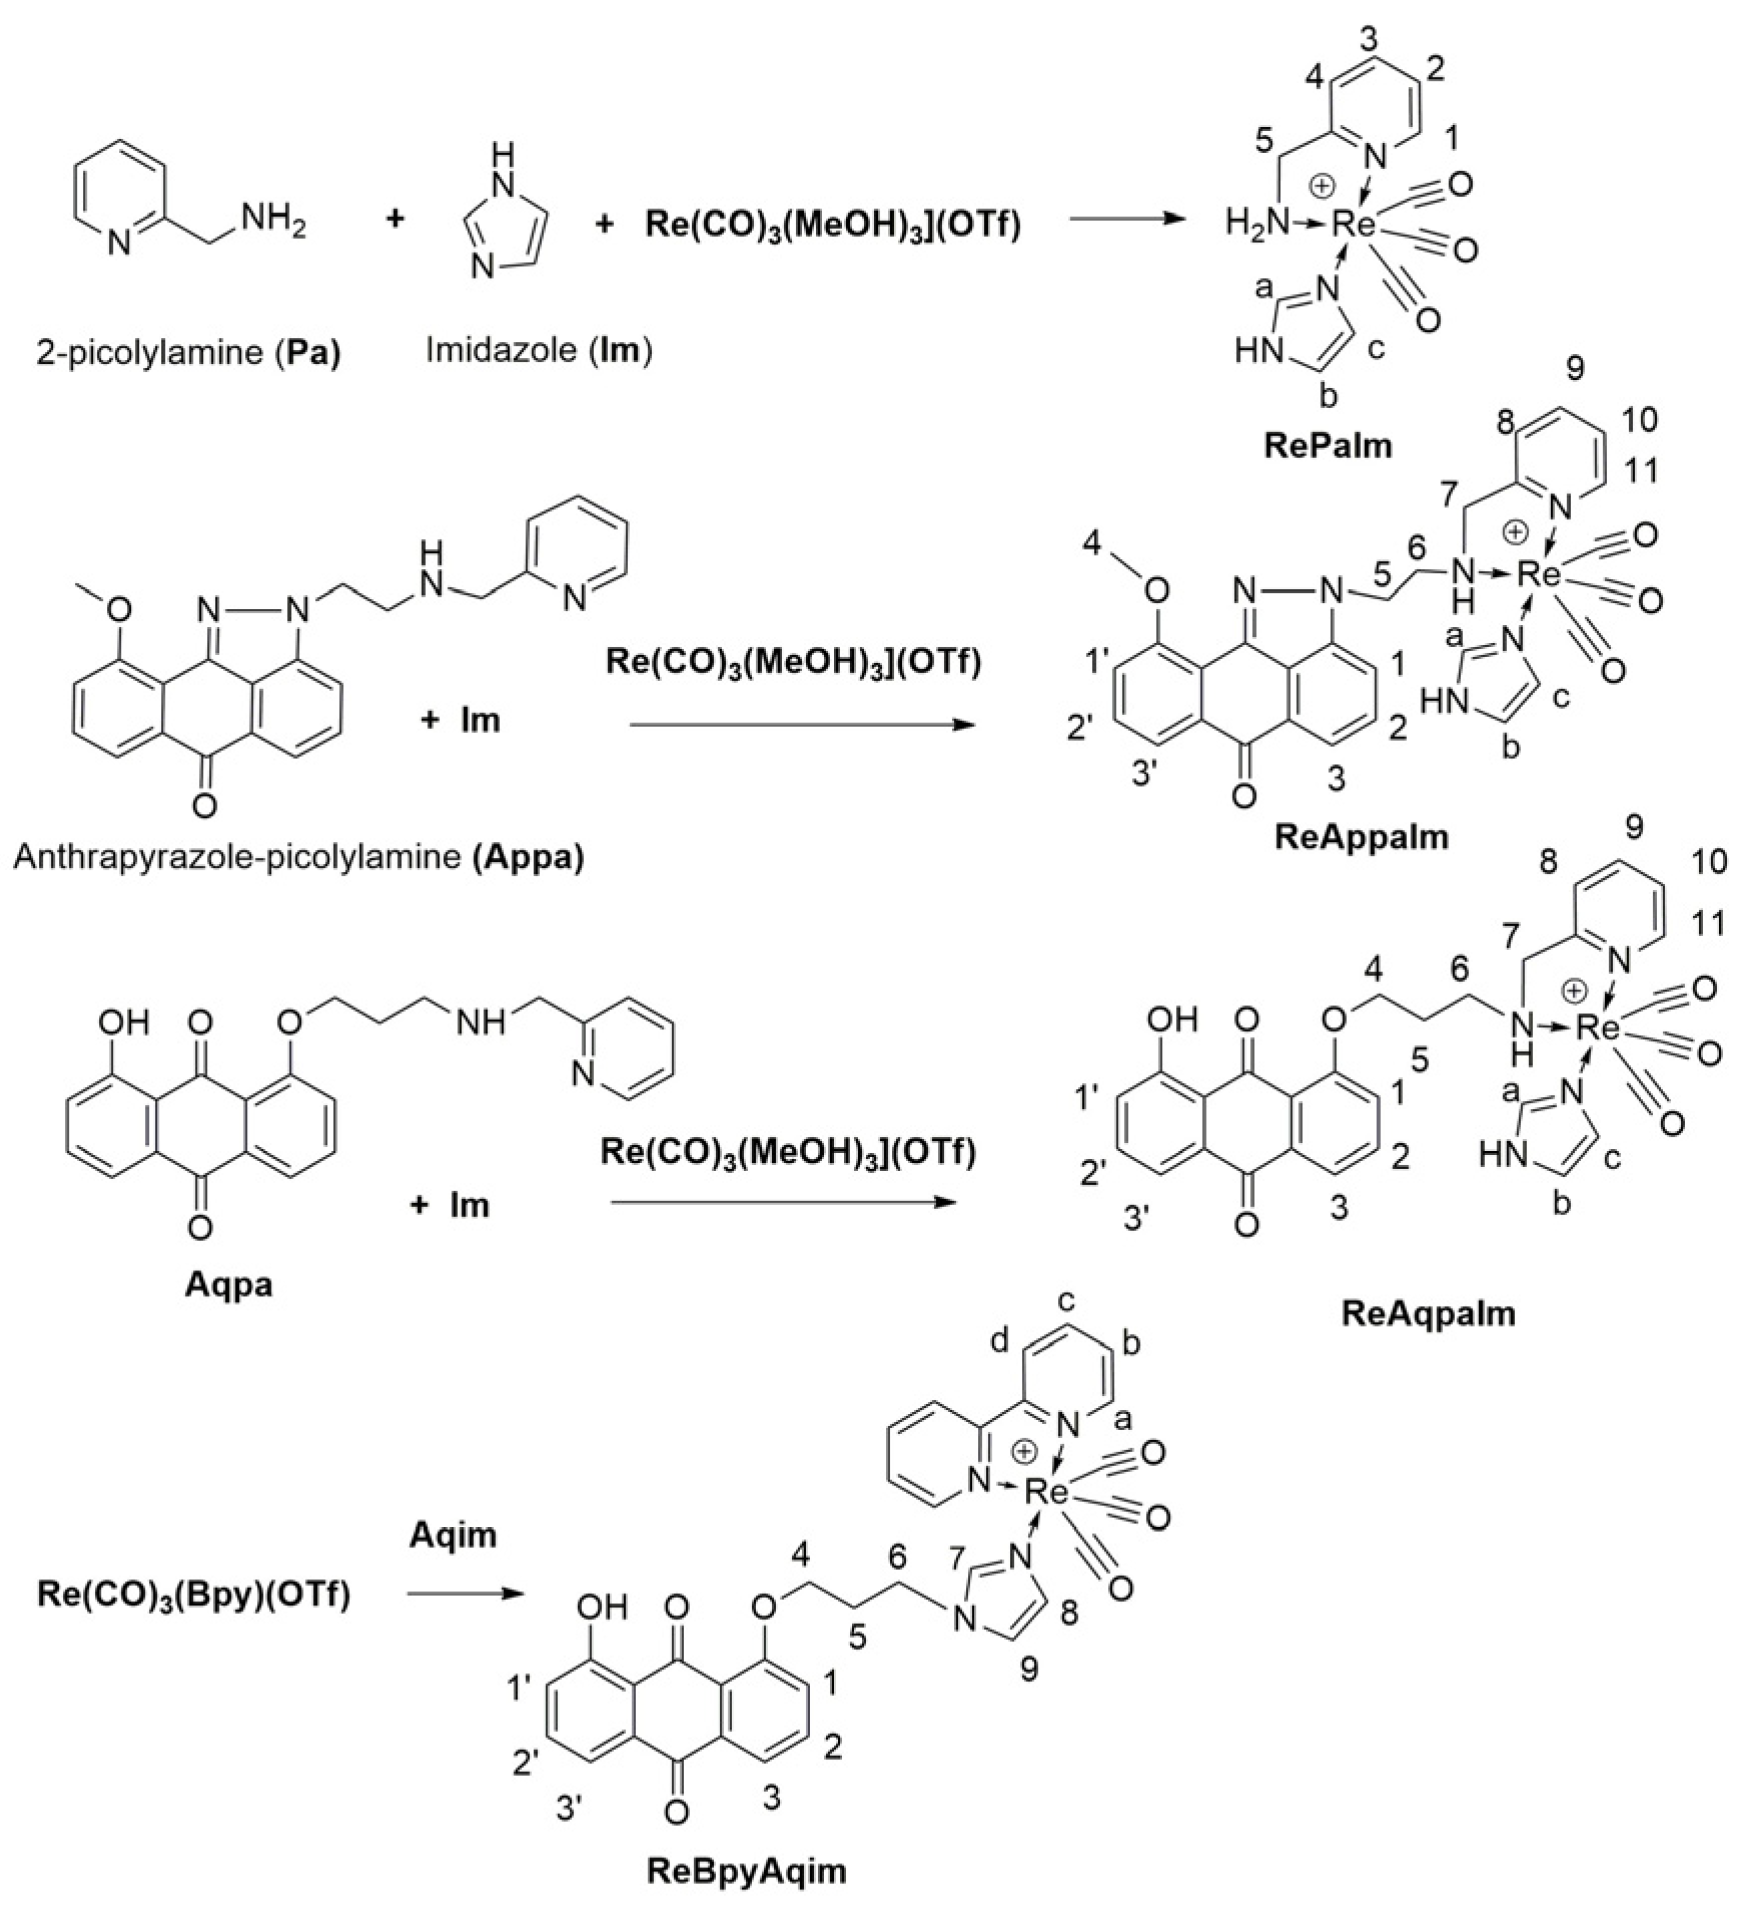
The mixed-ligand tricarbonylrhenium complexes were prepared either in one-step or two-step procedures (Scheme 2). Initially, the prototype complex fac-[Re(CO)3(Pa)(Im)]OTf (RePaIm) was prepared by reaction of the precursor fac-[Re(CO)3(MeOH)3]OTf with an equimolar amount of picolylamine (Pa) and heating for 2 h, followed by the addition of imidazole (Im) equimolarly and continuing the heating for 2 days. The same product was also prepared in one step by the simultaneous addition and heating of the three components, Re-precursor, Pa and Im, for 1 day. The yield of both reactions was similar according to HPLC analysis, and the purified product was isolated in a low overall yield of 16%. The low yield is attributed to the presence of by-products, which required multiple chromatographic purifications. The analysis of the complex indicated the presence of C≡O stretching vibration at 2027 and 1905 cm−1 in the infrared spectrum, and the corresponding proton signal in the 1H NMR spectrum. Particularly, the picolylamine protons exhibit two doublet-of-triplet signals at 4.38 and 4.09 ppm, which correspond to the two methylene protons and two broad multiplet signals at 5.89 and 4.81 ppm, which also correspond to the two amine protons; overall, the signals of the other pyridine ring protons indicate the coordination of Pa as a bidentate chelator. Furthermore, the presence of imidazole is evident by the three singlets at 7.79, 7.18 and 6.80 ppm.
The analogous rhenium mixed-ligand complexes of the bidentate Pa chelators bearing an anthraquinone moiety (Aqpa) or an anthrapyrazole moiety (Appa) (the synthesis of Appa was reported previously [24]) with monodentate Im were synthesized following the one-step process. In the preparation of complex fac-[Re(CO)3(Appa)(Im)](OTf) (ReAppaIm), four equivalents of imidazole were added to receive an 85% yield of the complex. The increase in imidazole was critical for converting all the intermediate product, fac-[Re(CO)3(Appa)(MeOH)](OTf), to the “2 + 1” complex ReAppaIm as exhibited by HPLC analysis. The product was purified from the reaction mixture by collecting the two diastereomer peaks with a 70:30 ratio, eluting at 19.85 min (major isomer) and 20.35 min (minor isomer) together. The formation of diastereomers was also observed in our initial study of the complex, fac-[Re(CO)3(Appa)Br] [24]. The IR spectrum of the complex exhibits the characteristic CO stretching vibrations of the tricarbonylrhenium core at 2021, 1909 and 1867 cm−1. The NMR signals indicate a fac-[Re(CO)3(N,N′)(N)] coordination mode. In particular, two dd signals at 5.22 and 4.50 ppm corresponding to the methylene protons of picolylamine chelate were identified, as well as the broad signal of NH at 5.74 ppm. In addition, the imidazole signals were detected at ~7.8, 6.79 and 6.77 ppm, respectively. As for the signals of the minor isomer, 7.94, 7.3 and 7.64 ppm correspond to the coordinated imidazole, and 4.8 and 3.7 ppm correspond to the methylene protons.
Scheme 2. Synthesis of mixed-ligand rhenium complexes.
Inorganics 13 00368 sch002
Complex fac-[Re(CO)3(Aqpa)(Im)](OTf) (ReAqpaIm) was formed as a mixture of two isomers similar to that of ReAppaIm, in moderate yield according to chromatography. The HPLC elution time of the isomers is tR = 19.28 min for the major isomer and tR = 20.7 min for the minor isomer, in a 75:25 ratio. Because of their greater elution difference, it was possible to separate them by semi-prep HPLC, and the diastereomers were characterized independently. The IR spectra of the complexes exhibit the characteristic CO stretching vibrations at 2022, 1916 and 1907 cm−1 for the major isomer and 2026, 1918 and 1907 cm−1 for the minor isomer. Analogous 1H-NMR signals were observed with the signal of NH at 5.46 ppm, and 2 dd at 5.22 and 4.14 ppm for the two methylene protons of picolylamine chelate in the major (M) isomer. The respective NMR signals for the minor (m) isomer are 7.07 ppm for NH, and 2 dd at 4.75 and ~3.8 ppm. The coordination of imidazole is evident from the 1H NMR spectrum with the appearance of four new peaks, one at 11.25 ppm, corresponding to the imidazole -NH- and three -CH- proton signals at 7.71, 6.64, 6.46 ppm for M and 11.25, 7.38, 7.17, 6.6 ppm for m (Table 1).
In the literature, the combination of 2,2′-bipyridine (bpy) as the bidentate ligand and a substituted imidazole as the pharmacophore-bearing ligand has been proposed as a platform for the preparation of tricarbonyltechnetium imaging agents [26]. Therefore, for the synthesis of the “2 + 1” complex, fac-[Re(CO)3(bpy)(Aqim)](OTf) (RebpyAqim), a two-step process was adopted, where the intermediate complex fac-[Re(CO)3(bpy)](OTf) was reacted with 4 × excess of ligand Aqim. [26] The IR spectrum of the complex exhibits the characteristic CO stretching vibrations of the tricarbonylrhenium core at 2027, 1919 and 1903 cm−1. The coordination of imidazole is evident from the 1H-NMR spectrum with the presence of the signals at 7.54, 7.05 and 6.57 ppm as well as the 4 2,2′-bipyridine signals at 9.03, 8.28, 8.11 and 7.58 ppm.
Table 1. Selected NMR shifts in picolylamine Re-complexes.
1H NMR/ppmRePaImReAqpaIm (Major)ReAqpaIm (Minor)ReAppaIm (Major)ReAppaIm (Minor)
Py-CH2-NH4.38, 4.09 (dt)5.52, 4.14 (dd)4.75, 3.6 (dd)5.22, 4.50 (dd)4.8, 3.7
Py-CH2-NH5.89, 4.815.467.085.74
Imidazole7.79, 7.18, 6.807.81, 6.64, 6.467.38, 7.17, 6.667.82, 6.77, 6.797.94, 7.64, 7.3
The UV–vis spectra of the complexes were recorded in DMSO solution, and the expected intraligand and charge-transfer bands were observed in the range 266–441 nm. The UV–vis spectra of the complexes were also recorded in the presence of buffer solutions used for the biological experiments, and no significant changes were observed (i.e., shift in the λmax or new bands), suggesting their integrity in such solvent mixtures.

2.2. DNA-Binding Studies of the Compounds

The study of the DNA interaction of the anthraquinone ligands Aqpa, Aqim, their rhenium complexes described herein (ReAppaIm, ReAqpaIm (major diastereomer) and RebpyAqim), as well as the prototype complexes RePaIm and RebpyIm (synthesized according to reference [27]), was performed in order to evaluate their ability to interact with calf-thymus (CT) DNA. The interaction between a compound and CT DNA may induce changes to the UV bands of the compound upon addition of CT DNA in diverse mixing ratios (r = [compound]/[DNA]). The UV spectra of the compounds in DMSO (10−4 M) recorded in the presence of increasing amounts of CT DNA are shown in Figure S1.
The UV spectra of all compounds exhibited slight hypochromism accompanied by low red shift upon addition of CT DNA solution, while in some cases, hyperchromism was also observed (Table 2). The results extracted from the UV spectroscopic titration studies should be enhanced with additional evaluation studies to provide more solid evidence regarding the compound’s mode of DNA interaction [28].
The DNA-binding constants of the complexes (Kb) as calculated with the Wolfe–Shimer equation [27] (Equation (S1)) and plots [DNA]/(εAf) vs. [DNA] (Figure S2) are similar to those of the corresponding free ligands (Table 2). The Kb values suggest a strong binding of the compounds to CT DNA, which are closer to or higher than that of the classical intercalator ethidium bromide (EB) (=1.23 (±0.07) × 105 M−1), as calculated in the literature [29]. In most cases, the anthraquinones Aqpa and Aqim are better DNA binders than their rhenium complexes. The Kb value of Aqim (=1.62 (±0.27) × 106 M−1) is the highest DNA-binding constant among the tested compounds.
Measurement of viscosity reveals significant information concerning the mode of DNA interaction of the tested compounds. When intercalation occurs, the DNA bases are separated to host the intercalating compound, which leads to enhanced DNA length and increased DNA viscosity. However, in the case of partial and/or non-classic intercalation (for example, groove binding or electrostatic interaction), the compounds do not intercept between the DNA bases, and a DNA helix bend or kink occurring does not significantly affect the DNA length, so the DNA viscosity may remain either unchanged or exhibit a light decrease [30]. Viscosity measurements were carried out on CT DNA solution (0.1 mM) upon the addition of increasing amounts of the tested compounds. The relative DNA viscosity exhibited an increase in the presence of all the compounds under study (Figure 2). These results indicated intercalation as the most possible mode of interaction of the compounds with DNA.
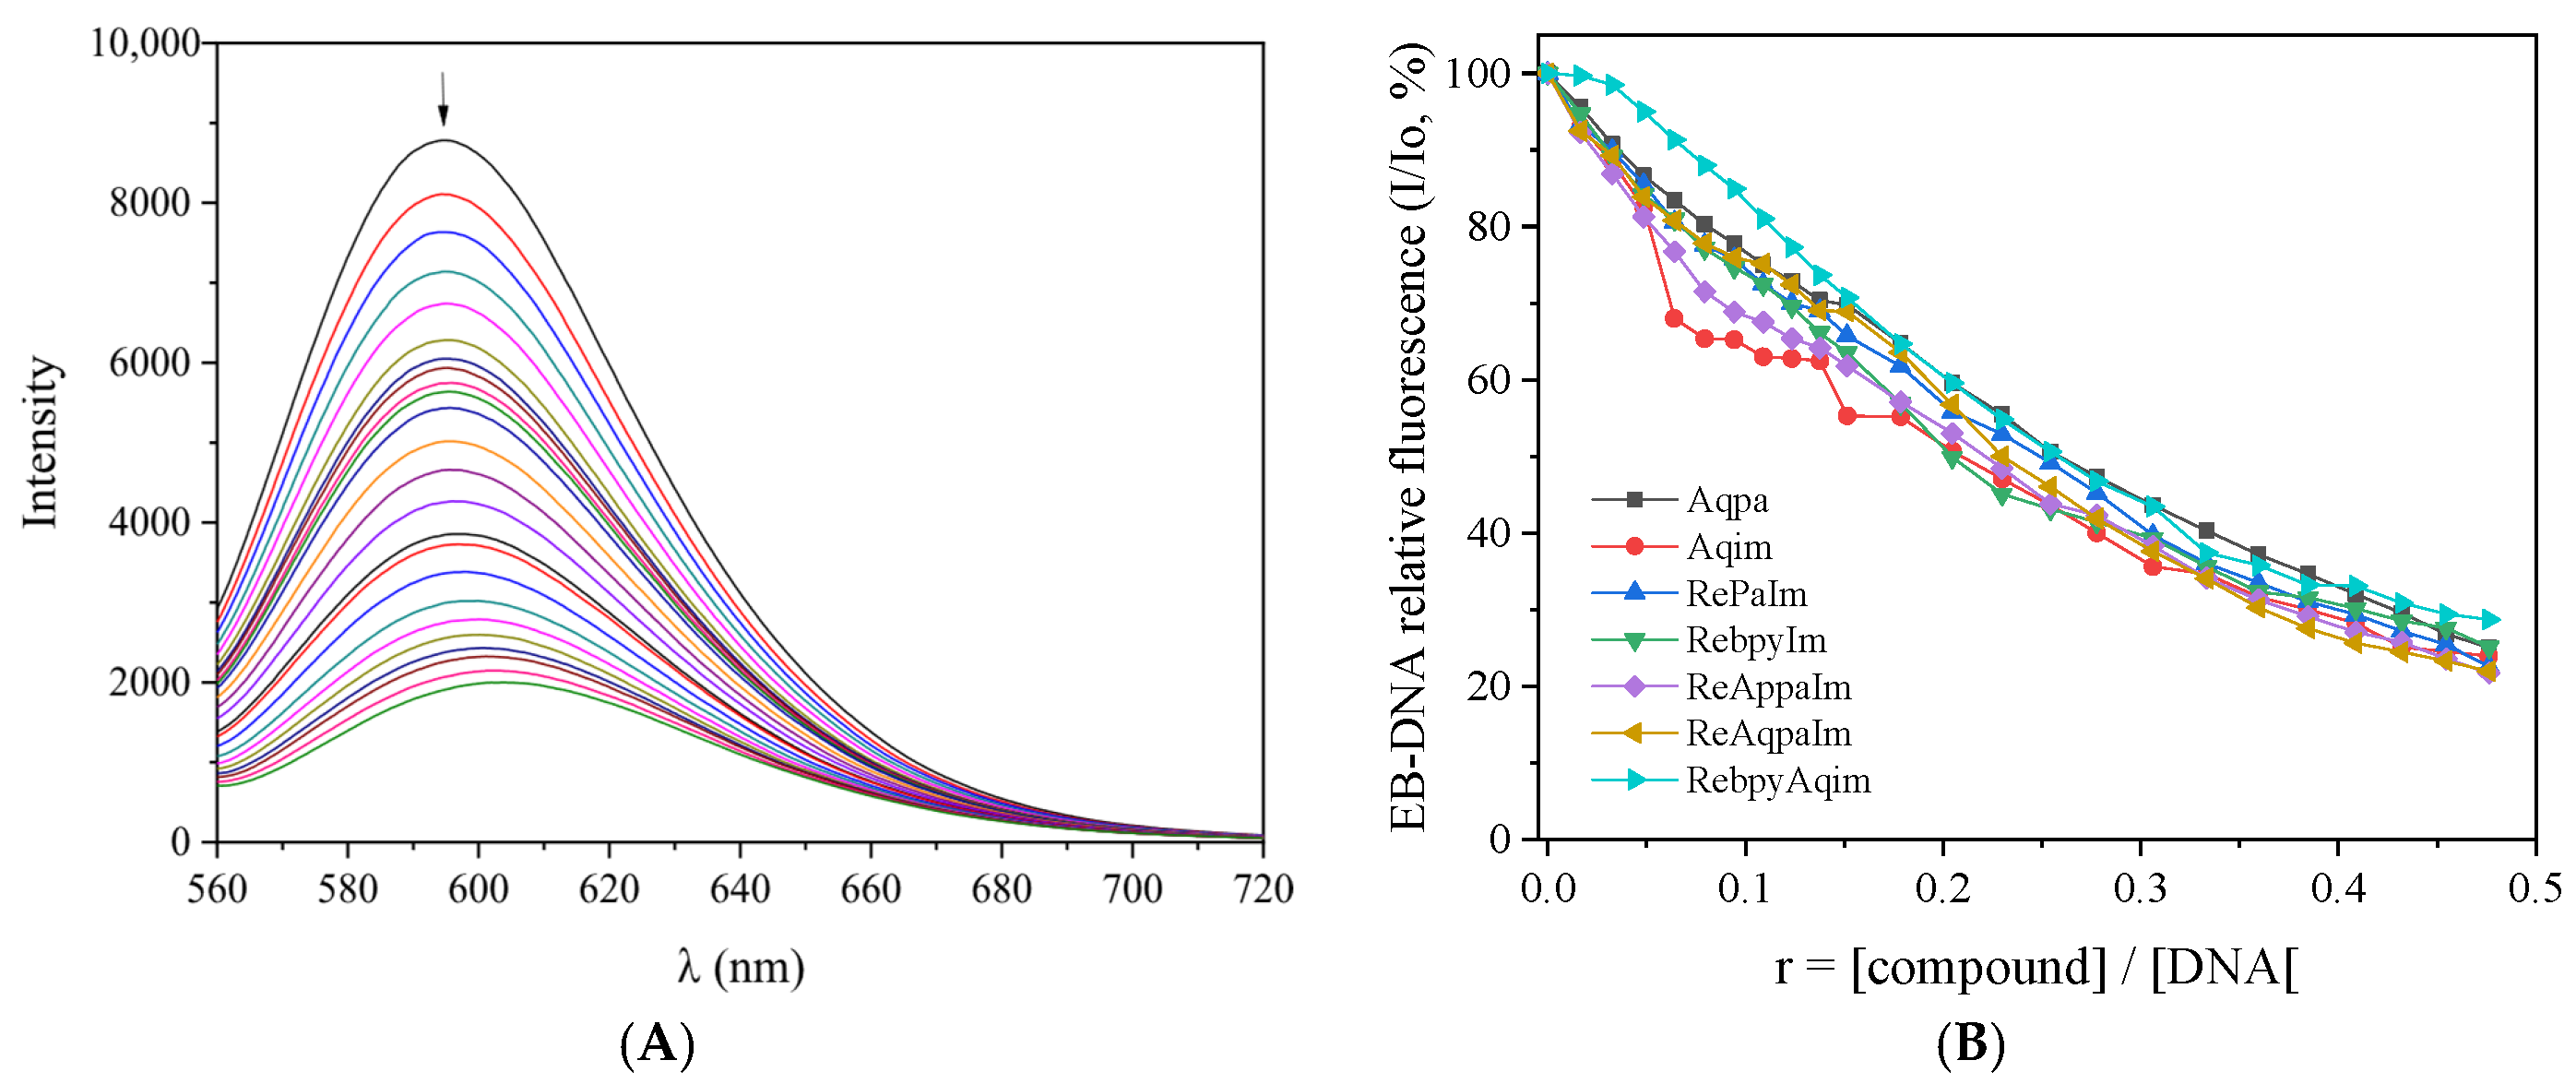
The ability of the compounds to displace EB from the EB-DNA complex has been widely used as a means to evaluate possible intercalation between the compounds and DNA. EB is a fluorescence dye and a typical indicator of intercalation due to the insertion of the planar phenanthridinium ring of EB between adjacent base pairs on the double helix. Furthermore, the EB-DNA complex emits intense fluorescence at 592 nm (with λex = 540 nm), which may be quenched in the presence of another intercalator, i.e., the tested compounds, competing with EB for the DNA intercalating sites [31]. The tested compounds did not exhibit significant fluorescence in the presence of DNA and EB at 540 nm excitation, and, therefore, they were used as EB competitors in this study. The fluorescence emission spectra of CT DNA pre-treated with EB for 1 h were obtained for [EB] = 40 μM, [DNA] = 40 μM and for increasing amounts of the compounds (up to r = 0.48) (shown in Figure 3A and Figure S3). The addition of increasing amounts of the compounds resulted in a significant decrease in the intensity of the emission band of the DNA-EB complex at 592 nm. In particular, the quenching induced by the tested compounds was up to 78% of the initial EB-DNA fluorescence (Table 3). Therefore, the tested compounds exhibit EB-displacing ability and compete with EB in binding to DNA (Figure 3B), thus indirectly proving their interaction with CT DNA via intercalation [32].
According to the Stern–Volmer plots of EB-DNA fluorescence in the presence of the compounds (Figure S4), the quenching of EB-DNA by the compounds is in good agreement (R = 0.99) with the linear Stern–Volmer equation (Equation (S2)) [33], and the KSV values (Table 3) may show tight binding of the complexes to DNA. Since the fluorescence lifetime of EB-DNA (τo) is 23 ns [34], the Kq values as calculated via Equation (S3) are much higher than 1010 M−1s−1; these values indicate a static quenching mechanism revealing the formation of a new adduct between the studied complexes and DNA, and confirm indirectly intercalation as the most possible mode of interaction [31].

2.3. Radiochemistry

Τhe 99mTc mixed-ligand complexes were synthesized in two consecutive steps: first by reaction of the precursor, fac-[99mTc][Tc(CO)3(H2O)3]+ with the bidentate ligands, Appa, Aqpa or bpy in 1 mM concentration, followed by the addition of the monodentate imidazole or Aqim in higher concentrations (approx. 1 mg), similar to reported methods in the literature [26,35] (Scheme 3). The formation of the 2 + 1 complexes was observed by HPLC; they were identified by comparison with the elution times of their Re-analogs (Table 4).
The radiotracer 99mTcAppaIm was formed with a radiochemical yield of 65% as two diastereomers with elution times tR = 20.00 and 20.42 min at a 7:3 ratio identical with the Re-analog, with tR = 19.85 and 20.35 min at a 7:3 ratio, respectively (Figure 4 and Table 4). The radiotracer 99mTcAqpaIm was formed with a radiochemical yield average of 40%. Initially, formation of complex fac-[Tc(CO)3(Aqpa)(H2O)]+ was achieved with a radiochemical yield of 75% and an HPLC elution of tR = 20.01 and 20.55 min at a 33:67 ratio, analogous to the fac-[Re(CO)3(Aqpa)(MeOH)]+ product, which was prepared after precipitation of bromide (with AgOTf from fac-[Re(CO)3(Aqpa)Br] and preparation in ESI) with tR = 19.89 and 20.55 min at a 45:55 ratio, respectively (Figure S5). After the addition of imidazole, fac-[99mTc][Tc(CO)3(Aqpa)(H2O)]+ was converted to the mixed-ligand product fac-[99mTc][Tc(CO)3(Aqpa)(Im)]+ (99mTcAqpaIm) with an HPLC elution of tR = 19.48 and 20.87 min at a 65:35 ratio, identical with the Re-analog, with tR = 19.25 and 20.75 min at a 75:25 ratio, respectively. Because of the large difference in the elution times of this “2 + 1” radiotracer, only the major isomer at tR = 19.48 min was isolated and used in the stability and biological studies (Figure S5 and Table 4). The radiotracer 99mTcbpyAqim was formed by 75% conversion of fac-[99mTc][Tc(CO)3(bpy)(H2O)]+ to the mixed-ligand complex after 45 min heating, with an HPLC elution at tR = 20.87 min, identical to its Re-analog with tR = 20.85 min (Figure 4 and Table 4). All the “2 + 1” complexes were purified by HPLC with a radiochemical purity of 100% and were then used in the in vitro and in vivo studies.
The stability of the tracers was evaluated in vitro under conditions that resemble the biological fluids. Therefore, the complexes were incubated for 24 h in L-histidine and rat plasma at 37 °C (Table 5). The percentage of intact complex was calculated by HPLC injection at various time points. The prototype mixed-ligand complex 99mTcPaIm was moderately stable under these conditions. The anthraquinone/anthrapyrazole substituted mixed-ligand complexes 99mTcAppaIm, 99mTcAqpaIm, and 99mTcbpyAqim, on the other hand, were highly stable under these conditions, as shown in Table 5. This indicates that the mono-substitution of Pa in the Appa and Aqpa ligands enhances the stability of the complexes, so that it could be assumed that the pharmacophore moiety sterically inhibits the interaction between the complex and other potential biological chelators, or also electronic parameters may be influenced as well. Furthermore, the introduction of the monodentate imidazole significantly reduces the protein binding to 33% in 99mTcAppaIm vs. 54% in the bidentate complex 99mTcAppa after 24 h incubation in rat plasma, observed in our previous study [24]. On the other hand, the substituted imidazole Aqim ligand is well tolerated as the stability of the basic complex core fac-[99mTc][Tc(CO)3(bpy)(im)]+ is maintained [26,35]. The low percentages of degradation for the tracers 99mTcAppaIm and 99mTcAqpaIm correspond to regeneration of pertechnetate at 3.2 min, while for the tracer 99mTcbpyAqim, a conversion to complex fac-[99mTc][Tc(CO)3(bpy)]+ is observed.
The lipophilicity is a fundamental physicochemical property of drugs that determines their solubility, membrane permeability and thus their ability to finally reach the desired target. All tracers exhibited lipophilicity calculated as logD values within the drug-likeness window [36], which indicates the ability of the tracers to permeate cellular membranes (Table 5). The model tracer 99mTcPaIm exhibited significantly lower lipophilicity compared to 99mTcAppaIm and 99mTcAqpaIm, which displays the drastic effect of the anthraquinone scaffold on the physicochemical properties of the tracers.

2.4. Biological Evaluation of 99mTc Tracers
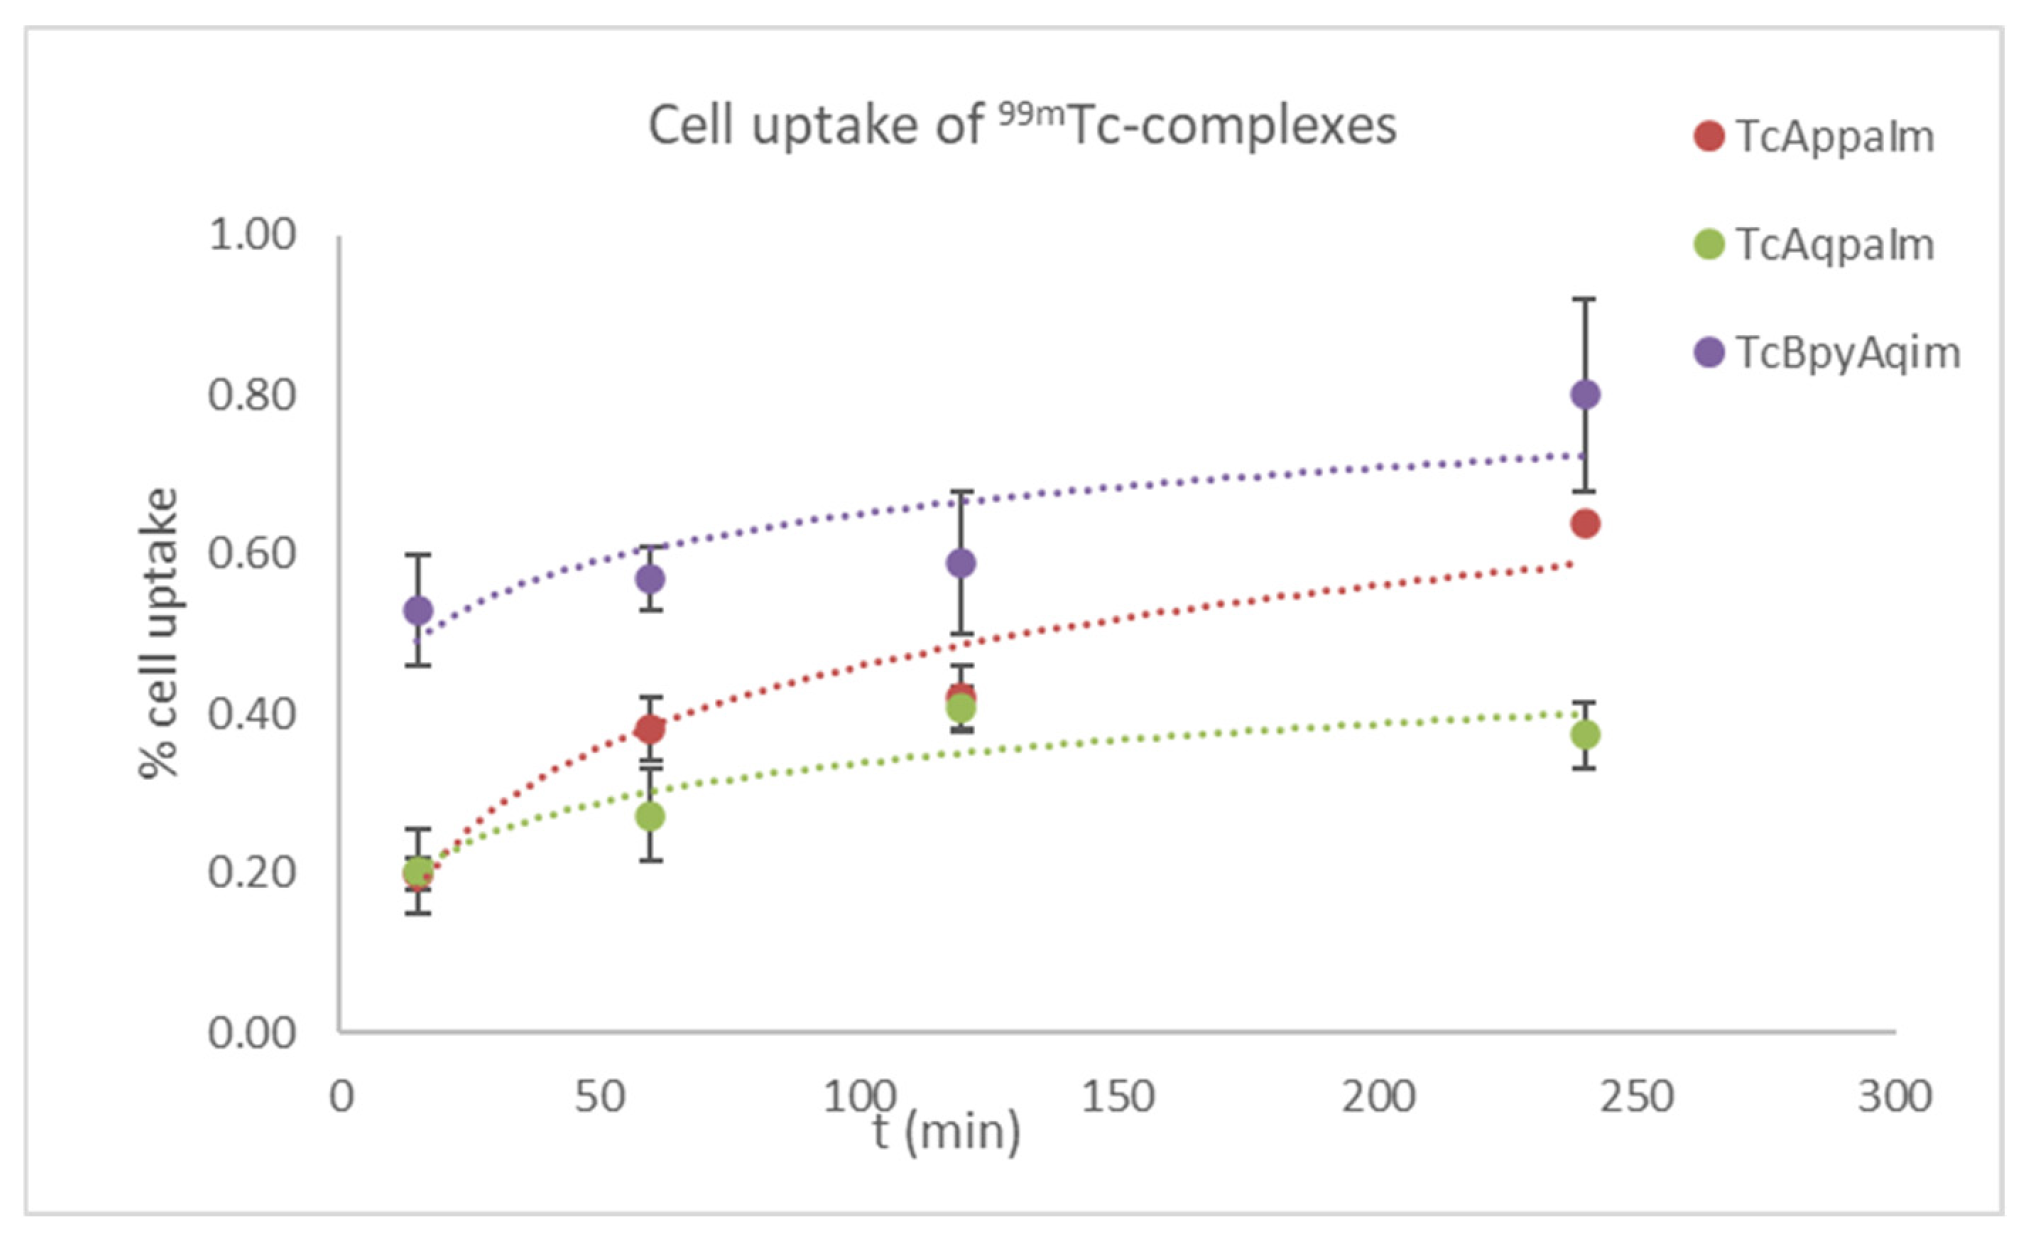
The potential use of the radiotracers as tumor-imaging agents was tested both in vitro, by calculating the complex tumor cell uptake after their incubation in cell cultures, and in vivo, in tumor-bearing mice. In both cases, the CT26 colon adenocarcinoma cell line was employed, a cell line syngeneic with the BALB/c mice used in the studies. All the mixed-ligand complexes exhibit similar cellular uptake values that do not exceed 1% (Figure 5). In our previous work [24], we exhibited that the tracer [99mTc][Tc(CO)3(Appa)(H2O)]+ showed relatively higher uptake with values of approx. 5%. It is possible that the free coordination site in the complexes that do not bear an imidazole monodentate ligand results in interactions that promote membrane permeation and possibly intracellular binding and accumulation of the tracer.
Figure 5. Uptake of the 2 + 1 99mTc-complexes in CT26 cells.
Inorganics 13 00368 g005
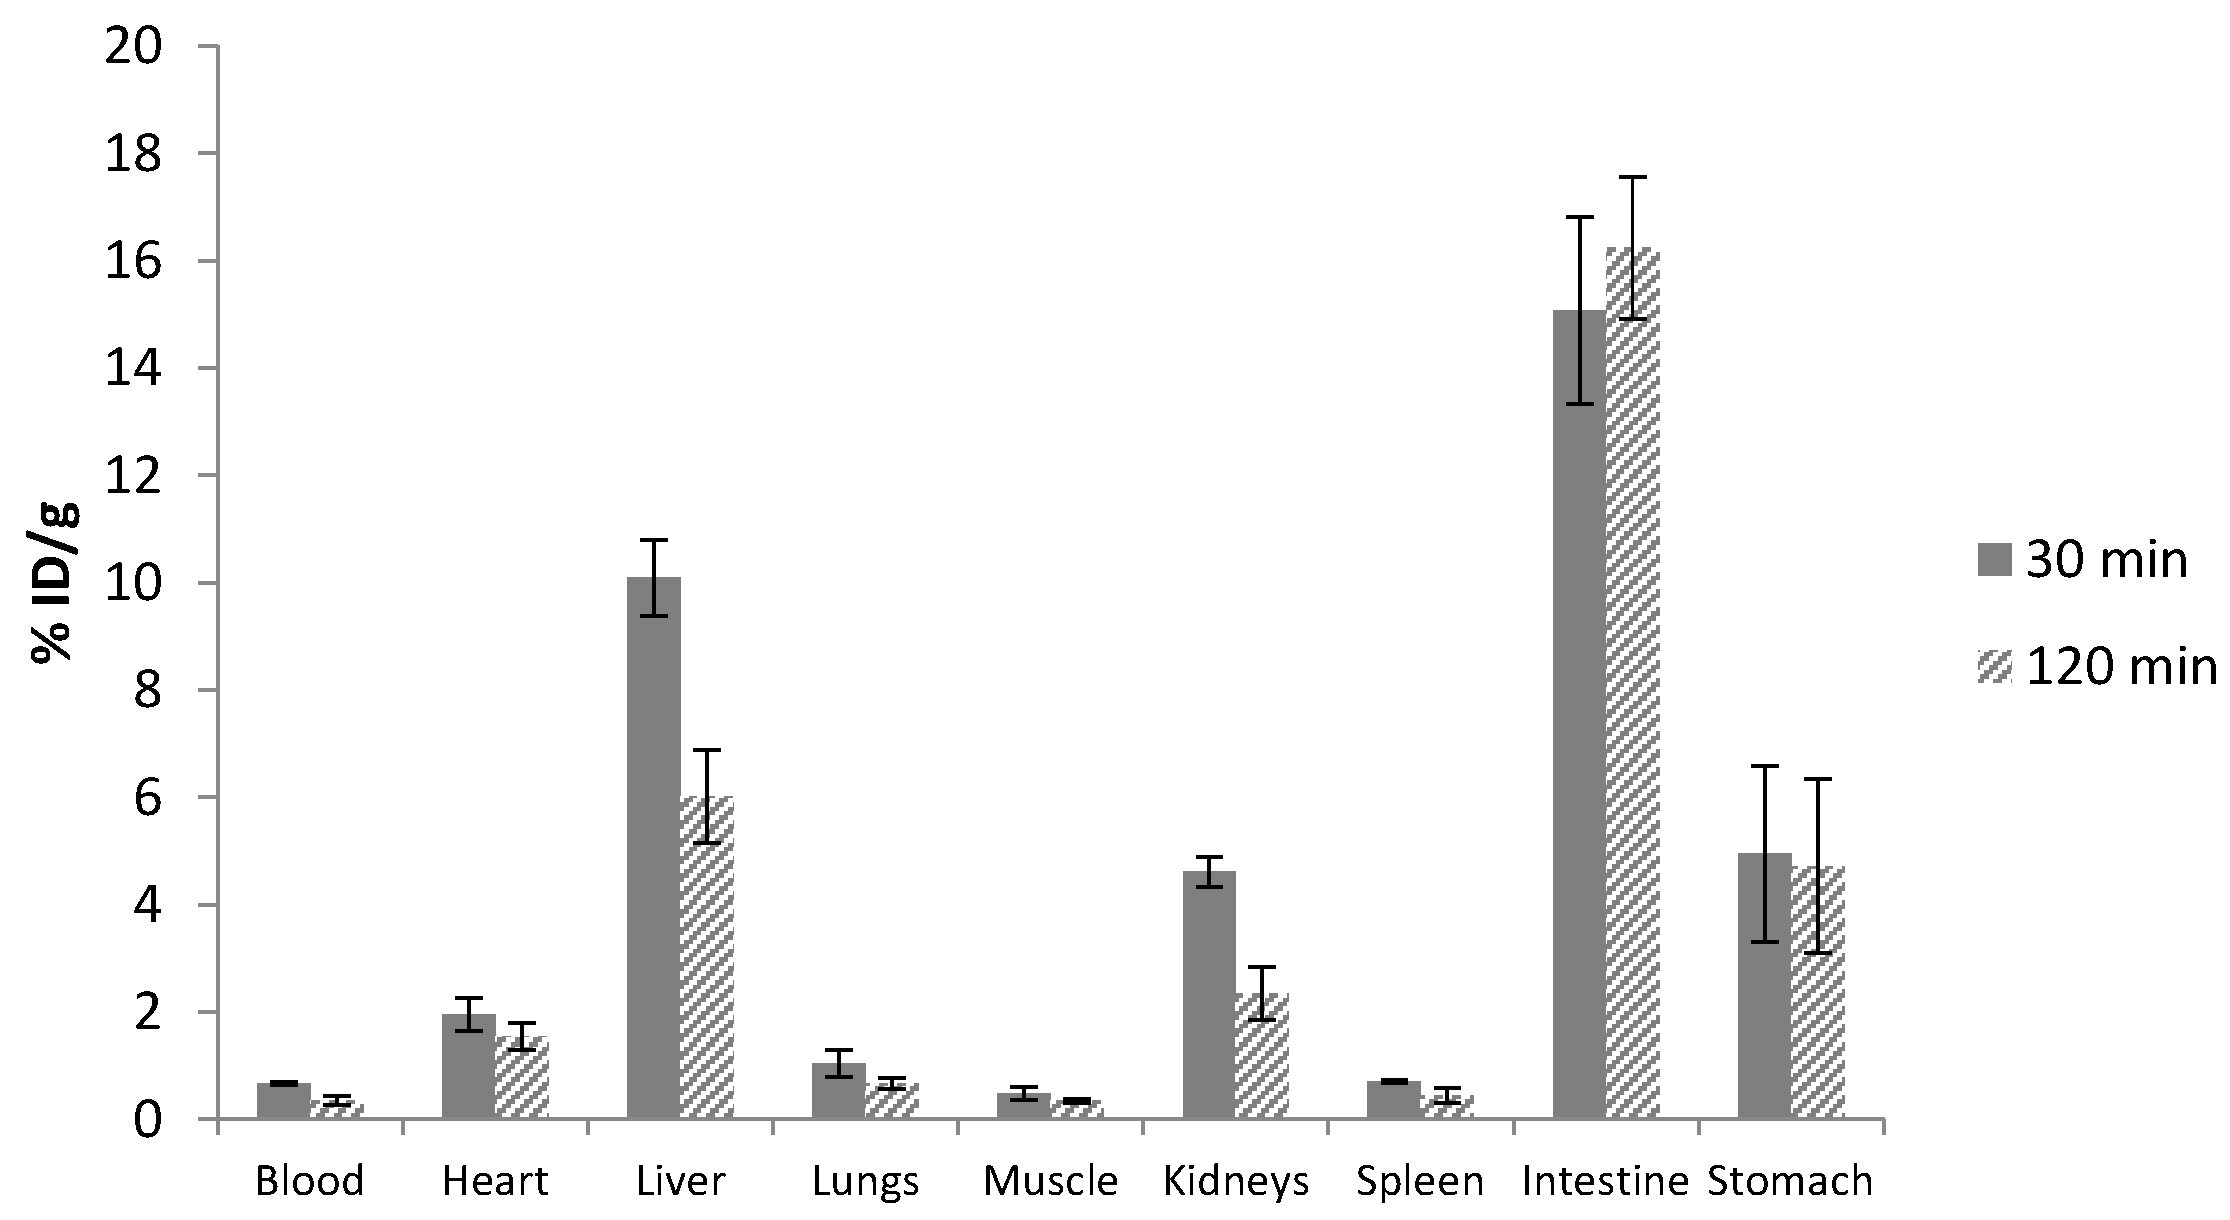
In the in vivo studies, first, the prototype tracer fac-[99mTc][Tc(CO)3(Pa)(Im)]+ was evaluated in healthy mice to assess its biodistribution profile. As can be observed from Figure 6, it displayed fast blood elimination and primarily hepatobiliary clearance. Furthermore, urinary excretion was observed with a value of 35.83 ± 3.58% ID at 120 min post injection (p.i.) (Table S1).
Then, the biodistribution of the pharmacophore-conjugated tracers in tumor-bearing mice was evaluated (Table 6 and Table S2). By first comparing the bidentate complex 99mTcAqpa and the analogous mixed-ligand complex 9mTcAqpaIm, faster blood elimination can be observed over time for the “2 + 1” complex, which is an important property for imaging agents. Also, in comparison, reduced heart and lung uptake can be observed in the mixed-ligand analog. Furthermore, improved stability for the mixed-ligand complex can also be observed, with lower stomach uptake. Stomach uptake is associated with degradation of the tracer and the formation of the pertechnetate ion [99mTc][TcO4].
As for tumor uptake, the bidentate tracer 99mTcAqpa exhibited higher tumor uptake of 1.83 ± 0.18% ID/g at 30 min p.i., compared to the mixed-ligand analog (0.90 ± 0.05% ID/g at 30 min), which can also be correlated with the higher in vitro cell uptake of the former. The tumor accumulation of the tracers was measured from the target/nontarget ratios and specifically tumor/blood (Tu/Bl) and tumor/muscle (Tu/Mu) ratios. Importantly, the Tu/Bl and Tu/Mu ratios of the mixed-ligand tracer 99mTcAqpaIm were higher at all time points, compared to the bidentate tracer, which indicates an overall better targeting profile and more suitable pharmacokinetics for the mixed-ligand tracer complex. More precisely, 99mTcAqpaIm displayed higher tumor-to-blood (0.99 ± 0.09 vs. 0.33 ± 0.05 at 30 min) and tumor-to-muscle (2.49 ± 0.21 vs. 1.48 ± 0.31 ratios at 30 min) ratios vs. 99mTcAqpa.
The comparison of the mixed-ligand tracers indicated fast blood elimination and significant hepatobiliary clearance for all, while at the same time, kidney accumulation is observed at 120 min p.i., which was not associated with urinary excretion. As for tumor uptake, the tracer 99mTcAppaIm exhibited the highest tumor uptake equal to 4.24 ± 1.39% ID/g, followed by 99mTcbpyAqim with an uptake of 2.51 ± 1.76% ID/g, respectively, at 30 min p.i. The tumor accumulation, as indicated by the Tu/Mu ratios, is higher in the tracers 99mTcAppaIm and 99mTcAqpaIm, with values of 5.10 ± 3.55 and 2.42 ± 1.42 at 120 min p.i., respectively, compared to 99mTcbpyAqim (1.36 ± 0.97). The Tu/Bl ratios of the tracers 99mTcAqpaIm, 99mTcAppaIm show an increase over time, reaching values of 2.30 ± 0.61 and 1.63 ± 0.92 at 120 min p.i., respectively. 99mTcAppaIm, although it has target/nontarget values greater than 1% at both time points, the uptake diminishes between the two time points.

3. Materials and Methods

3.1. General

All chemicals were reagent grade and were used as such unless otherwise noted. For the chromatographic purifications, Silica gel 60 (0.040–0.063 mm) from Merck was used. The precursors Re(CO)5Br, Re(CO)5(OTf) and fac-[Re(CO)3(MeOH)3](OTf) were prepared according to literature procedures [37,38]. For the 99mTc-labeling, a kit containing 5.5 mg of NaBH4, 4 mg of Na2CO3, and 15 mg of Na-K tartrate was purged with CO gas prior to the addition of [99mTc]NaTcO4, as described in the literature [39]. Solvents for high-performance liquid chromatography (HPLC) were HPLC grade, and solvents for mass spectroscopy (MS) were MS grade. They were filtered through membrane filters (0.22 μm, Millipore, Milford, MA, USA) and degassed. The ESI-HRMS spectra were recorded on an Agilent Q-TOF Mass Spectrometer, G6540B model with Dual AJS ESI-MS (Santa Clara, CA, USA) and the spectra were processed using MassHunter Qualitative Analysis (Qual) software. IR spectra were recorded as KBr pellets on a Spectrum BX spectrophotometer (Perkin Elmer, Waltham, MA, USA) in the region of 4000–500 cm−1 and the Spectrum v5.3 software was used. NMR spectra were recorded on a DD2 500 MHz spectrometer (Agilent, Santa Clara, CA, USA), where the OpenVnmrJ software was used. RP-HPLC analyses (Agilent Eclipse XDB C18 column 25 cm × 4.6 mm, 5 μm) and semi-prep HPLC purifications (Agilent Eclipse XDB C18 column 25 cm × 9.4 mm, 5 μm) were conducted by applying a binary gradient method of the following: Solvent A: H2O-0.1% v/v TFA and Solvent B: Methanol. The methanol was HPLC grade, while the TFA solution was prepared utilizing ultra-pure water (MiliQ, 18.2 MΩ∙cm) and was filtered through membrane filters (Durapore® MF 0.45 μm, Millipore, Milford, MA, USA). The HPLC analyses were performed on an Agilent 1260 Infinity II series pump (HP, Waldbronn, Germany) connected to a Gabi gamma detector (Raytest, Straubenhardt, Germany) and subsequently to an Agilent 1200 series diode array detector. The flow rate was set at 1 mL/min for the analyses or at 2 mL/min for the purifications and the composition was as follows: (min, A %, B %); Method A: (0, 100, 0); (15, 25, 75); (20, 5, 95); (25, 5, 95); (27, 100, 0); (30, 100, 0); Method B: (0, 60, 40); (15, 10, 90); (20, 5, 95); (25, 5, 95); (27, 60, 40); (30, 60, 40). The Chemstation OpenLab software was used. UV–visible (UV–vis) spectra were recorded in solution on a Hitachi U-2001 dual-beam spectrophotometer (UV solutions software). Fluorescence spectra were recorded in solution on a Hitachi F-7000 (Tokyo, Japan) fluorescence spectrophotometer (FL solutions software). For the viscosity experiments, an Alpha L Fungilab rotational viscometer was used, equipped with an 18 mL LCP spindle, and the measurements were conducted at 100 rpm.
DNA stock solution was prepared by dilution of CT DNA to buffer (containing 15 mM trisodium citrate and 150 mM NaCl at pH 7.0), followed by exhaustive stirring for three days, and was kept at 4 °C for no longer than a week. The stock solution of CT DNA gave a ratio of UV absorbance, at 260 and 280 nm (A260/A280), of 1.85, indicating that the DNA was sufficiently free of protein contamination [40]. The DNA concentration was determined by the UV absorbance at 260 nm after a 1:20 dilution using ε = 6600 M−1cm−1 [41].
The cell cultures of murine colorectal adenocarcinoma CT26 cells were performed as described in the literature [42,43,43,44].
CAUTION! 99mTc is a gamma (γ)-emitting radionuclide (t1/2 = 6 h, γ-energy, 140 keV), and handling was performed according to Greek legislation and the EU regulations (2013/59/Euratom). 99mTc was obtained as sodium pertechnetate in sterile saline from a commercial 99Mo/99mTc generator (AHEPA General Hospital, Thessaloniki, Greece).

3.2. Chemistry

1-(3-bromopropoxy)-8-hydroxy-9,10-anthraquinone (1). To a stirring solution of 1,8-dihydroxy-9,10-anthraquinone (1 g, 4.16 mmol) in dry acetone (150 mL), tetrabutylammonium bromide (TBAB) (187 mg, 0.58 mmol), K2CO3 (575 mg, 4.16 mmol) and 1,3-dibromopropane (475 μL, 4.66 mmol) were added, and the reaction mixture was heated to reflux for 2–3 d (monitored by TLC). After the filtration of the reaction mixture, the filtrate was concentrated and purified by silica gel chromatography (petroleum ether/ethyl acetate, 7:3), resulting in 1 as an orange solid (240 mg, 16% yield) [45,46]. Rf = 0.40 (petroleum ether/ethyl acetate, 7:3). IR (cm−1, KBr): 1668, 1638 (>C=O), 745 (aromatic rings). 1H-NMR (500 MHz, CDCl3) δ 13.03 (s, 1H, -OH), 7.97 (d, J = 7.6 Hz, 1H, H3), 7.78 (d, J = 7.5 Hz, H3′), 7.74 (t, J = 8.2 Hz, H2), 7.62 (t, J = 7.9 Hz, 1H, H2′), 7.37 (d, J = 8.4 Hz, 1H, H1), 7.30 (d, J = 8.3 Hz, 1H, H1′), 4.33 (t, J = 5.6 Hz, 2H, H4), 3.87 (t, J = 6.2 Hz, 2H, H6), 2.47 (quint., J = 5.9 Hz, 2H, H5). 13C-NMR (126 MHz, CDCl3) δ 188.62, 182.66, 162.40, 159.97, 135.75, 135.68, 135.66, 132.64, 124.65, 120.89, 120.24, 119.19, 118.77, 117.02, 66.71, 32.05, 30.34. HR(-)-MS (m/z): (C17H13BrO4) calc’d: 359.9980, 361.9958; found: 359.9850, 361.9831 for [M-Br + DMSO].
1-hydroxy-8-(3-((pyridin-2-ylmethyl)amino)propoxy)-9,10-anthraquinone (Aqpa). A solution of 1 (500 mg, 1.38 mmol), 2-picolylamine (212 μL, 2.07 mmol) and K2CO3 (191 mg, 1.38 mmol) in dry acetonitrile (90 mL) was heated to reflux for 24 h. After the evaporation of the acetonitrile, the residue was redissolved in dichloromethane (DCM) and poured into a NaCl solution. The organic layer was collected, dried and purified by silica gel chromatography (DCM:MeOH, 9:1 and then, DCM:MeOH:NH3 (25 wt%), 8:2:0.1) to yield Aqpa as a red oil (96 mg, 18% yield) [11]. Rf = 0.29 (DCM:MeOH:NH3 (25 wt%), 8:2:0.1). IR (cm−1, KBr): 1670, 1637 (>C=O), 745 (pyridine and anthraquinone aromatic rings). 1H-NMR (500 MHz, CDCl3,) δ 8.46 (d, J = 4.0 Hz, 1H, H11), 7.93 (d, J = 7.6 Hz, 1H, H3), 7.74 (dd, J = 7.5, 1.0 Hz, 1H, H3′), 7.70 (t, J = 8.1 Hz, 1H, H2), 7.61 (td, J = 7.6, 1.5 Hz, 1H, H2′), 7.59 (t, J = 7.8 Hz, H9), 7.35 (d, J = 7.8 Hz, 1H, H8), 7.34 (d, J = 8.4 Hz, 1H, H1), 7.25 (dd, J = 8.2, 1.0 Hz, 1H, H1′), 7.11 (dd, J = 7.0, 5.3 Hz, 1H, H10), 4.30 (t, J = 5.9 Hz, 2H, H4), 4.03 (s, 2H, H7), 3.06 (t, J = 6.3 Hz, 2H, H6), 2.21 (quint., J = 6.1 Hz, 2H, H5). 13C-NMR (126 MHz, CDCl3) δ 188.62, 182.71 (-C(=O)-), 162.35, 160.09, 158.62, 149.26, 136.55, 135.73, 135.70, 135.60, 132.65, 124.67, 122.46, 122.12, 120.71, 120.06, 119.04, 118.74, 117.00, 68.49 (C4), 54.83 (C6), 46.69 (C7), 28.89 (C5). HR(+)-MS (m/z): (C23H20N2O4) calc’d: 389.1550; found: 389.1493 for [M + H]+.
1-(3-(1H-imidazol-1-yl)propoxy)-8-hydroxyanthracene-9,10-dione (Aqim). Imidazole (41 mg, 0.6 mmol) was dissolved in anhydrous acetonitrile at 0 °C, and then KH (73 mg, 0.6 mmol, 30–35% w/w) was added. The mixture was stirred under N2 for 30 min. Then, compound 1 (54 mg, 0.15 mmol) was added, and the mixture was heated under reflux for 24 h. After the evaporation of the solvent, the residue was redissolved in DCM and poured into a NaCl solution. The organic layer was collected, dried and purified by silica gel chromatography (DCM:MeOH, 95:5) to yield Aqim as a red solid. Yield 21% (11 mg). Rf = 0.29 (DCM:MeOH:NH3 (25 wt%), 8:2:0.1). 1H-NMR (500 MHz, CDCl3, ppm) δ 13.09 (s, OH), 7.97 (d, J = 7.2 Hz, H3), 7.79 (dd, J = 7.5, 1.0 Hz, H3′), 7.70 (t, J = 8.0 Hz, H2), 7.63 (t, J = 6.9 Hz, H2′), 7.60 (s, H7), 7.31 (dd, J = 8.4, 1.1 Hz, H1), 7.23 (d, J = 8.0 Hz, H1′), 6.96, 7.04 (s, H8, H9), 4.52 (t, J = 6.4 Hz, 2H, H4), 4.03 (t, J = 5.6 Hz, 2H, H6), 2.36 (quint., J = 6.1 Hz, 2H, H5). HR(+)-MS (m/z): (C20H16N2O4) calc’d: 349.1183; found: 349.1171 for [M + H]+.
fac-[Re(CO)3(picolylamine)(imidazole)] Triflate, fac-[Re(CO)3(Pa)(im)](OΤf) (RePaIm). Method A (two steps): To a stirring methanol solution of fac-[Re(CO)3(MeOH)3]+ (0.11 mmol), 2-picolylamine (12 mg, 0.11 mmol) was added, and the reaction mixture was heated to reflux for 2 h. 14 mg (0.2 mmol) of imidazole was also added; the mixture was heated for other 2 d and then concentrated. Method B (one step): To a stirring methanol solution of fac-[Re(CO)3(MeOH)3]+ (0.042 mmol), 2-picolylamine (4.5 mg, 0.042 mmol) and imidazole (2.9 mg, 0.042 mmol) were added. The reaction mixture was heated to reflux for 24 h and then concentrated. The residues were combined and purified by silica gel chromatography (DCM:MeOH, 8:2) and semi-prep HPLC (Method A), to afford the desired complex—a greenish oil (11 mg, 16% yield) [47]. Rf = 0.42 (DCM:MeOH, 8:2). Calc. for C13H12F3N4O6ReS: C, 26.22; H, 2.03; N, 9.41; Found: C 26.55; H 2.40; N 9.57. IR (cm−1, KBr): 2027, 1905 (-C≡O). 1H-NMR (500 MHz, CD3OD) δ 8.96 (d, J = 5.5 Hz, 1H, H1), 8.07 (td, J = 7.8, 1.4 Hz, 1H, H3), 7.63 (s, 1H, Ha), 7.60 (d, J = 7.9 Hz, 1H, H4), 7.51 (dd, J = 7.8, 5.5 Hz, 1H, H2), 7.13 (s, 1H, Hb), 6.74 (s, 1H, Hc), 5.89 (s, 1H, -NH2), 4.81 (s, 1H, -NH2), 4.38 (dt, J = 16.7, 5.9 Hz, 1H, He), 4.09 (dt, J = 16.8, 6.1 Hz, 1H, He). HR(+)-MS (m/z): (C12H12N4O3Re) calc’d: 445.0429(60%), 447.0443 (100%); found: 445.0423 (60%), 447.0455 (100%) for [M]+.
fac-tricarbonylrhenium(2-(pyridin-2-ylmethyl)amino)ethyl)-10-methoxy-anthra [1,9-cd]pyrazol-6(2H)-one)(imidazole) Triflate, fac-[Re(CO)3(Appa)(im)](OΤf) (ReAppaIm). To a solution of fac-[Re(CO)3(MeOH)3]+ (0.1 mmol), a solution of Appa, 2-(2-Picolylaminolethyl)-10-methoxy-anthra[1,9-cd]pyrazol-6(2H)-one [24] (38 mg, 0.1 mmol and imidazole (28 mg, 0.4 mmoL)) in MeOH (3 mL) was added, and the reaction mixture was heated to reflux for 24 h. The reaction mixture was concentrated to 1 mL MeOH and was subjected to semipreparative HPLC purification. Yield: 40 mg, 83.5%. tR: 19.1 min. Rf: (SiO2, CH2Cl2:MeOH, 9:1) 0.80. m.p. 187–190 °C. Calc. for C30H24F3N6O8ReS: C, 41.33; H, 2.77; N, 9.64; Found: C 41.69; H 2.40; N 9.49. IR (cm−1, KBr): 3477, 3412.39, 2927, 2027, 1919.09, 1907.97, 1685.7, 1637.4, 1617.89, 1449, 1282, 1230. 1H NMR (500 MHz, CD3OD) δ for M: 9.12 (d, J =5.5 Hz, 1H, H11), 8.25 (td, J = 7.8, 1.2 Hz, H9), 7.99 (d, J = 7.8 Hz, H3), 7.90–7.78 (m, 4H, H3′, H8, Ha, H2), 7.67 (dd, J = 7.6, 5.5 Hz, H10), 7.60 (t, J = 8.0 Hz, H2′), 7.40 (d, J = 8.0 Hz, H1), 7.10 (d, J = 8.0 Hz, H1′), 6.79 (m, 1H, Hb), 6.77 (m, 1H, Hc), 5.74 (m, NH), 5.22 (dd, J = 15.9, 5.1 Hz, 1H, H7), 4.81 (m, 2H, H5), 4.50 (dd, J = 15.9, 9.4 Hz, 1H, H7), 4.16 (m, 1H, H6), 3.95 (m. 1H, H6), 3.25 (br, 3H, H4). HR(+)-MS (m/z): (C29H24N6O5Re) calc’d: 721.1162 (60%), 723.1626 (100%), found: 721.1315 (60%), 723.1348 (100%) for [M]+.
fac-tricarbonylrhenium(1-hydroxy-8-(3-((pyridin-2-ylmethyl)amino)propoxy)-9,10-anthraquinone)(imidazole)Triflate, fac-[Re(CO)3(Aqpa)(im)](OTf) (ReAqpaIm). To a methanolic solution of fac-[Re(CO)3(MeOH)3](OTf) (0.05 mmol), a solution of Aqpa (20 mg, 0.05 mmol) and imidazole (3.4 mg, 0.05 mmol) in MeOH (5 mL) was added and the reaction mixture was heated to reflux for 24 h. The mixture was concentrated to less than half its volume, and the precipitate was removed. The supernatant was purified by semi-prep TLC 20 × 20 cm (DCM:MeOH 9:1), and a band with Rf = 0.29 was isolated as an orange solid and yielded 25 mg. The mixture of isomers was separated by semi-preparative HPLC (Method B) to afford the major isomer (M) product (tR = 19 min) with a yield of 5 mg (25%) and the minor (m) isomer with a yield of 2 mg (11%). Calc. for C30H24F3N4O10ReS (M): C, 41.14; H, 2.76; N, 6.40; Found: C 41.05; H 3.10; N 6.20. IR (cm−1, KBr): 2022, 1916, 1908 (-C≡O), 1633, 1281, 1203. 1H-NMR (500 MHz, CDCl3, ppm) δ for M: 13.25 (s, 1H, -OH), 11.25 (s, 1H, NHim), 8.98 (d, J = 5.3 Hz, 1H, H11), 8.11 (t, J = 7.6 Hz, 1H, H9), 7.95 (d, J = 7.4 Hz, 1H, H3), 7.81 (s, Ha), 7.75–7.69 (m, 2H, H2, H3′), 7.67 (d, J = 7.7 Hz, 1H, H8), 7.61 (dd, J = 7.3, 5.3 Hz, H10), 7.54 (t, J = 7.9 Hz, 1H, H2′), 7.28 (d, J = 8.3 Hz, 1H, H1), 7.01 (d, J = 8.3 Hz, 1H, H1′), 6.64 (s, 1H, Hc), 6.45 (s, 1H, Hb), 5.46 (s, 1H, NH), 5.22 (dd, J = 15.2, 4.4 Hz, 1H, H7), 4.51–4.44 (m, 1H, H4), 4.30–4.24 (m, 1H, H4), 4.14 (dd, J = 15.1, 10.2 Hz, 1H, H7), 4.07–3.99 (m, 1H, H6), 3.74–3.64 (m, 1H, H6), 2.55–2.46 (m, 1H, H5), 2.22 (d, J = 16.1 Hz, 1H, H5); IR (cm−1, KBr): 2026, 1916, 1908 (-C≡O), 1654, 1284, 1202. 1H-NMR (500 MHz, CDCl3, ppm) δ for m: 13.50 (s, 1H, -OH), 11.25 (s, 1H, NHim), 9.08 (d, J = 5.3 Hz, 1H, H11), 8.11 (t, J = 6.9 Hz, 1H, H9), 8.05 (d, J = 7.4 Hz, 1H, H3), 7.84 (t, J = 8.0 Hz, H2), 7.75 (d, J = 7.4 Hz, 1H, H3′), 7.64 (dd, J = 7.7, 5.3 Hz, 1H, H10), 7.59 (m, 2H, H2′, H8), 7.41 (d, J = 8.5 Hz, 1H, H1), 7.38 (m, 1H, Ha), 7.17 (m, Hc), 7.08 (s, 1H, NH), 7.01 (d, J = 7.6 Hz, 1H, H1′), 6.66 (s, 1H, Hb), 4.75 (d, J = 11.5 Hz, 1H, H7), 4.44 (m, 2H, H4), 3.65–3.52 (m, 2H, H7, H6), 3.18–3.09 (m, 1H, H6), 2.44–2.33 (m, 1H, H5), 2.33–2.22 (m, 1H, H5). HR(+)- MS (m/z): (C29H24N4O7Re) calcd: 725.1155 (60%), 727.1156 (100%), found for M: 725.1162 (60%), 727.1193 (100%) and for m: 725.1146 (60%), 727.1180 (100%) for [M]+.
fac-tricarbonylrhenium(2,2′-bipyridine)(1-(3-(1H-imidazol-1-yl)propoxy)-8-ydroxyanthracene-9,10-dione) Triflate, fac-[Re(CO)3(bpy)(Aqim)](OTf) (RebpyAqim). Aqim (20 mg, 0.05 mmol) and fac-[48] (0.02 mmol) were dissolved in acetonitrile (5 mL), and the reaction mixture was heated to reflux for 24 h. The solvent was evaporated to dryness, redissolved in methanol, and purified by preparative TLC 20 × 20 cm (DCM:MeOH 9:1) and semi-preparative RP-HPLC (Method A, 2 mL.min−1 flow rate) to afford the desired complex as an orange solid. Yield was 27% (6 mg). Rf = 0.29 (DCM:MeOH, 9:1), tR 22.4 min. Calc. for C34H24F3N4O10ReS: C, 44.20; H, 2.62; N, 6.06; Found: C 44.56; H 2.78; N 6.15. IR (cm−1, KBr): 3471.49, 3413.78, 2957.82, 2027.38, 1919.09, 1903.72, 1685.54, 1637.4, 1618.04, 1448.94, 1284.36, 1202.67, 1126.71, 624.35. 1H-NMR (500 MHz, CD3CN, ppm) δ 12.87 (s, OH), 9.03 (d, J = 5.4 Hz, 2H, Ha), 8.28 (d, J = 8.2 Hz, 2H, Hd), 8.11 (t, J = 7.8 Hz, 2H, Hc), 7.96 (d, J = 7.6 Hz, 1H, H3), 7.86–7.74 (m, 3H, H3′, H2, H2′), 7.58, (dd, J = 7.6, 5.4 Hz, 2H, Hb), 7.45 (s, 1H, H7), 7.38 (d, J = 7.9 Hz, 1H, H1), 7.31 (d, J = 8.5 Hz, 1H, H1′), 7.05 (s, H8), 6.57 (s, H9), 4.32 (t, J = 6.4 Hz, 2H, H4), 3.80 (t, J = 5.6 Hz, 2H, H6), 2.15–2.13 (m, 2H, H5). HR(+)- MS (m/z): (C33H24N4O7Re) calc’d: 773.1154 (60%), 775.1197 (100%); found: 773.1142 (60%), 775.1177 (100%) [M]+.

3.3. In Vitro DNA-Binding Studies

The in vitro evaluation of the interaction of the compounds with CT DNA was conducted following the dissolution of the complexes in DMSO (1 mM) because of their limited solubility in water. The experiments were conducted in the presence of aqueous buffer solutions, ensuring that the ratio of DMSO in the final solution did not exceed 5% (v/v). Control experiments were implemented to evaluate the impact of DMSO on the data. Minimal or no alterations were observed in the spectra of CT DNA, and appropriate adjustments were made when necessary. All the procedures and relevant equations used in the in vitro study of the interaction of the compounds with CT DNA are described in the Supporting Information file [27,31,34].

3.4. Radiochemistry

Synthesis of the mixed-ligand complexes, fac-[99mTc][Tc(CO)3(Pa)(Im)]+, fac-[99mTc][Tc(CO)3(Aqpa/Appa)(Im)]+ and fac-[99mTc][Tc(CO)3(Bpy)(Aqim)]+ is as follows: a total of 450 μL of the pH-neutrilized solution of fac-[99mTc][Tc(CO)3(H2O)3]+ was added to a crimped 10 mL vial containing 50 μL of a 10−2 M methanolic solution of the bidentate chelator (picolylamine, Aqpa, Appa or 2,2′-bipyridine) under inert atmosphere. The vial was heated at 70 °C for 30 min. Then, a solution of 1M sodium bicarbonate (80 μL) and a solution of the monodentate ligand, imidazole (1 mg in 0.1 mL MeOH) or Aqim (1 mg in 0.2 mL MeCN) was added to the vial, and the mixture was heated at 70 °C for 45 min. The 99mTc-complexes were purified by HPLC (Method A), and after evaporation of the solvents, they were reconstituted in 1% Tween 80 saline solution prior to in vitro and in vivo studies. The % recoveries of the purified radiotracers from the HPC were the following: 99mTcPaIm: 48%; 99mTcAqpa: 25%; 99mTcAqpaIm: 20%; 99mTcAppaIm: 36%; 99mTcbpyAqim: 36% [35,49].
In vitro stability tests. 50 μL of the HPLC-purified 99mTc complexes (200–400 μCi) were incubated in 450 μL of either a 1 mM solution of L-histidine in 0.1 M PBS (pH = 7.4) or rat plasma, at 37 °C for 24 h. At the 1 h, 4 h and 24 h time points, samples from the mixtures were analyzed by HPLC. As for the rat plasma, prior to the injection, acetonitrile (3 × volume of the sample) was added to the sample to cause protein sedimentation, which was separated from the liquid fraction by centrifugation [50,51].
Lipophilicity studies. The distribution coefficient (D) of the 99mTc complexes was determined according to the shake flask method. 20 μL of the HPLC-purified 99mTc complexes (100–150 μCi) were mixed with 2 mL of 1-octanol and 1.98 mL of phosphate-buffer solution (0.1 M, pH = 7.4) in a centrifuge tube. The mixtures were vortexed for 1 min at room temperature and centrifuged for 10 min at 3500 rpm. The radioactivity of aliquots (50 μL) of both the 1-octanol and PBS phase was counted in a γ-counter. The experiment was run in triplicate. The distribution coefficient (D7.4) was calculated by dividing the counts of the 1-octanol phase by those of the PBS phase, and the results were expressed as logD7.4 ± SD, where SD: Standard Deviation [50,51].

3.5. Biological Evaluation of the 99mTc Complexes

Cellular uptake. The CT26 cells were seeded at a density of 5 × 10⁵/500 μL in 24-well plates and allowed to attach for 6 h. A total of 5 μL of the HPLC-purified 99mTc complexes (10–12 μCi) was added to each plate, and the cells were incubated for 15, 60, 120 and 240 min at 37 °C in an atmosphere containing 5% (v/v) CO2. At each time point, the culture media were collected, and the cells were incubated with trypsin-EDTA (200 μL, 0.25% w/v) for 2 min. Fresh culture medium DMEM-FBS (200 μL) was added, and the cells were collected in Eppendorf tubes, followed by the plate being washed with 1 × PBS (150 μL). After centrifugation of the cell suspension (5 min, 2000 rpm), the cells were washed twice with 1 × PBS (150 and 120 μL). The radioactivity of the cells and the collected supernatant solutions was counted in a γ-counter, and the (%) cell uptake was calculated. The experiment was conducted in triplicate for each time point [50,51].
Biodistribution studies. Experimentation (License No 114251/528), in accordance with the European guidelines 2010/63/EU and Greek legislation PD 56 for animal experimentation. Balb/c mice, 10–12 weeks old, with a median weight of 20–25 g, were housed in proper animal facilities (Laboratory of Development-Breeding of Animal Models and Biomedical Research, Faculty of Health Sciences, Aristotle University, EU License No EL 54 BIOexp-10) with food and water ad libitum in constant conditions of temperature and humidity and regular light cycles of 12/12 h light/dark. All animal experiments were conducted considering the 3Rs alternatives (Replacement, Refinement and Reduction), and all mice used for the experiments were not subjected to pain or discomfort.
Balb/c mice were implanted subcutaneously with 5 × 10⁶ CT26 cells on the hind right flank. One week after inoculation, when the tumor size was in the range 0.4–1 cm, the animals were injected via the tail vein with ~370 kBq of the HPLC-purified “2 + 1” 99mTc-tracers in 0.1 mL saline each. Animals were sacrificed at 30 and 120 min post-injection (p.i.) by cervical dislocation, followed by blood withdrawal and myocardial excision. The experiment and the calculated % injected dose per organ and per gram values were obtained as described in our previous work [50,51].

4. Conclusions

Herein, novel mixed-ligand tricarbonylrhenium and -technetium complexes of the formula fac-[M(CO)3(N,N′)(N)]+, with a pharmacophore unit attached either on the bidentate chelator or on the monodentate chelator, have been developed. We proposed the combination of a substituted picolylamine as a N,N’-bidentate chelator with imidazole as a N-monodentate ligand and showed that it can be successfully applied to form stable and biologically active tricarbonyltechnetium complexes for potential SPECT imaging applications. The N,N’ coordination of substituted picolylamine with the tricarbonylrhenium or -technetium core leads to the formation of diastereomers. The in vitro DNA-binding studies of the compounds indicated intercalation as a possible mode of interaction. All radiotracers bearing the pharmacophore moieties were synthesized in moderate to high radiochemical yields (35–77%, non-decay corrected), starting from the tricarbonyl precursor fac-[99mTc][Tc(CO)3(H2O)3]+, and exhibited high in vitro stability (≥90% of inert complex, at 4 h). The anthraquinone and anthrapyrazole mixed-ligand complexes exhibit lipophilicity values that are acceptable for membrane permeation, although the in vitro studies in tumor cell lines indicated low cell uptake. The tracers’ in vivo tumor uptake values in mice were in the low range; however, the complexes exhibited fast blood clearance and increased Tu/Bl and Tu/Mu values when compared to the respective bidentate tracers. By comparing the radiochemical and biological results with those obtained for the prototype 99mTcPaIm, it can be deduced that the linkage of the pharmacophore onto the complex inhibited sterically the interaction with chemical/biological competitors, preventing transchelation or dissociation. The addition of the imidazole to the sixth position of the complexes’ coordination sphere improved their pharmacokinetic properties. This new platform shows promise to be exploited for different targets as well.

Supplementary Materials

The following supporting information can be downloaded at: https://www.mdpi.com/article/10.3390/inorganics13110368/s1, Figure S1: UV-vis spectra of DMSO solution of the compounds in the presence of increasing amounts of CT DNA. The arrows show the changes upon addition of CT DNA; Figure S2: Plot of [ D N A ] ε A ε f versus [DNA] for the compounds; Figure S3: Fluorescence emission spectra (λexitation = 540 nm) for EB–DNA ([EB] = 20 μM, [DNA] = 26 μM) in buffer solution in the absence and presence of increasing amounts of the compounds (up to the value of r = 0.48). The arrow shows the changes of intensity upon addition of the compound; Figure S4: Stern–Volmer quenching plot of EB–DNA fluorescence for the compounds; Figure S5. The Re and 99mTc-complexes with Aqpa ligand; Figure S6: HPLC radiochromatograms of histidine and rat plasma stability studies of the 99mTc complexes; Table S1: Biodistribution results of 99mTcPaIm in healthy mic; Table S2: Biodistribution results of the anthraquinone and anthrapyrazole 99mTc-complexes as % ID/organ (±SD).

Author Contributions

Conceptualization, D.P.; Methodology, T.M.M., P.G., G.P. (Georgios Paparidis), G.P. (George Psomas) and I.S.V.; Resources, D.S. and I.I.; Data curation, T.M.M., P.G., G.P. (Georgios Paparidis), G.P. (George Psomas) and C.G.; Writing—original draft, T.M.M., P.G., G.P. (George Psomas) and D.P.; Writing—review & editing, G.P. (Georgios Paparidis), I.S.V. and D.P.; Supervision, D.P. All authors have read and agreed to the published version of the manuscript.

Funding

This research received no external funding.

Institutional Review Board Statement

The animal study protocol was approved by the Aristotle University of Thessaloniki Review Board for Animal Exprerimentation (License No. 114251/528, approved in 22 March 2022).

Informed Consent Statement

Not applicable.

Data Availability Statement

The original contributions presented in this study are included in the article/Supplementary Material. Further inquiries can be directed to the corresponding author.

Conflicts of Interest

The authors declare no conflict of interest.

References

  1. Duatti, A. Review on 99mTc Radiopharmaceuticals with Emphasis on New Advancements. Nucl. Med. Biol. 2021, 92, 202–216. [Google Scholar] [CrossRef]
  2. Papagiannopoulou, D. Technetium-99m Radiochemistry for Pharmaceutical Applications. J. Label. Compd. Radiopharm. 2017, 60, 502–520. [Google Scholar] [CrossRef]
  3. Rathmann, S.M.; Ahmad, Z.; Slikboer, S.; Bilton, H.A.; Snider, D.P.; Valliant, J.F. The Radiopharmaceutical Chemistry of Technetium-99m. In Radiopharmaceutical Chemistry; Springer International Publishing: Cham, Switzerland, 2019; pp. 311–333. [Google Scholar] [CrossRef]
  4. Alberto, R. [Tc(CO)3]+ Chemistry: A Promising New Concept for SPET? Eur. J. Nucl. Med. Mol. Imaging 2003, 30, 1299–1302. [Google Scholar] [CrossRef]
  5. Alberto, R.; Braband, H.; Qaisar, N. Bioorganometallic Technetium and Rhenium Chemistry: Fundamentals for Applications. Chim. Int. J. Chem. 2020, 74, 953–959. [Google Scholar] [CrossRef]
  6. Makris, G.; Kuchuk, M.; Gallazzi, F.; Jurisson, S.S.; Smith, C.J.; Hennkens, H.M. Somatostatin Receptor Targeting with Hydrophilic [99mTc/186Re]Tc/Re-Tricarbonyl NODAGA and NOTA Complexes. Nucl. Med. Biol. 2019, 71, 39–46. [Google Scholar] [CrossRef]
  7. Riondato, M.; Rigamonti, D.; Martini, P.; Cittanti, C.; Boschi, A.; Urso, L.; Uccelli, L. Oldie but Goodie: Is Technetium-99m Still a Treasure Trove of Innovation for Medicine? A Patents Analysis (2000–2022). J. Med. Chem. 2023, 66, 4532–4547. [Google Scholar] [CrossRef]
  8. Goffin, K.E.; Joniau, S.; Tenke, P.; Slawin, K.; Klein, E.A.; Stambler, N.; Strack, T.; Babich, J.; Armor, T.; Wong, V. Phase 2 Study of 99mTc-Trofolastat SPECT/CT to Identify and Localize Prostate Cancer in Intermediate- and High-Risk Patients Undergoing Radical Prostatectomy and Extended Pelvic LN Dissection. J. Nucl. Med. 2017, 58, 1408–1413. [Google Scholar] [CrossRef]
  9. Cook, G.J.R.; Wong, W.-L.; Sanghera, B.; Mangar, S.; Challapalli, A.; Bahl, A.; Bassett, P.; Leaning, D.; Schmidkonz, C. Eligibility for 177Lu-PSMA Therapy Depends on the Choice of Companion Diagnostic Tracer: A Comparison of 68Ga-PSMA-11 and 99mTc-MIP-1404 in Metastatic Castration-Resistant Prostate Cance. J. Nucl. Med. 2023, 64, 227–231. [Google Scholar] [CrossRef]
  10. Koehler, D.; Sauer, M.; Klutmann, S.; Apostolova, I.; Lehnert, W.; Budäus, L.; Knipper, S.; Maurer, T. Feasibility of 99mTc-MIP-1404 for SPECT/CT Imaging and Subsequent PSMA-Radioguided Surgery in Early Biochemically Recurrent Prostate Cancer: A Case Series of 9 Patients. J. Nucl. Med. 2023, 64, 59–62. [Google Scholar] [CrossRef]
  11. Tu, H.Y.; Huang, A.M.; Teng, C.H.; Hour, T.C.; Yang, S.C.; Pu, Y.S.; Lin, C.N. Anthraquinone Derivatives Induce G2/M Cell Cycle Arrest and Apoptosis in NTUB1 Cells. Bioorg Med. Chem. 2011, 19, 5670–5678. [Google Scholar] [CrossRef]
  12. Rescifina, A.; Zagni, C.; Varrica, M.G.; Pistarà, V.; Corsaro, A. Recent Advances in Small Organic Molecules as DNA Intercalating Agents: Synthesis, Activity, and Modeling. Eur. J. Med. Chem. 2014, 74, 95–115. [Google Scholar] [CrossRef]
  13. Kapuscinski, J.; Darzynkiewicz, Z. Interactions of antitumor agents Ametantrone and Mitoxantrone (Novatrone) with double-stranded DNA. Biochem. Pharmacol. 1985, 34, 4203–4213. [Google Scholar] [CrossRef] [PubMed]
  14. Frederick, C.A.; Williams, L.D.; Ughetto, G.; Van der Marel, G.A.; Van Boom, J.H.; Rich, A.; Wang, A.H.J. Structural Comparison of Anticancer Drug-DNA Complexes: Adriamycin and Daunomycin. Biochemistry 1990, 29, 2538–2549. [Google Scholar] [CrossRef] [PubMed]
  15. Malik, M.S.; Alsantali, R.I.; Jassas, R.S.; Alsimaree, A.A.; Syed, R.; Alsharif, M.A.; Kalpana, K.; Morad, M.; Althagafi, I.I.; Ahmed, S.A. Journey of Anthraquinones as Anticancer Agents—A Systematic Review of Recent Literature. RSC Adv. 2021, 11, 35806–35827. [Google Scholar] [CrossRef]
  16. Nurhidayah, W.; Setyawati, L.U.; Daruwati, I.; Gazzali, A.M.; Subroto, T.; Muchtaridi, M. Future Prospective of Radiopharmaceuticals from Natural Compounds Using Iodine Radioisotopes as Theranostic Agents. Molecules 2022, 27, 8009. [Google Scholar] [CrossRef]
  17. Wang, Q.; Yang, S.; Jiang, C.; Li, J.; Wang, C.; Chen, L.; Jin, Q.; Song, S.; Feng, Y.; Ni, Y.; et al. Discovery of Radioiodinated Monomeric Anthraquinones as a Novel Class of Necrosis Avid Agents for Early Imaging of Necrotic Myocardium. Sci. Rep. 2016, 6, 21341. [Google Scholar] [CrossRef]
  18. Vitor, R.F.; Esteves, T.; Marques, F.; Raposinho, P.; Paulo, A.; Rodrigues, S.; Rueff, J.; Casimiro, S.; Costa, L.; Santos, I. 99m Tc-Tricarbonyl Complexes Functionalized with Anthracenyl Fragments: Synthesis, Characterization, and Evaluation of Their Radiotoxic Effects in Murine Melanoma Cells. Cancer Biother. Radiopharm. 2009, 24, 551–563. [Google Scholar] [CrossRef]
  19. Imstepf, S.; Pierroz, V.; Raposinho, P.; Bauwens, M.; Felber, M.; Fox, T.; Shapiro, A.B.; Freudenberg, R.; Fernandes, C.; Gama, S.; et al. Nuclear Targeting with an Auger Electron Emitter Potentiates the Action of a Widely Used Antineoplastic Drug. Bioconjug Chem. 2015, 26, 2397–2407. [Google Scholar] [CrossRef]
  20. Pereira, E.; do Quental, L.; Palma, E.; Oliveira, M.C.; Mendes, F.; Raposinho, P.; Correia, I.; Lavrado, J.; Di Maria, S.; Belchior, A.; et al. Evaluation of Acridine Orange Derivatives as DNA-Targeted Radiopharmaceuticals for Auger Therapy: Influence of the Radionuclide and Distance to DNA. Sci. Rep. 2017, 7, 42544. [Google Scholar] [CrossRef]
  21. Ji, A.-Y.; Jin, Q.-M.; Zhang, D.-J.; Zhu, H.; Su, C.; Duan, X.-H.; Bian, L.; Sun, Z.-P.; Ni, Y.-C.; Zhang, J.; et al. Novel 18F-Labeled 1-Hydroxyanthraquinone Derivatives for Necrotic Myocardium Imaging. ACS Med. Chem. Lett. 2017, 8, 191–195. [Google Scholar] [CrossRef]
  22. Liang, J.; Luo, Q.; Zhang, D.; Jin, Q.; Liu, L.; Liu, W.; Gao, M.; Zhang, J.; Yin, Z. SPECT Imaging of Treatment-Related Tumor Necrosis Using Technetium-99m-Labeled Rhein. Mol. Imaging Biol. 2019, 21, 660–668. [Google Scholar] [CrossRef]
  23. Imstepf, S.; Pierroz, V.; Rubbiani, R.; Felber, M.; Fox, T.; Gasser, G.; Alberto, R. Organometallic Rhenium Complexes Divert Doxorubicin to the Mitochondria. Angew. Chem.-Int. Ed. 2016, 55, 2792–2795. [Google Scholar] [CrossRef] [PubMed]
  24. Paparidis, G.; Akrivou, M.; Psomas, G.; Vizirianakis, I.S.; Hatzidimitriou, A.; Gabriel, C.; Sarigiannis, D.; Papagiannopoulou, D. Novel Tricarbonylrhenium-Anthrapyrazole Complexes with DNA-Binding and Antitumor Properties: In Vitro and In Vivo Pharmacokinetic Studies with 99mTc-Analogue. Inorganics 2024, 12, 254. [Google Scholar] [CrossRef]
  25. Schibli, R.; La Bella, R.; Alberto, R.; Garcia-Garayoa, E.; Ortner, K.; Abram, U.; Schubiger, P.A. Influence of the Denticity of Ligand Systems on the in Vitro and in Vivo Behavior of 99mTc(I)-Tricarbonyl Complexes: A Hint for the Future Functionalization of Biomolecules. Bioconjug Chem. 2000, 11, 345–351. [Google Scholar] [CrossRef]
  26. Yazdani, A.; Janzen, N.; Banevicius, L.; Czorny, S.; Valliant, J.F. Imidazole-Based [2 + 1] Re(I)/99mTc(I) Complexes as Isostructural Nuclear and Optical Probes. Inorg. Chem. 2015, 54, 1728–1736. [Google Scholar] [CrossRef]
  27. Wolfe, A.; Shimer, G.; Meehan, T. Polycyclic Aromatic Hydrocarbons Physically Intercalate into Duplex Regions of Denatured DNA. Biochemistry 1987, 26, 6392–6396. [Google Scholar] [CrossRef]
  28. Tan, J.-H.; Zhang, Q.-X.; Huang, Z.-S.; Chen, Y.; Wang, X.-D.; Gu, L.-Q.; Wu, J.Y. Synthesis, DNA Binding and Cytotoxicity of New Pyrazole Emodin Derivatives. Eur. J. Med. Chem. 2006, 41, 1041–1047. [Google Scholar] [CrossRef] [PubMed]
  29. Dimitrakopoulou, A.; Dendrinou-Samara, C.; Pantazaki, A.A.; Alexiou, M.; Nordlander, E.; Kessissoglou, D.P. Synthesis, Structure and Interactions with DNA of Novel Tetranuclear, [Mn4(II/II/II/IV)] Mixed Valence Complexes. J. Inorg. Biochem. 2008, 102, 618–628. [Google Scholar] [CrossRef] [PubMed]
  30. Luis García-Giménez, J.; González-Álvarez, M.; Liu-González, M.; Macías, B.; Borrás, J.; Alzuet, G. Toward the Development of Metal-Based Synthetic Nucleases: DNA Binding and Oxidative DNA Cleavage of a Mixed Copper(II) Complex with N-(9H-Purin-6-Yl)Benzenesulfonamide and 1,10-Phenantroline. Antitumor Activity in Human Caco-2 Cells and Jurkat T Lymphocy. J. Inorg. Biochem. 2009, 103, 923–934. [Google Scholar] [CrossRef]
  31. Lakowicz, J.R. Principles of Fluorescence Spectroscopy, 3rd ed.; Plenum Press: New York, NY, USA, 2006. [Google Scholar]
  32. Wilson, W.D.; Ratmeyer, L.; Zhao, M.; Strekowski, L.; Boykin, D. The Search for Structure-Specific Nucleic Acid-Interactive Drugs: Effects of Compound Structure on RNA versus DNA Interaction Strength. Biochemistry 1993, 32, 4098–4104. [Google Scholar] [CrossRef]
  33. Zhao, G.; Lin, H.; Zhu, S.; Sun, H.; Chen, Y. Dinuclear Palladium(II) Complexes Containing Two Monofunctional [Pd(En)(Pyridine)Cl]+ Units Bridged by Se or S. Synthesis, Characterization, Cytotoxicity and Kinetic Studies of DNA-Binding. J. Inorg. Biochem. 1998, 70, 219–226. [Google Scholar] [CrossRef] [PubMed]
  34. Heller, D.P.; Greenstock, C.L. Fluorescence Lifetime Analysis of DNA Intercalated Ethidium Bromide and Quenching by Free Dye. Biophys. Chem. 1994, 50, 305–312. [Google Scholar] [CrossRef] [PubMed]
  35. Yazdani, A.; Janzen, N.; Czorny, S.; Valliant, J.F. Technetium(I) Complexes of Bathophenanthrolinedisulfonic Acid. Inorg. Chem. 2017, 56, 2958–2965. [Google Scholar] [CrossRef] [PubMed]
  36. Tsantili-Kakoulidou, A.; Demopoulos, V.J. Drug-like Properties and Fraction Lipophilicity Index as a Combined Metric. ADMET DMPK 2021, 9, 177–190. [Google Scholar] [CrossRef]
  37. Schmidt, S.; Trogler, W.; Basolo, F. Pentacarbonyl Rhenium Halides. Inorg. Synth. 1985, 23, 41. [Google Scholar]
  38. Nitschke, J.; Schmidt, S.P.; Trogler, W.C. Properties of (Trifluoromethanesulfonato)Pentacarbonylmanganese(I) and -Rhenium(I). Reactions in Superacid Solvents. Inorg. Chem. 1985, 24, 1972–1978. [Google Scholar] [CrossRef]
  39. Alberto, R.; Schibli, R.; Egli, A.; Schubiger, A.P.; Abram, U.; Kaden, T.A. A Novel Organometallic Aqua Complex of Technetium for the Labeling of Biomolecules: Synthesis of [99mTc(OH2)3(CO)3]+ from [99mTcO4] in Aqueous Solution and Its Reaction with a Bifunctional Ligand. J. Am. Chem. Soc. 1998, 120, 7987–7988. [Google Scholar] [CrossRef]
  40. Marmur, J. A Procedure for the Isolation of Deoxyribonucleic Acid from Micro-Organisms. J. Mol. Biol. 1961, 3, 208–218. [Google Scholar] [CrossRef]
  41. Reichmann, M.E.; Rice, S.; Thomas, C.; Doty, P. A Further Examination of the Molecular Weight and Size of Desoxypentose Nucleic Acid. J. Am. Chem. Soc. 1954, 76, 3047–3053. [Google Scholar] [CrossRef]
  42. Mantso, T.; Vasileiadis, S.; Lampri, E.; Botaitis, S.; Perente, S.; Simopoulos, C.; Chlichlia, K.; Pappa, A.; Panayiotidis, M.I. Hyperthermia Suppresses Post—In Vitro Proliferation and Tumor Growth in Murine Malignant Melanoma and Colon Carcinoma. Anticancer Res. 2019, 39, 2307–2315. [Google Scholar] [CrossRef]
  43. Aindelis, G.; Tiptiri-Kourpeti, A.; Lampri, E.; Spyridopoulou, K.; Lamprianidou, E.; Kotsianidis, I.; Ypsilantis, P.; Pappa, A.; Chlichlia, K. Immune Responses Raised in an Experimental Colon Carcinoma Model Following Oral Administration of Lactobacillus Casei. Cancers 2020, 12, 368. [Google Scholar] [CrossRef]
  44. Tiptiri-Kourpeti, A.; Spyridopoulou, K.; Santarmaki, V.; Aindelis, G.; Tompoulidou, E.; Lamprianidou, E.E.; Saxami, G.; Ypsilantis, P.; Lampri, E.S.; Simopoulos, C.; et al. Lactobacillus Casei Exerts Anti-Proliferative Effects Accompanied by Apoptotic Cell Death and up-Regulation of TRAIL in Colon Carcinoma Cells. PLoS ONE 2016, 11, e0147960. [Google Scholar] [CrossRef]
  45. Shao, J.; Zhang, F.; Bai, Z.; Wang, C.; Yuan, Y.; Wang, W. Synthesis and Antitumor Activity of Emodin Quaternary Ammonium Salt Derivatives. Eur. J. Med. Chem. 2012, 56, 308–319. [Google Scholar] [CrossRef]
  46. Liu, Q.-X.; Hu, Z.-L.; Zhao, Z.-X. A New Fluorescent–Colorimetric Chemosensor for Cobalt(Ii) Ions Based on Bis-Benzimidazolium Salt with Three Anthraquinone Groups. New J. Chem. 2018, 42, 20049–20055. [Google Scholar] [CrossRef]
  47. Kydonaki, T.E.; Tsoukas, E.; Mendes, F.; Hatzidimitriou, A.G.; Paulo, A.; Papadopoulou, L.C.; Papagiannopoulou, D.; Psomas, G. Synthesis, Characterization and Biological Evaluation of 99mTc/Re-Tricarbonyl Quinolone Complexes. J. Inorg. Biochem. 2016, 160, 94–105. [Google Scholar] [CrossRef] [PubMed]
  48. Hevia, E.; Pérez, J.; Riera, L.; Riera, V.; del Río, I.; García-Granda, S.; Miguel, D. Insertion of Unsaturated Organic Electrophiles into Molybdenum—Alkoxide and Rhenium—Alkoxide Bonds of Neutral, Stable Carbonyl Complexes. Chem. Eur. J. 2002, 8, 4510–4521. [Google Scholar] [CrossRef] [PubMed]
  49. Pitchumony, T.S.; Banevicius, L.; Janzen, N.; Zubieta, J.; Valliant, J.F. Isostructural Nuclear and Luminescent Probes Derived from Stabilized [2 + 1] Rhenium(I)/Technetium(I) Organometallic Complexes. Inorg. Chem. 2013, 52, 13521–13528. [Google Scholar] [CrossRef]
  50. Tzovas, G.; Papadimitriou, N.; Angelakarou, E.; Bompola, G.; Miliotou, A.N.; Kakafika, M.G.; Papadopoulou, L.C.; Iakovou, Ι.; Gabriel, C.; Sarigiannis, D.; et al. Synthesis and Biological Evaluation of 99mTc-Tricarbonyl Complexes of C-3 Carboxy Derivatives of Fluoroquinolones in Infection and Tumor Animal Models. Inorganica Chim. Acta 2024, 562, 121894. [Google Scholar] [CrossRef]
  51. Paparidis, G.; Akrivou, M.; Malis, G.; Lazou, M.; Psomas, G.; Vizirianakis, I.; Papagiannopoulou, D. Novel Technetium-99m Anthrapyrazole Derivatives as DNA-Targeted Agents. In Proceedings of the European Molecular Imaging Meeting 2022, Thessaloniki, Greece, 15–8 March 2022; p. 507. [Google Scholar]
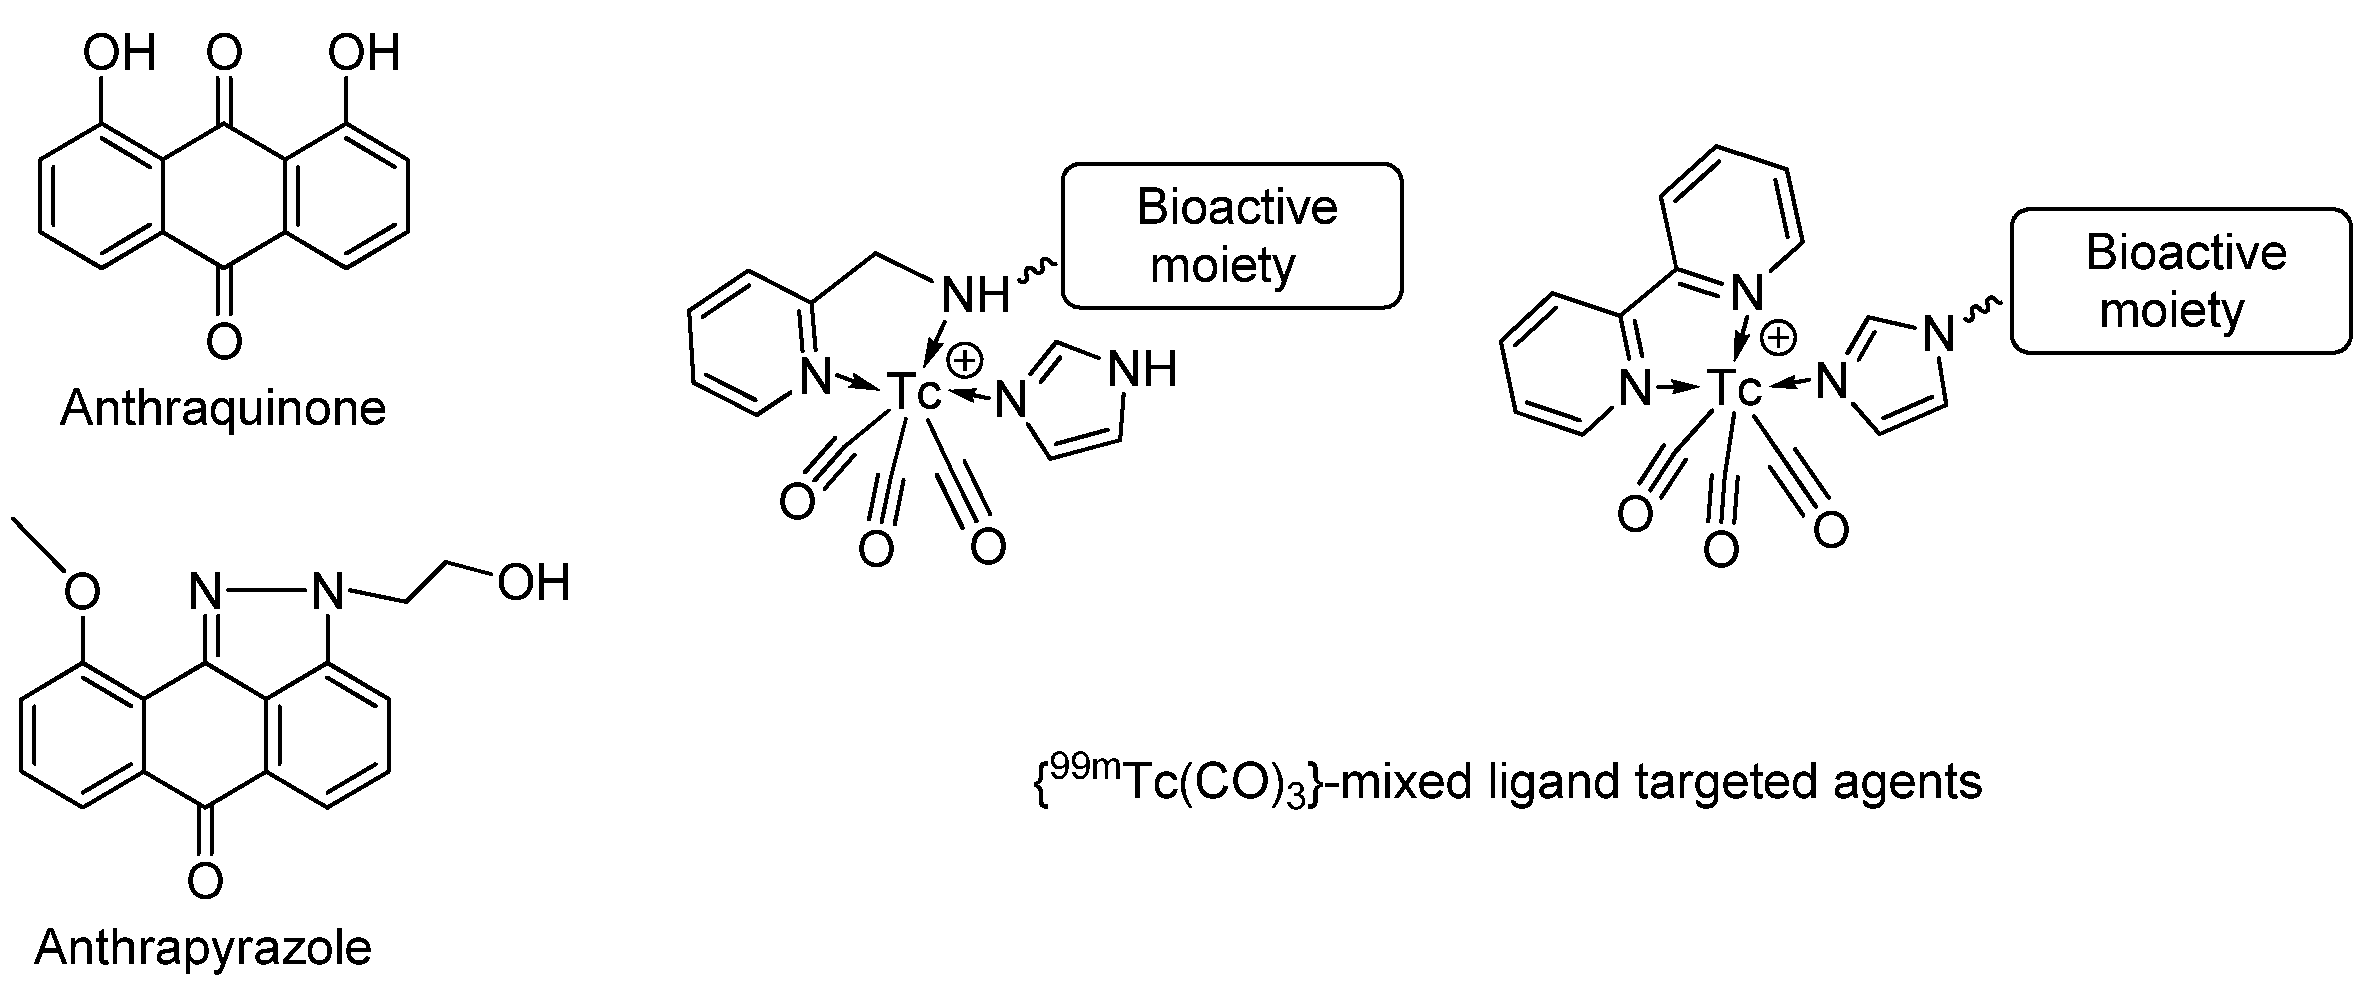
Figure 1. Design of tricarbonyltechnetium-99m anthraquinone and anthrapyrazole mixed-ligand complexes as DNA-targeted imaging agents.
Inorganics 13 00368 g001
Figure 2. Relative viscosity (η/η0)1/3 of CT DNA (0.1 mM) in buffer solution (150 mM NaCl and 15 mM trisodium citrate at pH 7.0) in the presence of the compounds at increasing amounts (r = [compound]/[DNA]).
Inorganics 13 00368 g002
Figure 3. (A) Fluorescence emission spectra (λexcitation = 540 nm) for EB-DNA conjugate ([EB] = 40 µM, [DNA] = 40 µM) in buffer solution (150 mM NaCl and 15 mM trisodium citrate at pH = 7.0) in the absence and presence of increasing amounts (up to r = [compound]/[DNA] = 0.48) of ReAppaIm. The arrow shows the changes in intensity upon increasing amounts of the complex. (B) Plot of relative EB-DNA fluorescence emission intensity at λemission = 594 nm (I/Io, %) vs. r (r = [compound]/[DNA]) in the presence of the compounds (up to 25.1% of the initial EB-DNA fluorescence for Aqpa, 23.9% for Aqim, 22.6% for RePaIm, 25.1% for RebpyIm, 21.8% for ReAppaIm, 22.0% for ReAqpaIm and 28.7% for RebpyAqim).
Inorganics 13 00368 g003
Figure 4. Comparative HPLC analysis of selected analogous Re- and 99mTc-complexes.
Inorganics 13 00368 g004
Figure 6. Distribution of 99mTcPaIm in healthy mice (% ID/g).
Inorganics 13 00368 g006
Scheme 1. Synthesis of ligands. (i) 1,3-dibromopropane, TBAB, K2CO3; (ii) 2-picolylamine, K2CO3; (iii) KH, imidazole.
Inorganics 13 00368 sch001
Scheme 3. Synthesis of mixed-ligand technetium-99m complexes.
Inorganics 13 00368 sch003
Table 2. UV–vis spectroscopic data concerning the interaction of the compounds with CT DNA: UV–band (λmax, in nm) (percentage of the observed hyper-/hypo-chromism (ΔA/A0, in %), blue-/red shift of the λmax (Δλ, in nm)); DNA-binding constant (Kb, in M−1).
CompoundBand, λ (nm) (ΔA/Aο a (%), Δλ b (nm))Kb (M−1)
Appa [24]278 (−10, 0); 326 (sh) (−3.5, 0); 441(−4, +2)7.74 (±0.03) × 104
Aqpa266 (−12 a, +2 b); 414 (−13, 0); 435 sh (−13, 0)7.64 (±0.11) × 105
Aqim270 (−17, 0); 417 (−2, 0)1.62 (±0.27) × 106
RePaIm268 (−17, +3)9.09 (±0.42) × 104
RebpyIm282 (+30 a, 0); 320 sh (−12, elim); 352 (−15, +4)6.54 (±0.55) × 105
ReAppaIm274 (−4, 0); 299 sh (−5, +2); 323 sh (+5, 0); 437 (−2, 0)5.65 (±0.45) × 105
ReAqpaIm277 (+10, 0); 416 (−8, 0); 437 sh (−7, 0)1.61 (±0.17) × 105
RebpyAqim266 (−20, +2); 310 sh (−8, 0); 320 (−7,0); 411 (−6, 0)5.90 (±0.18) × 105
sh = shoulder; elim = eliminated. a “−” denotes hypochromism, “+” denotes hyperchromism. b “+” denotes red shift, “−” denotes blue shift.
Table 3. Fluorescence features of the EB-displacement studies of the compounds: percentage of EB-DNA fluorescence emission quenching (ΔI/I0, in %), Stern-Volmer (KSV, in M−1) and quenching constants (Kq, in M−1s−1).
CompoundΔΙ/Ιο (%)KSV (M−1)Kq (M−1s−1)
Aqpa74.91.26 (±0.06) × 1055.47 (±0.24) × 1012
Aqim76.12.02 (±0.06) × 1058.77 (±0.27) × 1012
RePaIm77.46.83 (±0.25) × 1042.97 (±0.11) × 1012
RebpyIm74.91.00 (±0.25) × 1054.35 (±0.11) × 1012
ReAppaIm78.28.24 (±0.30) × 1043.58 (±0.13) × 1012
ReAqpaIm78.05.56 (±0.26) × 1042.42 (±0.11) × 1012
RebpyAqim71.31.96 (±0.07) × 1058.50 (±0.30) × 1012
Table 4. RP-HPLC elution times of the rhenium and technetium-99m complexes and radiochemical yield (RCY) of the 99mTc complexes.
ComplexHPLC Elution Time (min)RCY * (%)
fac-[M(CO)3(Pa)(Im)]+14.7 (M = Re),
15.8 (M = 99mTc)
73 ± 4
fac-[M(CO)3(Appa)(Im)]+19.85/20.35, 7:3 (M = Re), 20.00/20.42, 7:3 (M = 99mTc)65 ± 3
fac-[M(CO)3(Aqpa)(Solv)]+19.89/20.55, 45:55 (Re),
20.01/20.55, 33:67(99mTc)
75 ± 6
fac-[M(CO)3(Aqpa)(Im)]+19.25/20.75, 7:3 (Re), 19.48/20.87, 7:3 (99mTc)40 ± 5
fac-[M(CO)3(bpy)(Aqim)]+20.87 (Re)/20.85 (99mTc)75 ± 5
* Non-isolated and estimated by radio-HPLC by 3–5 independent analyses.
Table 5. Lipophilicity of complexes; in vitro stability of complexes in L-histidine and rat plasma.
ComplexHistidine Stability (%)Rat Plasma Stability (%) *Lipophilicity (logD7.4)
1 h 4 h24 h1 h4 h24 h
99m TcPaIm92855744 (20)37 (21)27 (47)0.39 ± 0.13
99m TcAppaIm97979695 (21)95 (27)91(34)1.62 ± 0.04
99m TcAqpaIm98989297 (14)90 (19)98 (22)1.98 ± 0.01
99m TcbpyAqim96968993 (28)97 (35)90 (38)0.89 ± 0.15
* Values denoted as % intact complex in the supernatant after precipitation (% protein binding).
Table 6. Biodistribution results of the anthraquinone and anthrapyrazole 99mTc-complexes as %ID/g (±SD).
Organ99mTcAqpa99mTcAqpaIm99mTcAppaIm99mTcbpyAqim
30 min120 min30 min120 min30 min120 min30 min120 min
Blood5.70 ± 1.002.62 ± 1.140.89 ± 0.040.47 ± 0.316.79 ± 1.841.39 ± 0.101.58 ± 0.590.64 ± 0.33
Tumor1.83 ±0.181.23 ± 0.230.90 ± 0.050.85 ± 0.614.24 ± 1.392.34 ± 1.292.51 ± 1.760.63 ± 0.42
Heart6.44 ± 0.554.65 ± 1.171.29 ± 0.070.89 ± 0.271.79 ± 0.360.81 ± 0.072.87 ± 0.701.63 ± 0.64
Liver34.01 ±5.7529.20 ± 3.4735.52 ± 6.5017.15 ± 3.4626.08 ± 8.5021.16 ± 3.7931.12 ± 11.0219.20 ± 5.95
Lungs9.38 ± 1.304.26 ± 0.350.98 ± 0.050.69 ± 0.092.34 ± 0.440.96 ± 0.152.17 ± 0.631.05 ± 0.29
Muscle1.27 ± 0.260.94 ± 0.110.38 ± 0.030.32 ± 0.150.88 ± 0.140.50 ± 0.111.34 ± 0.530.83 ± 0.71
Kidneys12.48 ± 0.289.90 ± 0.9153.03 ± 3.0936.50 ± 11.0424.09 ± 3.6924.06 ± 3.8929.44 ± 16.8124.56 ± 12.09
Spleen3.74 ± 0.341.92 ± 0.570.80 ± 0.120.59 ± 0.221.44 ± 0.310.76 ± 0.112.40 ± 0.731.15 ± 0.25
Intestine5.10 ± 1.0511.62 ± 2.5123.41 ± 3.5931.40 ± 7.5912.78 ± 2.2834.13 ± 4.426.97 ± 2.6020.68 ± 7.51
Stomach13.57 ±7.3312.21 ± 6.473.54 ± 2.175.09 ± 2.783.59 ± 2.4212.84 ± 7.0654.67 ± 28.8626.25 ± 17.65
Tu/Bl0.33 ± 0.050.49 ± 0.130.99 ± 0.092.30 ± 0.610.70 ± 0.451.63 ± 0.921.28 ± 0.851.16 ± 0.02
Tu/Mu1.48 ± 0.311.34 ± 0.662.49 ± 0.212.42 ± 1.424.76 ± 0.985.10 ± 3.551.51 ± 0.601.36 ± 0.97
Disclaimer/Publisher’s Note: The statements, opinions and data contained in all publications are solely those of the individual author(s) and contributor(s) and not of MDPI and/or the editor(s). MDPI and/or the editor(s) disclaim responsibility for any injury to people or property resulting from any ideas, methods, instructions or products referred to in the content.