Abstract
A facile and environmentally benign method for single-phase barium titanate synthesis in a water vapor medium was studied to reveal the mechanism of phase transformation of the initial simple oxide mixture and estimate the capability of the product to be used as a raw material for low-frequency dielectric ceramics. The composition and structure of the reactants’ mixture, treated in vapor at 130–150 °C as well as at 230 °C for various time periods, were investigated by means of XRD, SEM, TEM, EDX, and FTIR methods. The kinetics of the occurring phase transformation can be described using the Johnson–Mehl–Avrami–Erofeev equation. The reaction between the initial oxides was considered as a topochemical process with an apparent activation energy of 75–80 kJ mol−1. A crucial role in this process belonged to the water vapor medium, which facilitated the generation of the reaction zone and the spreading inward of the solid particles. The synthesized tetragonal barium titanate powder (mean particle size of 135 nm) was sintered using a conventional technique at 1250 °C to obtain ceramics with grains of about 2 μm. Capacitance measurements identified a permittivity and dielectric loss factor of the ceramics that reached 3879 and 6.7 × 10⁻³, respectively, at 1 kHz and room temperature.
1. Introduction
Barium titanate is a highly in-demand material for a wide area of applications, including the production of ferro- and piezoelectric ceramics [1,2] and composites [3,4], as well as optoelectronic devices [5], thermistors [6], semiconductors [7], transducers [8], photocatalysts [9,10], coatings [11], and products for biomedicine [12,13]. A key feature of such a versatile application of BaTiO3 is the ability of its crystals to perform spontaneous polarization in a temperature range below 120 °C, which is known as its Curie point. BaTiO3 possesses a typical perovskite structure with a sequence of phase transitions: cubic to tetragonal (120–130 °C), tetragonal to orthorhombic (about 5 °C), orthorhombic to rhombohedral (about −90 °C) [14]. Besides cubic modification, the mentioned phases demonstrate ferroelectric properties due to their spontaneous polarization, among which the most prominent are reported for the tetragonal BaTiO3. A vivid example of this was reported in [15] for BaTiO3 ceramics produced by spark plasma sintering, with a room-temperature permittivity of up to 60,000 and a low dielectric loss factor of about 0.07.
The methods of BaTiO3 powder production are mostly focused on the needs of the multilayer ceramic capacitor (MLCC) industry, as it remains the largest consumer of barium titanate. A wide variety of approaches in solid-state as well as wet chemistry have been developed to produce highly pure single-phase BaTiO3 powders with a narrow size distribution and smooth particle shape [16,17,18]. The groups of solid-state [19,20], mechanochemical [21,22,23], complexation [24,25,26,27,28], co-precipitation [29,30], sol-gel [31], and hydrothermal [32,33,34] techniques for obtaining BaTiO3 took their rightful place in laboratories as well as in industries of various scales. Besides the properties of the final product, there are different factors to consider when choosing strategies for BaTiO3 powder production, such as energy consumption, the availability and cost of the initial substances, the complexity of the equipment and its servicing, and the environmental impact of the process. In this regard, a method of complex oxide synthesis in a medium of water vapor, as previously reported for several compositions [35,36] including BaTiO3 [37,38,39,40], appears attractive as it is performed with widely available simple oxides as starting compounds and requires fairly mild conditions for the reaction (a temperature below 350 °C and autogenous vapor pressure). Compared to a technically relative hydrothermal method, this one does not involve the use of aggressive media with hard-to-remove auxiliary substances (NaOH and KOH). Unlike hydrothermal reactions, which are realized by the mechanism of the reactants’ dissolution, followed by homogenous nucleation and the precipitation of the product [41,42,43], the synthesis of BaTiO3 in water vapor was assumed to occur via solid-state transformation [39,40]. However, there is a lack of available detailed studies of the mechanism for this transformation. In addition, the properties of ceramics formed from BaTiO3 powder synthesized in water vapor were poorly investigated, as well as a technology for their production not being properly developed [38,39]. The current work comprised a detailed study of the processes underlying BaTiO3 formation from the initial barium and titanium oxides in a medium of water vapor, including the kinetics and microstructural evolution of the reaction system. For the first time, a stabilizing effect of acidic additives on the reactants’ transformation was revealed and the activation energy of the process was assessed. To estimate the technological capability of the synthesized powder as a raw material for dielectric ceramics, its sintering behavior, as well as the properties of the derived ceramics, were investigated in comparison with the recent data.
2. Results
2.1. Study of Barium Titanate Formation in a Water Vapor Medium
2.1.1. Composition of the Reaction Mixture
The conversion of initial equimolar mixtures of BaO and TiO2 with rutile modification was observed during isothermal treatment at 130 °C in a vapor atmosphere with an autogenous pressure of 0.27 MPa. The values of the conversion calculated from the X-ray diffraction (XRD) patterns of the obtained products are shown in Figure 1a. After less than 100 min of isothermal treatment, the obtained samples contained no BaTiO3 phase, according to XRD. Further changes in the composition of the initial oxide mixture demonstrated an abrupt and non-monotonic character and had poor reproducibility (for 110, 120, and 130 min, groups of 3 samples (shown as 1, 2, and 3) were synthesized simultaneously).
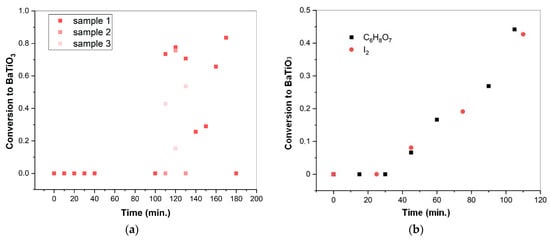
Figure 1.
Conversion of an equimolar mixture of BaO and TiO2 in a pure state (a) and with the additive of iodine and 1.2 wt. % of citric acid (b) in water vapor at 130 °C and 0.27 MPa. The standard uncertainties of the obtained points did not exceed 0.046.
The introduction of some additives to the reaction mixture appeared to have a stabilizing effect on its transformation into BaTiO3. Figure 1b shows the initial parts of the kinetic curves representing BaTiO3 formation from the BaO and TiO2 mixture with the addition of iodine, as well as 1.2 wt. % of citric acid. Due to the presence of these additives, the observed part of the kinetic curves exhibited monotonic growth following the induction period, which took about 30 min. Citric acid, which was introduced by simple weighting and dry mixing, allowed for easier control of its amount in the reaction mixture, compared to iodine deposited through its sublimation. For this reason, citric acid was selected as an additive in further experiments. Table 1 presents the values of conversion corresponding to the mixtures of starting oxides with different amounts of citric acid, which have been treated in water vapor for equal periods of time. A three-fold difference in the amounts of citric acid did not significantly affect the degree of the reagents’ conversion. For subsequent experiments on BaTiO3 formation kinetics, 1.2 wt. % of citric acid was introduced to the reaction mixture.

Table 1.
Conversion of the equimolar mixture of BaO and TiO2 with the addition of citric acid after treatment in water vapor at 130 °C and 0.27 MPa for 105 min. The standard uncertainty of the conversion measurements is indicated as u(α).
The thermal behavior of citric acid has been extensively studied in a few works [44,45,46]. When heated in air, anhydrous citric acid was reported to melt above 153 °C and then transform sequentially into aconitic acid at about 175 °C and into methyl maleic anhydride at 223 °C. From these data, it could be supposed that citric acid preserved its chemical composition in a temperature range of 130–150 °C used in the further study of BaTiO3 formation.
2.1.2. Formal Kinetic Analysis of BaTiO3 Formation
Figure 2a demonstrates the degree of conversion in the initial mixture of BaO and TiO2 versus the duration of its treatment in a water vapor medium in the presence of citric acid. For each of the temperatures, there are two curves, calculated based on the amounts of BaO and TiO2, respectively, remaining after the reaction. The kinetic curves possess a sigmoidal shape peculiar to the topochemical process. When processed at 130 as well as at 140 °C, the reaction system passed the induction period, which is associated with the formation and spreading of the reaction zone. The kinetic curve corresponding to 150 °C shows no induction period because this could occur during the heating process. After about 150 min of treatment at 150 °C, the conversion in the oxide mixture reached a plateau corresponding to 86% of the BaTiO3 having been formed. Similarly, at 130 and 140 °C, the conversion of reagents did not exceed 83–84%, with a plateau reached after 225 and 210 min of processing, respectively.
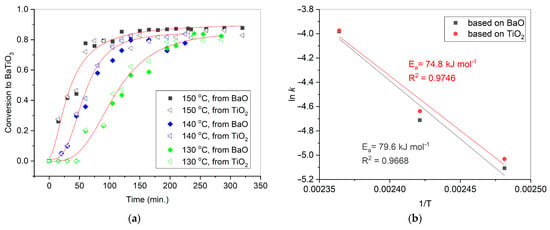
Figure 2.
Conversion of BaO and TiO2 equimolar mixtures with 1.2 wt. % of citric acid in water vapor at 130–150 °C, calculated from the amounts of BaCO3 as well as TiO2 in the products (a); the Arrhenius plots derived from the kinetic curves (b). The standard uncertainties of the obtained points in (a) did not exceed 0.037.
The analysis of the kinetic curves was conducted using the Johnson–Mehl–Avrami–Erofeev equation, often applied to processes in the solid state [47]:
where α is the conversion, k is the rate constant, t is time, and m is a parameter. The results of the kinetic curve linearization are presented in Figure A1 in the Appendix A, while the calculated ln k and the parameter m are shown in Table 2.

Table 2.
Kinetic parameters for BaTiO3 formation in water vapor medium from a mixture of BaO and TiO2, with the addition of 1.2 wt. % of citric acid. The data was calculated from the amounts of BaO (BaCO3) and TiO2 remaining in the product. Standard uncertainties are indicated as u(m) and u(ln k).
According to Hancock and Sharp [48], some specific values of the parameter m could be used to determine the limiting stage of the solid-state reaction. Particularly when m = 1.0–1.24, the reaction is limited by processes occurring at the phase boundary. This could be applied to the considered reaction between BaO and TiO2 at 150 °C as the parameter was about unity in that case. At lower temperatures, the approach used by Hancock and Sharp is not applicable, indicating that neither diffusion (m = 0.54–0.62) nor nucleation (m = 2.0–3.0) are the only limiting factors.
An Arrhenius plot was used to extract the apparent activation energy from the collected kinetic data (Figure 2b). Its values were calculated based on the fractions of barium and titanium oxides remaining in the mixture after each iteration of treatment; they were rather close and reached 74.8 and 79.6 kJ mol−1, respectively. The corresponding standard uncertainties of the activation energy measurements were 1.2 and 1.5 kJ mol−1.
2.1.3. Microstructural Study of BaTiO3 Formation
At a temperature of 130 °C, the reaction between BaO and TiO2 in water vapor occurred the most slowly among the considered conditions, which allowed a detailed observation of BaTiO3 formation by varying the time of treatment. In the sample obtained after 30 min of processing and then drastically cooled, two main kinds of particle shapes were observed by means of transmission electron microscopy (TEM) (Figure 3a). Local energy-dispersive X-ray spectroscopy (EDX) (Figure 3b) revealed that the rounded shapes belonged to the TiO2 phase (probe II in Figure 3), while the elongated particles contained Ba, C, and O atoms among the detectable elements (probe I in Figure 3).
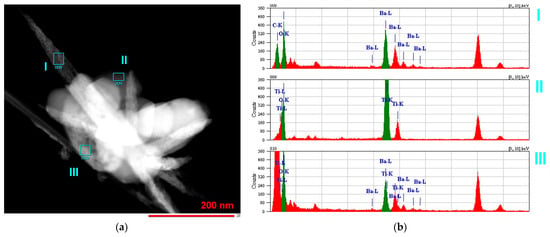
Figure 3.
TEM (a) and EDX (b) studies of a sample prepared from the BaO and TiO2 equimolar mixtures with 1.2 wt. % of citric acid in water vapor at 130 °C for 30 min.
XRD analysis of this sample showed that it consisted of BaCO3 and TiO2 in rutile modification (Figure 4). The presence of BaCO3 could be explained by the intensive interaction between Ba-containing species, formed from BaO in the water vapor and CO2 from the air, to which the sample was exposed after synthesis. In addition, probe III contained both types of metal ions (Ba, Ti) as well as oxygen and was likely to represent the early stage of BaTiO3 formation. The composition of the studied sample corresponded to the termination of the induction period of the reaction (Figure 2a). A longer reaction time at 130 °C resulted in the accumulation of the newly formed BaTiO3 phase, which can be observed in the XRD patterns (Figure 4).
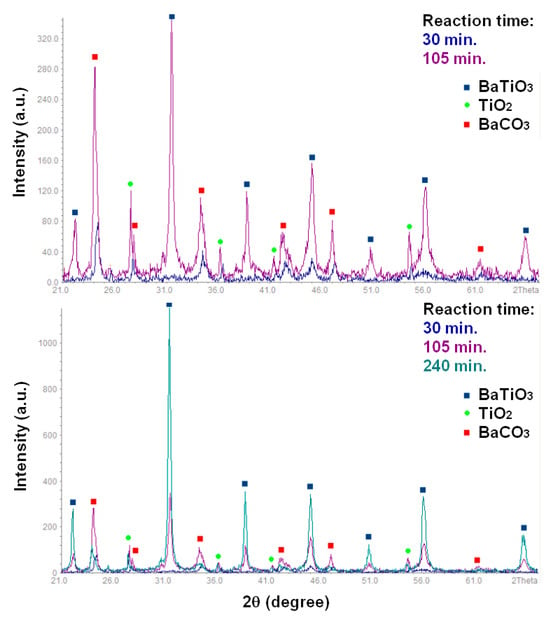
Figure 4.
XRD patterns of the samples obtained from the BaO and TiO2 equimolar mixtures with 1.2 wt. % of citric acid in water vapor at 130 °C for 30–240 min.
Figure 5a shows the particles of TiO2 in contact with the elongated particles of BaO derivative in the sample treated for 30 min at 130 °C. Surface diffusion of the reagents led to the formation of a neck between their particles. In this area, indicated as a reaction zone in Figure 5a, BaTiO3 nucleation was expected to occur and to be followed by the formation of the product layer. Similar processes occurred in the agglomerate, as shown at the bottom of Figure 5b, where one can see rounded TiO2 crystals that are partially covered with the mass of another reagent. Also in Figure 5b,c, elongated particles of Ba-containing reagent possessing a dendrite morphology are clearly visible, which points to their formation from a melt [49]. EDX analysis of the particles is presented in Figure 5d. The origin of the melt is probably connected to the initial BaO hydroxylation and hydration in water vapor, followed by its melting. Upon drastic cooling of the reaction system, this melt solidified in the shape of dendrites. When in contact with air, the hydroxylated barium oxide formed BaCO3, which was identified by XRD and EDX. Another image of the dendrite structures is shown in Figure A2 in the Appendix B.
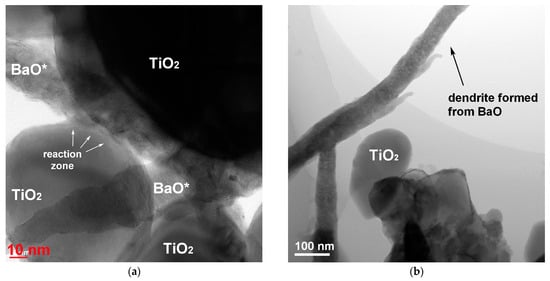
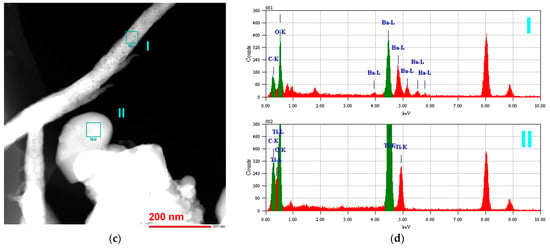
Figure 5.
TEM images (a–c) and EDX analysis (d) of the sample prepared from BaO and TiO2 equimolar mixtures with 1.2 wt. % of citric acid in water vapor, performed after 30 min. BaO* indicates the phase formed from the initial BaO component after treatment in vapor and subsequent storage in air.
2.1.4. FTIR Study of BaTiO3 Formation
Figure 6 shows fragments of Fourier-transform infrared reflectance (FTIR) spectra of the powders obtained at 130 °C by treatment of the BaO and TiO2 equimolar mixture in vapor for 15–285 min. The whole spectra in the range of 4000–350 cm−1 are shown in Figure A3. Valence vibration bands of Ti-O and Ba-O bonds [37,50] were detected at about 400 and 500 cm−1 in every studied sample except for the spectra corresponding to samples taken after 15 and 30 min of treatment. The latter band was asymmetrically broadened toward higher wavenumbers. This band broadening pointed to a weakening of Ti-O-Ti bonds and matched the induction period in the corresponding kinetic curve (Figure 2a). Further narrowing of the mentioned band during treatment reflected the saturation of the titanium coordination sphere, which naturally accompanied the formation of a new phase of BaTiO3. There were bands between 1100 and 900 cm−1 (1095, 1025, 948, and 928 cm−1) that gradually appeared in the spectra corresponding to 30 to 285 min of treatment and might be considered overtones of structural vibration in the range of 600–350 cm−1. On the one hand, this points to an increase in metal–oxide bonding with the time spent on reactant conversion in BaTiO3. On the other hand, the multiplicity of these overtones highlights the imperfect structure of the solid and the presence of similar bonds of different energies, which can be attributed to the solid-state transformation.
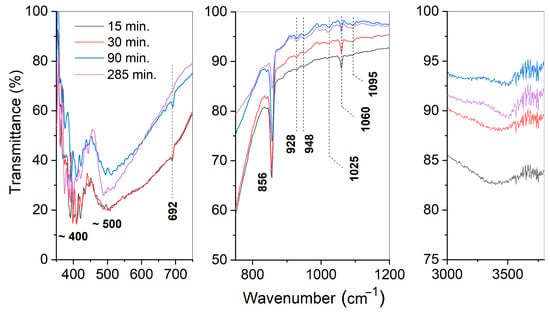
Figure 6.
Fragments of the FTIR spectra of the samples prepared from BaO and TiO2 equimolar mixtures with 1.2 wt. % of citric acid in water vapor after different periods of treatment.
Wide bands observed in the range of 3500–3400 cm−1, as well as narrower bands at 1753 and 1060 cm−1, were related to the presence of the adsorbed water molecules and structural hydroxyl groups [51]. Noticeably, the band detected at about 3400 cm−1 and originating from the OH-stretching vibrations in the samples treated for 15 and 30 min changed its shape in those samples synthesized for 90 or 285 min. The mentioned band splits into a broader band that moved to slightly lower frequencies, along with a sharper band at 3500 cm−1. Such an evolution of the FTIR spectrum indicates the involvement of water in the reactants’ transformation. Band splitting in the mentioned wavelength region was studied with respect to metal oxides exposed to water vapor and can be explained by the different nature of OH groups [52]. The sharp band corresponded to the vibrations in hydroxyls connected with metal ions from the lattice, while the broad band corresponded to OH groups formed by structural oxygen protonation. The resolution of the bands was found to depend on the morphology of the solid, as well as on the nature of the crystallographic planes with which the hydroxyls were bonded. The currently observed transition from a single broad band to a split one pointed to structural changes in the solid phase, caused by the failure of the parent TiO2 structure and the formation of new crystallographic planes of BaTiO3.
The spectra shown in Figure 6 and Figure A3 in the Appendix B demonstrate the presence of BaCO3 in the studied samples, as identified by its characteristic bands found at 2445, 2361, 1415, 856, and 692 cm−1.
2.2. Properties of Barium Titanate Ceramics Sintered from Powder Synthesized in a Water Vapor Medium
2.2.1. Characterization of the Synthesized Powder
In the kinetics and mechanism study of BaTiO3 formation in water vapor at 130–150 °C, as described above, no single-phase powder was obtained. A plateau in the BaTiO3 formation curve corresponding to 150 °C was observed when the reagents’ conversion approached 86%. In a previous study, it was shown that the reaction in an equimolar BaO and TiO2 mixture in a vapor medium had not finished, even after an isothermal period at 230 °C for 20 h [37]. The results of the reactants’ conversion after longer exposure to the vapor conditions are shown in Figure 7a. At 230 °C and 2.94 MPa of vapor pressure, an equimolar mixture of BaO and TiO2 had transformed completely into BaTiO3 after 48 h of treatment (Figure 7b). At lower temperatures and the corresponding pressures of vapor, the accumulation of BaTiO3 in the mixture occurred more slowly, and the reagents had not reached 100% conversion, even after 96 h of treatment. The observed behavior of the system can be explained by the diffusion limitations caused by the growing product layer. The rise of temperature up to 230 °C was accompanied naturally by an increase in the diffusion coefficient of barium ions on the solid oxide matrix. In addition, the higher corresponding autogenous pressure (2.94 MPa at 230 °C, compared to 0.48 MPa at 150 °C) favored the hydroxylation of the initial TiO2 as well as the forming of BaTiO3, thus contributing to the diffusion processes.
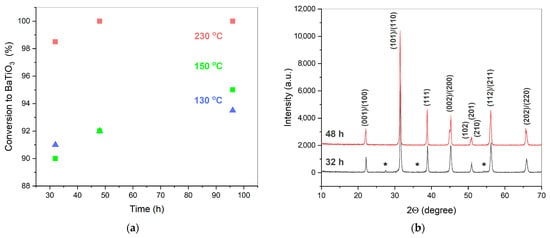
Figure 7.
Conversion vs. time graphs for the synthesis of BaTiO3 from the BaO and TiO2 mixtures in water vapor at 130–230 °C and under autogenous pressure for 32–96 h (a); XRD patterns of the samples synthesized at 230 °C and 2.94 MPa for 32 and 48 h (b). The samples were preliminarily washed of the residual Ba2+ ions. * indicates the TiO2 phase (rutile, PDF2 # 021-1276). The Miller indices correspond to the BaTiO3 phase (PDF2 # 075-2117). Standard uncertainties of the obtained points in (a) did not exceed 0.049.
When the Ba/Ti molar ratio was increased to 1.10–1.14, a single-phase BaTiO3 was successfully obtained within a shorter treatment period in vapor [39,40], which can be explained by a higher gradient of barium ion concentrations in the reaction zone. In the current study, the initial Ba/Ti molar ratio was designed so as to obtain single-phase BaTiO3 in vapor within a reasonable time.
Figure 8 shows the results of XRD analysis of the samples that were synthesized from the initial oxide mixture by treatment in vapor at 230 °C for 20 h. In accordance with an earlier study [37], an equimolar mixture of the reactants led to the formation of BaTiO3 with an admixture of TiO2. Table 3 presents the calculated amounts of TiO2 remaining in the prepared powders. One can see that the increase in the Ba/Ti ratio to 1.3 gradually continued until full consumption of the initial TiO2 and the formation of single-phase BaTiO3 powder.
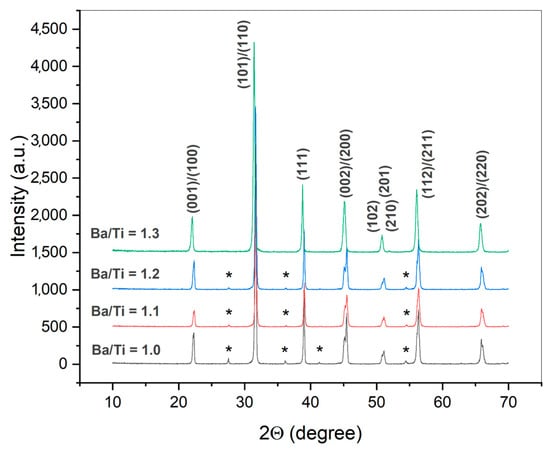
Figure 8.
XRD patterns of the samples synthesized from BaO and TiO2 mixtures with different Ba/Ti molar ratios in water vapor at 230 °C and 2.94 MPa for 20 h. The samples were preliminarily washed of the residual Ba2+ ions. * indicates the TiO2 phase (rutile, PDF2 # 021-1276). The Miller indices correspond to the BaTiO3 phase (PDF2 # 075-2117).

Table 3.
Residual TiO2 amounts and tetragonality (c/a) in BaTiO3 samples synthesized in water vapor at 230 °C and 2.94 MPa for 20 h, with different initial Ba/Ti molar ratios (u(c/a) is the standard uncertainty of c/a measurement).
The XRD patterns of the synthesized powders corresponded to BaTiO3 in a tetragonal modification. It was noticeable that the growth of barium excess in the reaction system resulted in the disappearance of the characteristic splitting of (002)/(200) peaks. As was calculated from the XRD data, the approach of the reaction system to the full transformation of TiO2 into the product was accompanied by a decrease in BaTiO3 tetragonality (c/a cell parameter ratio) (Table 3). This could be connected to the formation of a core-shell structure of BaTiO3 particles [53,54]. This phenomenon has been described for the nanosized particles and grains of BaTiO3. The tetragonal phase, which is known to be stable below the Curie point of BaTiO3 (~130 °C), has been reported to deteriorate due to a high concentration of structural defects near the surface of the particle [55]. For this reason, the phase partially transforms into pseudocubic modification, which leads to a composite structure in the particle: a pseudocubic shell and a tetragonal core. The pseudocubic phase possesses the same XRD profile as in the high-temperature cubic modification of BaTiO3. The coexistence of the mentioned BaTiO3 modifications and the changes in their fractions between synthesized powders with different Ba/Ti ratios resulted in different tetragonality, which was calculated as an average value for each sample’s volume. When BaTiO3 was synthesized in a vapor atmosphere without the use of citric acid, a similar core-shell structure of its particles was assumed from XRD and Raman studies [37].
The morphologies of the initial TiO2 powder and the resulting single-phase BaTiO3 are shown in Figure 9. From an analysis of the scanning electron microscopy (SEM) images, it is evident that the BaTiO3 powder consisted of micron-sized agglomerates of round-shaped particles in the range of 90 to 220 nm, with a mean value of 135 nm (Figure 9b). The observed agglomerates were likely to be formed directly from the particles of TiO2 (Figure 9a). A similar inheritance of the starting TiO2 morphologies by BaTiO3 during synthesis in water vapor is described elsewhere [40]. Previously, in [37], particles obtained by a similar method to the current route but without the addition of citric acid were found to consist of agglomerated crystals, which were 101-nm-sized on average and showed a narrow size distribution. In the current research, a larger mean size pointed to faster nuclei growth in the presence of citric acid. Noticeably, the agglomerates visually differed in their density and neighbored almost-dispersed particles (Figure 9b). This pointed to the gradual deagglomeration of BaTiO3 during the treatment in vapor, which would naturally be accompanied by an increase in the powder’s surface area. Such an increase in surface area could be considered a factor governing the decrease in the powder’s tetragonality when approaching the reaction’s termination (Table 3).
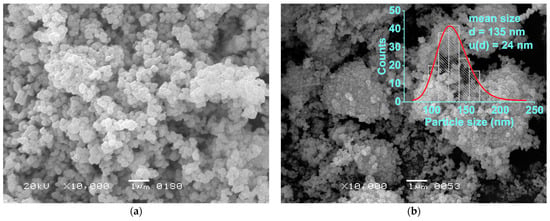
Figure 9.
SEM images of the initial TiO2 powder (a) and the BaTiO3 synthesized from it in water vapor at 230 °C and 2.94 MPa after 20 h, with a molar ratio of Ba/Ti = 1.3 in the reaction system (d is the mean particle size, calculated from the measurements of 160 particles; u(d) is the uncertainty of the measurement) (b).
The single-phase BaTiO3 powder synthesized from the BaO and TiO2 mixture with Ba/Ti = 1.3 was selected as a raw material for ceramics manufacturing via a conventional route, including room-temperature pressing followed by high-temperature sintering. To estimate its sintering behavior, a dilatometric analysis was conducted (Figure 10). From 40 to 1025 °C, only thermal expansion at a constant rate was detected. In the interval at 1025–1080 °C, a first stage of shrinkage associated with the particles’ reorientation occurred and was followed by an interval of sintering, accompanied by pore elimination. The highest rate of shrinkage was found between 1252 and 1270 °C. Above 1295 °C, the real sintering was expected to end and change into grain growth.
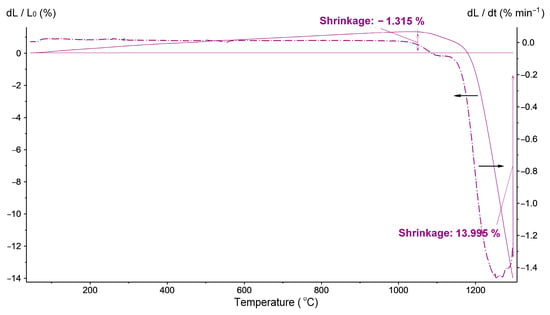
Figure 10.
Shrinkage curve of the BaTiO3 powder synthesized in water vapor at 230 °C and 2.94 MPa after 20 h, with a molar ratio of Ba/Ti = 1.3.
2.2.2. Properties of the Sintered Ceramics
Starting from the results of the dilatometric investigation of the synthesized BaTiO3 powder, its sintering was carried out in a temperature range of 1250–1350 °C. According to the XRD analysis of the prepared ceramics, single-phase tetragonal BaTiO3 was obtained at each of the sintering temperatures (Figure 11). Material consolidation and elimination of the structural defects during the ceramics processing halted any spontaneous polarization, which led to tetragonality enhancement compared to the raw powder (c/a = 1.0057) (Table 4). In addition, the tetragonality slightly increased with the sintering temperature.
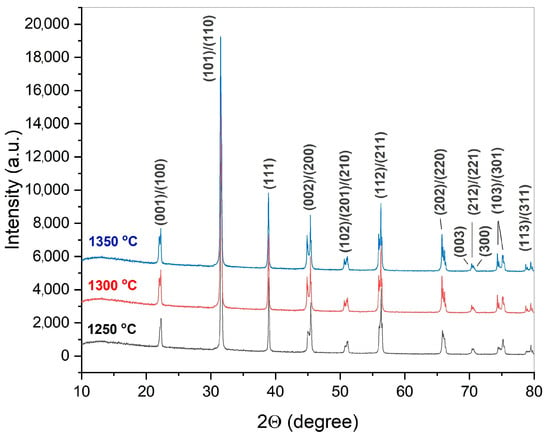
Figure 11.
XRD patterns of crushed BaTiO3 ceramics manufactured from the synthesized powder by uniaxial pressing at 150 MPa, followed by 1 h of sintering at 1250–1350 °C. The Miller indices indicate tetragonal BaTiO3 modification.

Table 4.
Structural and dielectric properties of the sintered BaTiO3 ceramics (u is the standard uncertainty of measurement).
SEM study of the prepared ceramics revealed a formation of rather dense microstructures (Figure 12). When sintered at 1250 °C, the material consisted of micron-sized grains (mean size of 2.09 μm; uncertainty of the measurement, 0.44 μm) partially separated by open pore spaces (Figure 12a,b). Its relative density exceeded 94% (Table 4), which could be considered high for conventional ceramic technology.
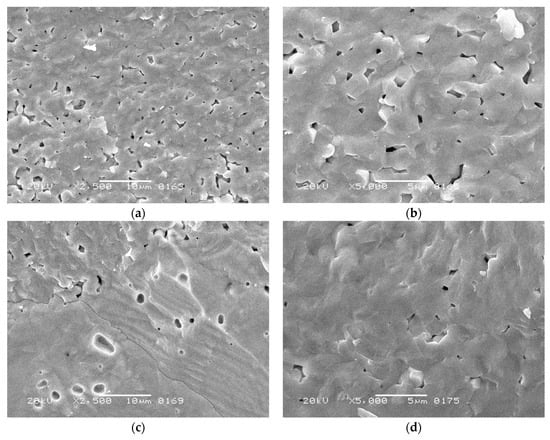
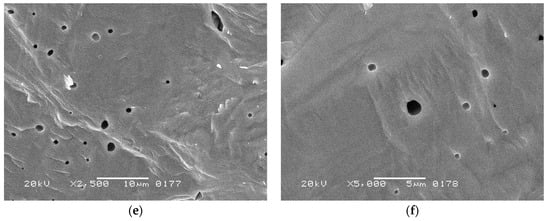
Figure 12.
SEM images of the fracture surfaces of BaTiO3 ceramics manufactured from synthesized powder by uniaxial pressing at 150 MPa, followed by 1 h of sintering at: (a,b) 1250 °C; (c,d) 1300 °C; (e,f) 1350 °C.
The material sintered at 1300 °C exhibited slightly higher density but its microstructure was less homogenous, demonstrating micron-grained areas (Figure 12c,d) neighboring the regions with round-shaped pores. The latter probably originated from discontinuous grain growth [56] in a fine-grained matrix. The presence of these large grains lowered the concentration of paraelectric grain boundaries [57,58], thus contributing to the increase in tetragonality. In addition, the large grains demonstrated a striped 90°-domain structure [59], which agrees with the stabilization of tetragonal modification. At 1350 °C, the sintering process occurred with the involvement of a liquid phase, which was reflected in the formation of large grains with spherical pores inside the material (Figure 12e,f). Liquid phase formation was caused by possible peritectoid and eutectoid processes, as reported for nearly stoichiometric barium titanate compositions at 1250–1320 °C [60,61]. The relative density of the corresponding sample reached 96% and its tetragonality increased as well. However, the grain boundaries nearly disappeared, which, together with the darkening of the sample, proved the vicinity of the overburnt state.
Despite an enhancement in the relative density and tetragonality of BaTiO3 ceramics caused by the increase in the sintering temperature, their dielectric properties at room temperature demonstrated high sensitivity to the microstructure (Table 4). The highest permittivity was determined for the fine-grained material sintered at 1250 °C. Structural inhomogeneities in the sample sintered at 1300 °C led to a comparative decrease in the permittivity, while approaching a burnout at 1350 °C caused a drastic decrease in this characteristic. The dielectric loss factor exhibited sensitivity to the type of pore space. It was higher in the sample with open intergranular porosity (in ceramics sintered at 1250 °C) than in those with combined inter- and intragranular pores (sintered at 1300 °C) or just closed porosity (sintered at 1350 °C). Open pores were prone to adsorbing water molecules from the atmosphere, which caused extra conductivity.
The thermal behavior of the dielectric permittivity observed in the prepared ceramic samples in a range from room temperature to above 140 °C and at frequencies between 20 Hz and 1 MHz is shown in Figure 13. The increase in the sintering temperature from 1250 to 1350 °C resulted in a significant fall in room-temperature dielectric permittivity, as well as in its value in a range up to 120 °C. Below 110 °C, the ceramics sintered at 1250 and 1300 °C demonstrated a decrease in permittivity with the rise in frequency, which can be explained by the reducing number of realized polarization mechanisms (Figure 13a,b). However, the sample sintered at 1350 °C was less sensitive to frequency (Figure 13c). The highest permittivity in the Curie point was exhibited by the sample prepared at 1250 °C, while the lowest value was observed for the one sintered at 1300 °C. Probably, this was caused by inhomogeneities in the ceramics’ microstructure formed at 1300 °C. The drifting of the Curie point to higher temperatures that was observed with an increase in the sintering temperature reflects the stabilization of the ferroelectric modification, as also indicated by the increase in tetragonality (Table 4).
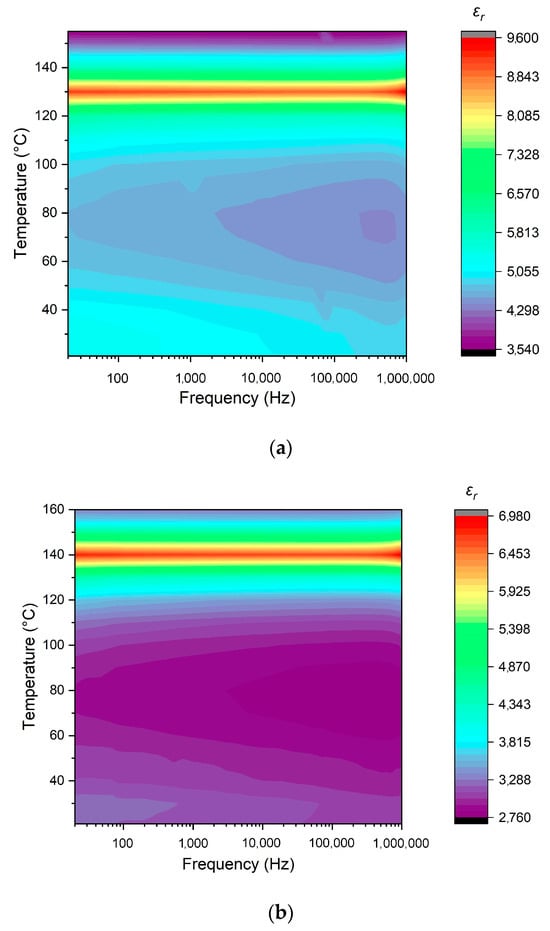
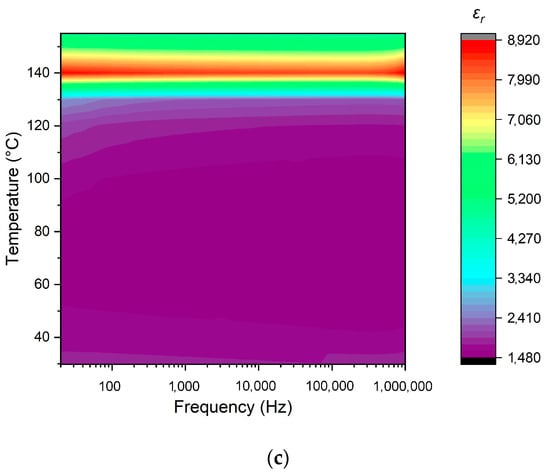
Figure 13.
Temperature- and frequency-dependent behavior of the dielectric permittivity of BaTiO3 ceramics manufactured at: (a) 1250 °C; (b) 1300 °C; (c) 1350 °C.
3. Discussion
Once subjected to water vapor, the particles of BaO and TiO2 from the initial reaction mixture adsorbed water molecules and underwent surface hydroxylation. BaO is known to add water with the formation of a layer of amorphous hydroxide and further hydration into Ba(OH)2·xH2O [62,63,64]. For TiO2, both the molecular and dissociative adsorption of water are typical [65]. Apparently, this resulted in the formation of similar charges on the particles’ surfaces, which led to their mutual repulsion. The introduction of a foreign electrolyte locally changed the electrostatic conditions in the mixture and supported the formation of contacts between the reactants’ particles. For this reason, the presence of small amounts of citric acid in the reaction mixture stabilized the initial stage of BaO and TiO2 interaction. An additive of iodine reacted with water molecules to generate HI and HIO, which acted in a similar way as citric acid, making for stable growth of the reagents’ conversion over time.
The observed reaction between the initial oxides possessed the features of a topochemical process [66]. The conversion vs. time curves for the BaO-TiO2 system in water vapor demonstrated a sigmoidal shape, with an induction period imprinted at 130 and 140 °C. At this stage, hydration and hydroxylation of the reactants occurred and was accompanied by melting of the hydrated Ba(OH)2, as was revealed by TEM. These processes allowed the formation and growth of a contact area between the reactants’ particles. Due to their interaction with water molecules, the surfaces of the reactants became highly defective, which facilitated the appearance of a reaction zone. BaTiO3 nucleation and its growth initiated the autolocalization of the process and moved the front of the reaction inward toward the TiO2 particles. This autolocalization was accompanied and promoted by hydroxylation of the oxide structure, as shown by the FTIR analysis. The corresponding part of the kinetic curves exhibited an increase in the BaTiO3 fraction. From our analysis of the kinetics, it appears that this complex process is likely to be controlled by phase transformations, rather than by diffusion. However, the collected data did not allow any unambiguous conclusion as to whether the process was limited by product nucleation or by the phase-boundary phenomena. Nevertheless, the final part of the kinetic curves, i.e., when reaching a plateau, could be caused by the diffusion limitations, which were overcome by enough of an excess of barium ions in the reaction medium.
The calculated apparent activation energy of the studied reaction (up to 80 kJ mol−1) was close to the level reported for BaTiO3 formation from TiO2 in a concentrated Ba(OH)2 solution (105 kJ mol−1), which is recognized as a topochemical process as well [67]. A conventional high-temperature solid-state synthesis of BaTiO3 was characterized by a higher activation energy of 361 kJ mol−1, while for the reaction between the same reactants (BaCO3 and TiO2) in water vapor at 700 °C, this was determined as 142 kJ mol−1 [68]. These results emphasized the key role of water in facilitating the studied topochemical reaction, due to defect generation on the surface of the reactants and further in their bulk. The current study proved the propositions and conclusions drawn in earlier works on the mechanism of BaTiO3 formation from a mixture of simple oxides in water vapor [37,39,40].
In the current study, the BaTiO3 powder synthesized in the water vapor exhibited fairly high capability in the manufacturing of ceramics for low-frequency applications. Table 5 shows some recent data on the structural and dielectric characteristics of pure BaTiO3 ceramics obtained by the conventional technique. Most of these materials were produced from nanosized or nearly nanosized powders by pressing at different loadings (50–400 Pa), with subsequent sintering at a temperature in the range of 1050–1350 °C for several hours. It is known that the achievement of full density is quite difficult using the conventional route, so the reported materials possessed relative densities of 92–97% of the theoretical value (6.02 g cm−3). However, density is not the deciding factor for the functional properties of BaTiO3 ceramics. In the case of sufficient densification, the grain size is known to affect the dielectric properties of BaTiO3. Among them, the highest permittivity was observed when the grain size of BaTiO3 was about 1 μm. This effect can be seen in the data in Table 5 as well. The ceramics obtained in the current work exhibited worthwhile values of permittivity compared to the other mentioned results. In addition, its dielectric loss factor was maintained at the level of 0.02 up to 1 MHz, which is acceptable for this class of materials [69]. Nevertheless, the use of novel approaches that are different from conventional ceramics manufacturing, for instance, two-step sintering [70,71,72], the cold sintering process [73,74,75,76], etc., would open up possibilities for microstructural engineering and the effective application of BaTiO3 powders synthesized in a water vapor medium.

Table 5.
Structural and dielectric properties of the BaTiO3 ceramics process using a conventional technique.
4. Materials and Methods
Barium oxide (BaO, purity > 99.9%, GOST 10203-78, supplied by the LLC Laverna-Lab, Moscow, Russia), titanium dioxide in a rutile modification (TiO2, purity > 99.9%, STP TU COMP 2-340-11, supplied by LLC Komponent-Reactiv, Moscow, Russia), citric acid monohydrate (C6H8O7·H2O, purity > 99.9%, GOST 3652-69, supplied by JSC LenReactiv, St Petersburg, Russia) and crystalline iodine (I2, purity > 98%, GOST 4159-79, supplied by JSC LenReactiv, St Petersburg, Russia) were used as the initial substances for the synthesis of BaTiO3.
To prepare a reaction mixture, calculated amounts of BaO and TiO2 with a Ba/Ti molar ratio of 1.0, 1.1, 1.2, or 1.3 were mixed together using an agate mortar and pestle and then placed into PTFE containers. If it was required, a corresponding amount of citric acid monohydrate (0.6; 1.2 or 2.4 wt. % with respect to the mixture) was added to the reactants and underwent joint mixing. To introduce the iodine additive to the reactants, it was preliminarily applied to the surface of TiO2, as follows. An open crucible with 4 g of TiO2 was placed into a glass vessel containing 1 g of I2. The buks was closed and stored at room temperature for 4 days. After that, the TiO2 was removed and used for the preparation of a reaction mixture, as described above. The stabilizing additives to the reaction mixture were selected so that: (1) they generated protons in an aqueous medium and (2) they were solid at standard conditions, in order to prepare the mixture without it getting wet. The PTFE container with the reaction mixture was placed into a laboratory stainless-steel autoclave of 12–17 cm3 in volume, which contained 2 mL of distilled water at the bottom. The autoclave was sealed and placed into a furnace to be heated up to 130–230 °C at a rate of 80 °C h−1. The corresponding vapor pressure generated inside the autoclave was 0.27–2.94 MPa. The autoclave was stored in these conditions for 0 to 20 h, after which it was removed from the furnace and rapidly cooled by dipping its bottom in cold water (at about 14 °C). This method of cooling allowed water to condense on the bottom inside the autoclave, separately from the container with the product. Afterward, the autoclave was opened and the product was removed from it and dried in air at a temperature of 70–80 °C for 12 h. If it was required, the product was washed in 5 wt. % acetic acid solution and distilled water to remove the excess barium ions.
Ceramics processing was carried out with the use of 5 wt. % of polyvinyl alcohol aqueous solution as a temporary binder. Green pellets were prepared by uniaxial pressing at 150 MPa and were then sintered at 1250, 1300, or 1350 °C for 1 h in air. The density of the obtained ceramic samples was determined by the Archimedes method using kerosene. The processing procedure, as well as metallization, have been described in detail elsewhere [84].
XRD analysis of the synthesized powders and crushed ceramic samples was conducted with the use of the following diffractometers: the STOE STADI P with CuKα radiation (STOE & Cie GmbH, Darmstadt, Germany), the Rigaku D/Max-2500 with CuKα radiation (Rigaku Corp. Tokyo, Japan), and the PowDiX 600 with CuKα+β radiation (CJSC Linev Adani, Minsk, Belarus). The patterns were recorded in the range of 10° < 2θ < 80°, with a step of 0.02°. The ICDD PDF2 database was used for the phase analysis [85]. Whole diffraction pattern profile fitting was carried out using the Le Bail method by means of GSAS (version Win32) [86] and FullProf (version January 2012) [87] software. The structural models of BaTiO3 (tetragonal), TiO2 (rutile), and BaCO3 (witherite) were found in the Crystallography Open Database [88]. Quantitative analysis of the samples, as well as cell parameter refinement, was performed using the Rietveld method [89].
Scanning electron microscopy of the powders and the ceramic fracture surfaces was performed with a Jeol JSM 6380 (Jeol Ltd., Tokyo, Japan). Transmission electron microscopy, combined with an EDX study, was conducted using a Jeol JEM-2100 F (Jeol Ltd., Tokyo, Japan).
FTIR study of the synthesized powders was conducted with a WQF-530A spectrometer (Beijing Beifen-Ruili Analytical Instrument (Group) Co., Ltd., Beijing, China) in a wavenumber range of 4000–350 cm−1 by the attenuated total reflectance method.
The permittivity and dielectric loss factor of the sintered ceramic disks with metalized-plane parallel sides were calculated using the capacitance measurements carried out with a GW Instek LCR-78210 meter (Good Will Instrument Co., Ltd., Xinbei, Taiwan).
5. Conclusions
For this paper, we have studied in detail the process of BaTiO3 formation from a mixture of solid oxides of barium and titanium in a medium of water vapor, this being in equilibrium with the liquid at 130–230 °C and at 0.27–2.94 MPa. This process was revealed to occur as a topochemical reaction, which could be divided into an induction period and the subsequent periods of rapid conversion and deceleration. The initial reactants first underwent surface hydration and then further hydroxylation, which facilitated the autolocalization of the process. Barium oxide was found to transform into a melt when exposed to the conditions of synthesis in water vapor. The apparent activation energy of BaTiO3 formation in water vapor was estimated as 75–80 kJ mol−1. To obtain a single-phase BaTiO3 in these conditions, an excess of barium ions was required, corresponding to a Ba/Ti molar ratio equal to 1.3 in the initial mixture. At 230 °C and at a vapor pressure of 2.94 MPa, a tetragonal BaTiO3 powder with a mean particle size of 135 ± 24 nm was obtained. Based on this powder, a conventional ceramics technique allowed the preparation of single-phase tetragonal BaTiO3 ceramics with a grain size of about 2 μm, a room-temperature permittivity of 3820–3791, depending on the frequency, and a dielectric loss factor of less than 0.02. The synthesis of BaTiO3 in water vapor was proved as an effective and environmentally benign route to producing high-performance dielectric ceramics.
Author Contributions
Conceptualization, A.A.K., Y.D.I. and M.N.D.; methodology, A.A.K., Y.D.I., M.N.D. and A.V.S.; validation, A.A.K., Y.D.I. and M.N.D.; formal analysis, A.A.K., A.N.K. and L.A.A.; investigation, A.A.K., G.P.M., A.V.E., A.D.S., A.N.K., L.A.A. and V.E.B.; resources, M.N.D. and A.V.S.; data curation, A.A.K.; writing—original draft preparation, A.A.K.; writing—review and editing, A.V.S.; visualization, A.A.K.; supervision, Y.D.I., M.N.D. and A.V.S.; project administration, A.V.S.; funding acquisition, A.V.S. All authors have read and agreed to the published version of the manuscript.
Funding
The article was written as part of the implementation of indicators for projects funded from the state budget or other external sources, namely, the National Project “Science and Universities”, to achieve the resulting “Creation of new laboratories, including under the guidance of young promising researchers (growing result)” FSFZ-2022-0003.
Data Availability Statement
The research data are available upon request.
Acknowledgments
The study was supported in part by the Lomonosov Moscow State University Program of Development. The authors are grateful to Nellya A. Popova from the Mendeleev University of Chemical Technology of Russia for her kind assistance in the dilatometric study. The authors would like to thank Igor A. Chmutin for his help with the study of the thermal behavior of the permittivity.
Conflicts of Interest
The authors declare no conflicts of interest.
Appendix A
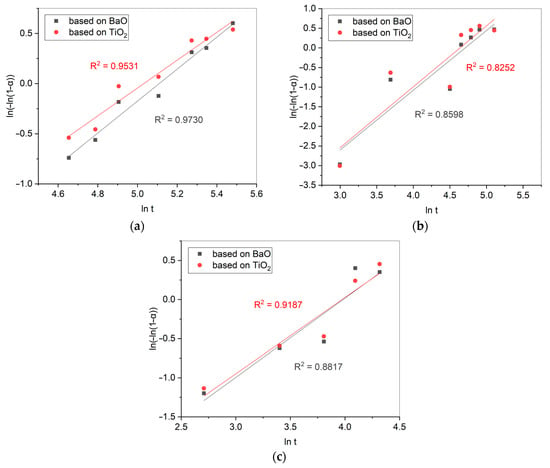
Figure A1.
Johnson–Mehl–Avrami–Erofeev linearization of the kinetic curves of BaTiO3 formation in a water vapor medium at different temperatures: (a) 130 °C; (b) 140 °C; (c) 150 °C. The data were obtained from the amounts of unreacted BaO and TiO2 for each duration of the reaction.
Appendix B
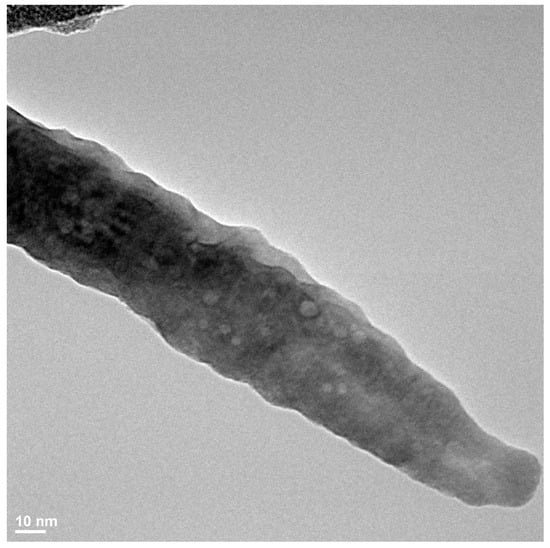
Figure A2.
TEM image of a dendrite structure found in a sample prepared from BaO and TiO2 equimolar mixtures with 1.2 wt. % of citric acid in water vapor at 130 °C for 30 min.
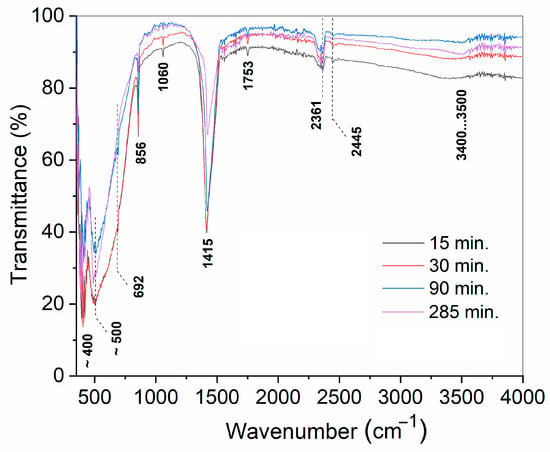
Figure A3.
FTIR spectra of the samples prepared from BaO and TiO2 equimolar mixtures with 1.2 wt. % of citric acid in water vapor, after different durations of treatment.
References
- Zhao, C.; Wu, H.; Li, F.; Cai, Y.; Zhang, Y.; Song, D.; Wu, J.; Lyu, X.; Yin, J.; Xiao, D.; et al. Practical High Piezoelectricity in Barium Titanate Ceramics Utilizing Multiphase Convergence with Broad Structural Flexibility. J. Am. Chem. Soc. 2018, 140, 15252–15260. [Google Scholar] [CrossRef]
- Sufiiarov, V.; Kantyukov, A.; Popovich, A.; Sotov, A. Structure and Properties of Barium Titanate Lead-Free Piezoceramic Manufactured by Binder Jetting Process. Materials 2021, 14, 4419. [Google Scholar] [CrossRef] [PubMed]
- Schipf, D.R.; Yesner, G.H.; Sotelo, L.; Brown, C.; Guild, M.D. Barium Titanate 3–3 Piezoelectric Composites Fabricated Using Binder Jet Printing. Addit. Manuf. 2022, 55, 102804. [Google Scholar] [CrossRef]
- Li, M.; Jiang, B.; Cao, S.; Song, X.; Zhang, Y.; Huang, L.; Yuan, Q. Flexible Cellulose-Based Piezoelectric Composite Membrane Involving PVDF and BaTiO3 Synthesized with the Assistance of TEMPO-Oxidized Cellulose Nanofibrils. RSC Adv. 2023, 13, 10204–10214. [Google Scholar] [CrossRef] [PubMed]
- Cao, Y.; Tan, S.L.; Cheung, E.J.H.; Siew, S.Y.; Li, C.; Liu, Y.; Tang, C.S.; Lal, M.; Chen, G.; Dogheche, K.; et al. A Barium Titanate-on-Oxide Insulator Optoelectronics Platform. Adv. Mater. 2021, 33, 2101128. [Google Scholar] [CrossRef] [PubMed]
- Bell, J.G.; Graule, T.; Stuer, M. Barium Titanate-Based Thermistors: Past Achievements, State of the Art, and Future Perspectives. Appl. Phys. Rev. 2021, 8, 031318. [Google Scholar] [CrossRef]
- Guo, X. Insulator-to-Semiconductor Transition of Nanocrystalline BaTiO3 at Temperatures ≤ 200 °C. Phys. Chem. Chem. Phys. 2014, 16, 20420–20423. [Google Scholar] [CrossRef]
- Damamme, R.; Seveyrat, L.; Borta-Boyon, A.; Nguyen, V.-C.; Le, M.-Q.; Cottinet, P.-J. 3D Printing of Doped Barium-Titanate Using Robocasting—Toward New Generation Lead-Free Piezoceramic Transducers. J. Eur. Ceram. Soc. 2023, 43, 3297–3306. [Google Scholar] [CrossRef]
- Sydorchuk, V.; Khalameida, S.; Skwarek, E.; Biedrzycka, A. Some Applications of Barium Titanate Prepared by Different Methods. Physicochem. Probl. Miner. Process. 2022, 58, 147192. [Google Scholar] [CrossRef]
- Panthi, G.; Park, M. Approaches for Enhancing the Photocatalytic Activities of Barium Titanate: A Review. J. Energy Chem. 2022, 73, 160–188. [Google Scholar] [CrossRef]
- Poon, K.K.; Schafföner, S.; Einarsrud, M.-A.; Glaum, J. Barium Titanate-Based Bilayer Functional Coatings on Ti Alloy Biomedical Implants. J. Eur. Ceram. Soc. 2021, 41, 2918–2922. [Google Scholar] [CrossRef]
- Fakhar-e-Alam, M.; Saddique, S.; Hossain, N.; Shahzad, A.; Ullah, I.; Sohail, A.; Khan, M.J.I.; Saadullah, M. Synthesis, Characterization, and Application of BaTiO3 Nanoparticles for Anti-Cancer Activity. J. Clust. Sci. 2023, 34, 1745–1755. [Google Scholar] [CrossRef]
- Sood, A.; Desseigne, M.; Dev, A.; Maurizi, L.; Kumar, A.; Millot, N.; Han, S.S. A Comprehensive Review on Barium Titanate Nanoparticles as a Persuasive Piezoelectric Material for Biomedical Applications: Prospects and Challenges. Small 2023, 19, 2206401. [Google Scholar] [CrossRef]
- Potnis, P.; Tsou, N.-T.; Huber, J. A Review of Domain Modelling and Domain Imaging Techniques in Ferroelectric Crystals. Materials 2011, 4, 417–447. [Google Scholar] [CrossRef] [PubMed]
- Yang, X.; Li, D.; Ren, Z.H.; Zeng, R.G.; Gong, S.Y.; Zhou, D.K.; Tian, H.; Li, J.X.; Xu, G.; Shen, Z.J.; et al. Colossal Dielectric Performance of Pure Barium Titanate Ceramics Consolidated by Spark Plasma Sintering. RSC Adv. 2016, 6, 75422–75429. [Google Scholar] [CrossRef]
- Pithan, C.; Hennings, D.; Waser, R. Progress in the Synthesis of Nanocrystalline BaTiO 3 Powders for MLCC. Int. J. Appl. Ceram. Tech. 2005, 2, 1–14. [Google Scholar] [CrossRef]
- Yoon, D.-H. Tetragonality of Barium Titanate Powder for a Ceramic Capacitor Application. J. Ceram. Proc. Res. 2006, 7, 343–354. [Google Scholar]
- Buscaglia, M.T.; Bassoli, M.; Buscaglia, V.; Alessio, R. Solid-State Synthesis of Ultrafine BaTiO3 Powders from Nanocrystalline BaCO3 and TiO2. J. Am. Ceram. Soc. 2005, 88, 2374–2379. [Google Scholar] [CrossRef]
- Brzozowski, E.; Castro, M.S. Synthesis of Barium Titanate Improved by Modifications in the Kinetics of the Solid State Reaction. J. Eur. Ceram. Soc. 2000, 20, 2347–2351. [Google Scholar] [CrossRef]
- Roy, A.C.; Mohanta, D. Structural and Ferroelectric Properties of Solid-State Derived Carbonate-Free Barium Titanate (BaTiO3) Nanoscale Particles. Scr. Mater. 2009, 61, 891–894. [Google Scholar] [CrossRef]
- Stojanovic, B.D.; Simoes, A.Z.; Paiva-Santos, C.O.; Jovalekic, C.; Mitic, V.V.; Varela, J.A. Mechanochemical Synthesis of Barium Titanate. J. Eur. Ceram. Soc. 2005, 25, 1985–1989. [Google Scholar] [CrossRef]
- Kong, L.B.; Zhang, T.S.; Ma, J.; Boey, F. Progress in Synthesis of Ferroelectric Ceramic Materials via High-Energy Mechanochemical Technique. Prog. Mater. Sci. 2008, 53, 207–322. [Google Scholar] [CrossRef]
- Sundararajan, T.; Prabu, S.B.; Vidyavathy, S.M. Combined Effects of Milling and Calcination Methods on the Characteristics of Nanocrystalline Barium Titanate. Mater. Res. Bull. 2012, 47, 1448–1454. [Google Scholar] [CrossRef]
- Ramajo, L.; Parra, R.; Reboredo, M.; Zaghete, M.; Castro, M. Heating Rate and Temperature Effects on the BaTiO3 Formation by Thermal Decomposition of (Ba,Ti) Organic Precursors during the Pechini Process. Mater. Chem. Phys. 2008, 107, 110–114. [Google Scholar] [CrossRef]
- Duran, P.; Gutierrez, D.; Tartaj, J.; Moure, C. Densification Behaviour, Microstructure Development and Dielectric Properties of Pure BaTiO3 Prepared by Thermal Decomposition of (Ba,Ti)-Citrate Polyester Resins. Ceram. Int. 2002, 28, 283–292. [Google Scholar] [CrossRef]
- Wada, S.; Kondo, S.; Moriyoshi, C.; Kuroiwa, Y. Preparation of Highly Dispersed Barium Titanate Nanoparticles from Barium Titanyl Oxalate Nanoparticles and Their Dielectric Properties. jjap 2008, 47, 7612. [Google Scholar] [CrossRef]
- Peng, Z.; Chen, Y. Preparation of BaTiO3 Nanoparticles in Aqueous Solutions. Microelectron. Eng. 2003, 66, 102–106. [Google Scholar] [CrossRef]
- Jung, D.S.; Hong, S.K.; Cho, J.S.; Kang, Y.C. Nano-Sized Barium Titanate Powders with Tetragonal Crystal Structure Prepared by Flame Spray Pyrolysis. J. Eur. Ceram. Soc. 2008, 28, 109–115. [Google Scholar] [CrossRef]
- Testino, A.; Buscaglia, M.T.; Buscaglia, V.; Viviani, M.; Bottino, C.; Nanni, P. Kinetics and Mechanism of Aqueous Chemical Synthesis of BaTiO 3 Particles. Chem. Mater. 2004, 16, 1536–1543. [Google Scholar] [CrossRef]
- Viviani, M.; Buscaglia, M.T.; Testino, A.; Buscaglia, V.; Bowen, P.; Nanni, P. The Influence of Concentration on the Formation of BaTiO3 by Direct Reaction of TiCl4 with Ba(OH)2 in Aqueous Solution. J. Eur. Ceram. Soc. 2003, 23, 1383–1390. [Google Scholar] [CrossRef]
- Ianculescu, A.C.; Vasilescu, C.A.; Crisan, M.; Raileanu, M.; Vasile, B.S.; Calugaru, M.; Crisan, D.; Dragan, N.; Curecheriu, L.; Mitoseriu, L. Formation Mechanism and Characteristics of Lanthanum-Doped BaTiO3 Powders and Ceramics Prepared by the Sol–Gel Process. Mater. Charact. 2015, 106, 195–207. [Google Scholar] [CrossRef]
- Boulos, M.; Guillemetfritsch, S.; Mathieu, F.; Durand, B.; Lebey, T.; Bley, V. Hydrothermal Synthesis of Nanosized BaTiO3 Powders and Dielectric Properties of Corresponding Ceramics. Solid. State Ion. 2005, 176, 1301–1309. [Google Scholar] [CrossRef]
- Ávila, H.A.; Ramajo, L.A.; Reboredo, M.M.; Castro, M.S.; Parra, R. Hydrothermal Synthesis of BaTiO3 from Different Ti-Precursors and Microstructural and Electrical Properties of Sintered Samples with Submicrometric Grain Size. Ceram. Int. 2011, 37, 2383–2390. [Google Scholar] [CrossRef]
- Cai, W.; Rao, T.; Wang, A.; Hu, J.; Wang, J.; Zhong, J.; Xiang, W. A Simple and Controllable Hydrothermal Route for the Synthesis of Monodispersed Cube-like Barium Titanate Nanocrystals. Ceram. Int. 2015, 41, 4514–4522. [Google Scholar] [CrossRef]
- Danchevskaya, M.N.; Ivakin, Y.D.; Torbin, S.N.; Muravieva, G.P.; Ovchinnikova, O.G. Thermovaporous Synthesis of Complicated Oxides. J. Mater. Sci. 2006, 41, 1385–1390. [Google Scholar] [CrossRef]
- Ivakin, Y.D.; Danchevskaya, M.N.; Ovchinnikova, O.G.; Muravieva, G.P. Thermovaporous Synthesis of Fine Crystalline Gahnite (ZnAl2O4). J. Mater. Sci. 2006, 41, 1377–1383. [Google Scholar] [CrossRef]
- Kholodkova, A.A.; Danchevskaya, M.N.; Ivakin, Y.D.; Muravieva, G.P.; Tyablikov, A.S. Crystalline Barium Titanate Synthesized in Sub- and Supercritical Water. J. Supercrit. Fluids 2016, 117, 194–202. [Google Scholar] [CrossRef]
- Kholodkova, A.; Danchevskaya, M.; Popova, N. Preparation and Dielectric Properties of Thermo-Vaporous BaTiO3 Ceramics. Mater. Tehnol. 2015, 49, 447–451. [Google Scholar] [CrossRef]
- Kholodkova, A.A.; Danchevskaya, M.N.; Ivakin, Y.D.; Muravieva, G.P. Synthesis of Fine-Crystalline Tetragonal Barium Titanate in Low-Density Water Fluid. J. Supercrit. Fluids 2015, 105, 201–208. [Google Scholar] [CrossRef]
- Kholodkova, A.A.; Danchevskaya, M.N.; Ivakin, Y.D.; Muravieva, G.P.; Ponomarev, S.G. Effect of Reagents on the Properties of Barium Titanate Synthesized in Subcritical Water. Russ. J. Phys. Chem. B 2018, 12, 1261–1268. [Google Scholar] [CrossRef]
- Eckert, J.O.; Hung-Houston, C.C.; Gersten, B.L.; Lencka, M.M.; Riman, R.E. Kinetics and Mechanisms of Hydrothermal Synthesis of Barium Titanate. J. Am. Ceram. Soc. 1996, 79, 2929–2939. [Google Scholar] [CrossRef]
- Pinceloup, P.; Courtois, C.; Vicens, J.; Leriche, A.; Thierry, B. Evidence of a Dissolution–Precipitation Mechanism in Hydrothermal Synthesis of Barium Titanate Powders. J. Eur. Ceram. Soc. 1999, 19, 973–977. [Google Scholar] [CrossRef]
- Moon, J.; Suvaci, E.; Morrone, A.; Costantino, S.A.; Adair, J.H. Formation Mechanisms and Morphological Changes during the Hydrothermal Synthesis of BaTiO3 Particles from a Chemically Modified, Amorphous Titanium (Hydrous) Oxide Precursor. J. Eur. Ceram. Soc. 2003, 23, 2153–2161. [Google Scholar] [CrossRef]
- Barbooti, M.M.; Al-Sammerrai, D.A. Thermal Decomposition of Citric Acid. Thermochim. Acta 1986, 98, 119–126. [Google Scholar] [CrossRef]
- Wiecinska, P. Thermal Degradation of Organic Additives Used in Colloidal Shaping of Ceramics Investigated by the Coupled DTA/TG/MS Analysis. J. Therm. Anal. Calorim. 2016, 123, 1419–1430. [Google Scholar] [CrossRef]
- Wyrzykowski, D.; Hebanowska, E.; Nowak-Wiczk, G.; Makowski, M.; Chmurzyński, L. Thermal Behaviour of Citric Acid and Isomeric Aconitic Acids. J. Therm. Anal. Calorim. 2011, 104, 731–735. [Google Scholar] [CrossRef]
- Brown, W.E.; Dollimore, D.; Galwey, A.C. Reactions in the Solid State; Comprehensive Chemical Kinetics; Elsevier: Amsterdam, The Netherlands, 1980; Volume 22. [Google Scholar]
- Hancock, J.D.; Sharp, J.H. Method of Comparing Solid-State Kinetic Data and Its Application to the Decomposition of Kaolinite, Brucite, and BaCO3. J. Am. Ceram. Soc. 1972, 55, 74–77. [Google Scholar] [CrossRef]
- Kingery, W.D.; Bowen, H.K.; Uhlmann, D.R. Introduction to Ceramics, 2nd ed.; John Wiley & Sons, Inc.: New York, NY, USA; London, UK, 1976. [Google Scholar]
- Kappadan, S.; Gebreab, T.W.; Thomas, S.; Kalarikkal, N. Tetragonal BaTiO3 Nanoparticles: An Efficient Photocatalyst for the Degradation of Organic Pollutants. Mater. Sci. Semicond. Process. 2016, 51, 42–47. [Google Scholar] [CrossRef]
- Kristinaitytė, K.; Dagys, L.; Kausteklis, J.; Klimavicius, V.; Doroshenko, I.; Pogorelov, V.; Valevičienė, N.R.; Balevicius, V. NMR and FTIR Studies of Clustering of Water Molecules: From Low-Temperature Matrices to Nano-Structured Materials Used in Innovative Medicine. J. Mol. Liq. 2017, 235, 1–6. [Google Scholar] [CrossRef]
- Chizallet, C.; Costentin, G.; Che, M.; Delbecq, F.; Sautet, P. Infrared Characterization of Hydroxyl Groups on MgO: A Periodic and Cluster Density Functional Theory Study. J. Am. Chem. Soc. 2007, 129, 6442–6452. [Google Scholar] [CrossRef]
- Fang, C.; Zhou, D.; Gong, S. Core-Shell Structure and Size Effect in Barium Titanate Nanoparticle. Phys. B Condens. Matter 2011, 406, 1317–1322. [Google Scholar] [CrossRef]
- Fang, C.; Zhou, D.; Gong, S.; Luo, W. Multishell Structure and Size Effect of Barium Titanate Nanoceramics Induced by Grain Surface Effects: Multishell Structure and Size Effect of Barium Titanate Nanoceramics. Phys. Stat. Sol. (b) 2010, 247, 219–224. [Google Scholar] [CrossRef]
- Hoshina, T. Size Effect of Barium Titanate: Fine Particles and Ceramics. J. Ceram. Soc. Jpn. 2013, 121, 156–161. [Google Scholar] [CrossRef]
- Bäurer, M.; Shih, S.-J.; Bishop, C.; Harmer, M.P.; Cockayne, D.; Hoffmann, M.J. Abnormal Grain Growth in Undoped Strontium and Barium Titanate. Acta Mater. 2010, 58, 290–300. [Google Scholar] [CrossRef]
- Li, X.; Yao, Z.; Xie, J.; Li, Z.; Hao, H.; Cao, M.; Ullah, A.; Ullah, A.; Manan, A.; Liu, H. Grain Boundary Effects on Piezoelectric Properties of the Core–Shell-Structured BaTiO3@TiO2 Ceramics. J. Adv. Dielect. 2018, 8, 1850044. [Google Scholar] [CrossRef]
- Curecheriu, L.; Balmus, S.; Buscaglia, M.T.; Buscaglia, V.; Ianculescu, A.; Mitoseriu, L. Grain Size-Dependent Properties of Dense Nanocrystalline Barium Titanate Ceramics. J. Am. Ceram. Soc. 2012, 95, 3912–3921. [Google Scholar] [CrossRef]
- Tan, Y.; Zhang, J.; Wu, Y.; Wang, C.; Koval, V.; Shi, B.; Ye, H.; McKinnon, R.; Viola, G.; Yan, H. Unfolding Grain Size Effects in Barium Titanate Ferroelectric Ceramics. Sci. Rep. 2015, 5, 9953. [Google Scholar] [CrossRef]
- Liu, X.; Li, Z.; Wang, J.; Zhang, R.; Ali, W.; Wang, S.; Lu, X.; Li, C. Phase Equilibria and Thermodynamic Evaluation of BaO-TiO2-YO1.5 System. J. Eur. Ceram. Soc. 2018, 38, 5430–5441. [Google Scholar] [CrossRef]
- Lee, S.; Randall, C.A.; Liu, Z. Modified Phase Diagram for the Barium Oxide–Titanium Dioxide System for the Ferroelectric Barium Titanate. J. Am. Ceram. Soc. 2007, 90, 2589–2594. [Google Scholar] [CrossRef]
- Mudiyanselage, K.; Yi, C.-W.; Szanyi, J. Reactivity of a Thick BaO Film Supported on Pt(111): Adsorption and Reaction of NO2, H2O, and CO2. Langmuir 2009, 25, 10820–10828. [Google Scholar] [CrossRef]
- Kwon, S.C.; Lee, W.R.; Lee, H.N.; Lee, H. Competitive Adsorption of CO2 and H2O Molecules on the BaO (100) Surface: A First-Principle Study. Bull. Korean Chem. Soc. 2011, 32, 988–992. [Google Scholar] [CrossRef]
- Yi, C.-W.; Szanyi, J. Interaction of D2O with a Thick BaO Film: Formation of and Phase Transitions in Barium Hydroxides. J. Phys. Chem. C 2009, 113, 15692–15697. [Google Scholar] [CrossRef]
- Vittadini, A.; Casarin, M.; Selloni, A. Hydroxylation of TiO2-B: Insights from Density Functional Calculations. J. Mater. Chem. 2010, 20, 5871. [Google Scholar] [CrossRef]
- Boldyrev, V.V. Topochemistry and Topochemical Reactions. React. Solids 1990, 8, 231–246. [Google Scholar] [CrossRef]
- Hertl, W. Kinetics of Barium Titanate Synthesis. J. Am. Ceram. Soc. 1988, 71, 879–883. [Google Scholar] [CrossRef]
- Kozawa, T.; Onda, A.; Yanagisawa, K. Accelerated Formation of Barium Titanate by Solid-State Reaction in Water Vapour Atmosphere. J. Eur. Ceram. Soc. 2009, 29, 3259–3264. [Google Scholar] [CrossRef]
- Lu, W.; Quilitz, M.; Schmidt, H. Nanoscaled BaTiO3 Powders with a Large Surface Area Synthesized by Precipitation from Aqueous Solutions: Preparation, Characterization and Sintering. J. Eur. Ceram. Soc. 2007, 27, 3149–3159. [Google Scholar] [CrossRef]
- Huan, Y.; Wang, X.; Fang, J.; Li, L. Grain Size Effect on Piezoelectric and Ferroelectric Properties of BaTiO3 Ceramics. J. Eur. Ceram. Soc. 2014, 34, 1445–1448. [Google Scholar] [CrossRef]
- Polotai, A.; Breece, K.; Dickey, E.; Randall, C.; Ragulya, A. A Novel Approach to Sintering Nanocrystalline Barium Titanate Ceramics. J. Am. Ceram. Soc. 2005, 88, 3008–3012. [Google Scholar] [CrossRef]
- Kim, H.T.; Han, Y.H. Sintering of Nanocrystalline BaTiO3. Ceram. Int. 2004, 30, 1719–1723. [Google Scholar] [CrossRef]
- Radhakrishnan, J.; Subramani, S.; Ocaña, J.L. Cold Sintering Behaviors of Barium Titanates: Recent Progress and Impact on Microstructure, Densification and Dielectric-Ferroelectric Response. Coord. Chem. Rev. 2024, 502, 215621. [Google Scholar] [CrossRef]
- Smirnov, A.V.; Ivakin, Y.D.; Kornyushin, M.V.; Stolyarov, V.V. The Cold Sintering Process of ZnO and BaTiO3 Ceramics under the Electric Current Influence. J. Phys. Conf. Ser. 2021, 1967, 012020. [Google Scholar] [CrossRef]
- Kang, S.; Guo, H.; Wang, J.; Zhong, X.; Li, B. Influence of Surface Coating on the Microstructures and Dielectric Properties of BaTiO3 Ceramic via a Cold Sintering Process. RSC Adv. 2020, 10, 30870–30879. [Google Scholar] [CrossRef]
- Siddiqui, M.; Valášek, D.; Bai, Y.; Salamon, D. Phase Transformation of Cold-Sintered Doped Barium Titanate Ceramics during the Post-Annealing Process. Open Ceram. 2023, 15, 100401. [Google Scholar] [CrossRef]
- George, C.N.; Thomas, J.K.; Kumar, H.P.; Suresh, M.K.; Kumar, V.R.; Wariar, P.R.S.; Jose, R.; Koshy, J. Characterization, Sintering and Dielectric Properties of Nanocrystalline Barium Titanate Synthesized through a Modified Combustion Process. Mater. Charact. 2009, 60, 322–326. [Google Scholar] [CrossRef]
- Wu, L.; Chure, M.-C.; Wu, K.-K.; Chang, W.-C.; Yang, M.-J.; Liu, W.-K.; Wu, M.-J. Dielectric Properties of Barium Titanate Ceramics with Different Materials Powder Size. Ceram. Int. 2009, 35, 957–960. [Google Scholar] [CrossRef]
- Simon-Seveyrat, L.; Hajjaji, A.; Emziane, Y.; Guiffard, B.; Guyomar, D. Re-Investigation of Synthesis of BaTiO3 by Conventional Solid-State Reaction and Oxalate Coprecipitation Route for Piezoelectric Applications. Ceram. Int. 2007, 33, 35–40. [Google Scholar] [CrossRef]
- Vinothini, V.; Singh, P.; Balasubramanian, M. Synthesis of Barium Titanate Nanopowder Using Polymeric Precursor Method. Ceram. Int. 2006, 32, 99–103. [Google Scholar] [CrossRef]
- Ying, K.-L.; Hsieh, T.-E. Sintering Behaviors and Dielectric Properties of Nanocrystalline Barium Titanate. Mater. Sci. Eng. B 2007, 138, 241–245. [Google Scholar] [CrossRef]
- Ismail, F.A.; Maulat Osman, R.A.; Idris, M.S.; Taking, S.; Zahid Jamal, Z.A. Dielectric and Microstructural Properties of BaTiO3 and Ba0.9925Er0.0075TiO3 Ceramics. EPJ Web Conf. 2017, 162, 01051. [Google Scholar] [CrossRef]
- Hu, S.; Luo, C.; Li, P.; Hu, J.; Li, G.; Jiang, H.; Zhang, W. Effect of Sintered Temperature on Structural and Piezoelectric Properties of Barium Titanate Ceramic Prepared by Nano-Scale Precursors. J. Mater. Sci. Mater. Electron. 2017, 28, 9322–9327. [Google Scholar] [CrossRef]
- Kholodkova, A.A.; Danchevskaya, M.N.; Ivakin, Y.D.; Muravieva, G.P.; Smirnov, A.D.; Tarasovskii, V.P.; Ponomarev, S.G.; Fionov, A.S.; Kolesov, V.V. Properties of Barium Titanate Ceramics Based on Powder Synthesized in Supercritical Water. Ceram. Int. 2018, 44, 13129–13138. [Google Scholar] [CrossRef]
- Gates-Rector, S.; Blanton, T. The Powder Diffraction File: A Quality Materials Characterization Database. Powder Diffr. 2019, 34, 352–360. [Google Scholar] [CrossRef]
- Toby, B.H. EXPGUI, a Graphical User Interface for GSAS. J. Appl. Crystallogr. 2001, 34, 210–213. [Google Scholar] [CrossRef]
- Rodríguez-Carvajal, J. Recent Advances in Magnetic Structure Determination by Neutron Powder Diffraction. Phys. B Condens. Matter 1993, 192, 55–69. [Google Scholar] [CrossRef]
- Vaitkus, A.; Merkys, A.; Sander, T.; Quirós, M.; Thiessen, P.A.; Bolton, E.E.; Gražulis, S. A Workflow for Deriving Chemical Entities from Crystallographic Data and Its Application to the Crystallography Open Database. J. Cheminform 2023, 15, 123. [Google Scholar] [CrossRef]
- Rietveld, H.M. A Profile Refinement Method for Nuclear and Magnetic Structures. J. Appl. Crystallogr. 1969, 2, 65–71. [Google Scholar] [CrossRef]
Disclaimer/Publisher’s Note: The statements, opinions and data contained in all publications are solely those of the individual author(s) and contributor(s) and not of MDPI and/or the editor(s). MDPI and/or the editor(s) disclaim responsibility for any injury to people or property resulting from any ideas, methods, instructions or products referred to in the content. |
© 2024 by the authors. Licensee MDPI, Basel, Switzerland. This article is an open access article distributed under the terms and conditions of the Creative Commons Attribution (CC BY) license (https://creativecommons.org/licenses/by/4.0/).