Review

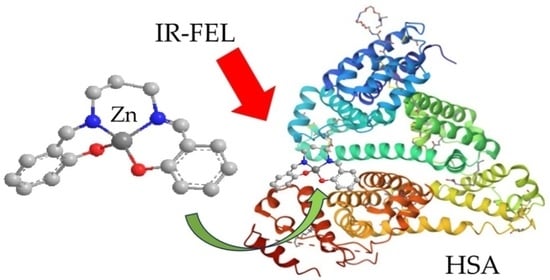
Application of Infrared Free-Electron Laser Irradiation of Protein Complexes Binding to Salen-Type Schiff Base Zn(II) Complexes Using Secondary Conformational Changes in the Proteins for the Treatment of Alzheimer’s Disease

Department of Chemistry, Faculty of Science, Tokyo University of Science, 1-3 Kagurazaka, Tokyo 162-8601, Japan
*
Author to whom correspondence should be addressed.
Inorganics 2024, 12(2), 50; https://doi.org/10.3390/inorganics12020050
Submission received: 27 September 2023 / Revised: 28 January 2024 / Accepted: 28 January 2024 / Published: 3 February 2024
(This article belongs to the Special Issue Rational Design of Pharmacologically Active Metal-Based Compounds)

Abstract

:
Alzheimer’s disease causes the destruction of cranial nerve cells and is said to be caused by neuronal cell death due to the accumulation of amyloid-β protein. One method for the treatment of Alzheimer’s disease is to reduce the toxicity of the amyloid beta protein. Among the possibilities is to reduce toxicity by changing the secondary structure of the protein. In this study, the secondary structure of the protein was verified by binding a zinc complex to the protein and irradiating it with an infrared free-electron laser (IR-FEL). By binding Salen-Type zinc complexes to human serum albumin (HSA) and irradiating it with IR-FEL, structural changes were observed in the α-helix and β-sheet, the secondary structure of HSA. In addition to researching the possibility of binding zinc complexes to small proteins, docking simulations were examined. GOLD docking simulations showed that it is possible to bind zinc complexes to lysozyme (Lyz), a small protein. These results suggest that binding zinc complexes to amyloid-β and inducing a secondary conformational change through IR-FEL irradiation could be used for the treatment of Alzheimer’s disease by making the complexes lose their toxicity.

Graphical Abstract

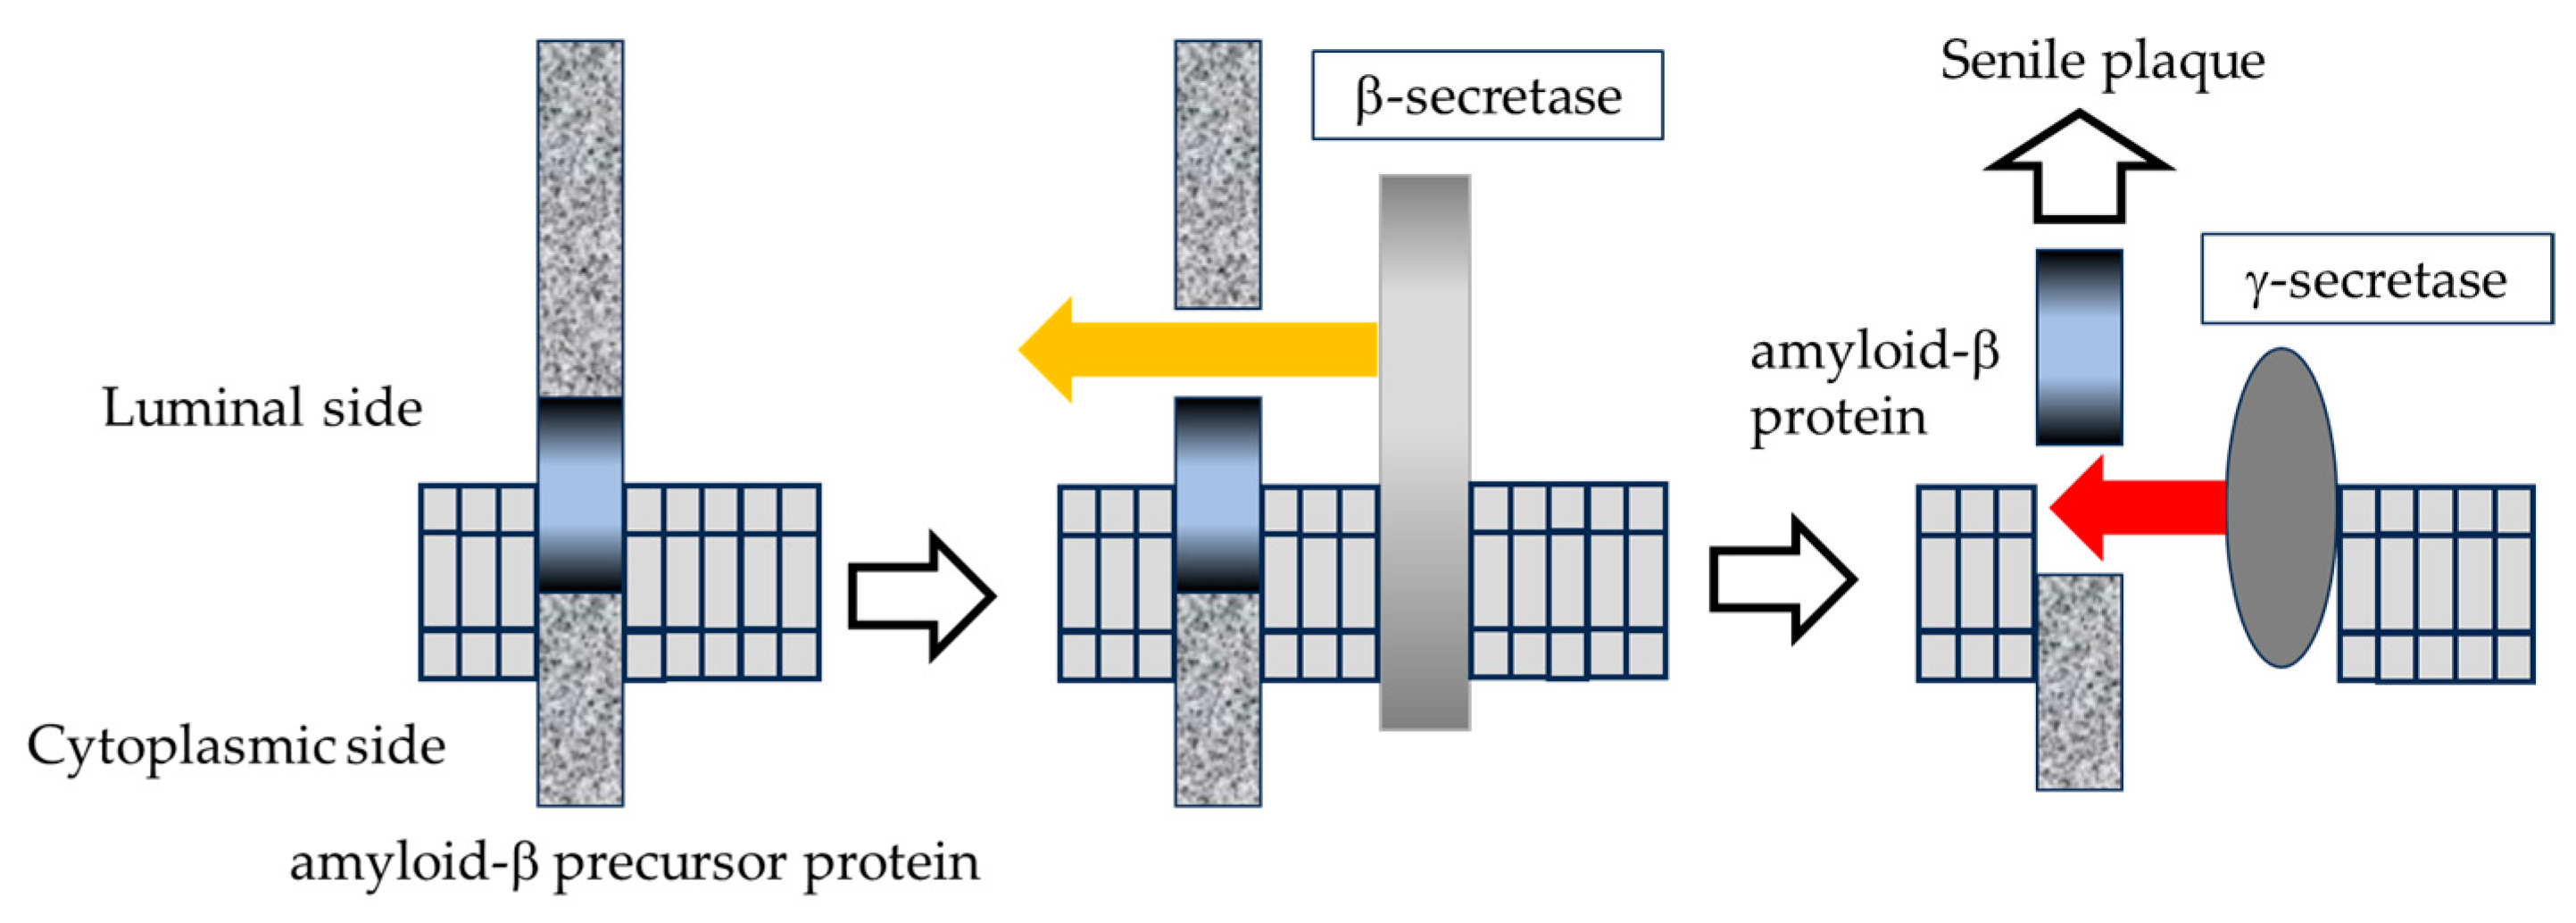
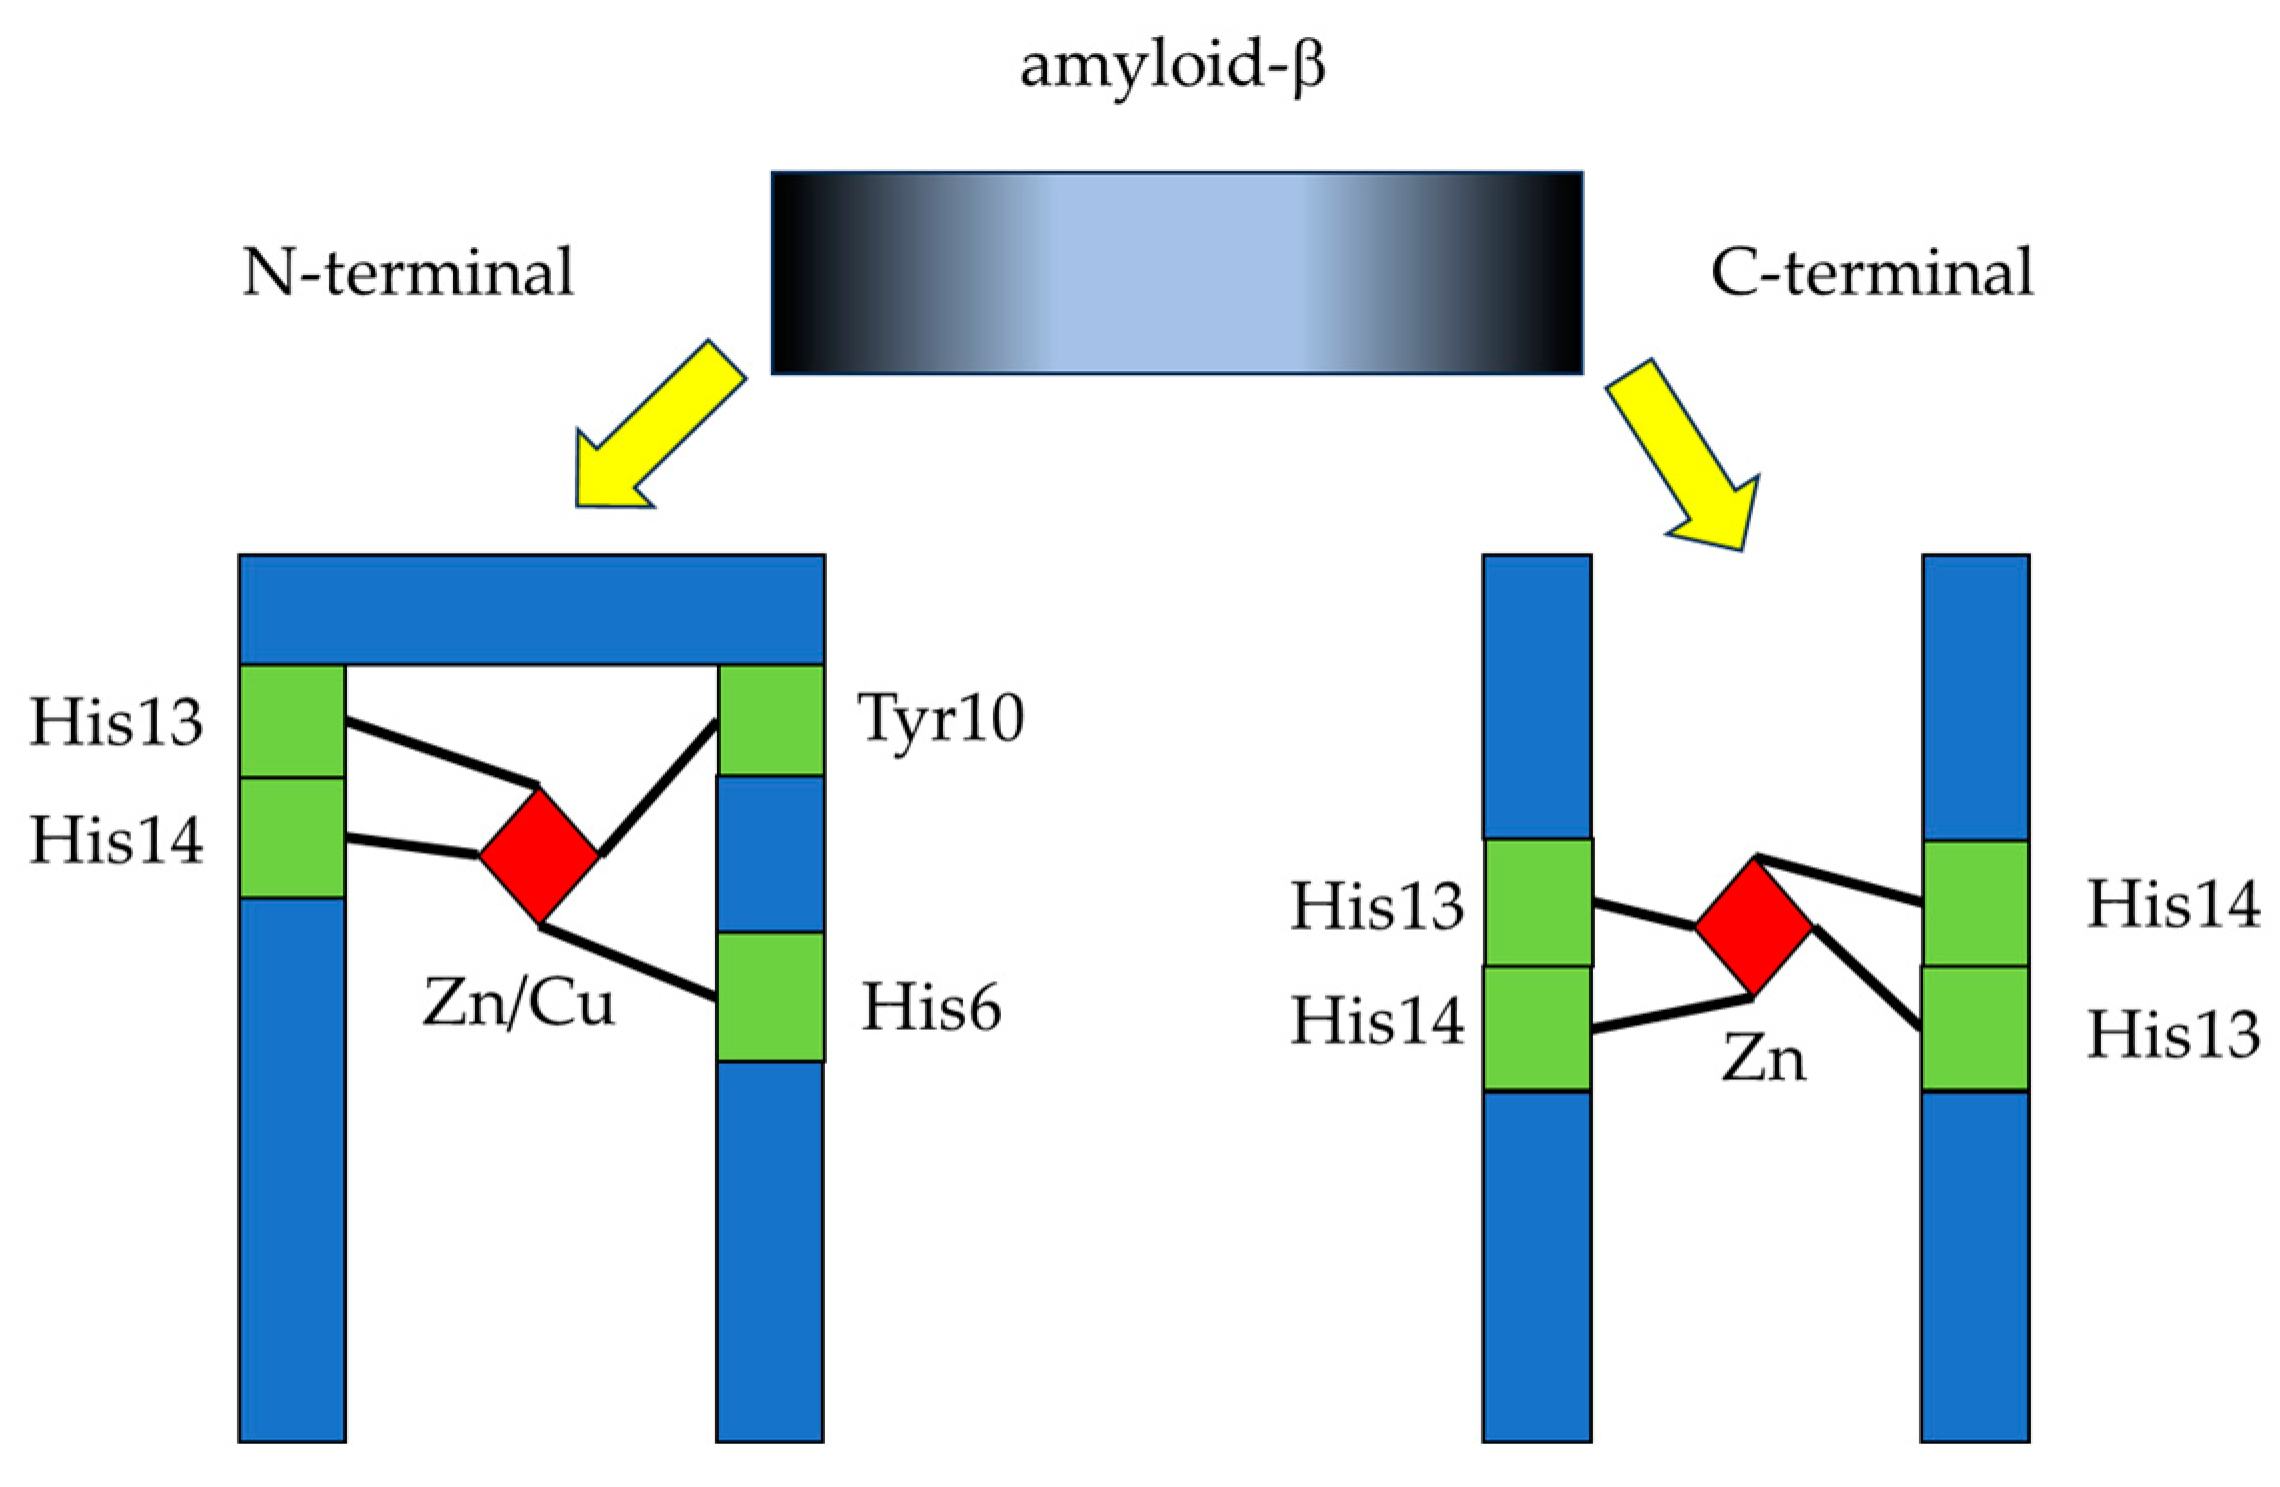
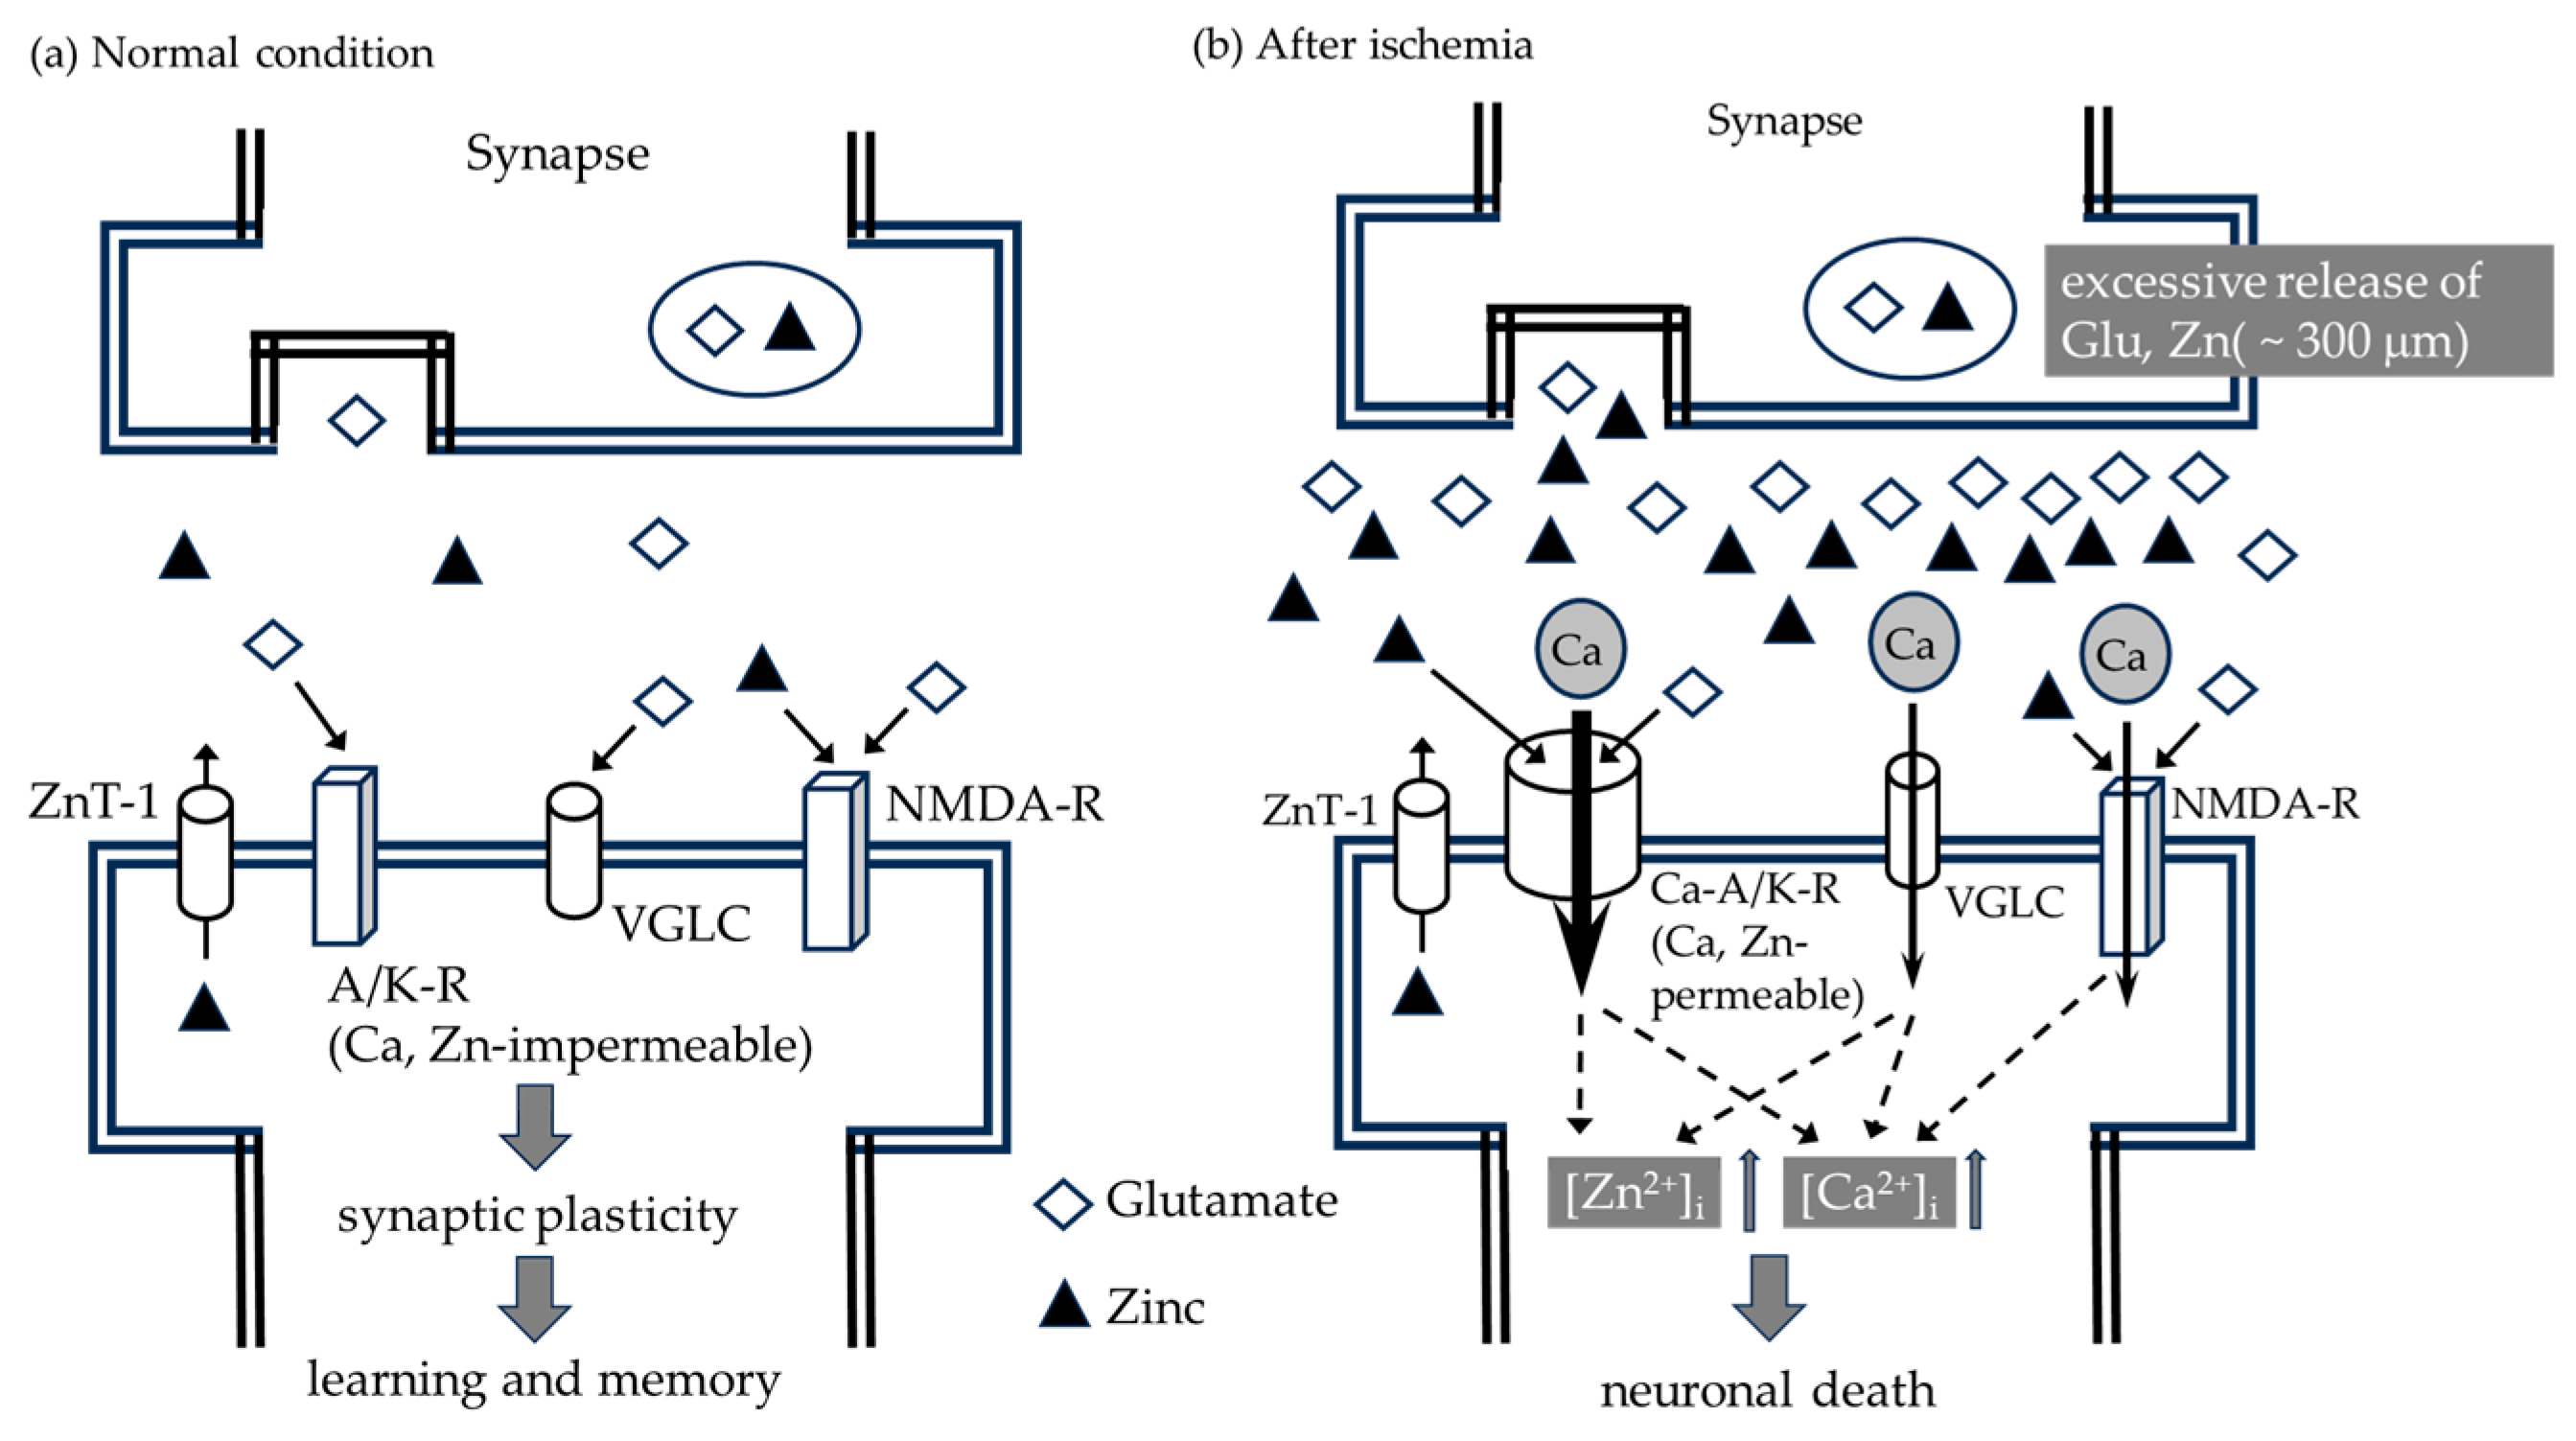
1. Introduction: The Proteins and Zinc That Cause Alzheimer’s Disease

There are two main types of dementia in the elderly: cerebrovascular dementia and Alzheimer’s disease. Among them, Alzheimer’s disease accounts for more than half of all dementias [1].
Cerebrovascular dementia is a multiple stroke in which small blood vessels in the brain become clogged. Alzheimer’s disease causes the destruction of cranial nerve cells and is said to be caused by neuronal cell death due to the accumulation of amyloid-β protein.
A schematic diagram of amyloid-β production is shown in Figure 1, in which APP (amyloid-β precursor protein) undergoes a conformational change through β-secretase and γ-secretase to produce Aβ (amyloid-β protein), which is accumulated in the brain [2].
Two of several possibilities for metal interaction with amyloid-β are shown in Figure 2.
The binding of amyloid-β to metals, such as aluminum, copper, and zinc, is synaptotoxic and causes neuronal cell death [4,5].
The function of zinc in the brain under normal or pathological conditions is shown in Figure 3. In normal conditions, 150 mg of zinc is present in the brain, but in pathological conditions, metal homeostasis fails and increases [6]. The actual concentration of zinc released into the synaptic cleft varies greatly depending on the age and species of the animal under study, and the intensity of the stimulation has not yet been determined [7,8]. However, considering the small size of the synaptic cleft (20 nm × 240 nm) and the synaptic density, the synaptic cleft is estimated to be about 1% of the extracellular space in the brain [9]. Therefore, even if the zinc concentration in the synaptic cleft increases by 50 mM, the zinc concentration in the brain as a whole would increase only by a very small amount, about 0.5 mM [10]. It has also been reported that 10 to 100 mM of zinc is released after electrical stimulation [11]. In neurons under normal conditions, glutamate and zinc are released via neuronal excitation, as shown in the figure on the left, playing an important role in human learning and memory. However, under pathological conditions, excess zinc and glutamate are released, as shown in Figure 3, on the right. Excess zinc acts to inhibit various enzymes, inhibit mitochondrial respiration, cause energy depletion, and produce reactive oxygen species (ROS), and excess glutamate induces an increase in intracellular divalent calcium levels in the target neurons. This leads to neuronal death.
Various Alzheimer’s disease therapies are currently being tried, but none are definitive for treatment as of yet. Previously, the protection of the neurovascular unit (NVU) was an important factor for treatment. However, in Alzheimer’s disease, cerebral small vessel disease in the cerebral white matter, in addition to the accumulation of amyloid-β protein in the brain, has been shown to be an important factor in neurological dysfunction. For neurodegenerative diseases such as Alzheimer’s disease, more function-intensive, function-improving therapies are becoming more important than simply NVU structure-protective therapies [13].
In Alzheimer’s disease, amyloid-β protein has been shown to be a key factor in causing neuronal damage. But there are other characteristic brain lesions such as neurofibrillary tangles (NFTs) caused by the intracellular aggregation of hyperphosphorylated tau and brain atrophy [14]. There is also a long latency period before the onset of Alzheimer’s disease, with 20 to 30 years of amyloid-β accumulation, creating amyloid plaques. It is apparent that the continuous damage it causes to the brain leads to chronic inflammation and neuronal damage, and neuronal loss begins at the onset of the disease due to NFTs. As Alzheimer’s disease progresses, the loss of nerve cells progresses, leading to cognitive impairment. Therefore, treatment and prevention are necessary at an early stage [15].
In June 2021, the Food and Drug Administration (FDA) conditionally approved ADUHELM (aducanumab) as a new treatment drug using the Accelerated Approval pathway [16].
The “Accelerated Approval pathway” is a procedure used for drugs for the treatment of serious or life-threatening diseases when the drug has not yet shown a clinically proven benefit but has an effect on a surrogate endpoint that is reasonably predictive of clinical benefit to the patient and is expected to provide a particularly large benefit over existing drugs. This procedure is used when a drug is expected to provide a particularly large benefit over an existing drug, but the clinical benefit has not yet been confirmed. This conditional approval was granted because, while acknowledging that aducanumab is effective in reducing amyloid plaques, additional clinical trials must confirm that it is indeed effective in improving cognitive function. Depending on the results, the approval may be revoked [17,18].
Aducanumab is a new, previously unseen type of Alzheimer’s drug called a disease-modifying agent that recognizes and modifies amyloid plaques by means of a monoclonal antibody that recognizes a specific protein [19]. The approval of ADUHELM is important in a number of ways but three are particularly significant. First, it is a new treatment for Alzheimer’s disease that has been approved by the FDA since 2003. Second, it is an antibody drug that targets amyloid beta plaques in the brain, the underlying pathophysiology of Alzheimer’s disease. The ADUHELM clinical trial is the first to show that a reduction in amyloid β plaques, a characteristic finding in the brains of Alzheimer’s disease patients, can lead to a clinical decline in this form of dementia [16].
The results of pathological analysis using postmortem brains of patients treated with ADUHELM have also been reported [20]. According to a report, brain imaging studies performed before death showed a decrease in amyloid plaques after the administration of ADUHELM, and the pathological analysis of the postmortem brain showed that this diagnosis was correct.
Further analysis of the results also confirmed that ADUHELM treatment stimulates microglia cells in the brain, which take up and break down amyloid plaques, which, in turn, break down amyloid-β plaques and reduce amyloid plaques, resulting in a slight but significant recovery of the surrounding neurons. Furthermore, the study showed that ADUHELM did not cause serious brain damage.
In June 2023, the FDA granted traditional approval for LEQEMBI (lecanemab-irmb) for the treatment of Alzheimer’s disease using the Accelerated Approval pathway [21,22]. The approval of LEQEMBI is the first time that a drug that targets the underlying disease process of Alzheimer’s disease has demonstrated clinical utility and has been shown to be an effective treatment.
ADUHELM and LEQEMBI are expected to be effective therapies, but these drugs have the side effect of causing an amyloid-related imaging abnormality (ARIA), a transient form of brain edema that resolves spontaneously in most cases but can lead to serious conditions. ARIA can occur and usually resolves spontaneously, but it can be a serious condition, so this drug should not be used in patients with drug sensitivity [18,22]. In addition, antibody drugs are generally expensive, with Biogen estimating an annual cost of USD 56,000 for ADUHELM, and the Institute for Clinical and Economic Review (ICER)’s estimate ranged from USD 11,120 to USD 23,120 per year. Even if only studies that showed efficacy were included, they declined to say that their conclusions were final because of the uncertainties involved [23,24]. Furthermore, long-term administration is required, and it takes time to show efficacy.
Despite significant advances in the past, a complete cure has not yet been established, and an important aspect in the treatment of Alzheimer’s disease, both in the mild cognitive impairment and pre-phase, is the early treatment of amyloid-β and amyloid plaques to degenerate and lose their neurotoxic properties.
One policy for treatment is to alter the properties of neurotoxic amyloid-β by changing its structure and making it lose its toxicity. One method to change the structure of amyloid-β is to cleave or break the chemical bonds of proteins and other biomolecules.
One of the methods is IR-FEL irradiation. In general, IR-FEL cleaves and breaks chemical bonds of biomolecules such as proteins using a vibrational excitation mechanism, and is expected to be applied to the treatment of intractable diseases such as Alzheimer’s disease, which is caused by aggregation and accumulation of toxic proteins.
It is known from previous studies that irradiating fibrous proteins with IR-FEL changes the secondary structure of the protein [25,26,27,28,29,30]. In addition, during IR-FEL irradiation, the secondary structure change in the protein is more significant when a complex with zinc as the central metal is bound to the protein rather than the protein alone [31].
One possibility is to bind an appropriate zinc complex to amyloid-β and irradiate it with an IR-FEL to modify the protein structure and make it lose its toxicity. If this can prevent neuronal cell death, it is expected to be effective in the treatment of Alzheimer’s disease [32].

2. Our Laboratory’s Previous Research on Zn(II) Complexes

2.1. Concept of Molecular Orientation Study in Polymer Films

A new Schiff base dinuclear complex, C22H22Cl2N4O2Zn2, bound with polyvinyl alcohol (PVA) cast films can be synthesized, taking the confirmation and comparison of optical anisotropy of complexes in PVA films after linearly polarized UV irradiation [33].
During 1911 and over several years, F. Weigert published a series of papers showing that when a dye is dispersed in a polymer film and irradiated with linearly polarized light, molecules matching the transition moment of the dye are decolorized via a photochemical reaction, resulting in an anisotropic optical film with strong vertical dichroism throughout the film. This is called the Weigelt effect, which now includes the phenomenon in which optical anisotropy such as dichroism and refractive index anisotropy is induced in a material by light irradiation including polarized light due to the optical reorientation of liquid crystal molecules [34]. Organic polymers and liquid crystals containing azo groups exhibit optical anisotropy after linearly polarized UV irradiation [35].
Furthermore, even achiral molecules may exhibit chirality by becoming molecular aggregates, i.e., supramolecules [36,37,38,39,40,41]. Other components with large dipole moments and polarity besides azo compounds may exhibit photoinduced molecular arrangements like azo compounds. In addition, intermolecular interactions between components and polymers should also be considered in discussions of supramolecular chirality and photoinduced molecular alignment [42].
In a previous study, this was carried out using a chiral and rigid Schiff base dinuclear complex, including azo-dyes in a PVA film [43].
In this study, we used a hybrid material consisting of an achiral C22H22Cl2N4O2Zn2, incorporating the flexibility of a macrocyclic ligand and an achiral, water-soluble polymer, poly(vinyl alcohol) (PVA) film. It does not include the azo intermediate. The optical anisotropy and molecular flexibility of these hybrid materials are investigated after UV irradiation.

2.2. Preparations of Zn(II) Complexes

2,6-Dimethylphenol and the complexes were synthesized according to the procedure described in a previous study [44] for use in a spectroscopic study after confirming the composition. Aqueous solutions (0.5 mM) of each complex C22H22Cl2N4O2Zn2 were mixed with PVA (10 wt%) and cast on glass slides over a hot plate (333 K) for 4 days to prepare hybrid film materials for optical experiments.

2.3. Examples of Zn(II) Complexes

Single crystal X-ray diffraction data were measured on prismatic single crystals of the synthesized complex C22H22Cl2N4O2Zn2, glued to a glass fiber and coated with a thin epoxy resin layer. Intensity data were collected on a Bruker APEX2 CCD diffractometer using graphite monochromatic Mo Kα radiation (λ = 0.7107 Å). Data analysis of the complexes was carried out using the SAINT program package (2012). The structures were solved using direct methods with a SHELXS-97 and expanded using Fourier techniques [45]. Crystallographic data for C22H22Cl2N4O2Zn2 (the Cambridge Crystallographic Data Center (CCDC) 1569972) are available. C22H22Cl2N4O2Zn2, monoclinic, Cc, Z = 4, a = 16.571(3), b = 28.098(3), c = 20.346(2) Å, β = 103.374(2)°, V = 9216(2) Å3, ρcalc = 1.661 g/cm3, μ = 2.347 mm−1, F(000) = 4672, S = 1.848, R1[I > 2σ(I)] = 0.0536, wR2 = 0.1015.
The crystal structures of the C22H22Cl2N4O2Zn2 complexes are shown in Figure 4. Hydrogen atoms and crystalline water were omitted for clarity. The C22H22Cl2N4O2Zn2 bond shown in Figure 5 is also C22H22Cl2N4O2Zn2 with pentacoordinate structures. The bond distances on the axial positions of the C22H22Cl2N4O2Zn2 are Zn(7)–Cl(11) = 2.296(2) Å and Zn(2)–Cl(12) = 2.297(3) Å.

2.4. Spectra of Zn(II) Complexes

The infrared (IR) spectra for the C22H22Cl2N4O2Zn2 complex show strong bands at 1643 cm−1, 1639 cm−1, and 1648 cm−1, assigned to the ν (C=N) stretching vibration of the iminic bond of the complexes [33,46].
UV-vis spectra of the C22H22Cl2N4O2Zn2 are shown in Figure 5. UV-vis spectra of all the C22H22Cl2N4O2Zn2 metal complexes are estimated in the solid state, aqueous solution, and PVA. The complexes showed the π–π* band around 240 nm to 260 nm on the left. Small spectral changes between water and PVA may be ascribed to the environmental conditions in polymers. According to the similar UV-vis spectra between PVA aqueous solutions, it was clear that all metal complexes exhibited similar structures.

2.5. Polarized Light-Induced Anisotropic Molecular Orientation of Zn(II) Complexes

Preceding photochemical experiments on hybrid film materials, they investigated Weigert effects such as the molecular orientation of the complexes in the PVA matrix as induced by linearly polarized UV light, as described in the references [46,47]. C22H22Cl2N4O2Zn2 + PVA irradiated with linearly polarized UV light for 10 min and measured fine changes in polarized photoluminescence (PL) spectra with an angular polarizer from 0° to 90° [48]. Linear dichroism was obtained by polarized UV-vis spectra before and after exposure to linearly polarized UV light; the intensity at 0 degrees was greater than that at 90 degrees, suggesting that C22H22Cl2N4O2Zn2 changes the molecular orientation similar to the Weigert effect and maintains a stable chemical species.
The degree of light-induced optical anisotropy of the spectrum is described by the S and R parameters, as in the following equation [49]:
S = ( A p a r a l l e l A p e r p e n d i c u l a r ) / 2 A p e r p e n d i c u l a r + A p a r a l l e l
R = A p a r a l l e l   / A p e r p e n d i c u l a r
Values of Aperpendicular and Aparallel indicate the absorbance measured by the measurement polarizer perpendicular or parallel to the electric vector of the irradiation polarization.
R and S parameters of the π–π* bands and CT bands in the complexes of the synthesized complex and the PVA film after linearly polarized UV irradiation are shown in Table 1. Both S and R parameters change with increasing anisotropic molecular orientation due to dichroism. The further the R value is away from 1 and the closer the S value is to 0, the greater the optical anisotropy.
Polarized electronic spectra for the complex after irradiation with linearly polarized UV light are shown in Figure 6 and Figure 7. To observe whether optical anisotropy develops, a circular diagram was created by plotting absorbance at different angles. If the circular diagram is elliptical or snowball-shaped, optical anisotropy is high, and if it is circular, optical anisotropy is low.
After linearly polarized UV irradiation, the degree of increase in optical anisotropy of the C22H22Cl2N4O2Zn2 + PVA was significant. This suggested that the rigid zinc complexes were more easily able to increase and maintain optical anisotropy in the PVA matrix. And, we obtained the optical anisotropy of C22H22Cl2N4O2Zn2 parallel to linear polarization in PVA. Particularly, for C22H22Cl2N4O2Zn2 + PVA, the molecular orientation was successfully observed with linearly polarized UV light.

3. The Structural Changes Caused by Irradiating Proteins Bound to Zinc Complexes with IR-FEL

3.1. Research Using IR-FEL

Our laboratory is continuously studying the structural changes induced by IR-FEL irradiation.
The free-electron laser (FEL) generates coherent electromagnetic waves via the resonant interaction of an electron beam with relativistic energy and an electromagnetic field. General lasers use the energy levels of electrons in atoms, molecules, and solids for laser oscillation. Free-electron lasers use free electrons in a magnetic field as the laser medium, allowing the oscillation wavelength to be varied continuously by changing the strength of the magnetic field and the electron energy.

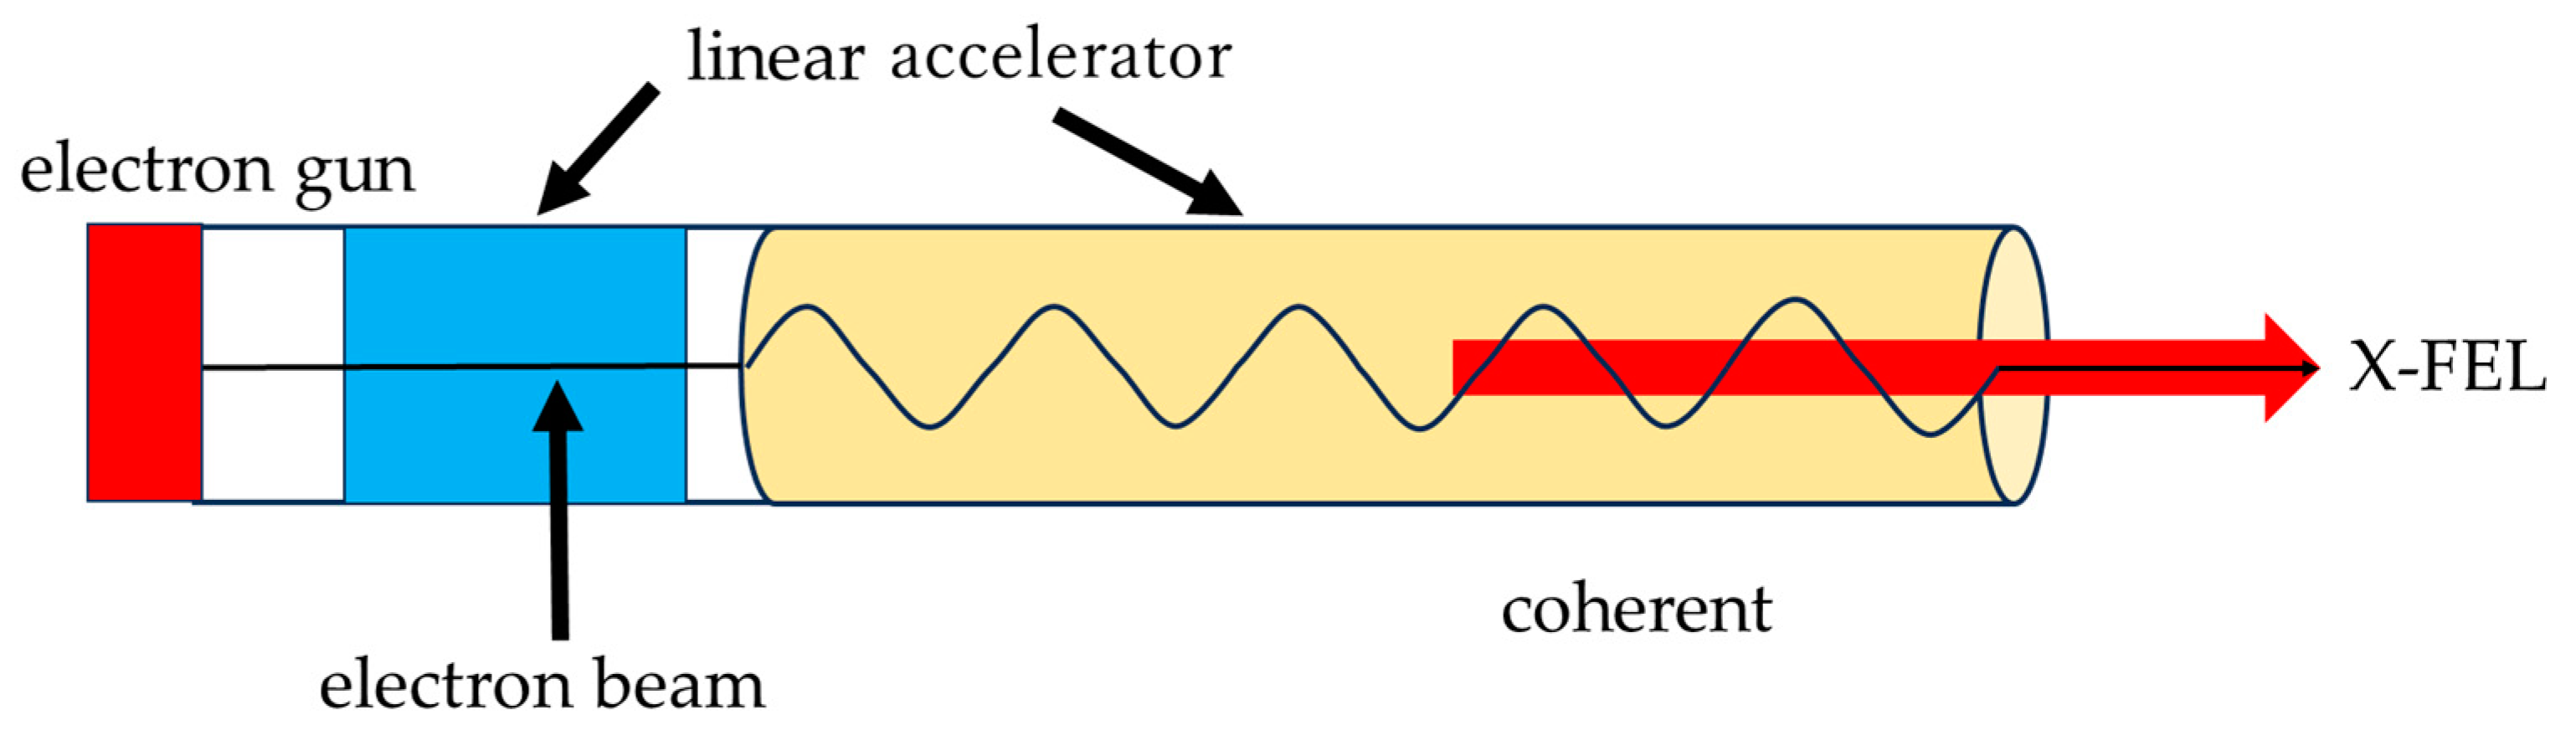
3.2. X-ray Free-Electron Lasers (X-FEL)
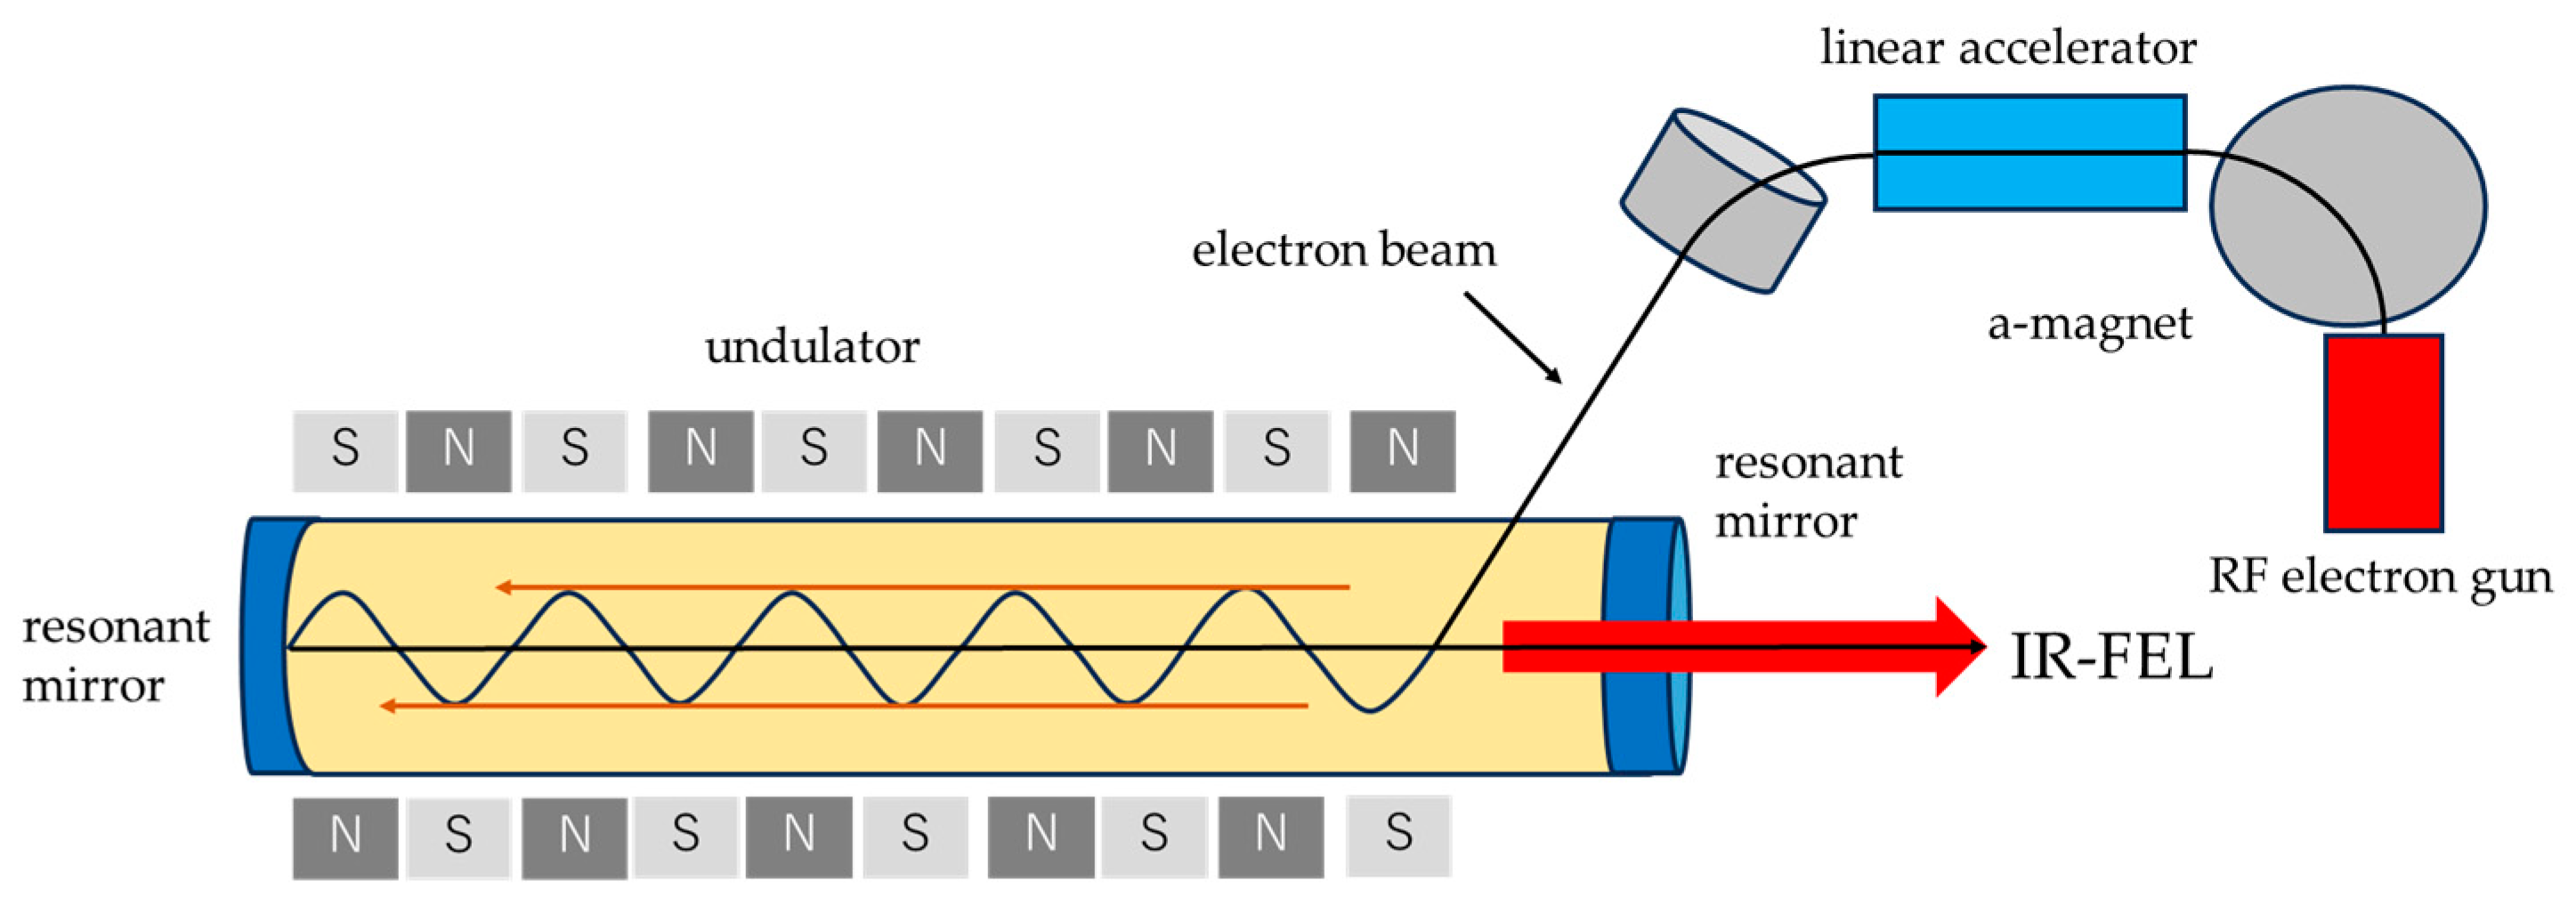
Free-electron lasers include X-ray free-electron lasers (X-FEL), such as the one installed at SPring8, and IR-FEL, such as the one installed at the Tokyo University of Science’s Infrared free-electron laser Research Center.
The schematic composition of an X-ray free-electron laser is shown in Figure 8. Synchrotron radiation is the light emitted when charged particles are accelerated, that is, when their speed and direction of motion are changed. When the light emitted from an electron gun is guided by a group of electrons through an undulator, which consists of many magnets arranged in a straight line above and below the electron orbit, the emitted light with a certain wavelength is enhanced due to interference.
Mirrors are placed at both ends of the undulator to reflect light hundreds of times, and electrons are injected into the undulator one after another, causing the electrons to line up at the intervals of the wavelength of light due to the interaction of electrons and light. Thus, a group of electrons of the same phase undulate in the undulator, leading to the oscillation of laser light. This is the free-electron laser.
However, as the wavelength becomes shorter, the reflectivity of mirrors decreases, and there are no mirrors that can reflect X-rays. However, in the late 1990s, it was suggested that instead of reflecting hundreds of times with mirrors, the undulator could be made long enough. If the undulator is long enough, the interaction between light and electrons will cause the electrons in front of the mirror to line up one after another according to the wavelength of the light emitted by the electrons behind it, creating a population of electrons in the same phase.
This makes it possible to extract X-rays with short wavelengths as a free-electron laser [43]. With X-ray synchrotron radiation, protein molecules must be crystallized in order to see their structures. On the other hand, with X-ray laser light, the structure of a protein molecule can be examined without crystallization. This allows us to study the structure of molecules that have not been crystallized, such as membrane proteins in cell membranes, which is promising in terms of drug discovery [50].

3.3. IR-FEL

The structure of the IR-FEL is shown in Figure 9 [51,52]. The IR-FEL at the Free-Electron Laser Research Center at Tokyo University of Science (FEL-TUS) has a mid-infrared region (5–14 mm) and has advanced and distinctive features, such as linear polarization [53,54], a pulse light source with a unique time structure, and high photon density. In addition, because the oscillation wavelength is in a substance-specific band called the fingerprint region, almost all substances can be subjected to analysis through irradiation [52,55].
This is used for the analysis of various proteins, trace glycans, and peptides. The method is characterized by the use of a Fourier-transform ion cyclotron resonance mass spectrometer (FTICR MS) to irradiate ions fixed in a vacuum with an IR-FEL, a wavelength-tunable, high-power pulsed laser to induce dissociation via infrared multiphoton absorption (IRMPA), thereby analyzing the wavelength dependence of the resulting fragments. Furthermore, the Infrared Free-Electron Laser Facility of the Tokyo University of Science has a full-time support researcher for synchrotron radiation use, which enables the smooth execution of research. This utilization research and the shared use system for such research are unique among facilities with infrared free-electron lasers in Japan [52,55].
Infrared multiphoton absorption (IRMPA) is a process in which molecules absorb a large number of photons and are excited to a highly vibrational state when irradiated with high-intensity infrared light. This process is IRPMA, which allows for structural isomerization and divergence reactions that require high-temperature conditions to be performed at room temperature. Therefore, by exciting the specific vibrational motions of the target molecule, structural changes can be induced with fewer byproducts, unlike thermal reactions that produce various byproducts [56]. As a further complement, for IRMPA, most molecules have absorption bands based on vibrational excitation in the mid-infrared region. By using IR-FEL, IRMPA can investigate almost any molecule as an irradiation target because the excitation process can be induced by selectively applying photon energy to certain vibrational modes of a particular molecule with IR absorption [25].
By irradiating proteins with IR-FEL at specific wavelengths, specific bonds in sugars can be cleaved and selectively degraded from polysaccharides to monosaccharides [26,27]. In the same way, IR-FEL can be used to selectively degrade protein molecules by irradiating proteins. So far, there are studies of fibrous peptides using terahertz light, amyloids using mid-infrared light, and aggregated lysozymes [28,29,30]. In addition, it is generally known that the fiber structure of amyloid fibrils collapses when heated above 80 °C. This is due to the breaking of weak bonds such as hydrogen bonds caused by external heating to high temperatures [25]. This is due to the breaking of weak bonds such as hydrogen bonds caused by external high-temperature heating [25].

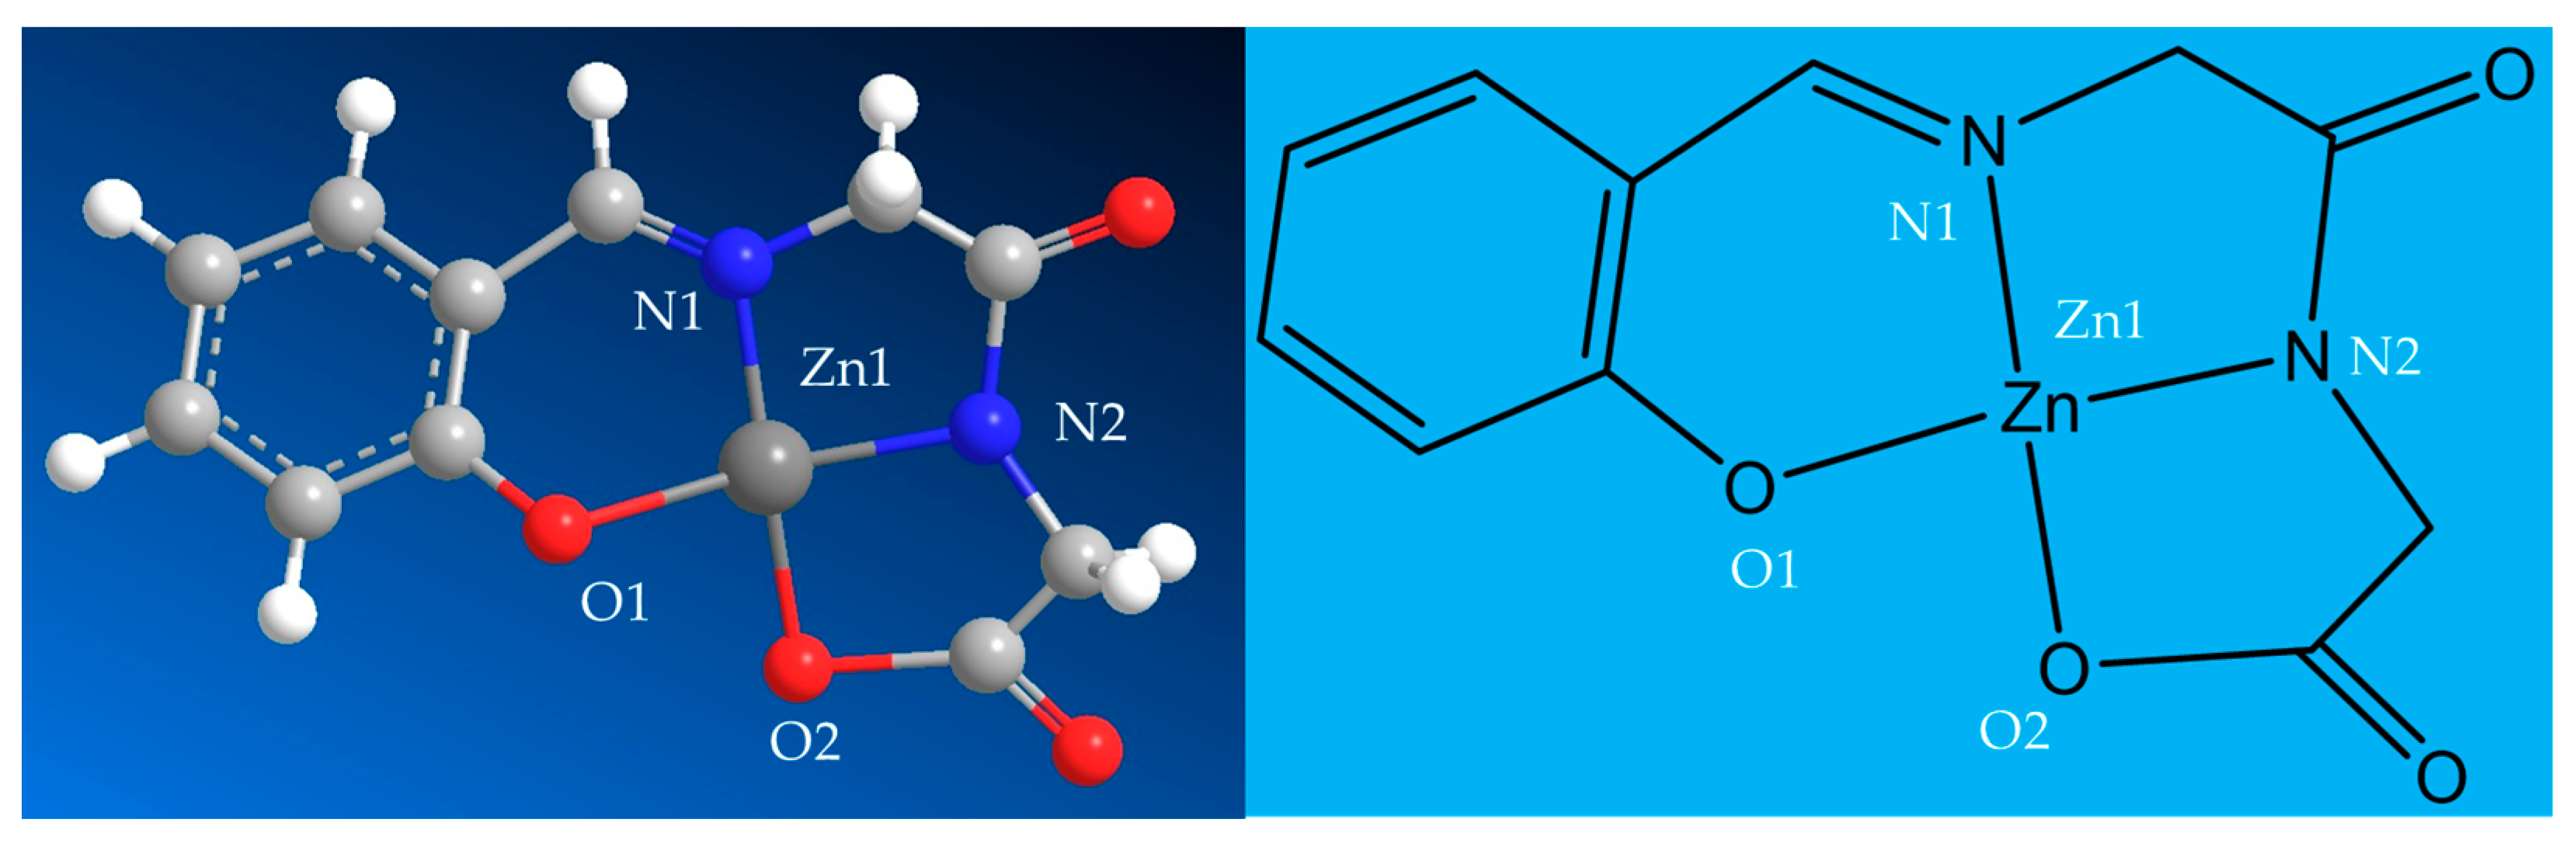
3.4. Irradiating IR-FEL on the Complex of Human Serum Albumin (HSA) and Zinc Complex

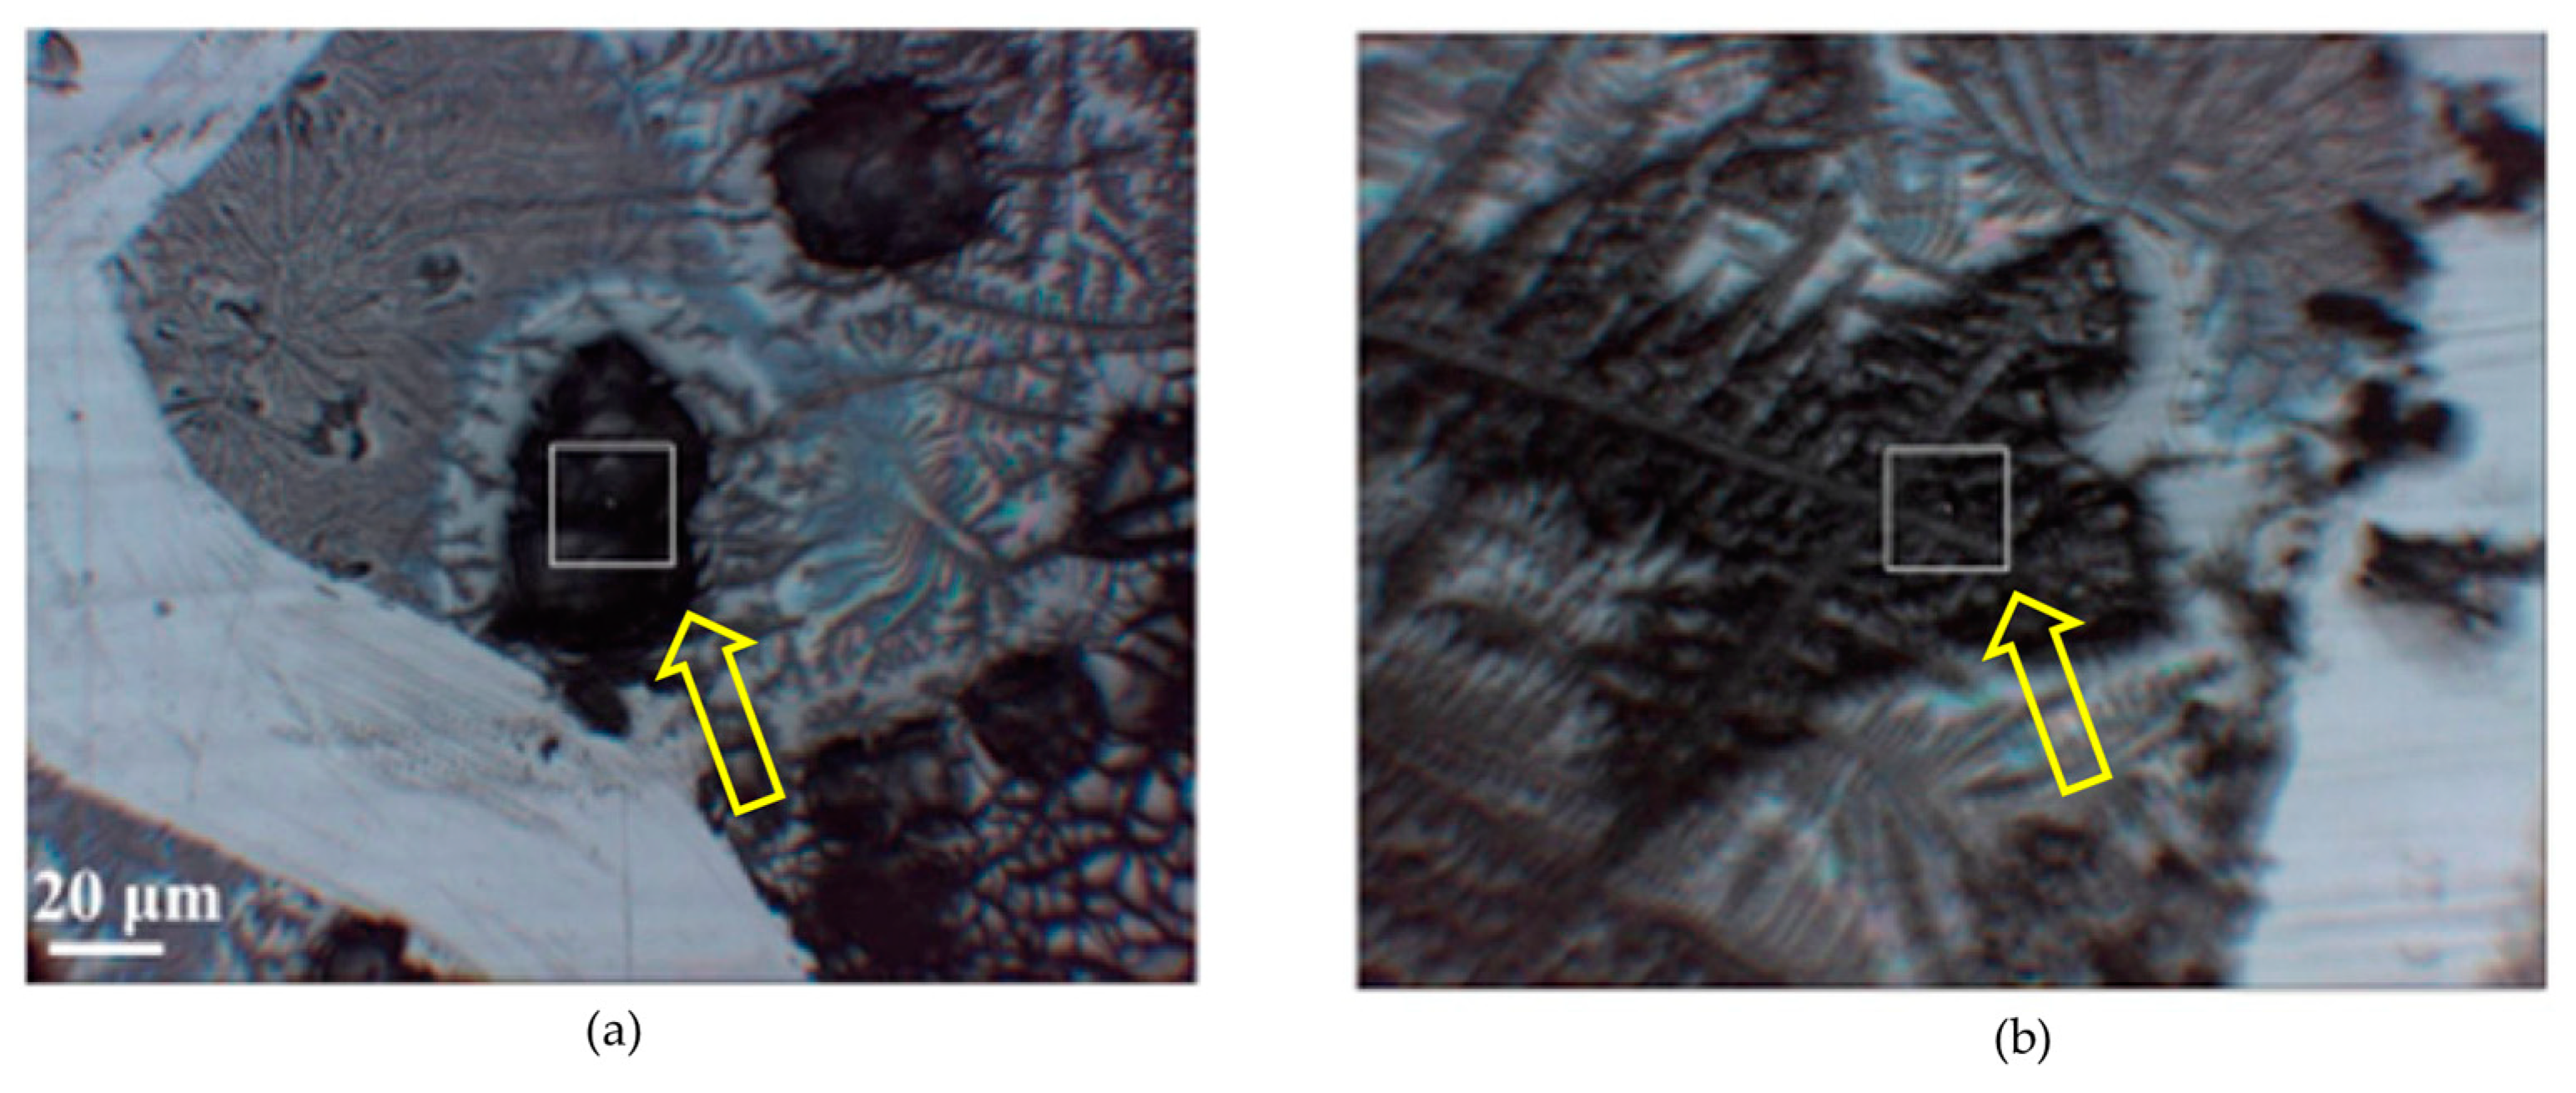
3.4.1. IR-FEL Irradiation of Hybrid Material

Our laboratory has long studied the IR-FEL irradiation of a hybrid material consisting of HSA, which is human serum albumin, and a zinc complex synthesized with an amino acid ligand. We found that the irradiation of this complex with IR-FEL causes disorder in the secondary structure of the protein [57]. This led us to believe that the introduction of the complex may be able to move the structure of the protein, which was not possible previously [58,59,60,61,62]. The synthesis and identification of glycyl-glycine derivative Salen-Type Schiff base zinc complexes were carried out.
The changes in each structure (such as helix and sheet) were quantified by comparing the IR spectra before and after irradiation, and protein secondary structure analysis was performed using the analysis software IR-SSE (Infrared-Secondary Structural Estimation) [63,64]. In this study, we examined the changes in the secondary structure of proteins via the IR-FEL irradiation of a complex of Salen-Type zinc complexes without amide bonds (ZnL) and human serum albumin (HSA). ZnL is the complex shown in Figure 10, and geometrical parameters at center metal Zn, bond lengths (in Å), and angles (in degrees) were calculated using the B3LYP and MP2 methods in ZnL, as shown in Table 2.

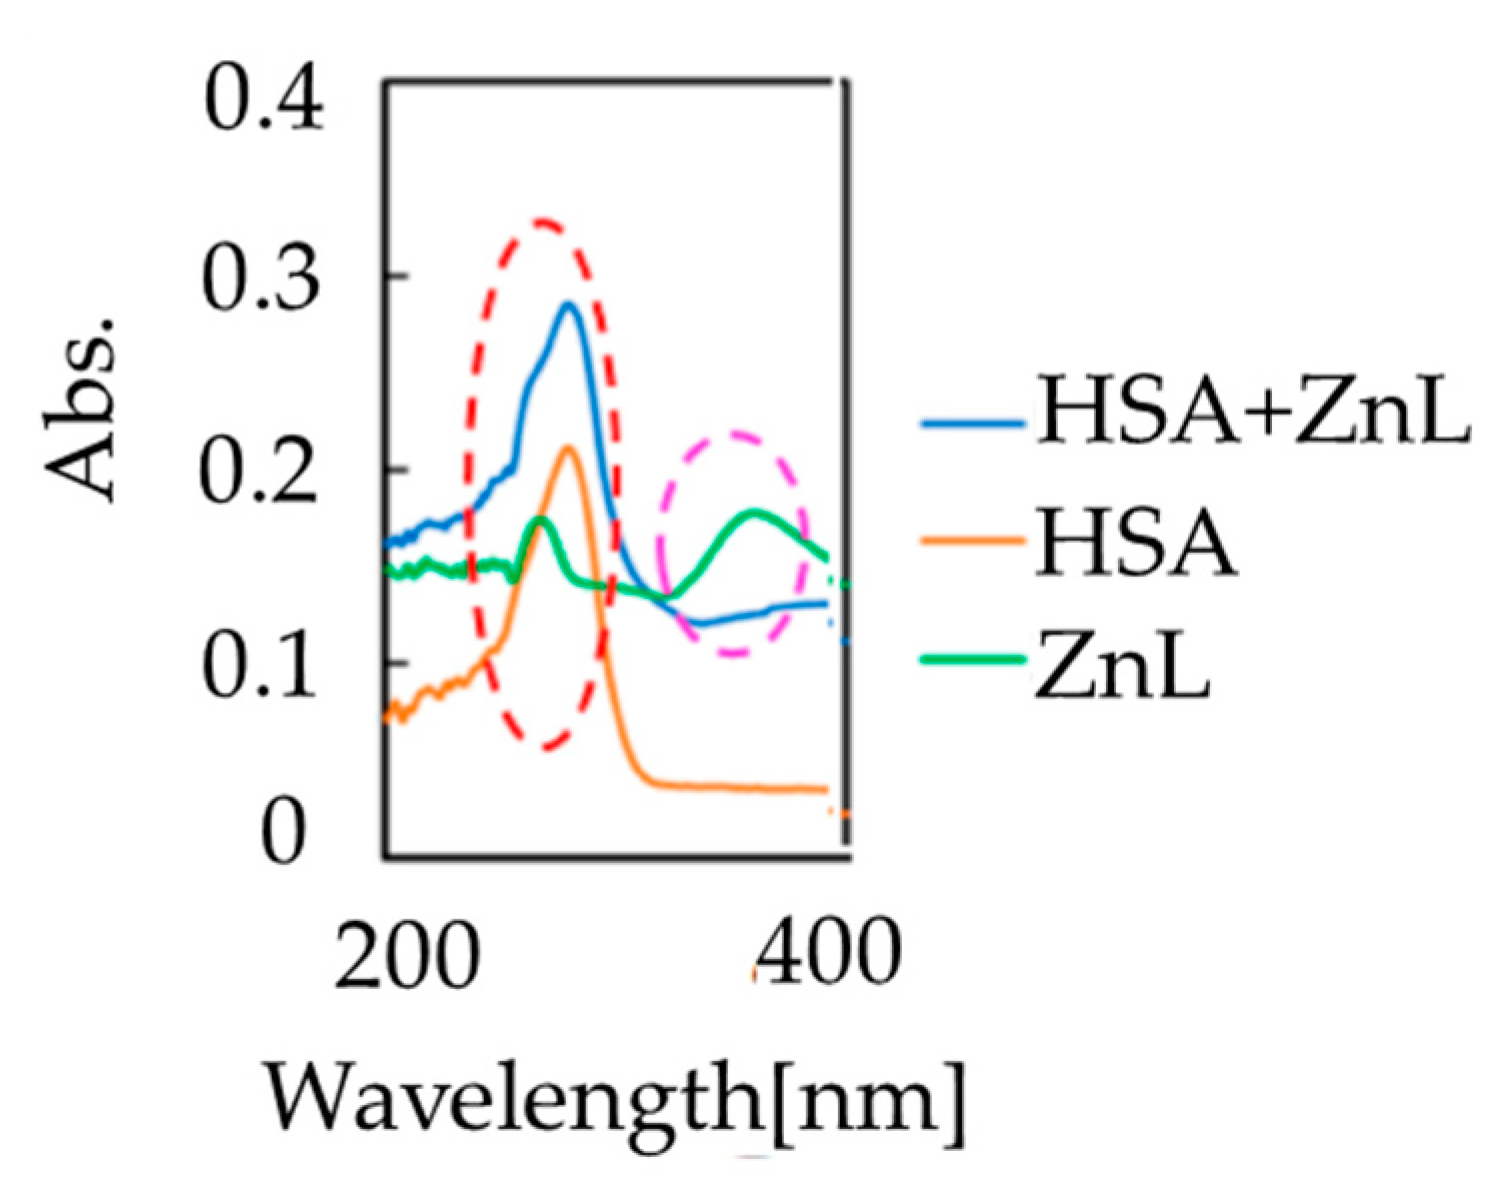
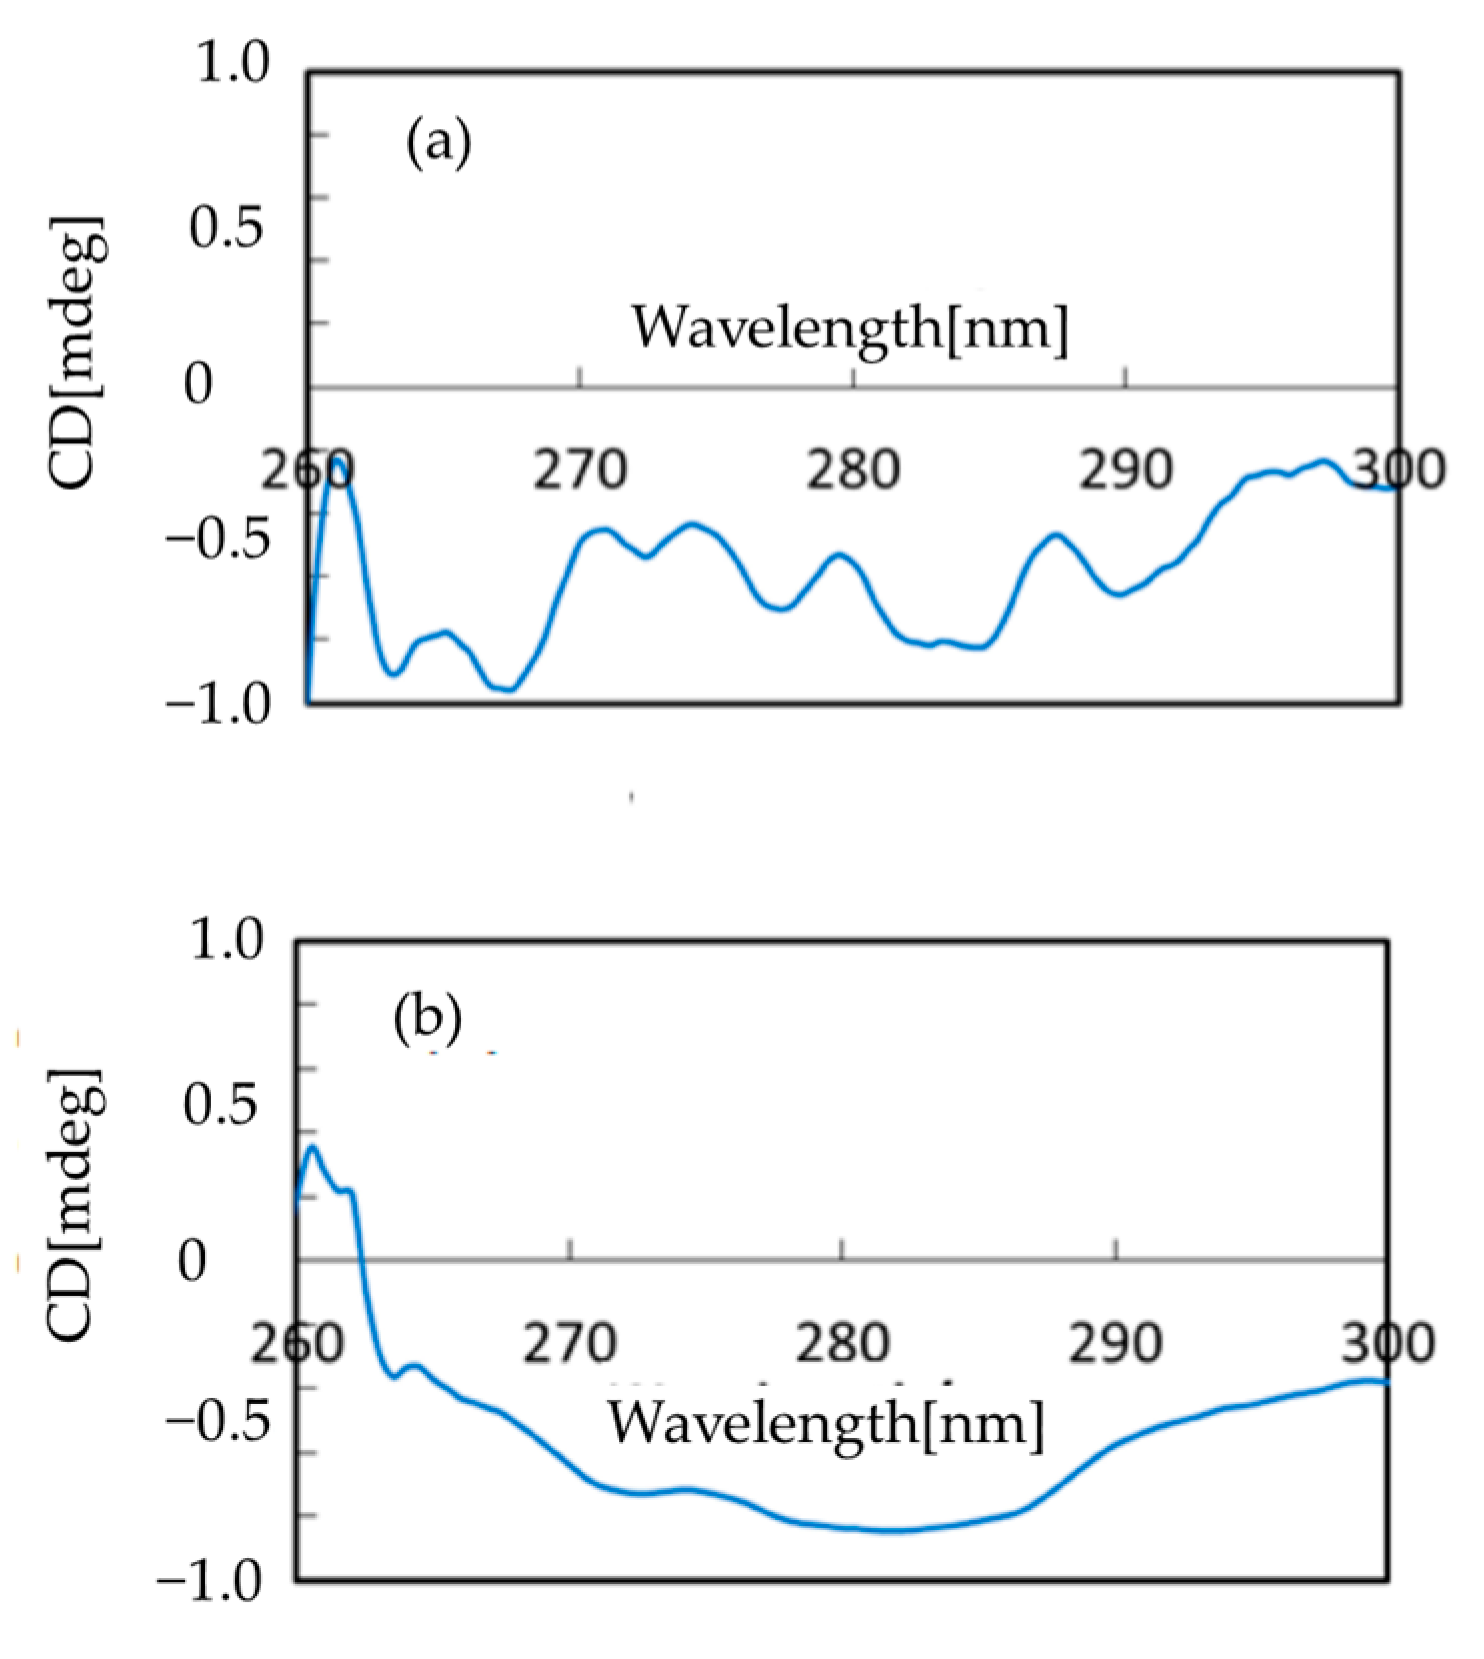
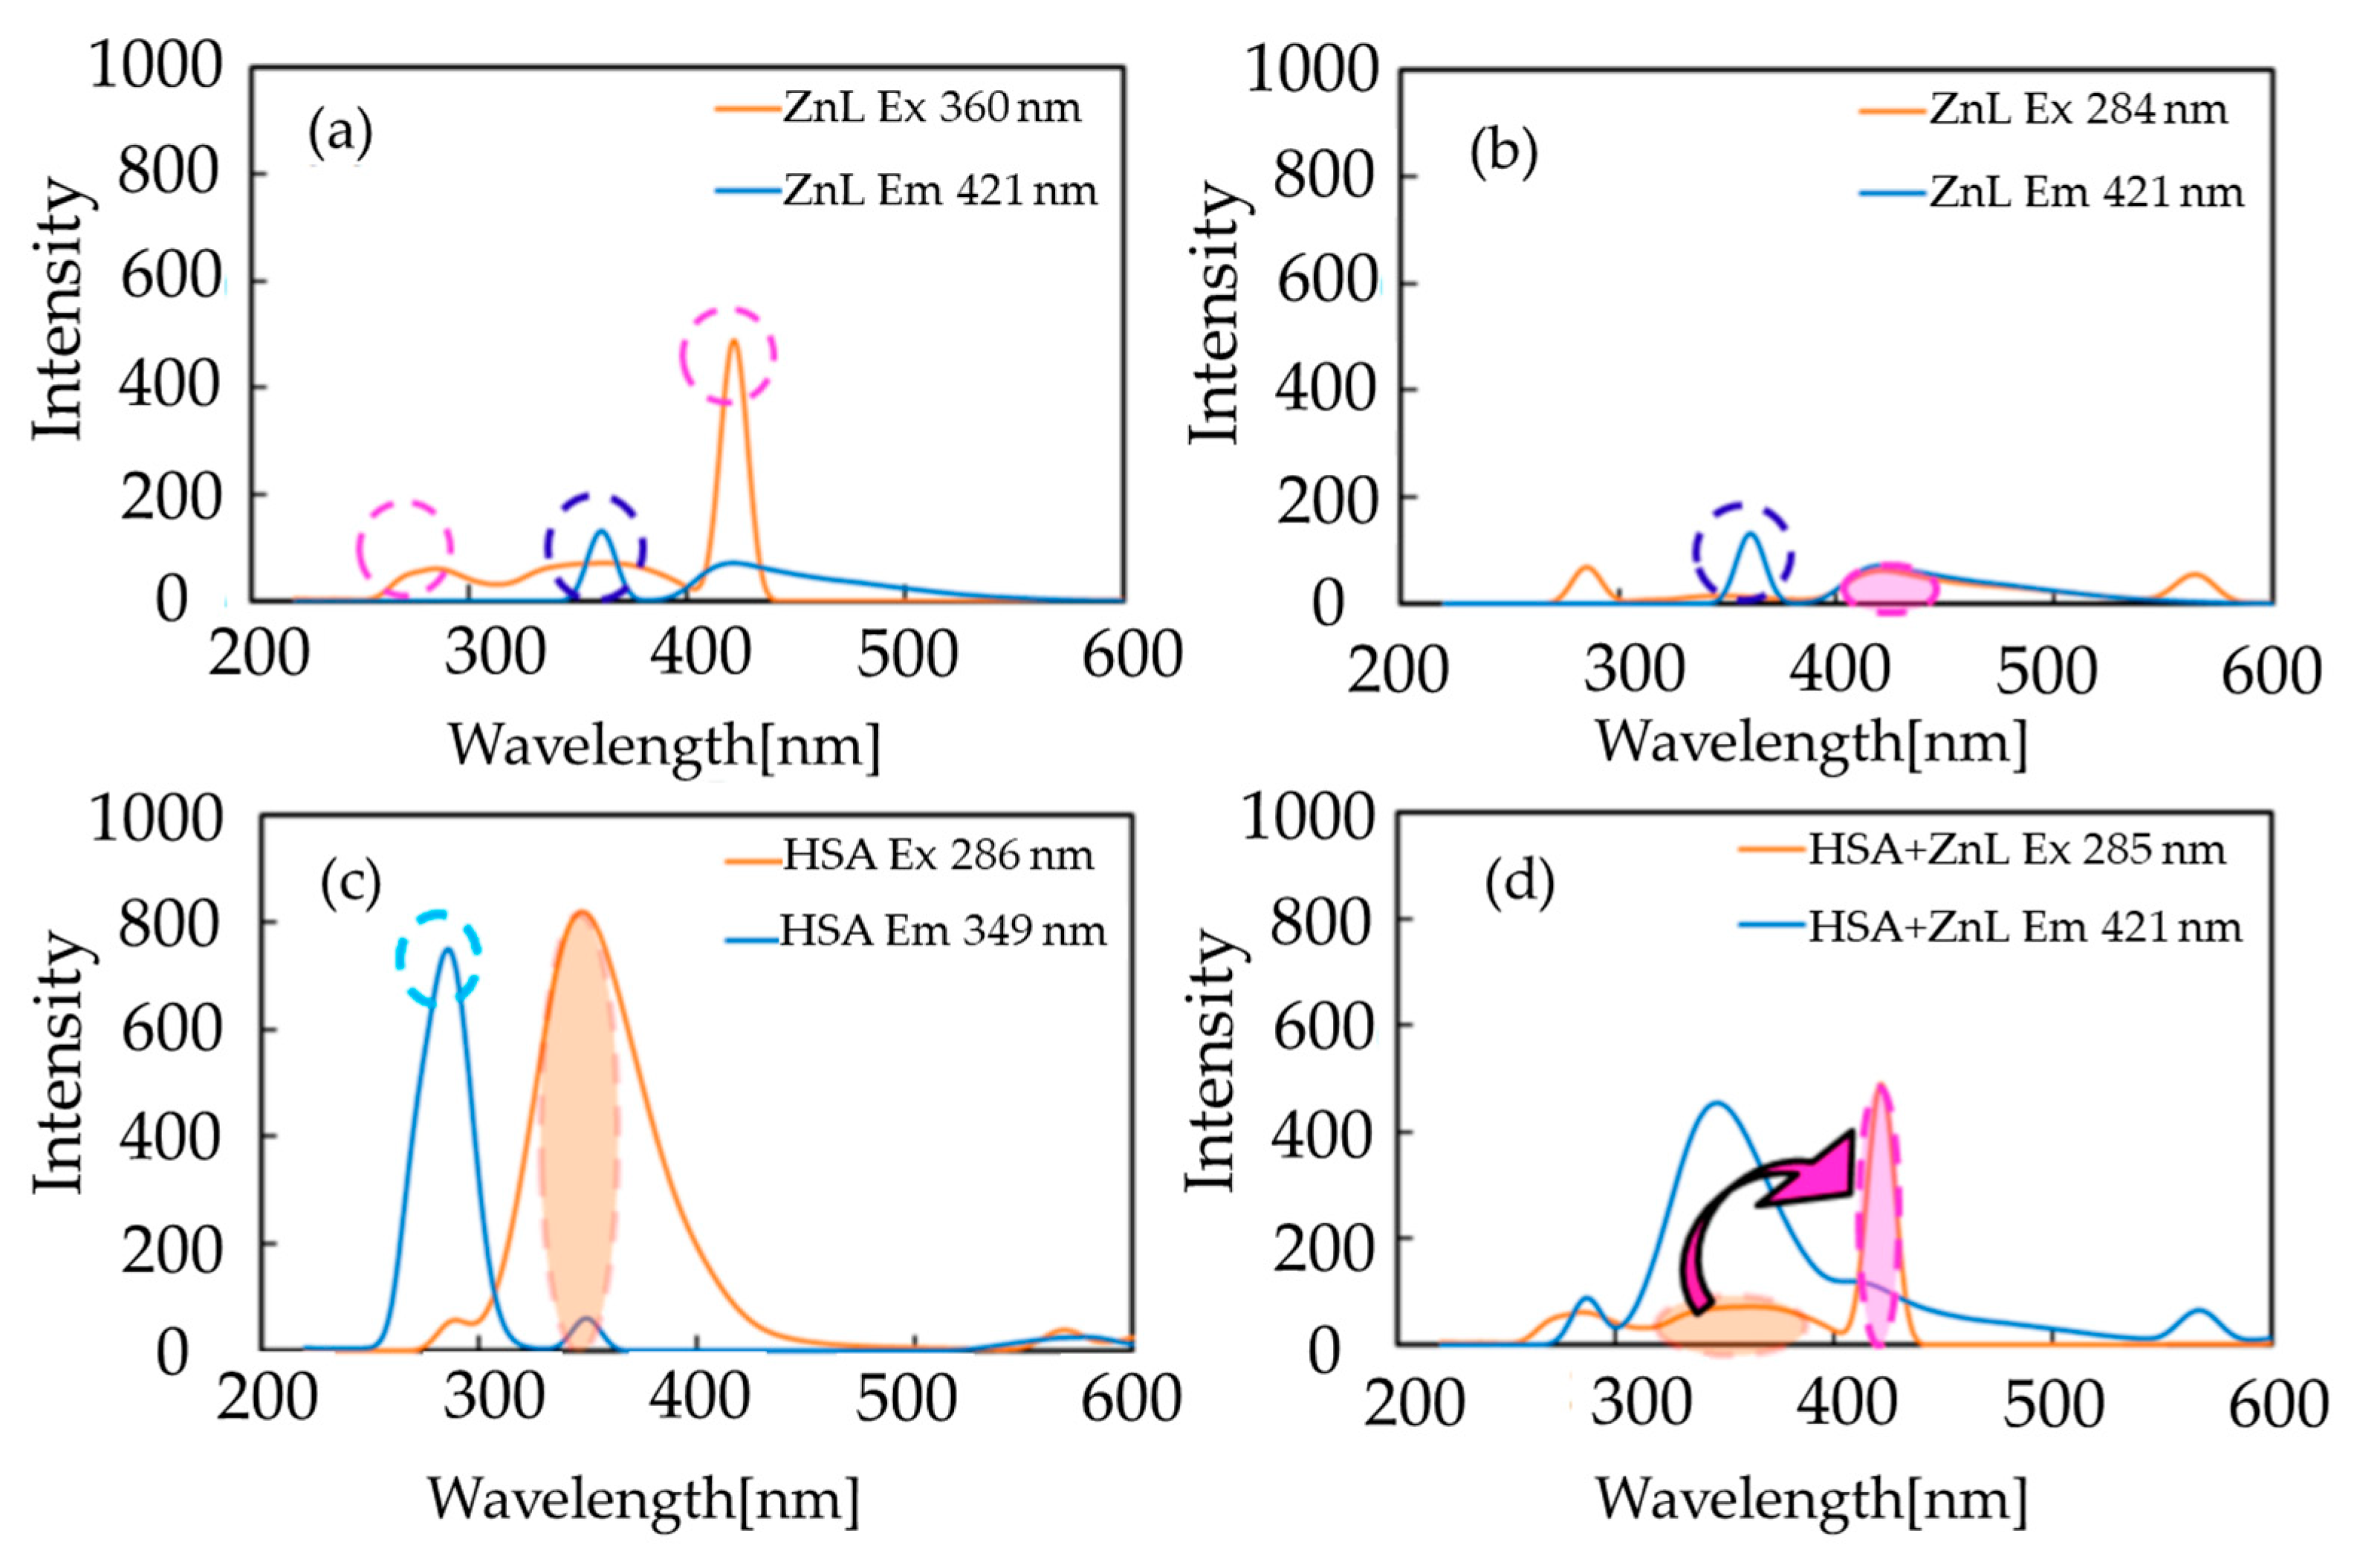
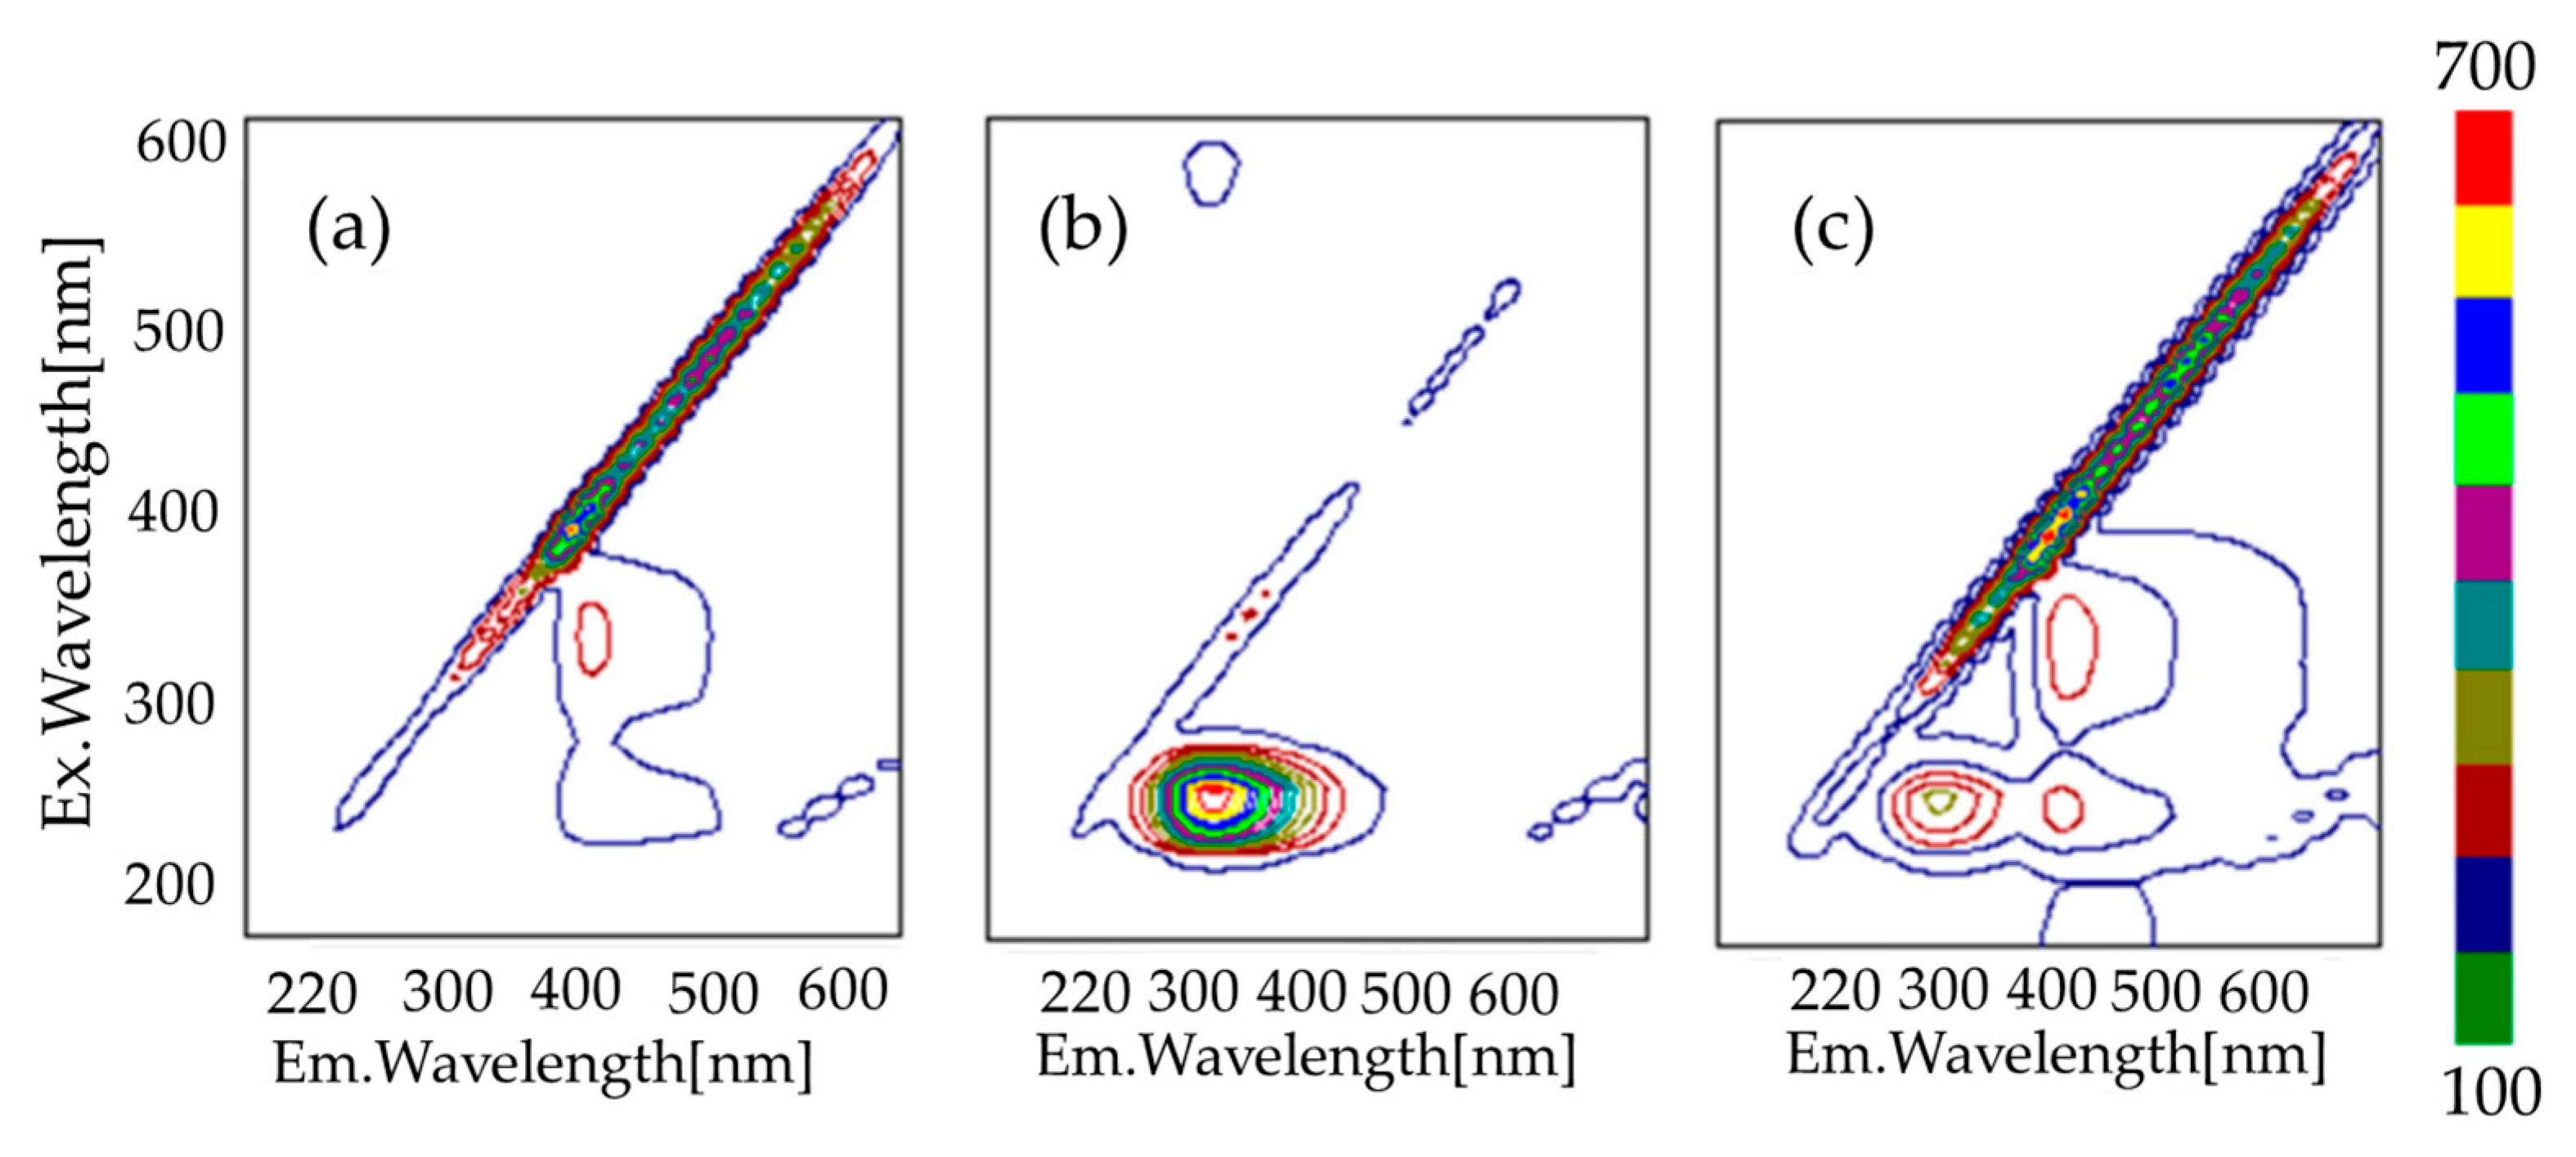
3.4.2. UV-Vis, CD, and Fluorescence
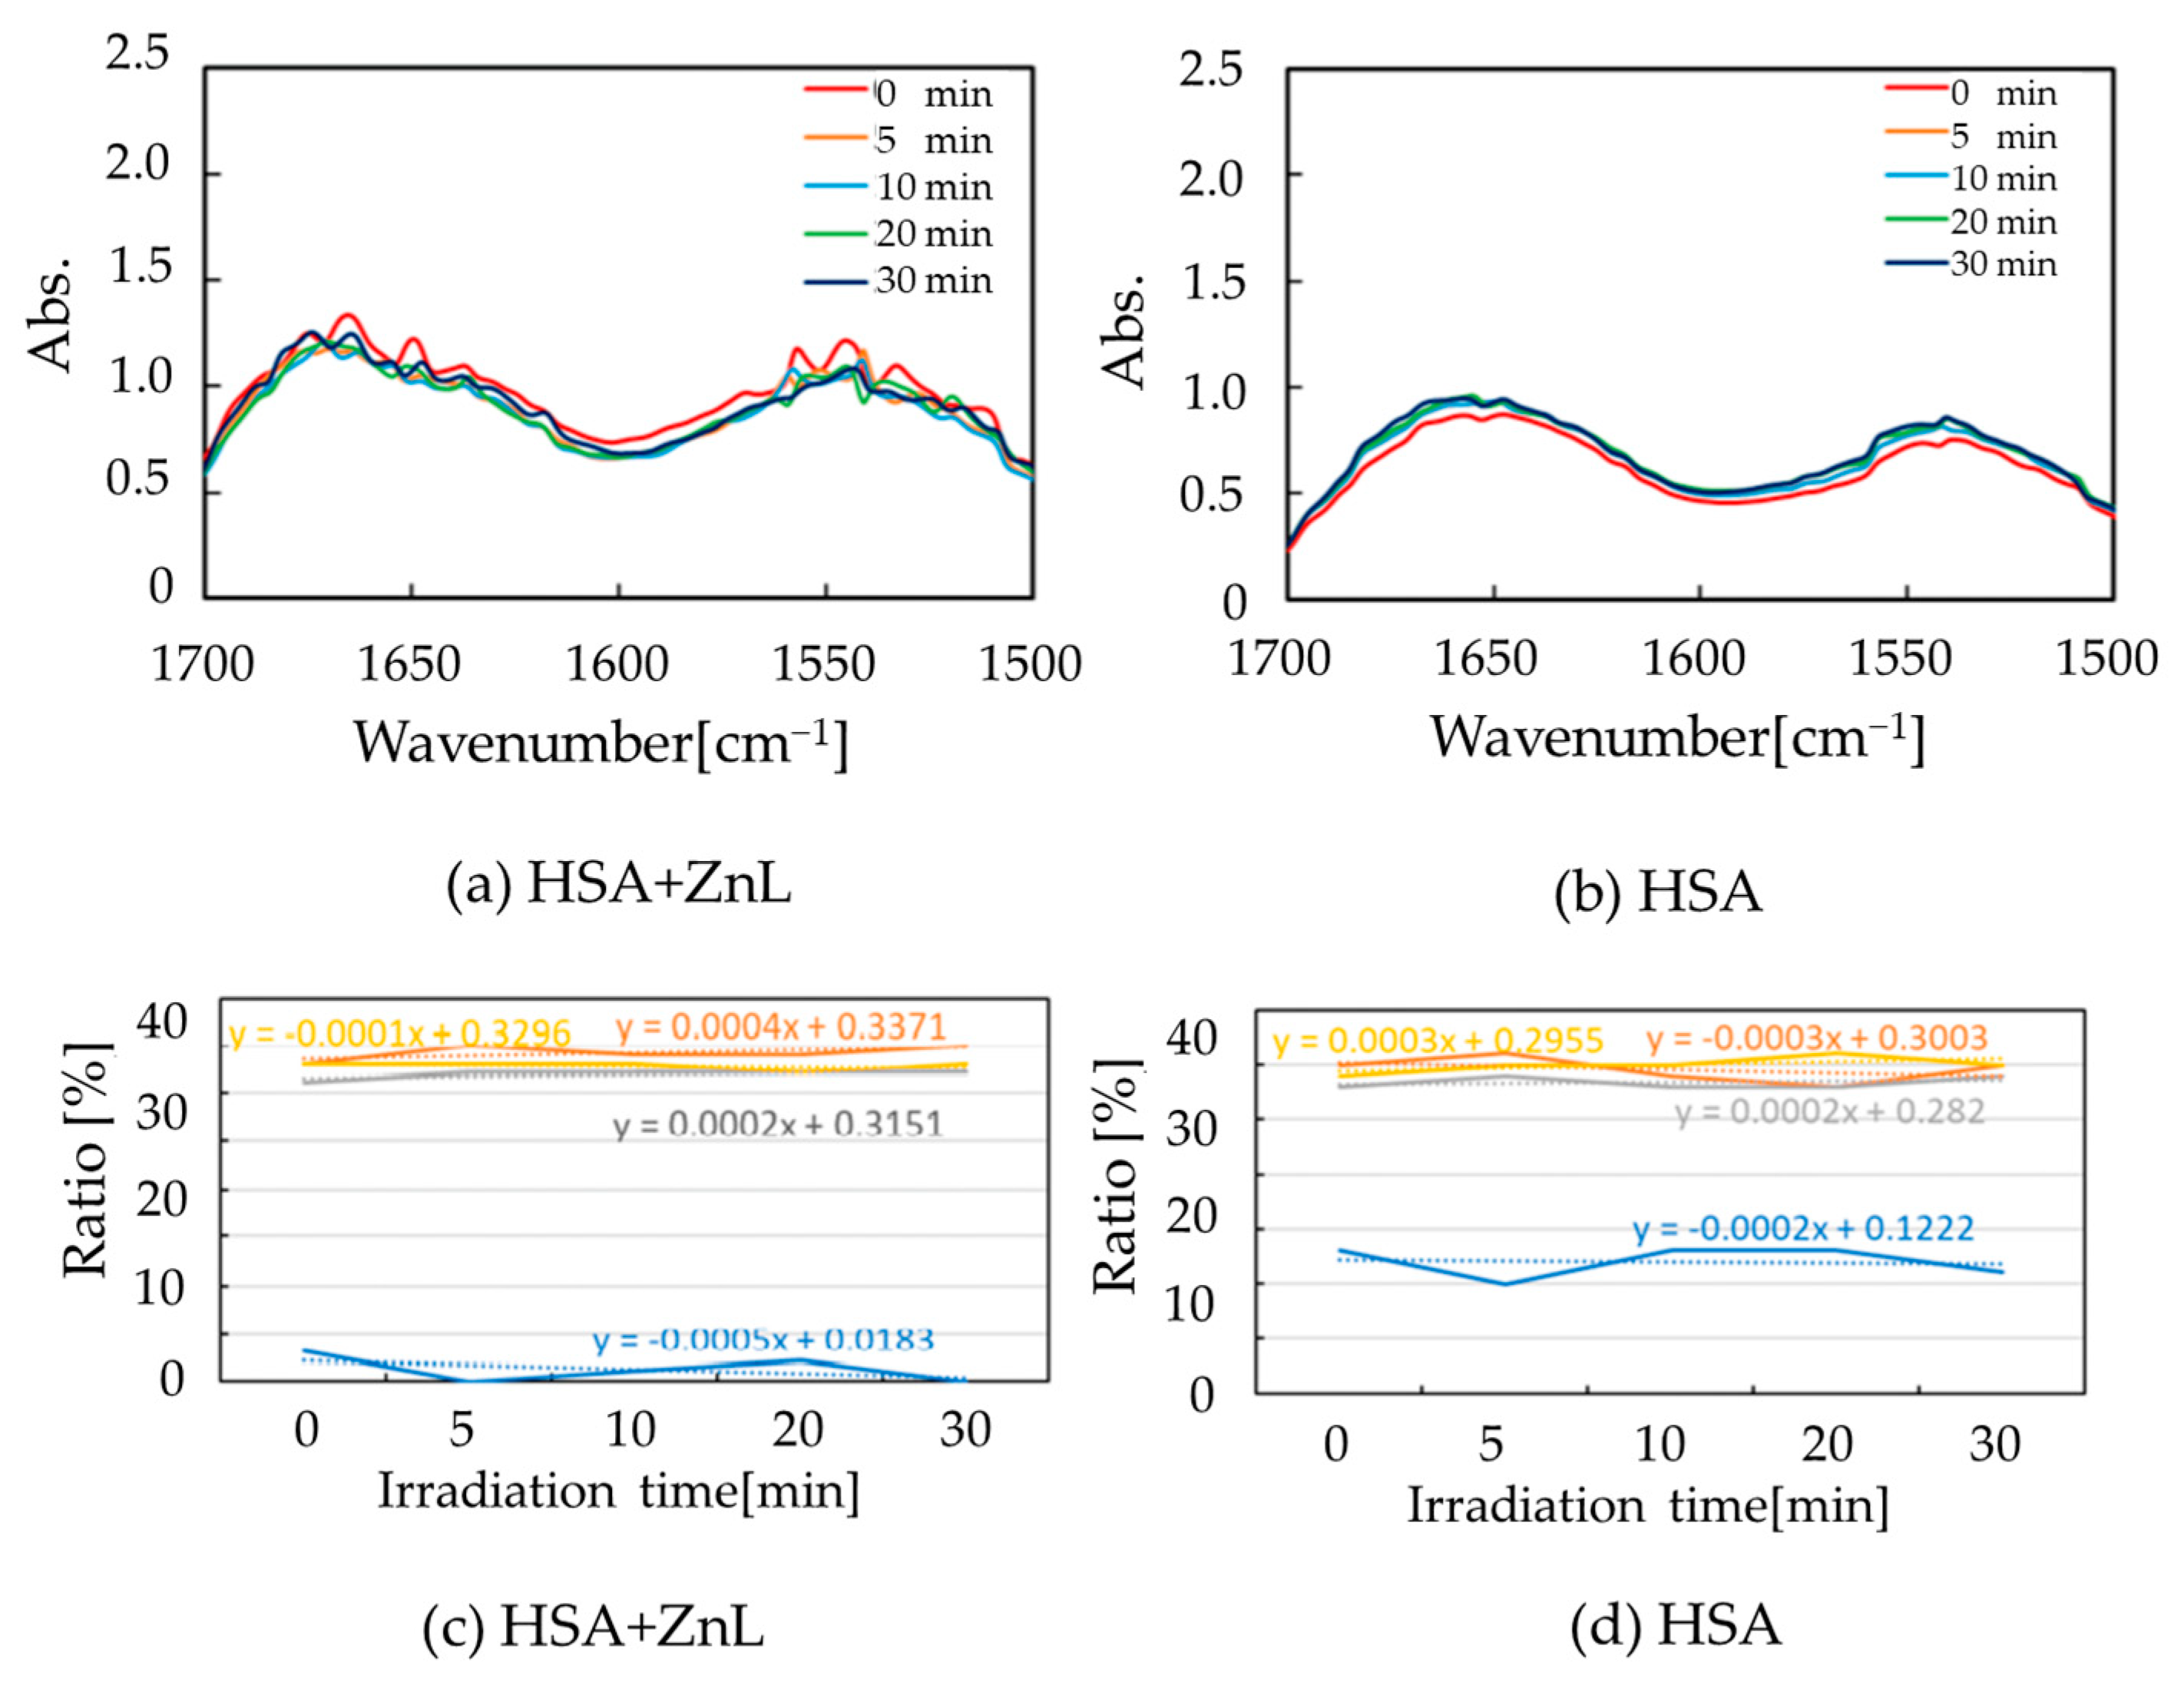
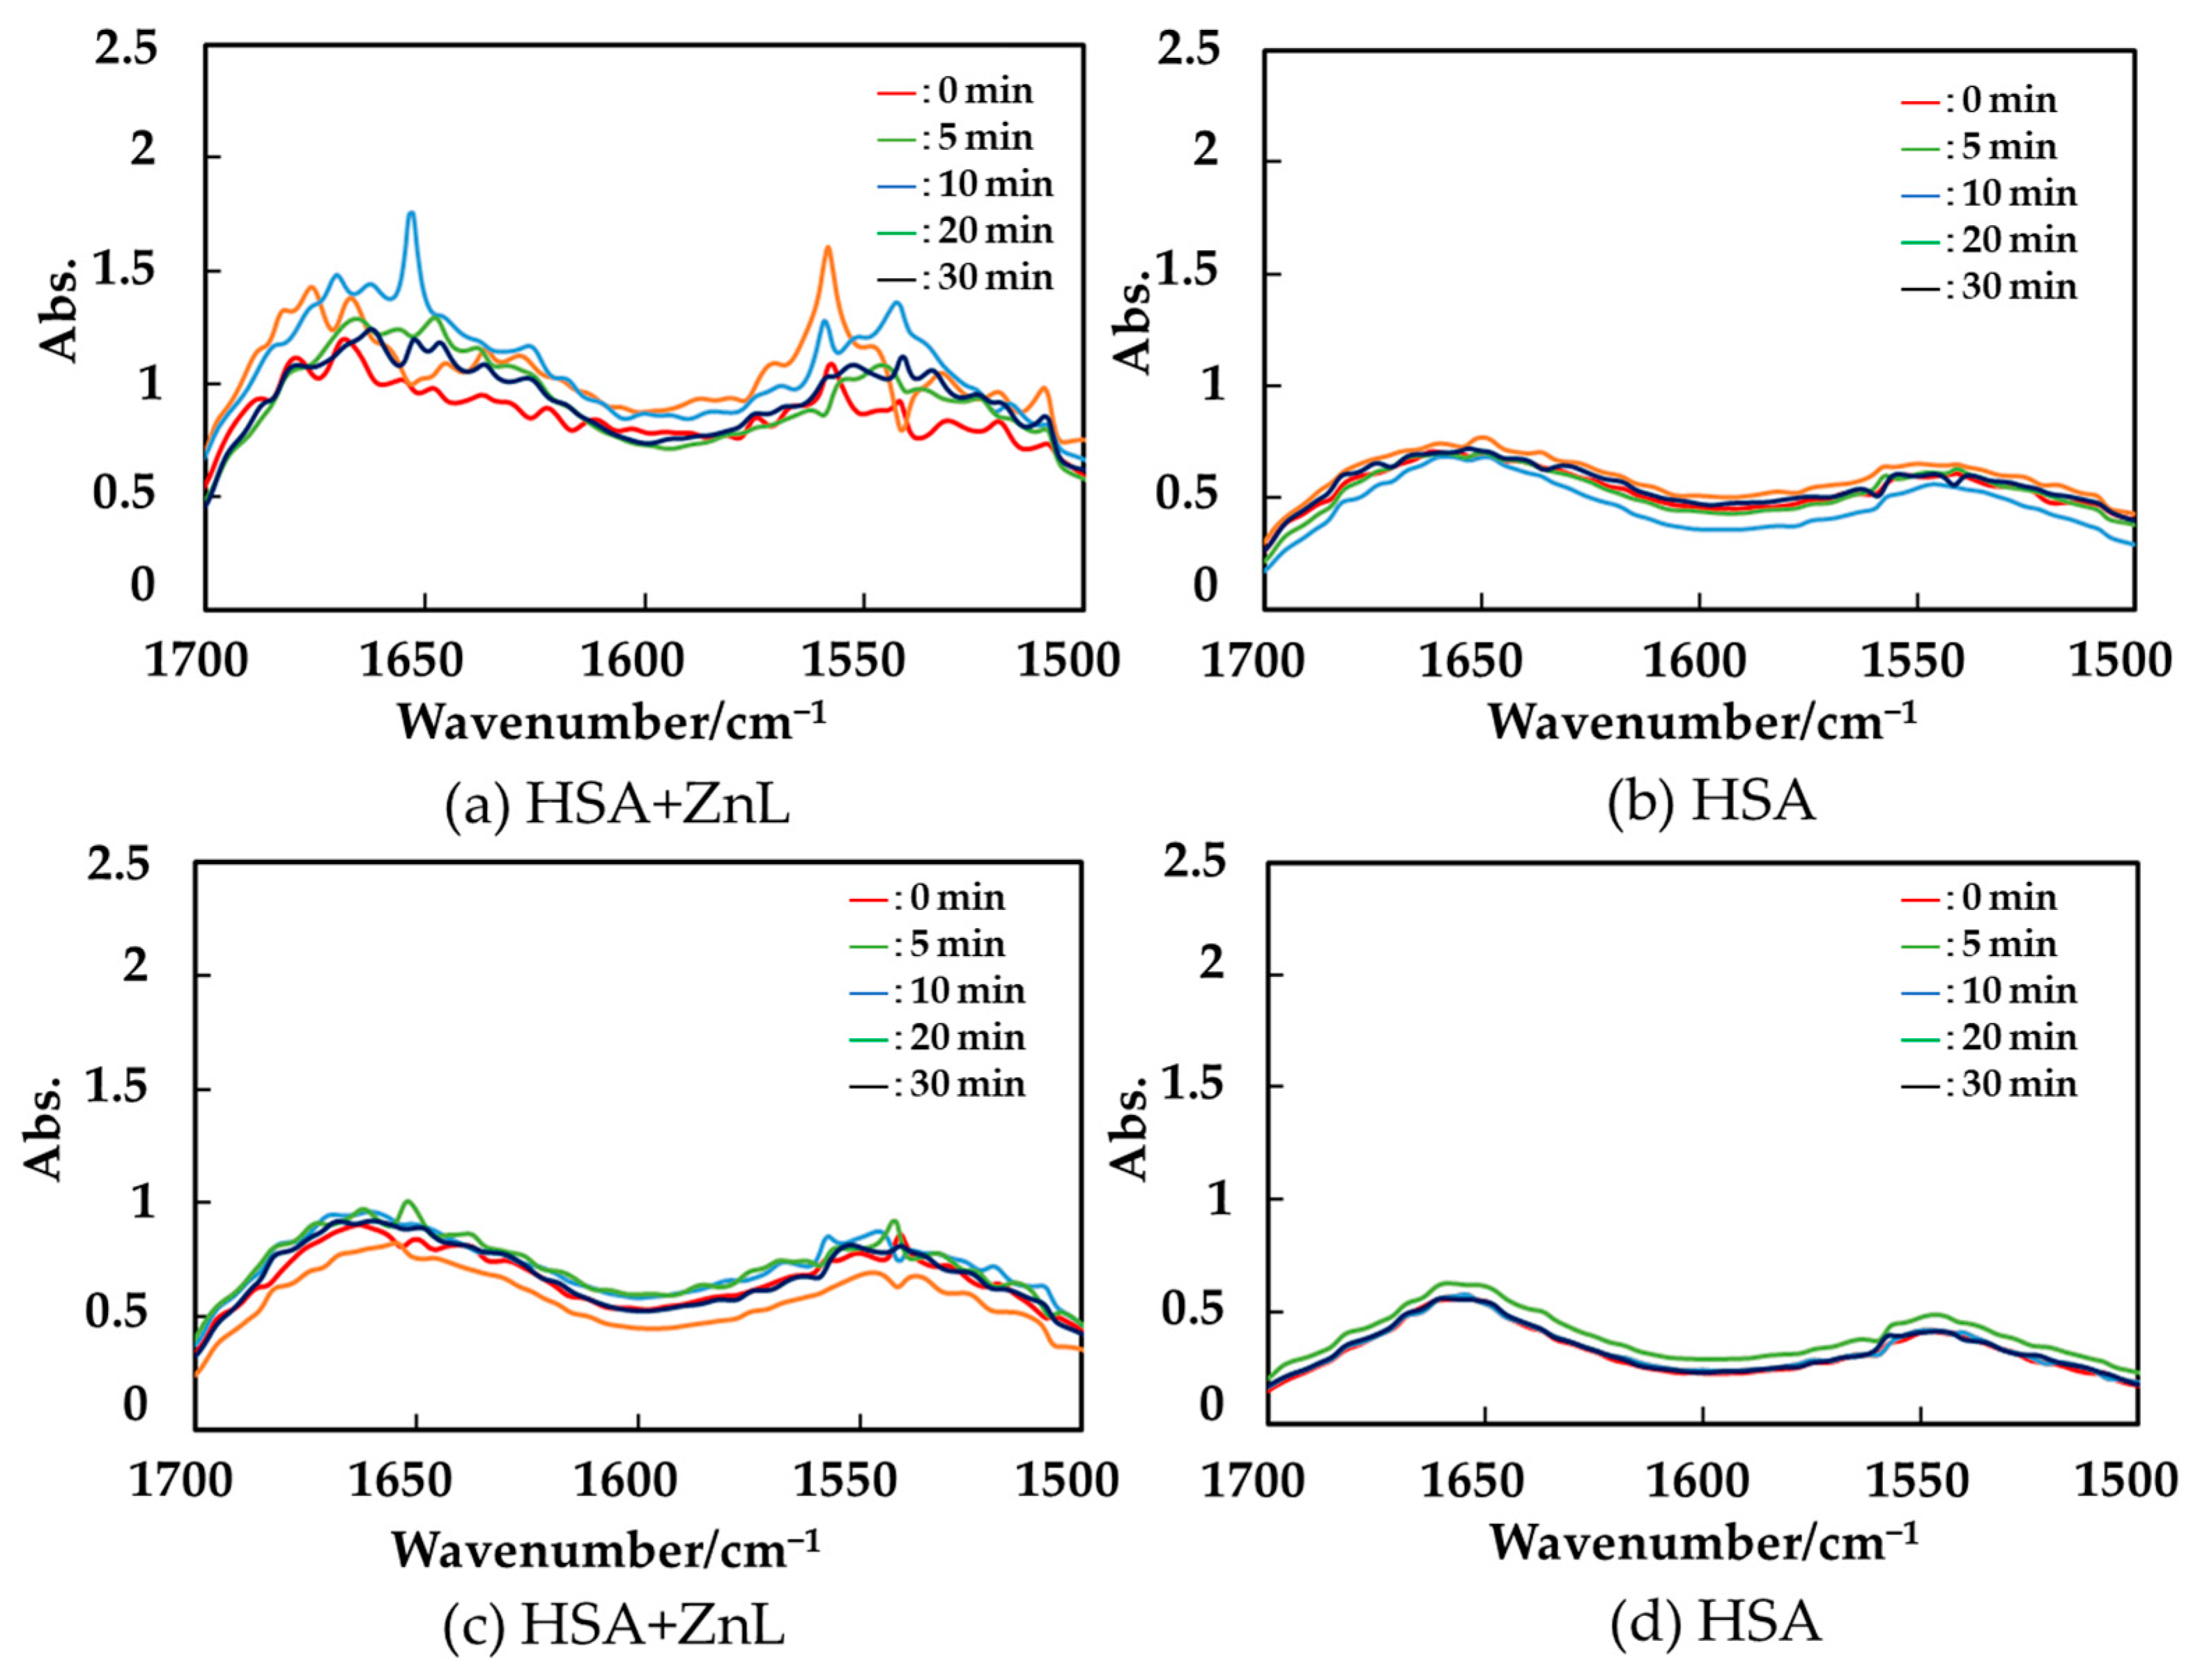
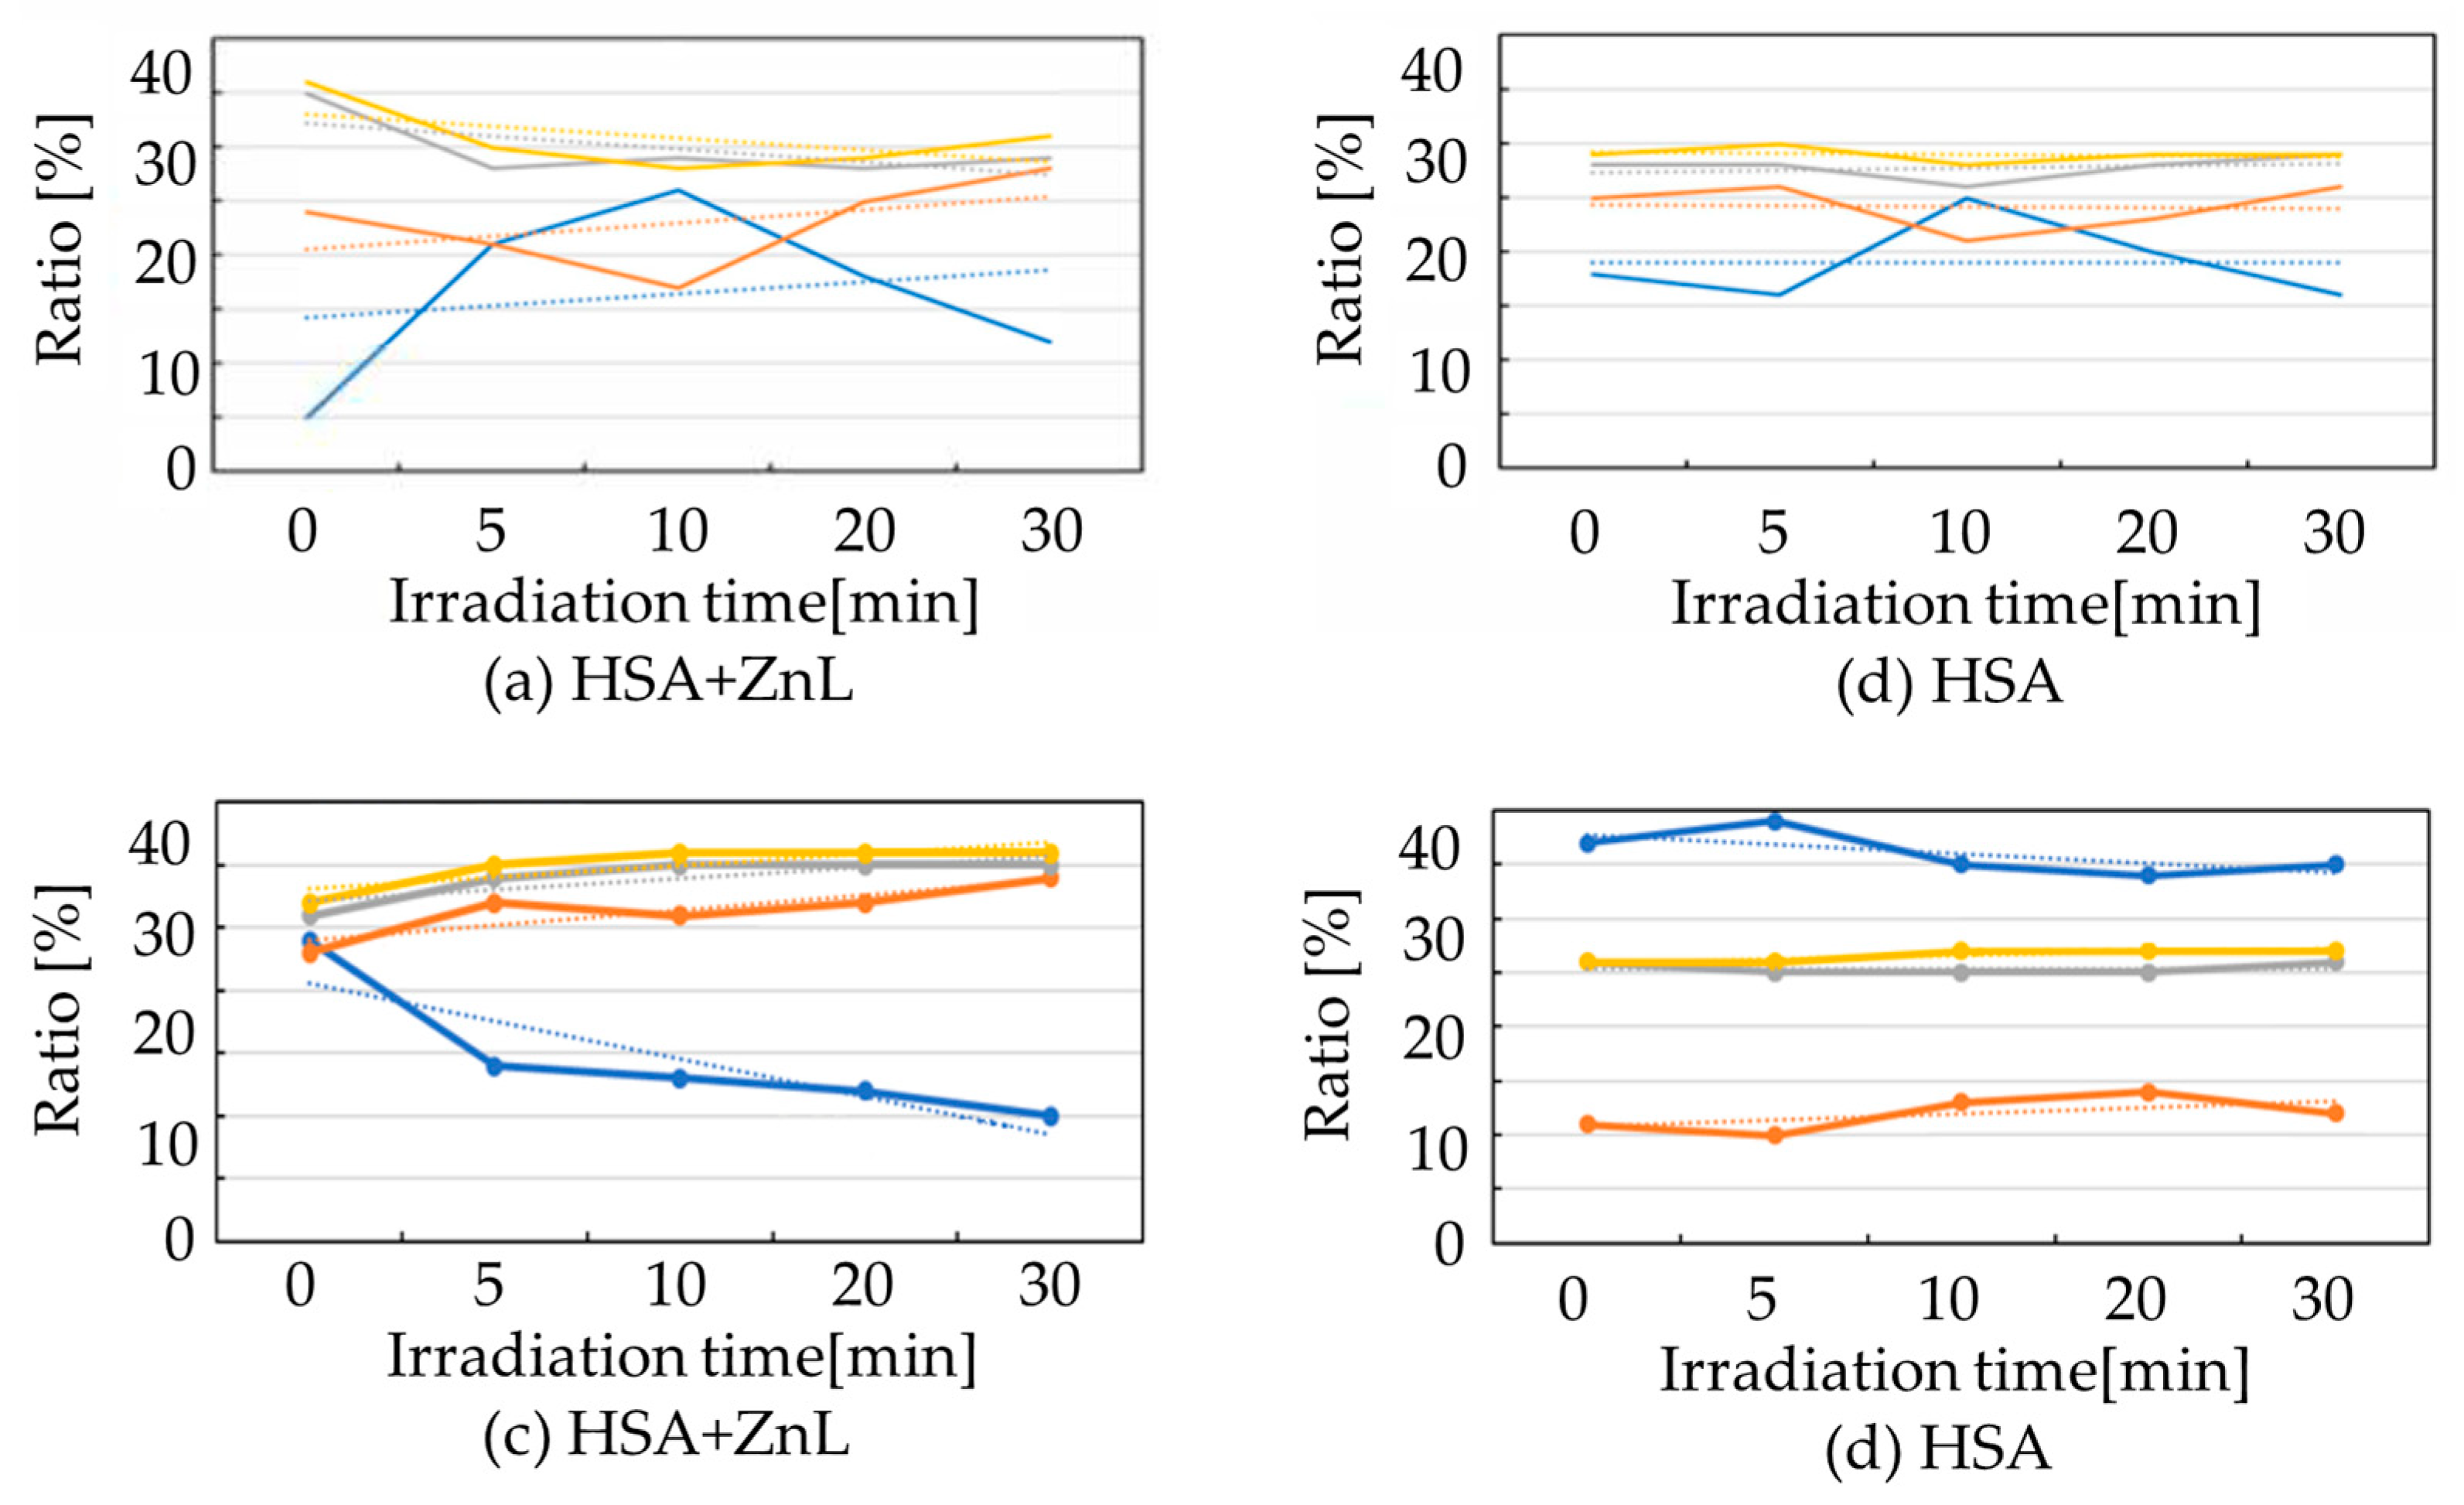
ZnL was prepared according to a method from the literature [65]. First, the UV-vis, circular dichroism (CD), and fluorescence spectra of ZnL and HSA + ZnL indicate that HSA + ZnL is a complex [66].
The UV-vis spectra of HSA + ZnL (blue), HSA (orange), and ZnL (green) are shown in Figure 11. The UV-vis spectra of HSA + ZnL, HSA, and ZnL in dimethyl sulfoxide (DMSO) showed that ZnL does not exhibit a d-d band for the electron configuration in d10 state and only shows the π–π* band around 270 nm and the n–π* band around 380 nm, respectively. The π–π* band around 270 nm appears due to organic ligands peptide. On the other hand, in HSA, the π–π* band around 300 nm appears due to peptide. And in HSA + ZnL, the π–π* band around 270 nm appears, but the n–π* band around 380 nm due to ZnL disappears. This spectral change indicates an intermolecular interaction due to the docking of HSA and ZnL [67], indicating the formation of HSA + ZnL.
The CD spectra (in DMSO) of HSA and HSA + ZnL are shown in Figure 12. In the region shown, there were some CD peaks of HSA due to the chirality of the L-amino acid component, but the hybrid material appeared only as broad peaks. The clear differences provide evidence for the formation of HSA + ZnL hybrid materials; although the secondary structure of HSA may be altered by the inclusion of ZnL, secondary structure features generally result in changes in CD spectra in the short-wavelength region [32]. On the contrary, the structural changes in ZnL due to the ambient environment of HSA could not be observed or discussed based on Figure 12.
The fluorescence (PL) spectra (in DMSO) of ZnL, HSA, and HSA + ZnL are shown in Figure 13. According to Figure 13a,c, the optimum conditions for luminescence are ZnL (λex = 360 nm, λem = 421 nm) and HSA (λex = 286 nm, λem = 349 nm). However, ZnL can also emit under the same conditions (λex = 284 nm, λem = 421 nm), including the same excitation as HSA but different emission (Figure 13b, dashed circles). Therefore, we measured the hybrid material HSA + ZnL (λex = 285 nm) and observed a strong emission band at 421 nm. A strong emission band at 421 nm was observed, as shown in Figure 13d.
Fluorescence resonance energy transfer (FRET) could also be shown, as indicated by the pink arrows in Figure 13d, because the emission wavelength of HSA (349 nm, circled in orange) is close to the excitation wavelength of ZnL (360 nm, circled in pink). This is because the emission wavelength of HSA (349 nm, circled in orange) is close to the excitation wavelength of ZnL (360 nm, circled in pink). This is generally one of the FRETs [68]. Furthermore, from the observation of FRET, the distance between the donor (HSA), acceptor donor (HSA), and acceptor (ZnL) is within 1.0 nm.
Furthermore, the FRET observations suggest that the distance between the donor (HSA) and acceptor (ZnL) is within 1.0 nm. The distance between the donor (HSA) and acceptor (ZnL) would be within 1.0 nm. This situation is also supported by a two-dimensional (2D) contour plot (Figure 14). In general, the structural features of HSA govern its intermolecular interactions with other molecules [66,67].
A typical image of the sample is shown in Figure 15. The cast film of HSA in black areas corresponding to the phosphoric buffer can be recognized in gray areas. Through a careful adjustment of Figure 15, spectral information about the local area of the HSA film can be obtained by carefully adjusting the square cursor in the black area.

3.4.3. FT-IR

FT-IR spectra of the cast films of HSA + ZnL and HSA before and after the irradiation of IR-FEL at 1622 cm−1 ν(C=N), 1652 cm−1 (amide I), and 1537 cm−1 (amide II) are shown in Figure 16, Figure 17 and Figure 18, respectively. As shown in Figure 16, the FT-IR spectra of (a) and (c) are HSA + ZnL, and (b) and (d) are HSA and IR-FEL irradiation at 1622 cm−1. Since the irradiation of IR-FEL at 1622 cm−1 ν(C=N) is a wavelength at which HSA does not absorb much, there was no significant difference in the spectral change between HSA and ZnL.
The FT-IR spectra of ZnL embedded in KBr were also confirmed, and the spectra showed no change before and after IR-FEL irradiation for 30 min at a wavelength of ν(C=N) (1622 cm−1), indicating that ZnL was not dissociated by IR-FEL at the output employed in this experiment [69]. As shown in Figure 17, FT-IR spectra after IR-FEL irradiation at 1652 cm−1 (amide I) for 0–30 min for (a) HSA + ZnL and (b) HSA and after IR-FEL irradiation at 1537 cm−1 (amide II) for 0–30 min for (c) HSA + ZnL and (d) HSA. The spectral change is clearly larger for HSA + ZnL complexes than for HSA alone. This indicates that HSA became structurally unstable due to docking with ZnL.
In Figure 18, the IR spectra changes (solid lines) are shown for (a) HSA + ZnL and (b) HSA after 0–30 min of IR-FEL irradiation at 1652 cm−1 (amide I) and for (c) HSA + ZnL (d) HSA after 0–30 min of IR-FEL irradiation at 1537 cm−1 (amide II). The dashed line is the approximate straight line of the IR spectral change.
The results of the protein secondary structure analysis are shown by fitting the IR spectra. The IR-FEL irradiation of the amide I and amide II bands of HSA + ZnL resulted in a greater change in α-helix content than HSA alone; vibrational excitation via IR-FEL irradiation resulted in a greater change in the secondary structure of the HSA + ZnL complex than HSA alone. The introduction of the Zn(II) complex and irradiation with IR-FEL caused a conformational change in the secondary structure of the larger protein than when HSA was irradiated with IR-FEL before the introduction of the Zn(II) complex.

3.5. Docking Simulation of Lysozyme and Zinc Complexes for IR-FEL Irradiation

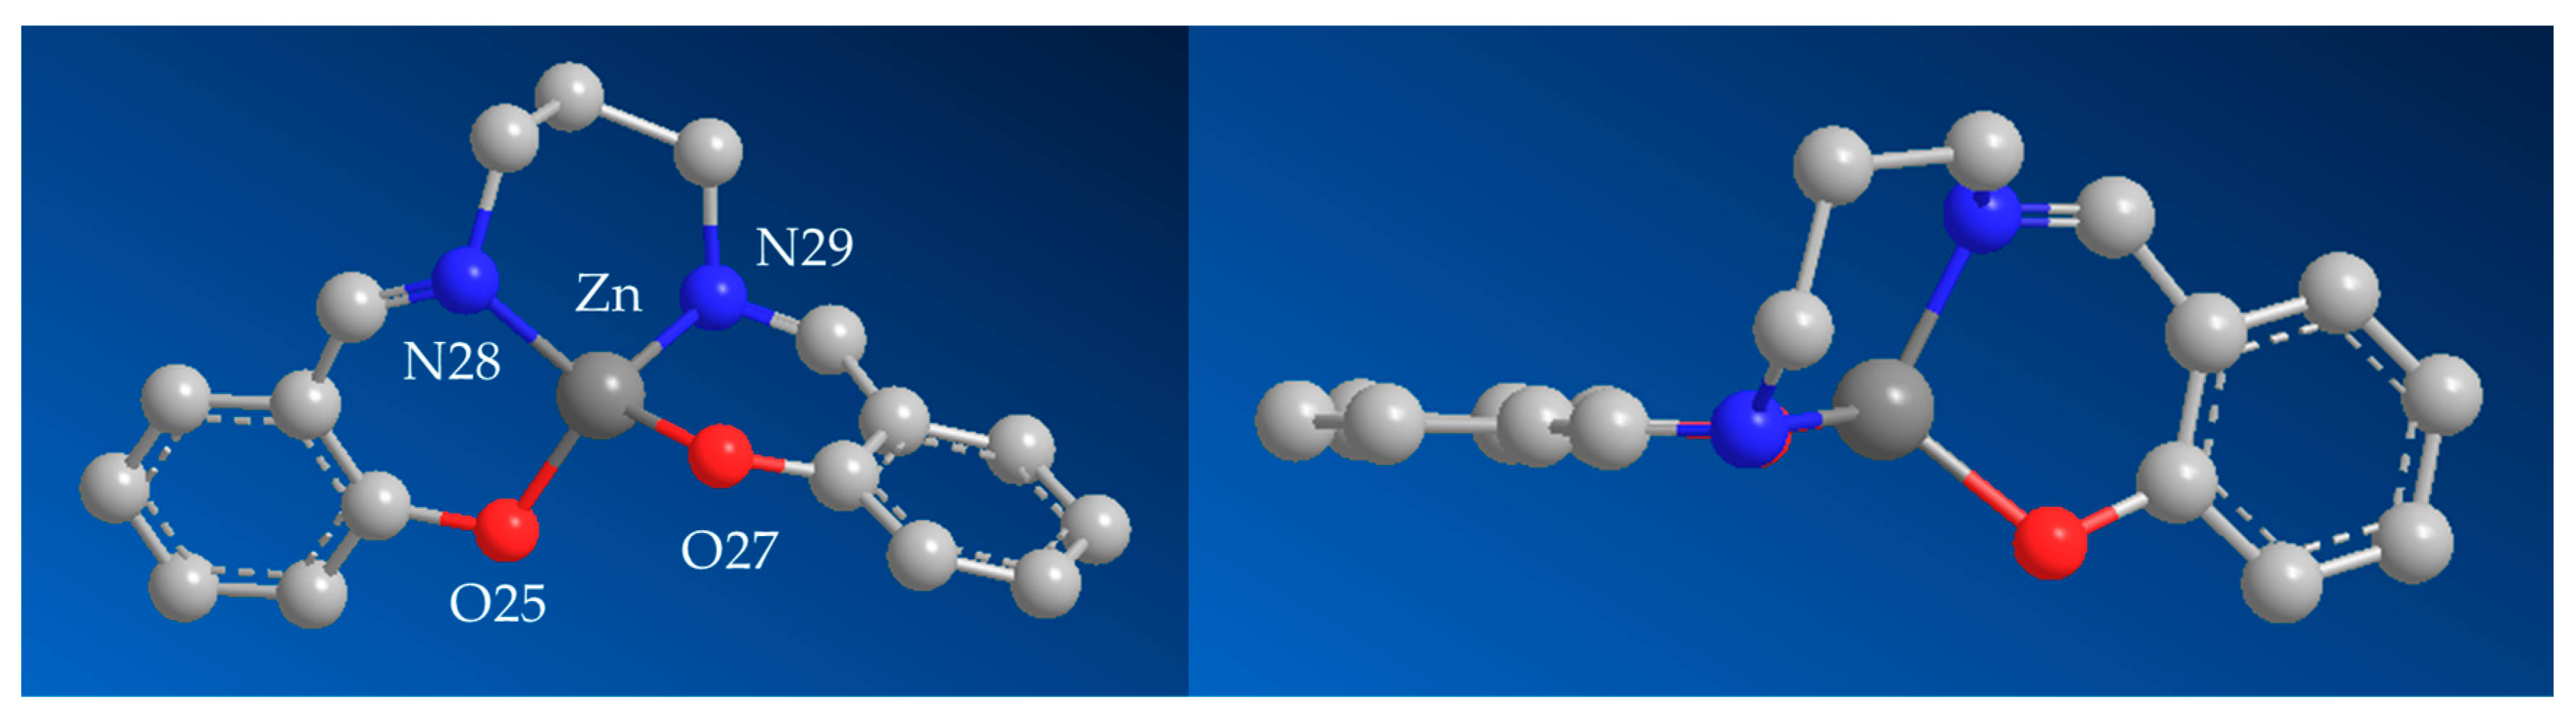
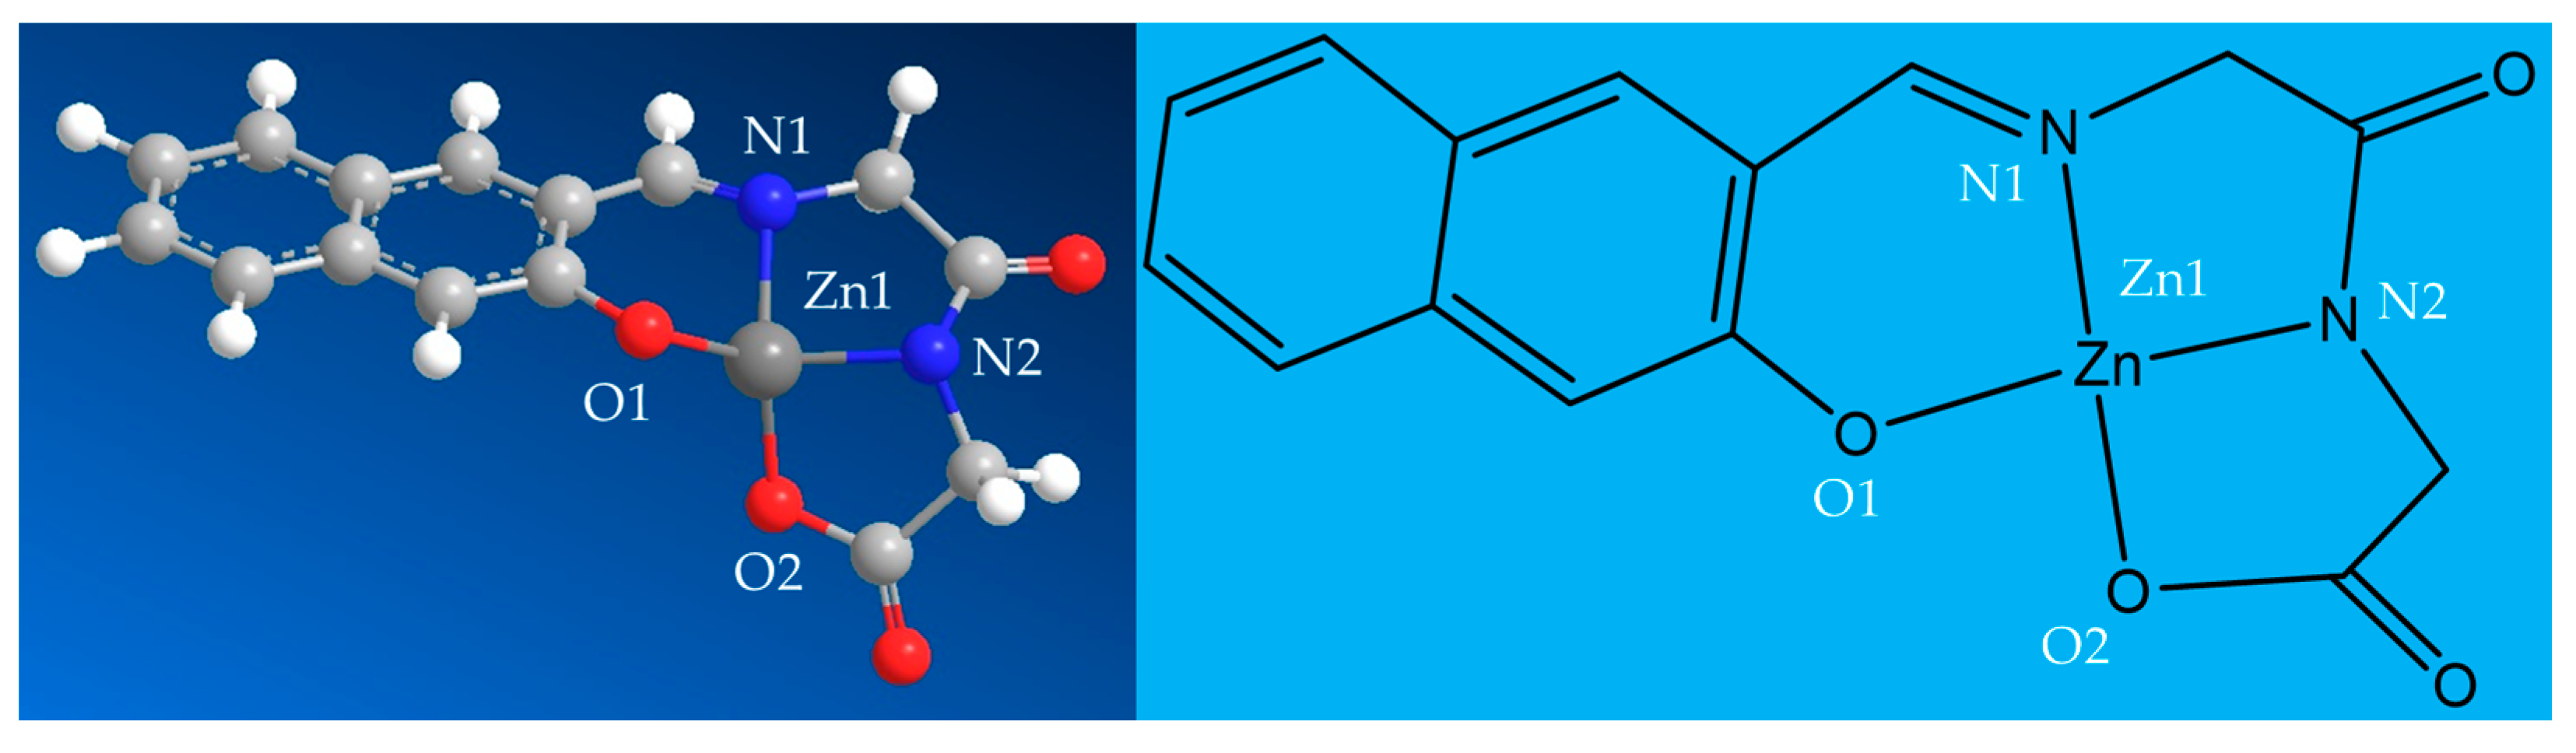
3.5.1. Preparation of Metal Complexes

The protein to be complexed was HSA, which is close in the sense that it is present in the human body. However, HSA is a large protein with a molecular weight of 66,000, making it too large a donor to complex with a zinc complex with a molecular weight of about 300. Therefore, we selected lysozyme, which is easily available in the market and has a molecular weight of 13,000 as one of the smaller proteins, because we thought it would be easier to observe the docking state [70,71]. We observed whether the secondary structure of the protein changed when irradiated with IR-FEL, as was the case with HSA. For the simulation of docking with lysozyme, two types of zinc complexes coordinated by a dipeptide with an aromatic hydroxyl group were envisioned. In addition, to date, complexes complexed with HSA have been synthesized with amino acid monomers. This time, dipeptides were used to enhance the affinity with proteins. First, the complex was named ZnGlyGlyH, assuming the structure shown in Figure 19 and the geometrical parameters at center metal Zn shown in Table 3.
Next, the complex was named ZnGlyGlyPh, assuming the structure shown in Figure 20 and the geometrical parameters at center metal Zn shown in Table 4.

3.5.2. Experimental Procedure

For the docking state of the Lyz and zinc complex, the docking position with Lyz was determined using the docking simulation software GOLD. The zinc complex was prepared in a MeOH solution to 0.5 mM; Lyz was also prepared in a phosphate-buffered solution to 0.5 mM; the zinc complex was prepared in a MeOH solution to 0.5 mM. The mixed solution was prepared by mixing them in a 1:1 ratio, and fluorescence quenching measurements were performed. Bimolecular quenching rate constants were calculated from the fluorescence intensity of the solutions at different temperatures, and the quenching mechanism was investigated. Furthermore, information on the number of luminescent species in the complex was obtained by measuring the fluorescence lifetime. Finally, Lyz single crystals were prepared and immersed in a saturated solution of zinc complexes to obtain Lyz single crystals containing zinc complexes colored by the complexes. Using the GOLD results as a reference, single crystal electron density analysis was performed to elucidate the binding mode of the zinc complex.

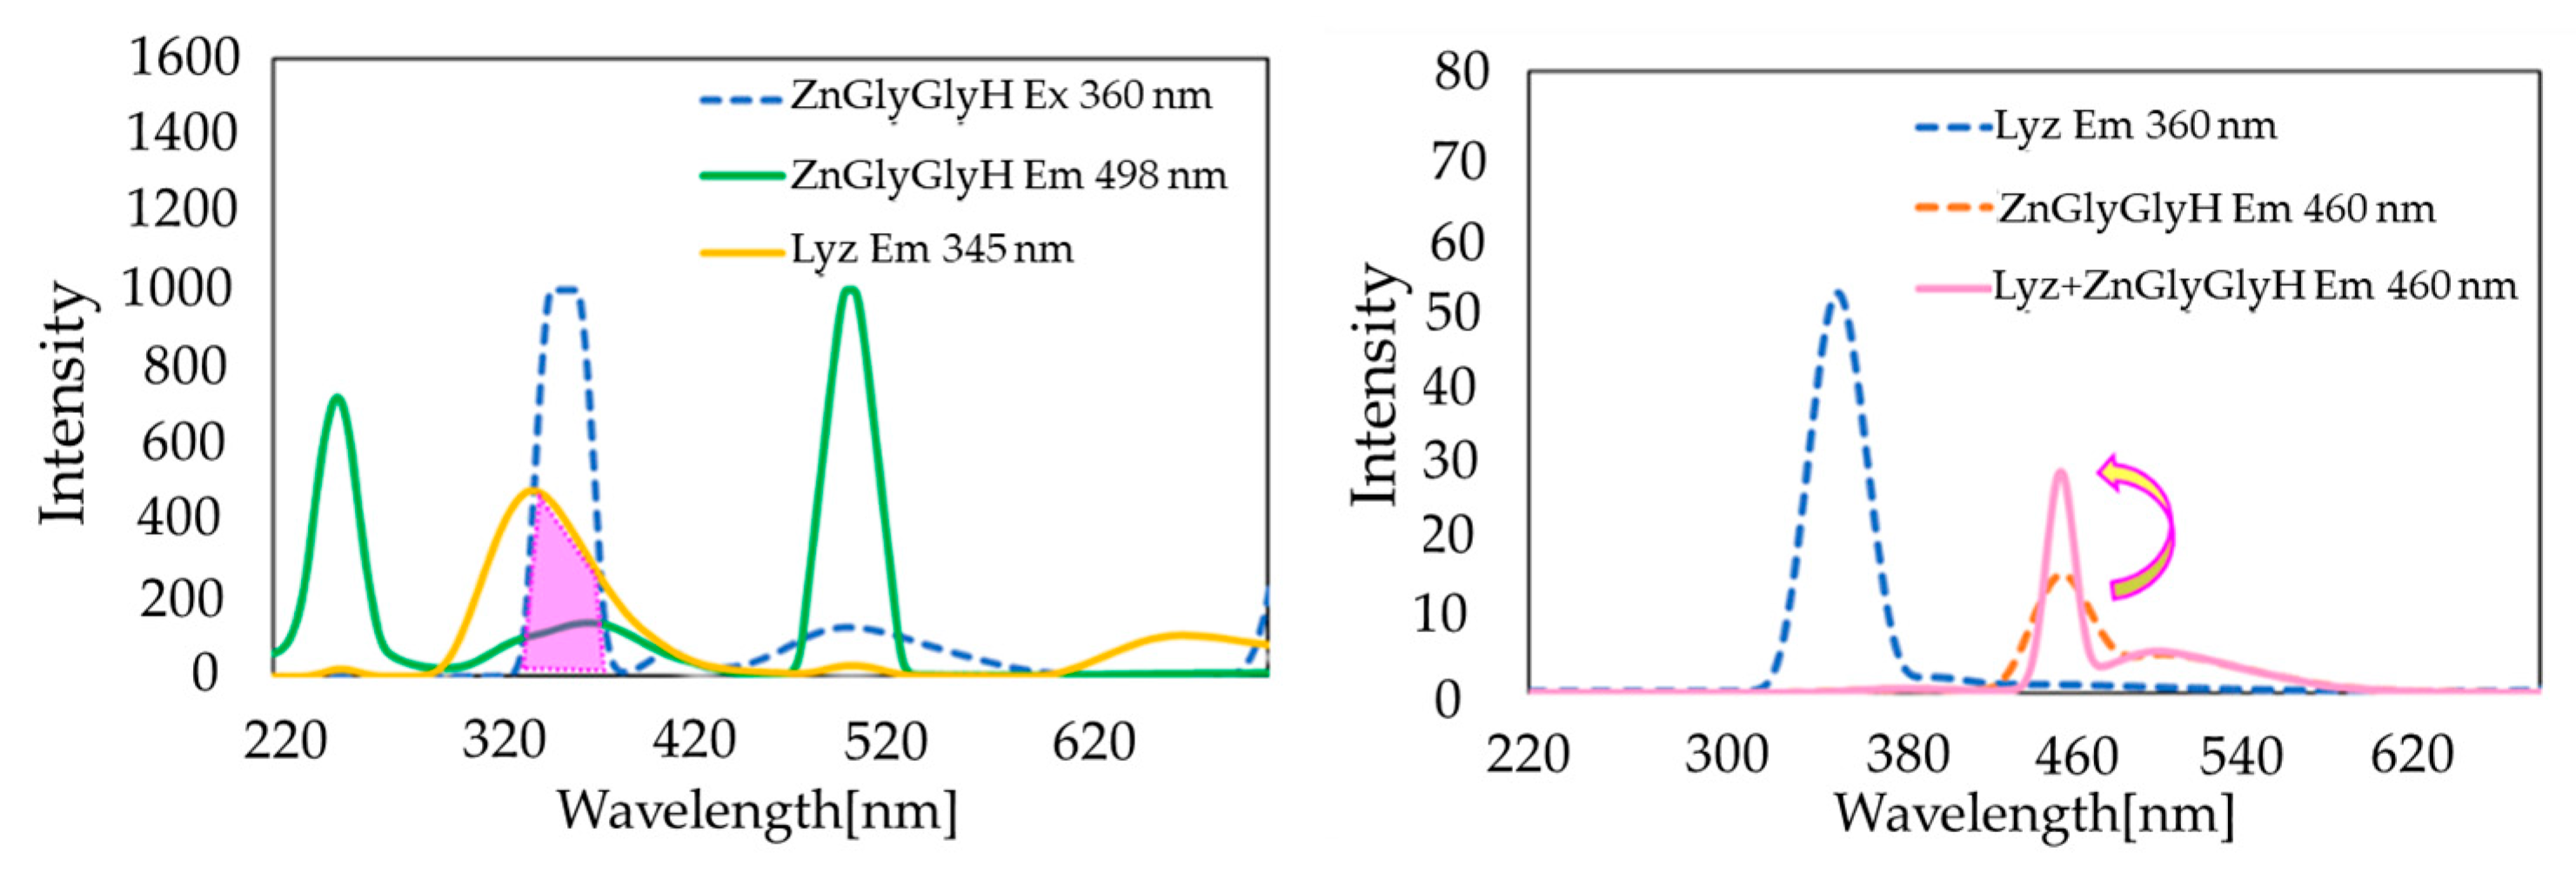
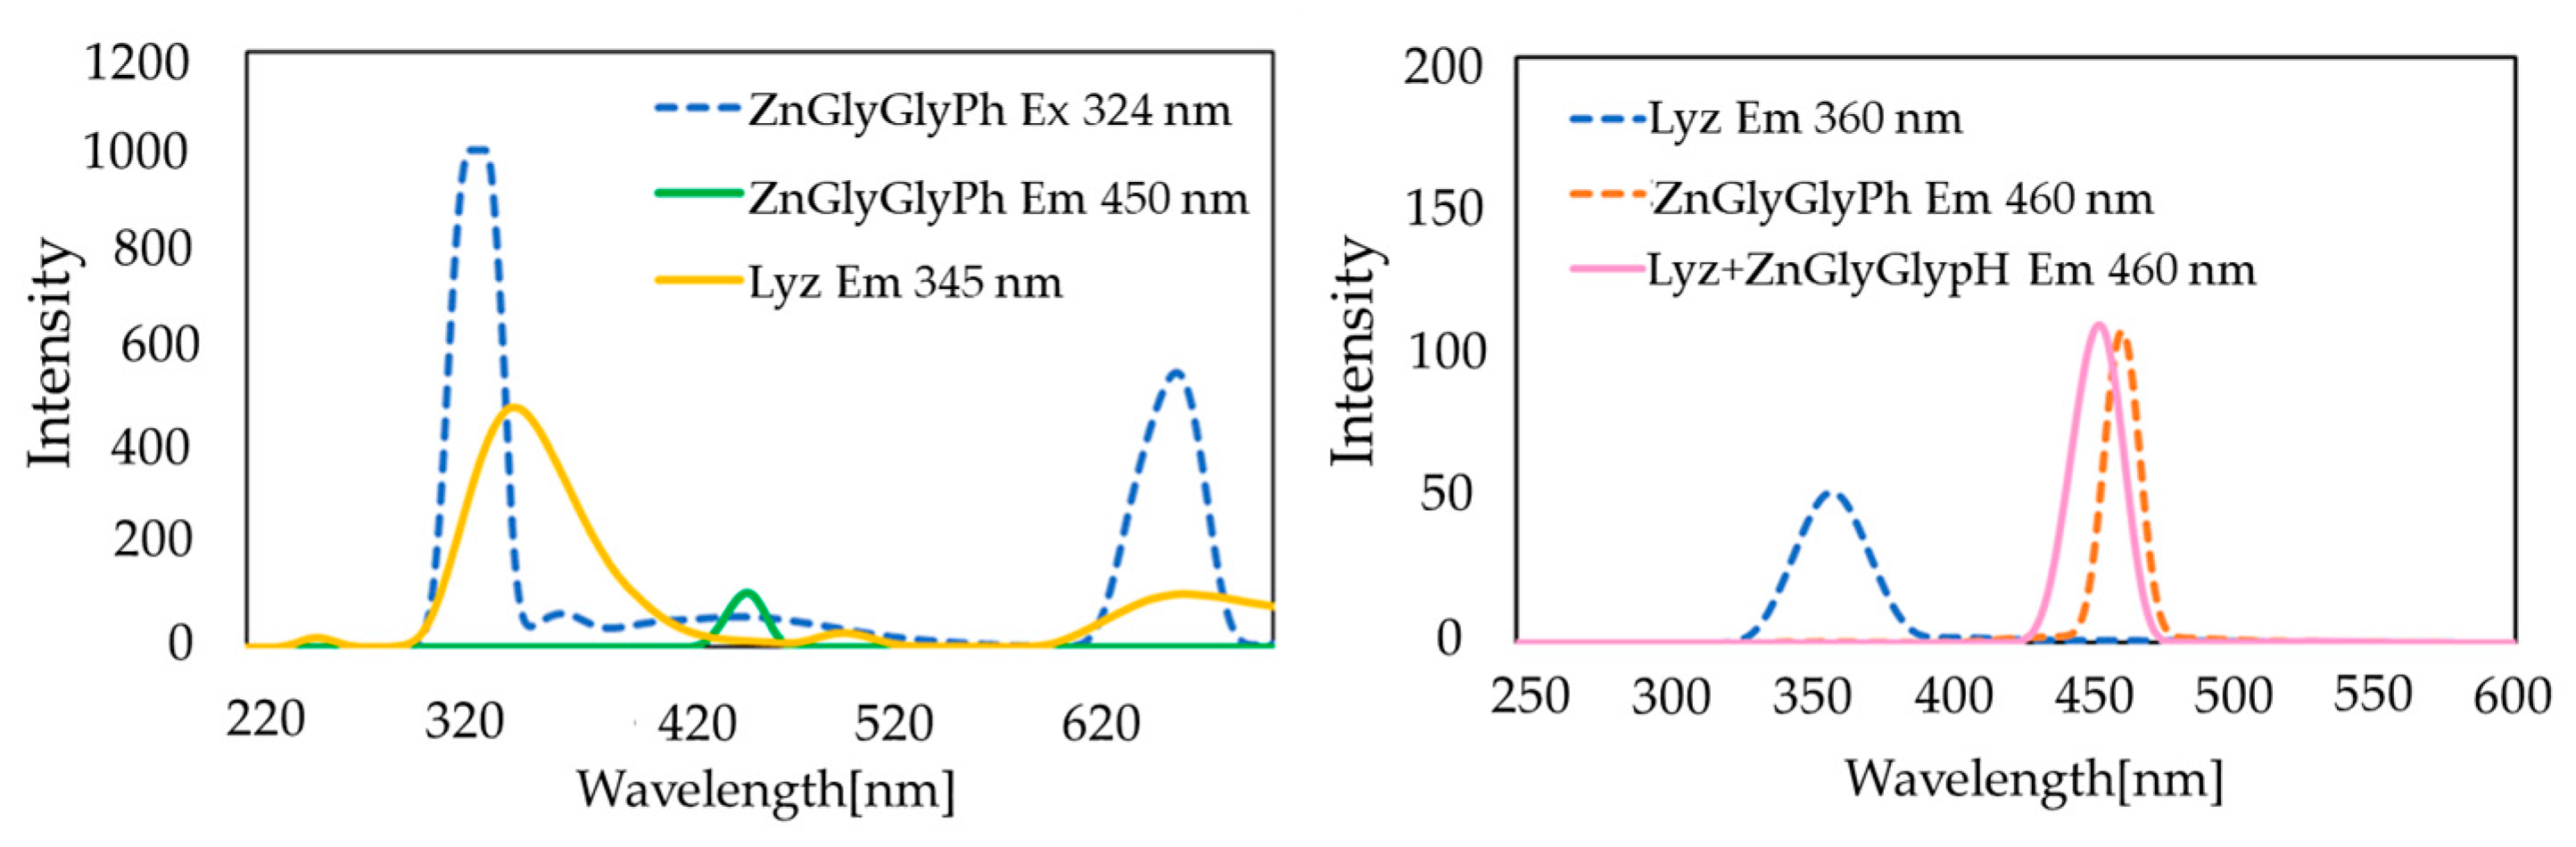
3.5.3. FRET of ZnGlyGlyH and ZnGlyGlyPh

In this study, the emission wavelength of the donor lysozyme was identified as 345 nm, and the excitation wavelength of the acceptor zinc complex was 360 nm. Based on this, fluorescence measurements showed that the fluorescence intensity at 460 nm and the emission wavelength of ZnGlyGlyH were approximately doubled, while no change was observed for ZnGlyGlyPh.
Overlapping graphs with FRET were observed for both complexes, as shown in Figure 21 for Lyz-ZnGlyGlyH and Figure 22 for Lyz-ZnGlyGlyPh. Lyz-ZnGlyGlyH showed a doubling of the fluorescence intensity detected at 460 nm, indicating that FRET had occurred, and dynamic quenching was confirmed. On the other hand, Lyz-ZnGlyGlyPh showed no change in fluorescence intensity at 460 nm. This confirmed that FRET did not occur and that the quenching was static.

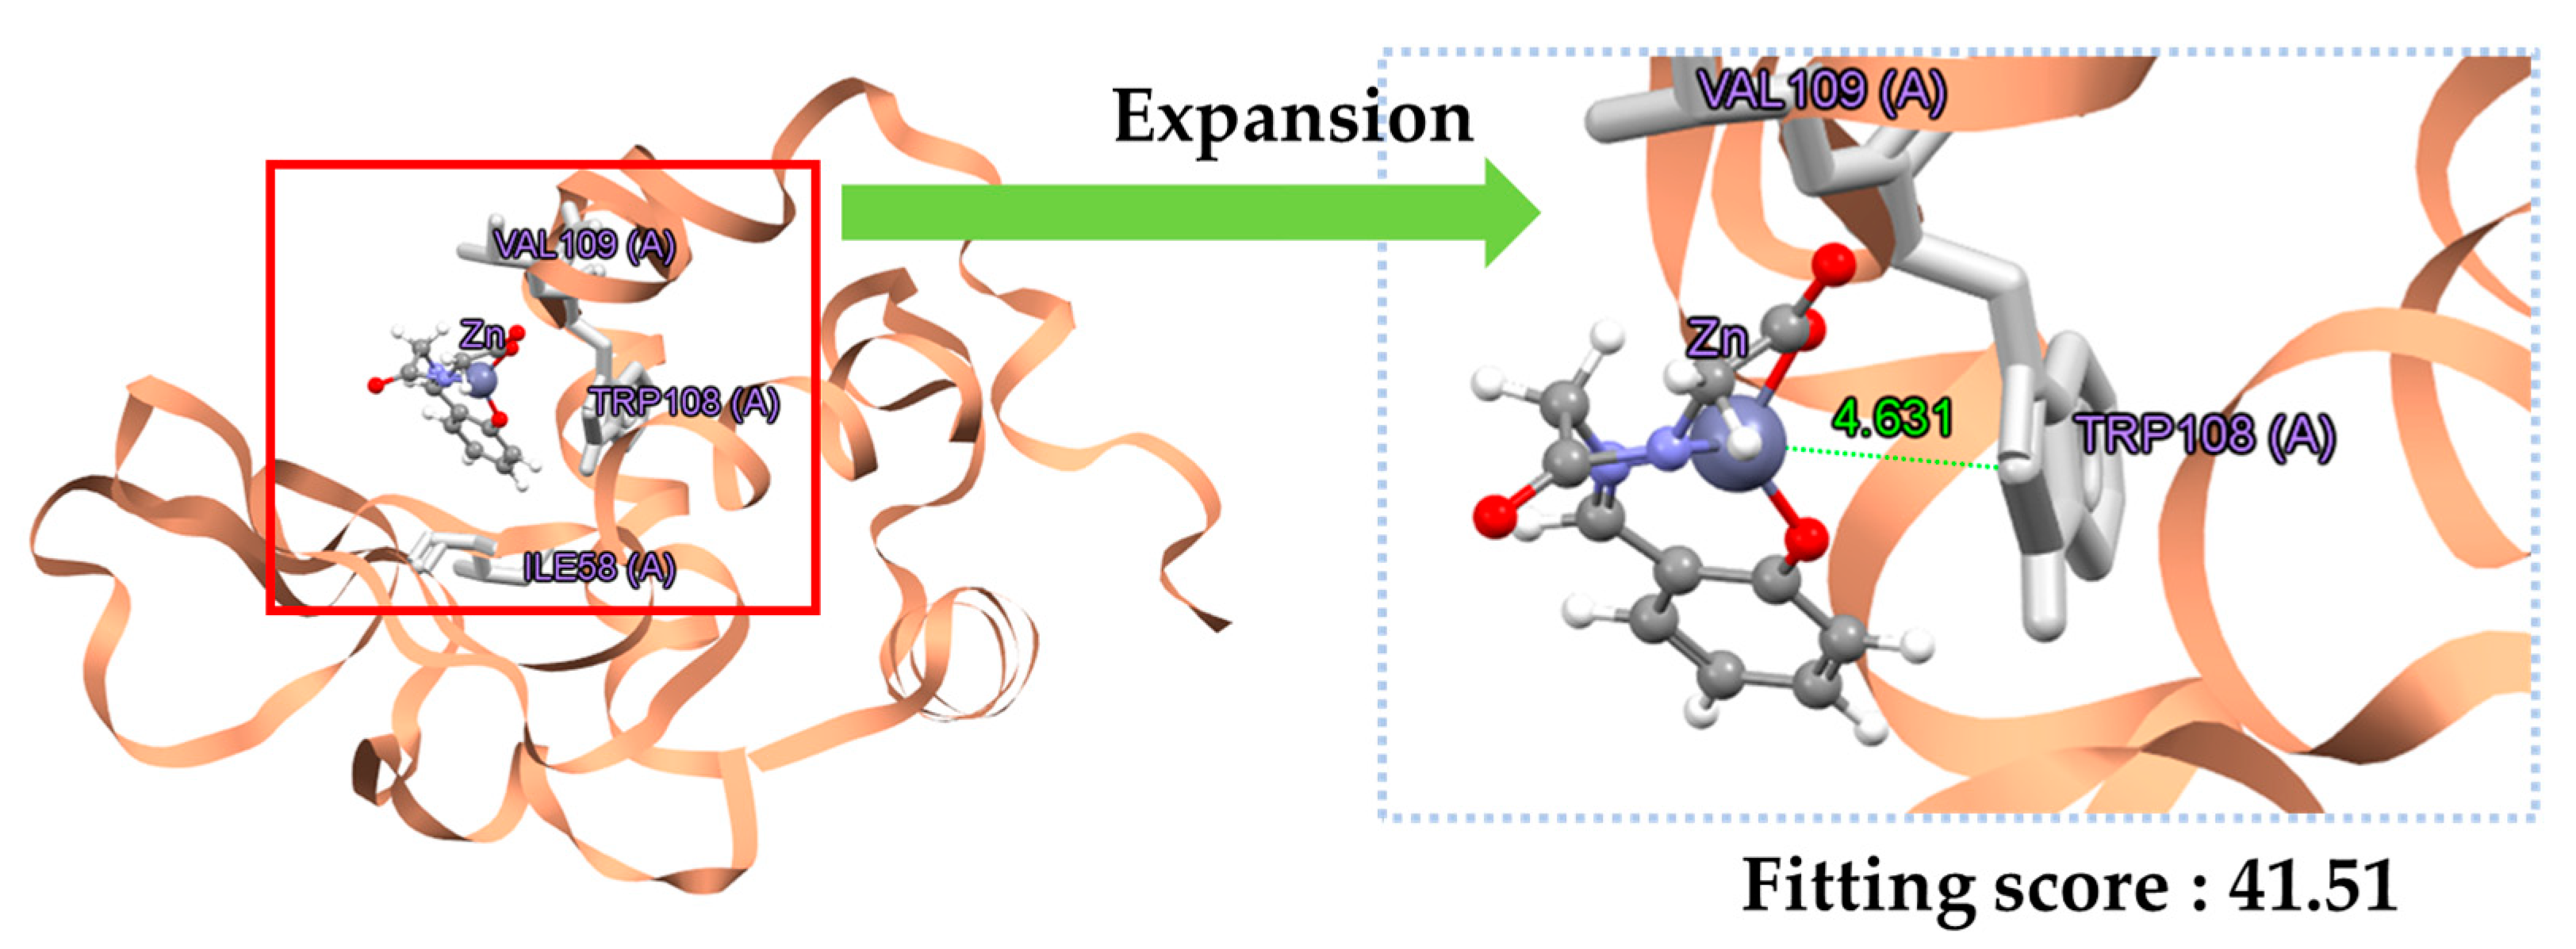
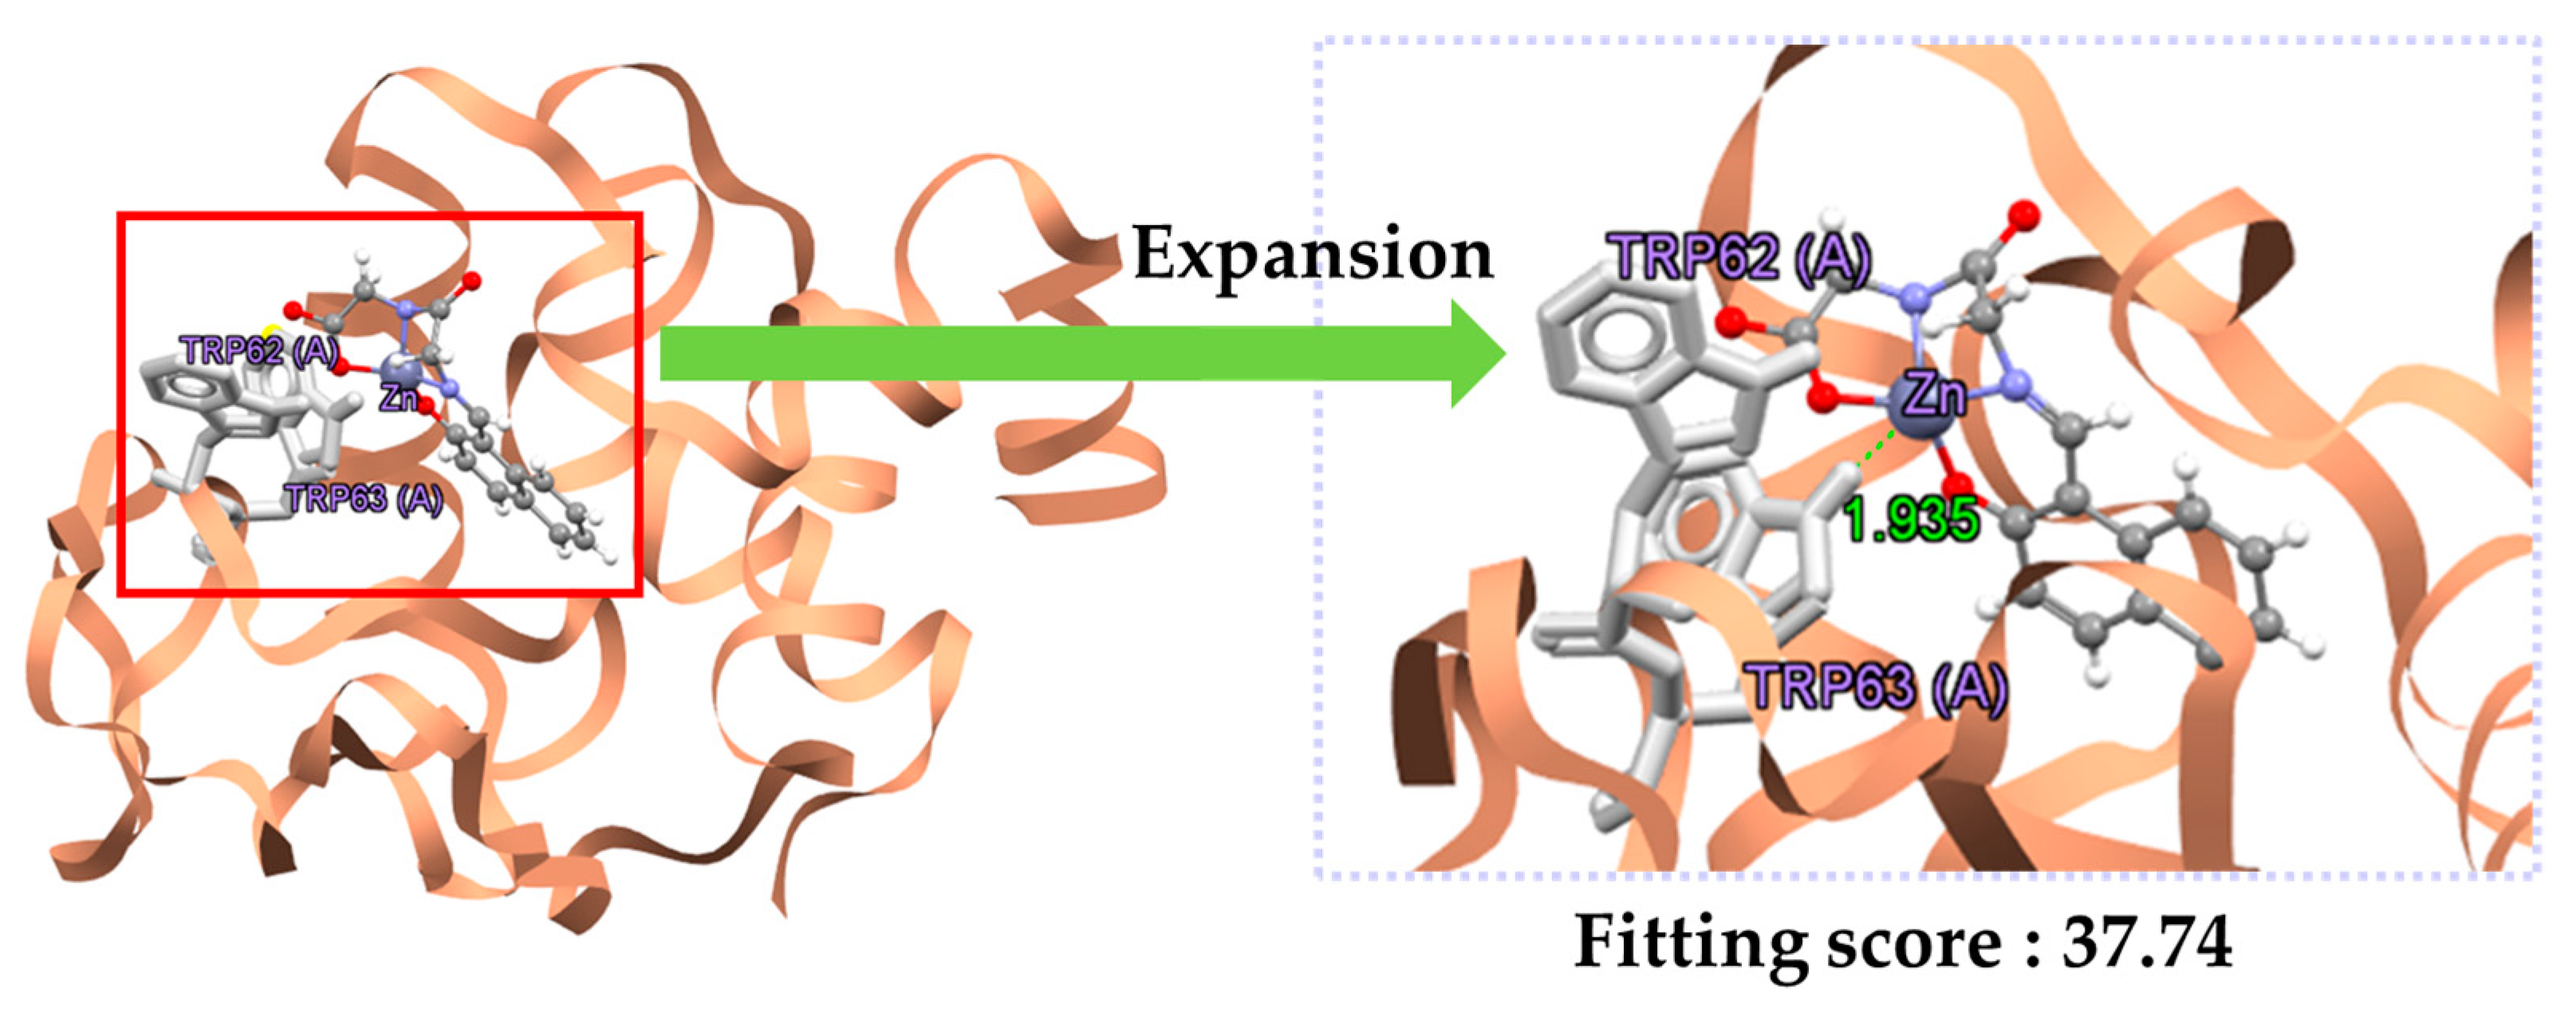
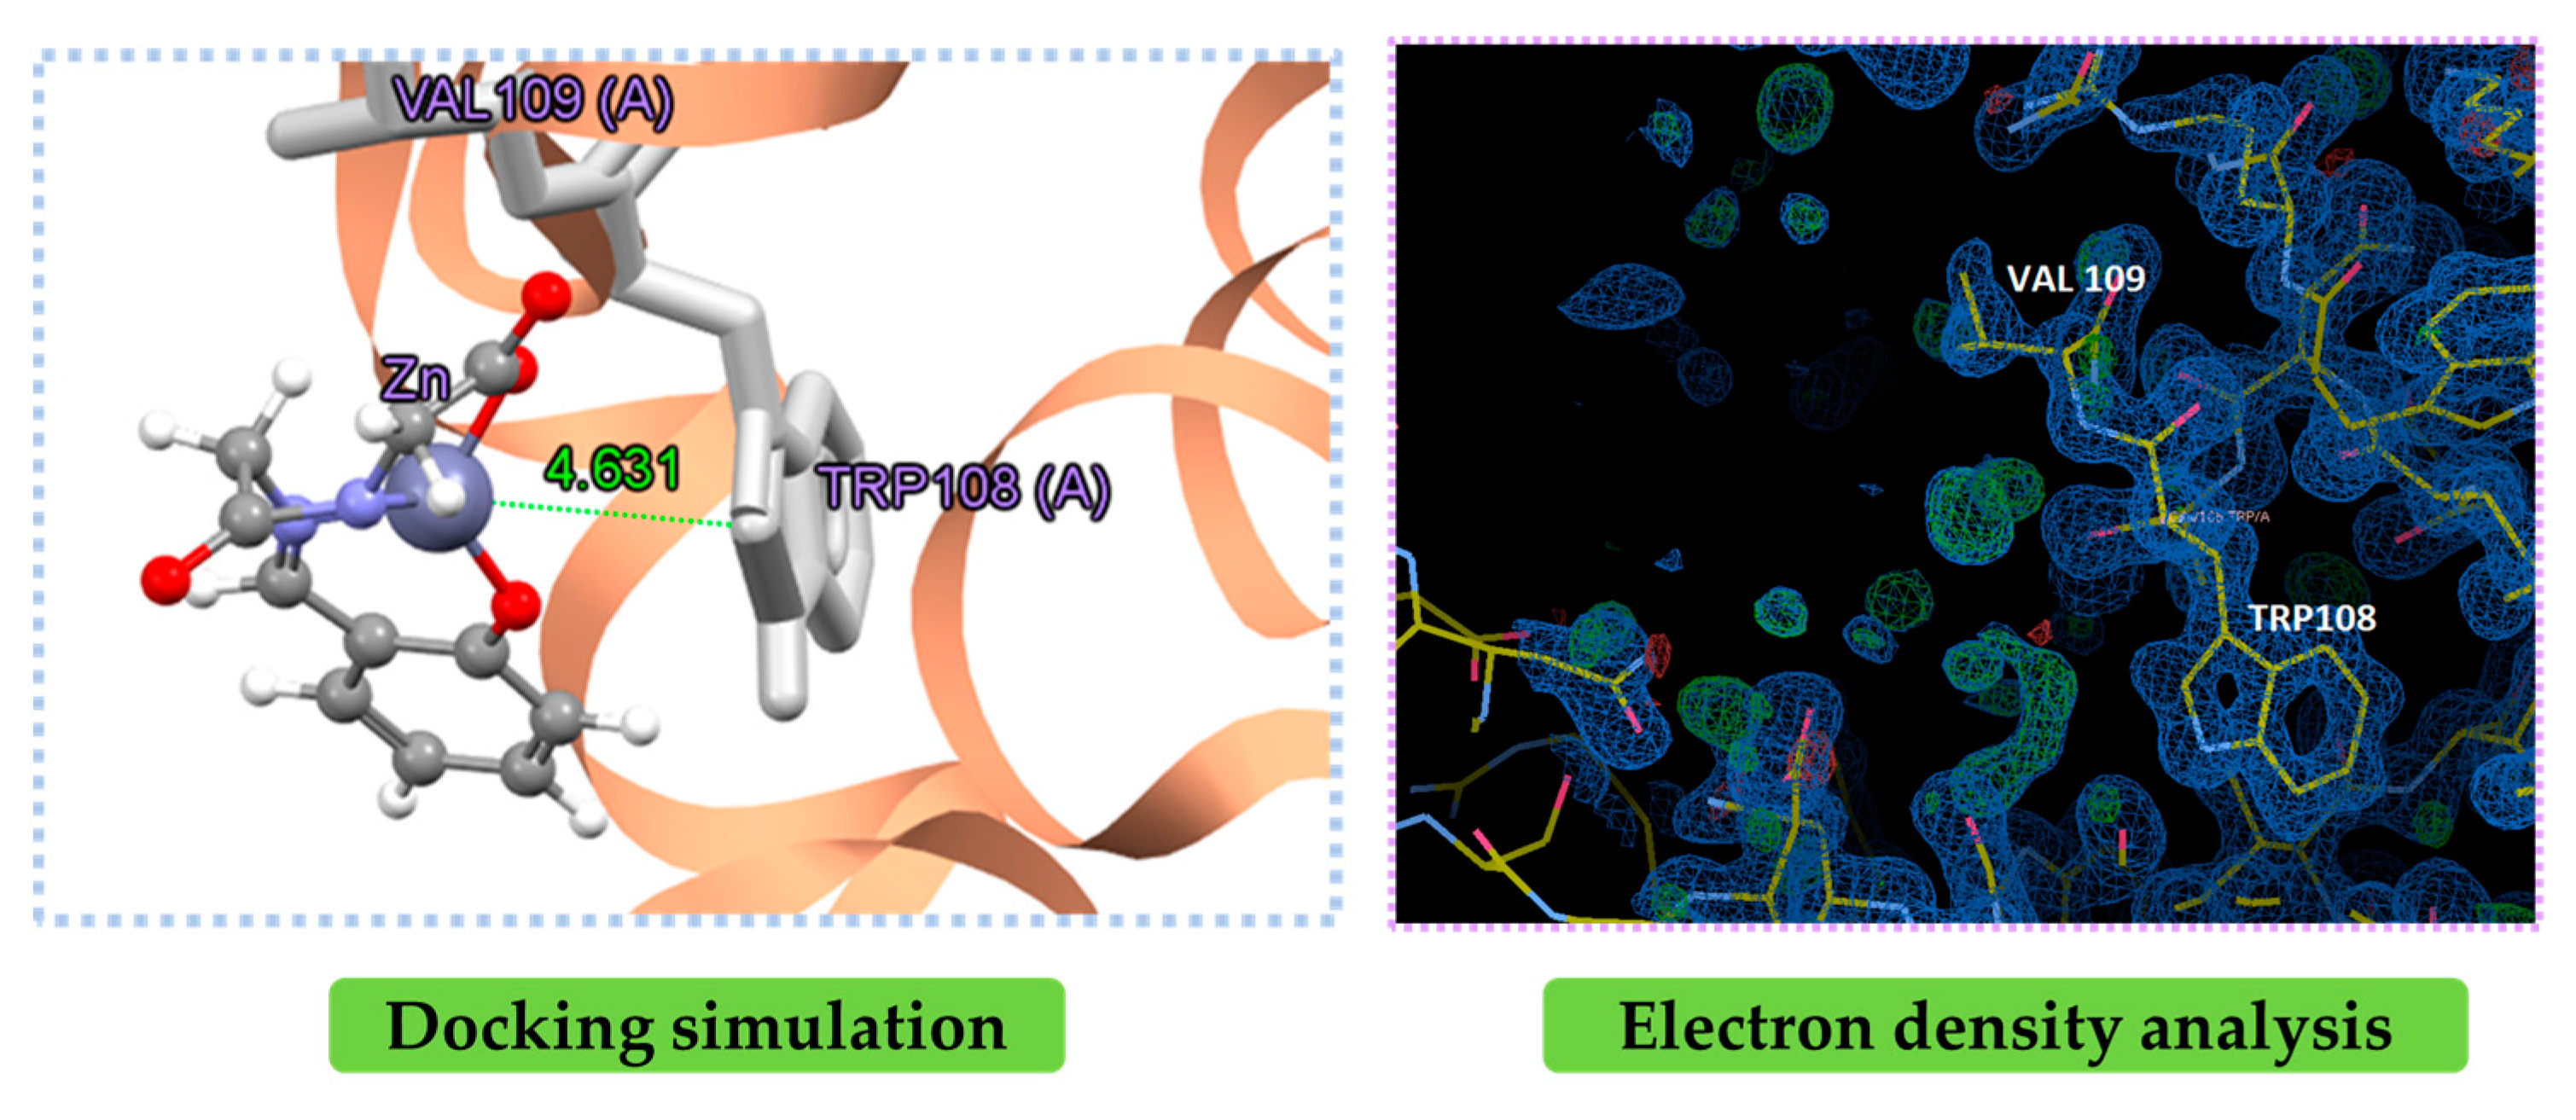
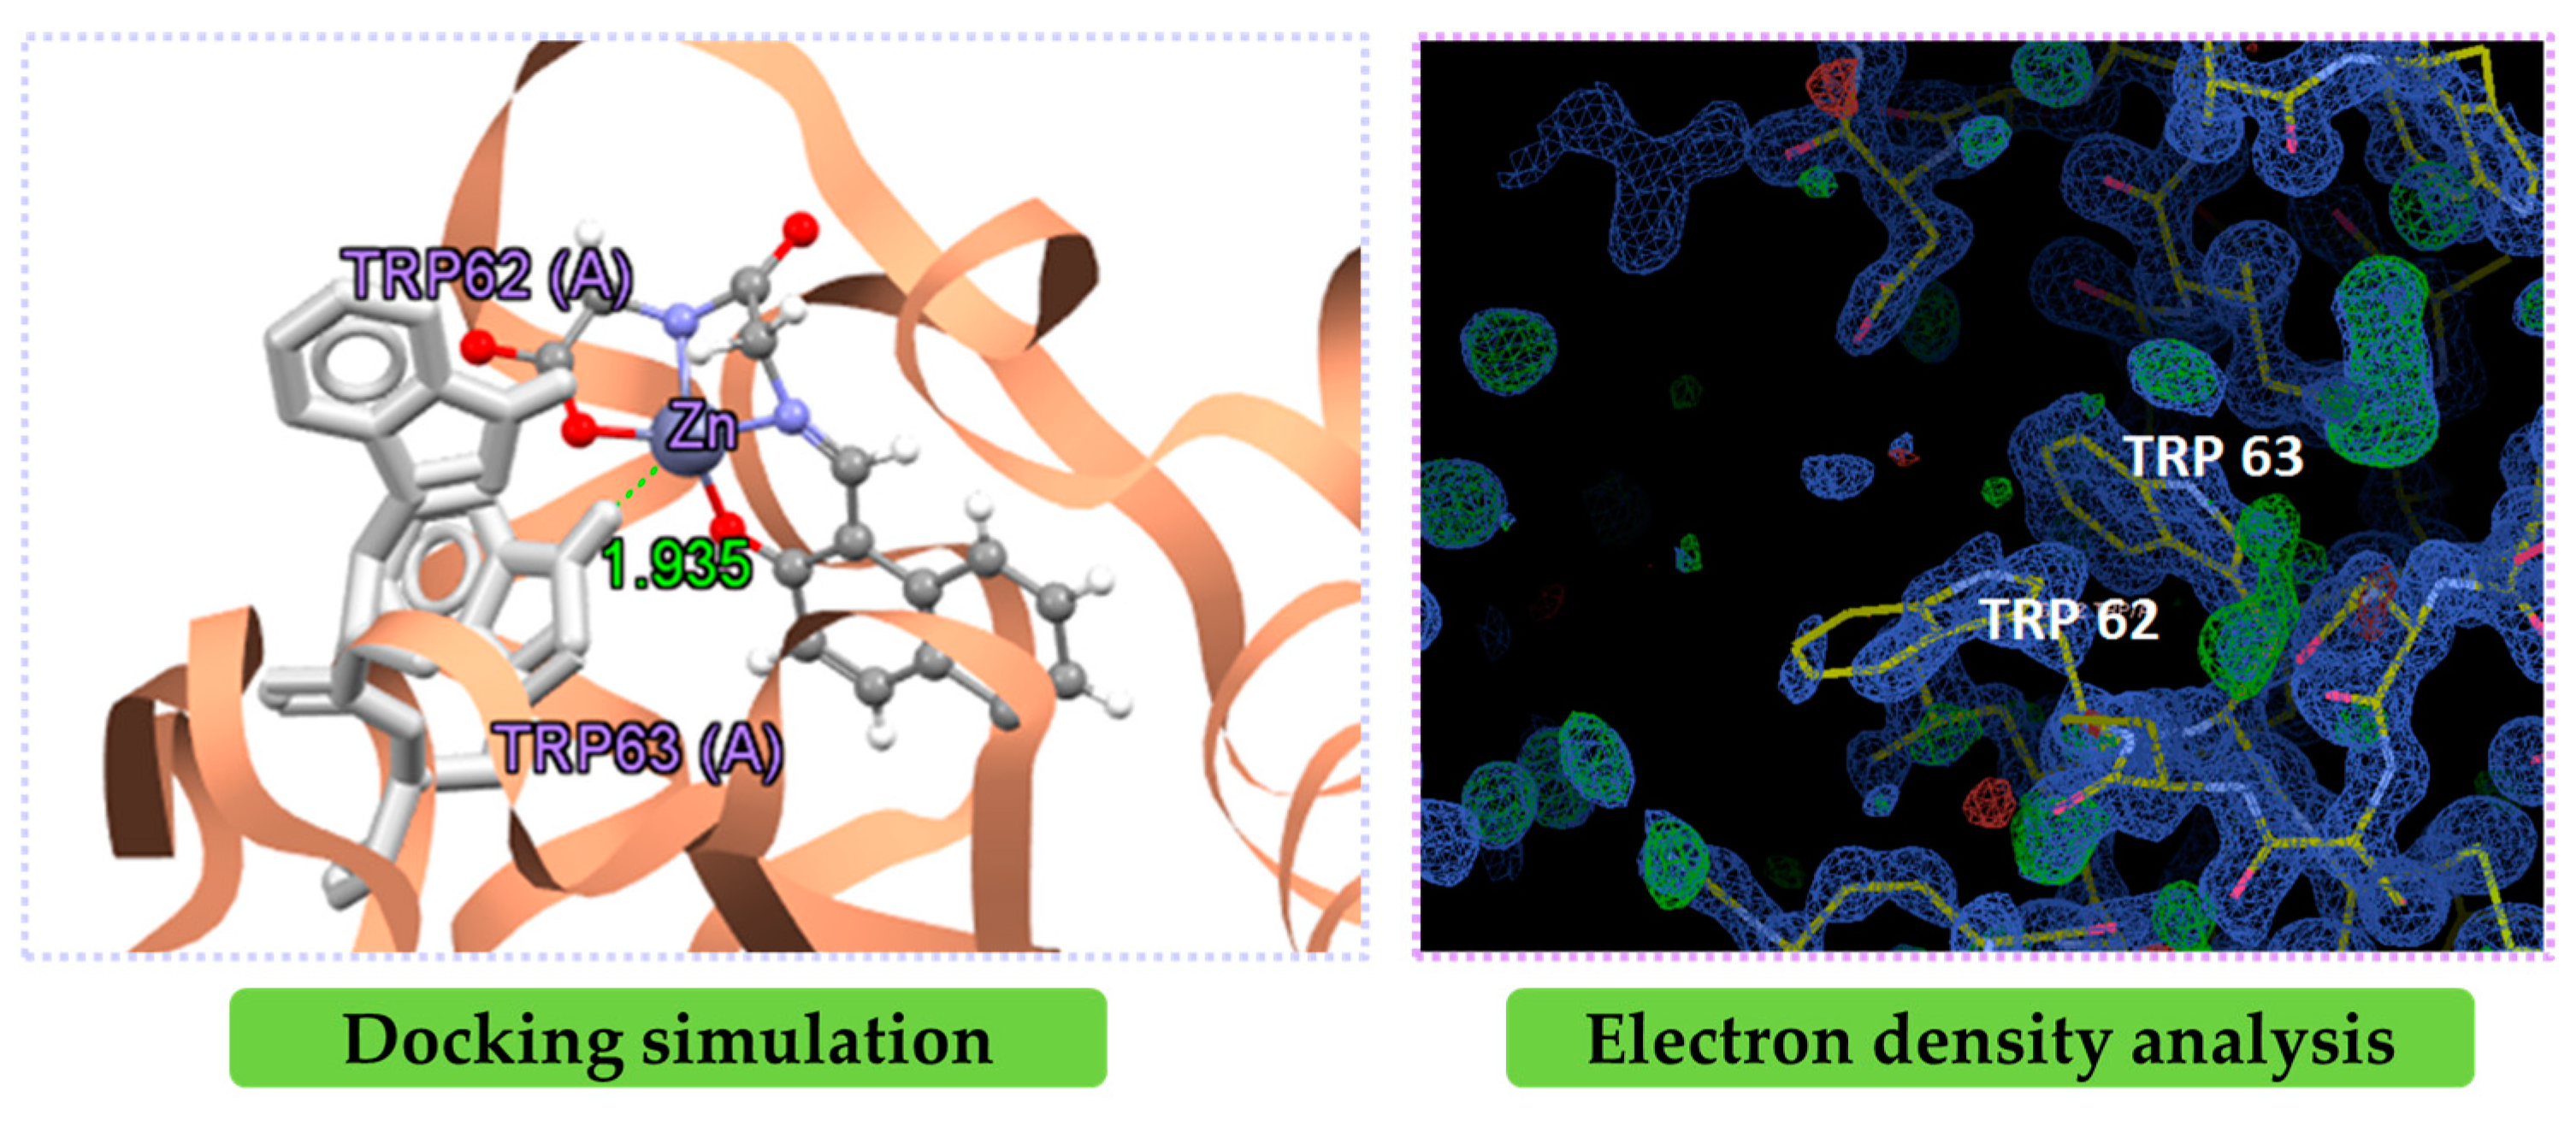
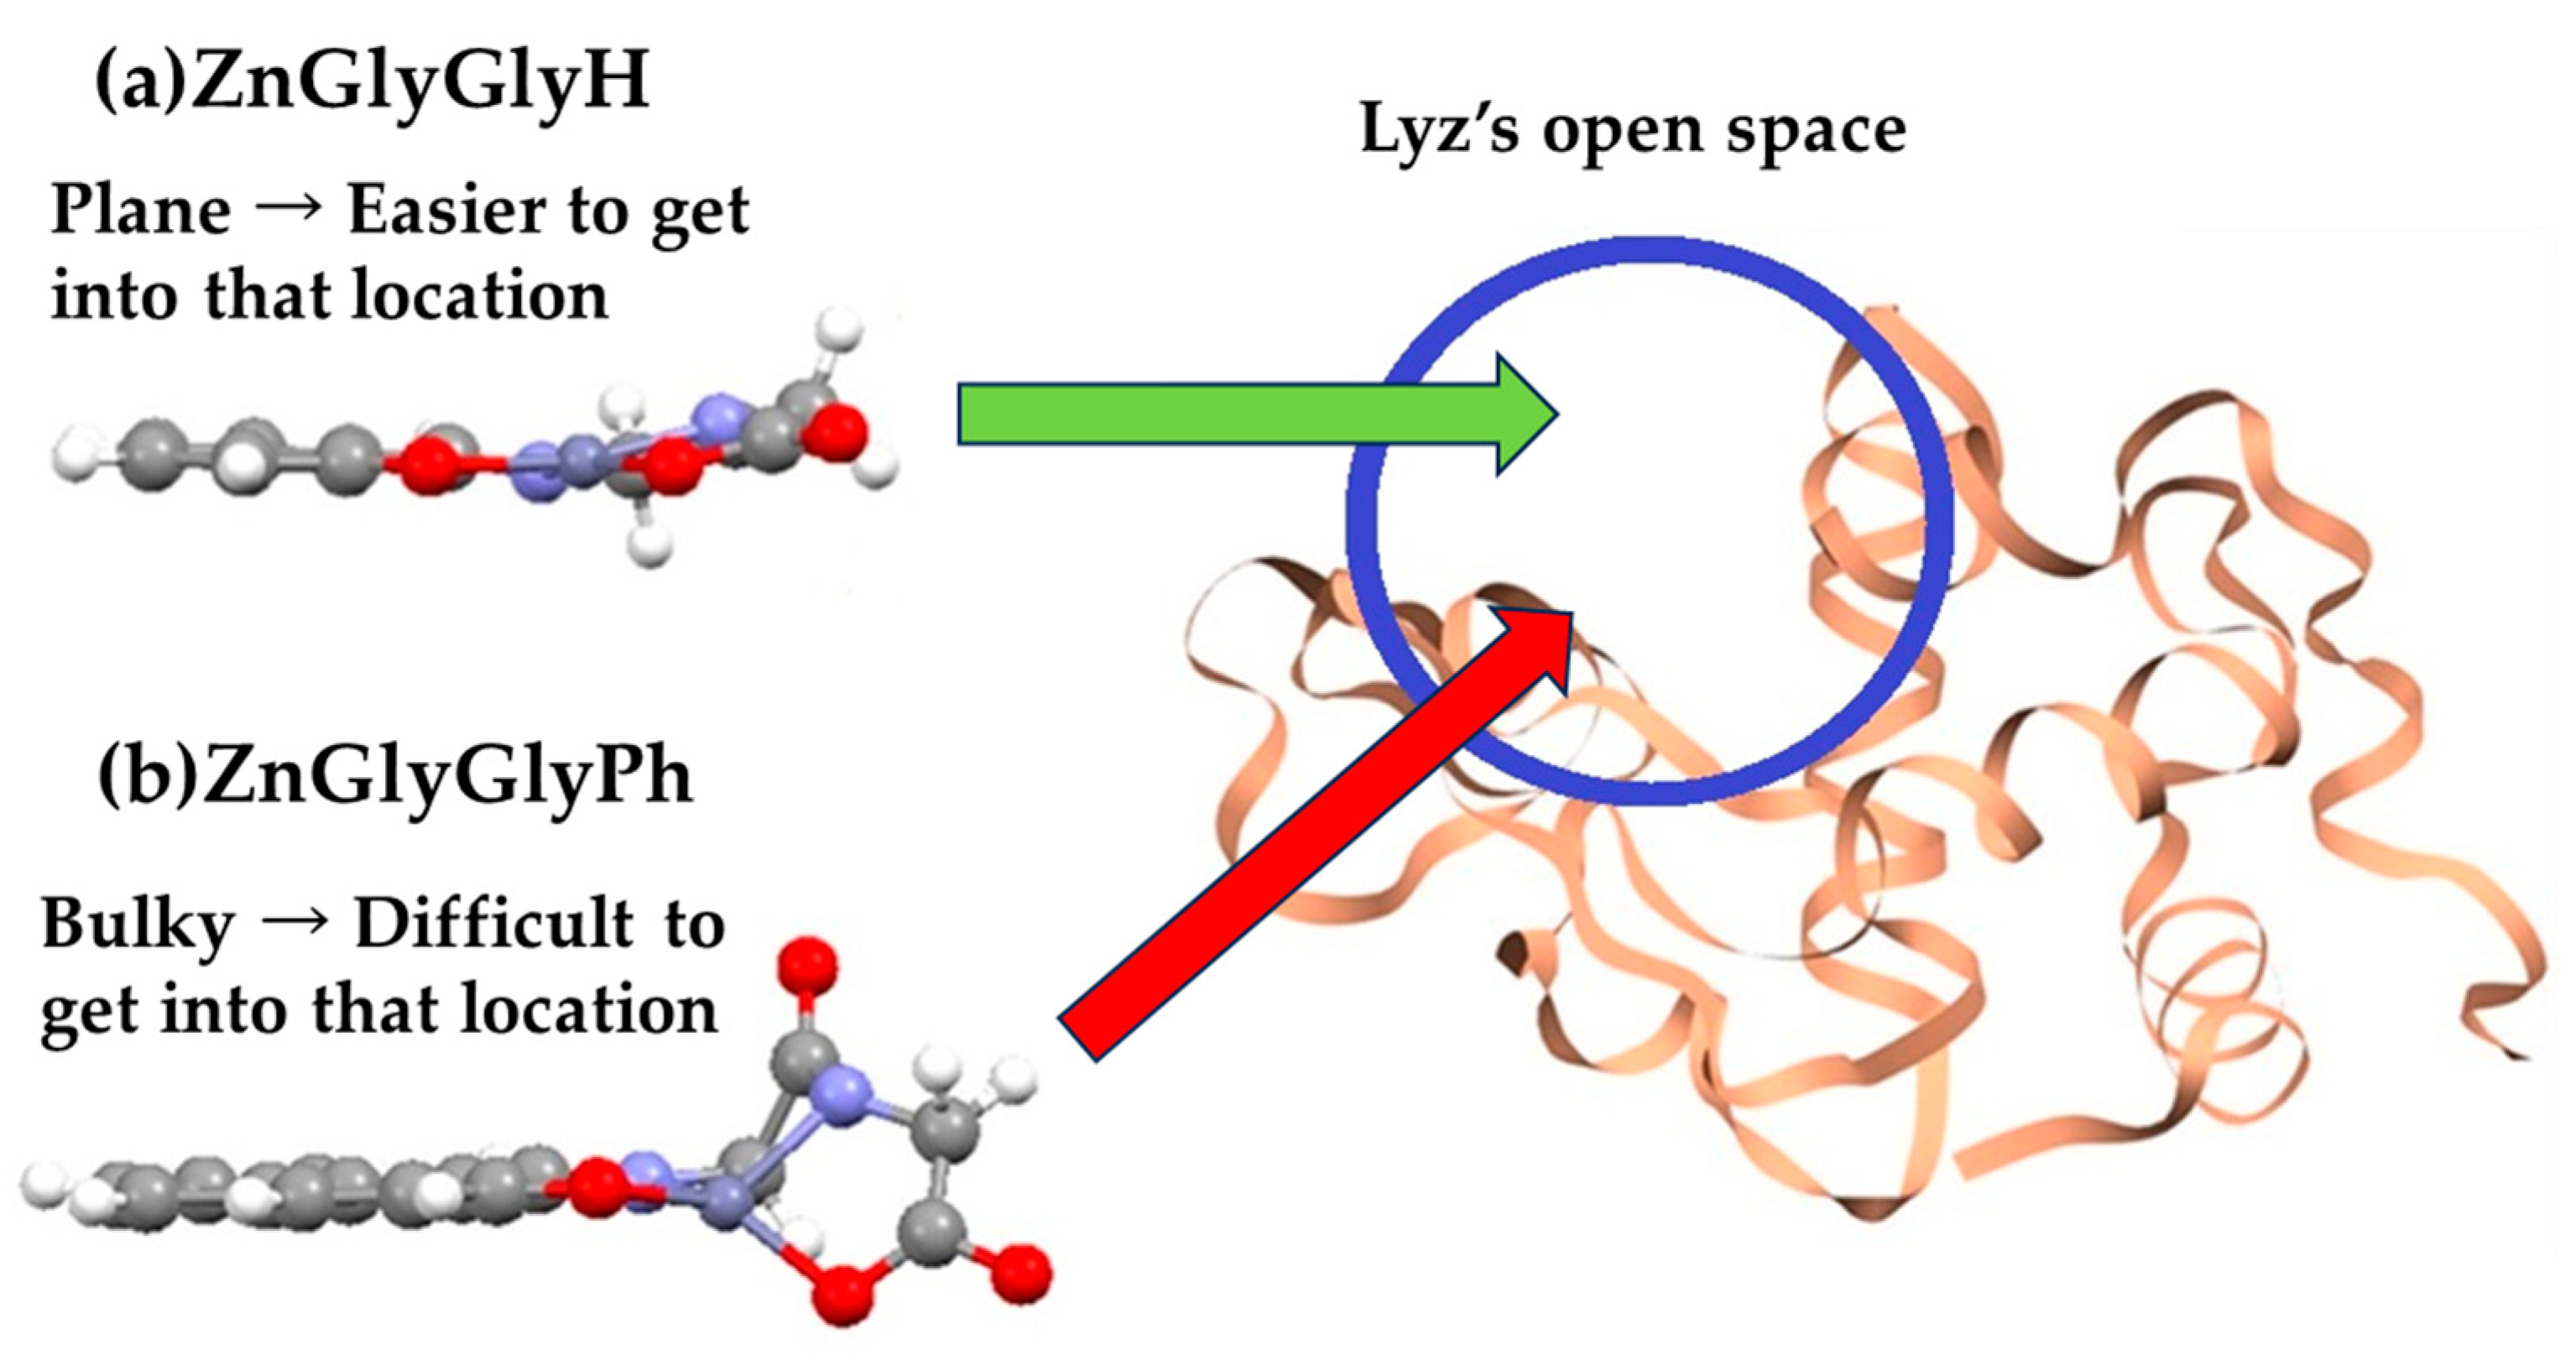
3.5.4. Docking Simulation

To perform the docking simulations of zinc complexes and protein, researchers used GOLD, a docking simulation software distributed by the Cambridge Crystallographic Data Center (CCDC) [72,73]. GOLD is a protein–ligand docking simulation software, a program that calculates how small molecules dock into protein binding sites based on genetic algorithms [74,75].
GOLD is a docking simulation, mainly used in the field of drug discovery, using an energy function that incorporates experimental information on the structure of hydrogen bonds from IsoStar, a database of non-bonding effects based on experimental values and using torsion angle distribution data from the Cambridge Crystal Structure Database. The Cambridge Crystal Structure Database is the world’s largest molecular crystal structure database for organic and organometallic compounds analyzed using X-ray or neutron diffraction.
The GOLD docking simulation of lysozyme and zinc complexes is shown in Figure 23 and Figure 24, with simulations suggesting that they are bound in a binding pocket formed by two amino acid residues.
ZnGlyGlyH was in the empty space of Lyz; Trp108 was at a minimum distance from 4.631 Å. The fitting score for the docking simulation was 41.51 for Lyz-ZnGlyGlyH.
ZnGlyGlyPh was present in the empty space of Lyz, and Trp62 and Trp63 were present at the shortest distance, at distances of 4.966 Å and 1.935 Å. The fitting score for the docking simulation was 37.74 for Lyz-ZnGlyGlyPh, showing similar results to Lyz-ZnGlyGlyH.
Single-crystal electron density analysis was tentatively performed for both Lyz-ZnGlyGlyH and Lyz-ZnGlyGlyPh from the GOLD docking simulation results, as shown in Figure 25 and Figure 26.
Single-crystal electron density analysis did not confirm the presence of either ZnGlyGlyH or ZnGlyGlyPh at the locations calculated in the docking simulations. After docking simulation, it was found that both ZnGlyGlyH and ZnGlyGlyPh were isomerized, and the position of the protons could not be determined, which may be the reason.
As a result of the docking simulation, it is known that it is likely to be present in the gap of Lyz based on the planar structure of ZnGlyGlyH and the distorted, bulky structure of ZnGlyGlyPh.
This difference could be attributed to the difficulty of getting into the lysozyme gap, as shown in Figure 27. Entering the gap, planar structures such as ZnGlyGlyH were less damaging, could penetrate deeper, and had stronger interactions with Lyz. On the other hand, ZnGlyGlyPh has a bulky structure, which weakened its interaction with Lyz and was a major obstacle to penetration, which, the authors concluded, led to this difference.

3.5.5. Importance of Proper Characterization of Samples Required during Experimental Confirmation of Docking Simulations

It is important when synthesizing the complexes of zinc complexes and lysozyme, as indicated by docking simulations, to investigate the secondary structural changes of the protein upon IR-FEL irradiation. It is to properly characterize the sample, including its purity. For example, if the purity is high, the reaction due to manipulation of the material will be more pronounced or barely noticeable, whereas if the purity is low due to high levels of impurities, it will be necessary to verify using further methods whether the reaction is due to impurities or is expected [76]. If impurities and byproducts are low and purity is high, the composition approaches the theoretical value [77]. A possible approach would be to not rigorously characterize the sample as an initial step, but to experimentally confirm the phenomenon and then proceed to include a more rigorous characterization of the sample; ultimately, the appropriate characterization of the sample, including purity, is necessary.

4. Conclusions

The studies in Section 3 examined the changes in the secondary structure of a protein by binding a salen-type Schiff base zinc complex to the protein HSA. The ratio of the secondary structure of the α-helix and β-sheet structures of HSA without zinc complexes did not change after irradiation with IR-FEL. However, the introduction of zinc complexes changed the ratio of the secondary structure of the α-helix and β-sheet structures in HSA. There is also research showing that, even for IL-6 with a large molecular weight, it is possible to destroy the secondary structure of IL-6 by binding it to a zinc complex and irradiating it with IR-FEL [78]. In addition, docking simulations based on DFT calculations suggest that zinc complexes bound to proteins with smaller molecular weights, such as lysozyme, are also a possibility.
One possibility is to bind an appropriate zinc complex to amyloid-β and irradiate it with IR-FEL to modify the protein structure and make it lose its toxicity. If this can prevent the death of neurons and create a situation in which they can recover, it could be an effective method for the prophylactic treatment of Alzheimer’s disease in its early stages and for the removal of amyloid plaques, both large and small.

Author Contributions

Writing—original draft preparation, H.T.; writing—review and editing, D.N. and T.A.; project administration, T.A. All authors have read and agreed to the published version of the manuscript.

Funding

This research received no external funding.

Data Availability Statement

No new data were created or analyzed in this study. Data sharing is not applicable to this article.

Conflicts of Interest

The authors declare no conflict of interest.

References

  1. Sagai, M. Pathogenesis and prevention of dementia. Jpn. Hum. Care Sci. J. 2010, 3.1, 6–24. [Google Scholar]
  2. Taisuke Tomita, M.D. γ-secretase for the treatment of Alzheimer’s disease Structure-Activity Relationships. Clin. Neurol. 2008, 48, 907–909. [Google Scholar]
  3. De Benedictis, C.A.; Vilella, A.; Grabrucker, A.M. Alzheimer’s Disease, 6. In The Role of Trace Metals in Alzheimer’s Disease; Codon Publications: Brisbane, Australia, 2019; p. 90. [Google Scholar] [CrossRef]
  4. Kawahara, M.; Tanaka, K.-I.; Kato-Negishi, M. Crosstalk of copper and zinc in the pathogenesis of vascular dementia. J. Clin. Biochem. Nutr. 2022, 71, 7–15. [Google Scholar] [CrossRef] [PubMed]
  5. Parthasarathy, S.; Long, F.; Miller, Y.; Xiao, Y.; McElheny, D.; Thurber, K.; Ma, B.; Nussinov, R.; Ishii, Y. Molecular-Level Examination of Cu2+ Binding Structure for Amyloid Fibrils of 40-Residue Alzheimer’s β by Solid-State NMR Spectroscopy. J. Am. Chem. Soc. 2011, 133, 3390–3400. [Google Scholar] [CrossRef] [PubMed]
  6. Roberts, B.R.; Ryan, T.M.; Bush, A.I.; Masters, C.L.; Duce, J.A. The role of metallobiology and amyloid-β peptides in Alzheimer’s disease. J. Neurochem. 2012, 120 (Suppl. S1), 149–166. [Google Scholar] [CrossRef] [PubMed]
  7. Frederickson, C.J.; Klitenick, M.A.; Manton, W.I.; Kirkpatrick, J.B. Cytoarchitectonic distribution of zinc in the hippocampus of man and the rat. Brain Res. 1983, 273, 335–339. [Google Scholar] [CrossRef] [PubMed]
  8. Frederickson, C.J.; Giblin, L.J.; Rengarajan, B.; Masalha, R.; Frederickson, C.J.; Zeng, Y.; Lopez, E.V.; Koh, J.-Y.; Chorin, U.; Besser, L.; et al. Synaptic release of zinc from brain slices: Factors governing release, imaging, and accurate calculation of concentration. J. Neurosci. Methods 2006, 154, 19–29. [Google Scholar] [CrossRef] [PubMed]
  9. Kay, A.R. Imaging synaptic zinc: Promises and perils. Trends Neurosci. 2006, 29, 200–206. [Google Scholar] [CrossRef]
  10. Kawahara, M.; Sadakane, Y.; Mizuno, D. Role of zinc in the pathogenesis of neurodegenerative diseases. J. Zinc Nutr. Ther. 2014, 5, 25–36. [Google Scholar]
  11. Vogt, K.; Mellor, J.; Tong, G.; Nicoll, R. The actions of synaptically released zinc at hippocampal mossy fiber synapses. Neuron 2000, 26, 187–196. [Google Scholar] [CrossRef]
  12. Mizuno, D.; Kawahara, M. The Molecular Mechanisms of Zinc Neurotoxicity and the Pathogenesis of Vascular Type Senile Dementia. Int. J. Mol. Sci. 2013, 14, 22067–22081. [Google Scholar] [CrossRef] [PubMed]
  13. Abe, K. Neurodegenerative diseases and neurovascular unit disorders. Neurotherapy 2018, 35, 380–384. [Google Scholar]
  14. National Center for Geriatrics and Gerontology Research. Introduction Column, Aducanumab, a New Treatment for Dementia (4). Available online: https://www.ncgg.go.jp/ri/labo/04.html (accessed on 21 September 2023).
  15. National Center for Geriatrics and Gerontology Research. Introduction Column, Aducanumab, a New Treatment for Dementia (5). Available online: https://www.ncgg.go.jp/ri/labo/05.html (accessed on 21 September 2023).
  16. FDA’s Decision to Approve New Treatment for Alzheimer’s Disease. Available online: https://www.fda.gov/drugs/news-events-human-drugs/fdas-decision-approve-new-treatment-alzheimers-disease (accessed on 21 September 2023).
  17. National Center for Geriatrics and Gerontology Research. Introduction Column, Aducanumab, a New Treatment for Dementia (3). Available online: https://www.ncgg.go.jp/ri/labo/03.html (accessed on 21 September 2023).
  18. Morii, D.; Maeda, Y.; Murakami, M.; Nomura, K.; Hara, Y. Japan-Medical Research Institute Research Report, No. 109 Aducanumab, a New Drug for Alzheimer’s Disease (Aduhelm™) about US FDA Approval, 28 July 2021. Available online: https://www.jmari.med.or.jp/wp-content/uploads/2021/10/RR109.pdf (accessed on 21 September 2023).
  19. National Center for Geriatrics and Gerontology Research. Introduction Column, Aducanumab, a New Treatment for Dementia (1). Available online: https://www.ncgg.go.jp/ri/labo/01.html (accessed on 21 September 2023).
  20. Plowey, E.D.; Bussiere, T.; Rajagovindan, R.; Sebalusky, J.; Hamann, S.; von Hehn, C.; Castrillo-Viguera, C.; Sandrock, A.; Haeberlein, S.B.; van Dyck, C.H.; et al. Alzheimer disease neuropathology in a patient previously treated with aducanumab. Acta Neuropathol. 2022, 144, 143–153. [Google Scholar] [CrossRef] [PubMed]
  21. FDA Converts Novel Alzheimer’s Disease Treatment to Traditional Approval Action Follows Confirmatory Trial to Verify Clinical Benefit. Available online: https://www.fda.gov/news-events/press-announcements/fda-converts-novel-alzheimers-disease-treatment-traditional-approval (accessed on 21 September 2023).
  22. van Dyck, C.H.; Swanson, C.J.; Aisen, P.; Bateman, R.J.; Chen, C.; Gee, M.; Kanekiyo, M.; Li, D.; Reyderman, L.; Cohen, S.; et al. Lecanemab in Early Alzheimer’s Disease. N. Engl. J. Med. 2023, 388, 9–21. [Google Scholar] [CrossRef] [PubMed]
  23. Biogen and Eisai Launch Multiple Initiatives to Help Patients with Alzheimer’s Disease Access ADUHELM™ 7 June 2021 • NEWS RELEASE. Available online: https://investors.biogen.com/news-releases/news-release-details/biogen-and-eisai-launch-multiple-initiatives-help-patients (accessed on 21 September 2023).
  24. Lin, G.A.; Whittington, M.D.; Synnott, P.G.; McKenna, A.; Campbell, J.; Pearson, S.D.; Rind, D.M. Aducanumab for Alzheimer’s Disease: Effectiveness and Value; Draft Evidence Report. Institute for Clinical and Economic Review, 5 May 2021. Available online: https://icer.org/wp-content/uploads/2020/10/ICER_ALZ_Final_Report_080521-1.pdf (accessed on 21 September 2023).
  25. Kawasaki, T. Photo-Dissociation of Amyloid Fibrils by using IR Free Electron Laser. Nippon. Laser Igakkaishi 2015, 36, 119–122. [Google Scholar] [CrossRef]
  26. Kawasaki, T.; Sakai, T.; Zen, H.; Sumitomo, Y.; Nogami, K.; Hayakawa, K.; Yaji, T.; Ohta, T.; Tsukiyama, K.; Hayakawa, Y. Cellulose Degradation by Infrared free-electron laser. Energy Fuels 2020, 34, 9064–9068. [Google Scholar] [CrossRef]
  27. Kawasaki, T.; Yaji, T.; Ohta, T.; Tsukiyama, K. Application of mid-infrared free-electron laser tuned to amide bands for dissociation of aggregate structure of protein. J. Synchrotron Radiat. 2016, 23, 152–157. [Google Scholar] [CrossRef] [PubMed]
  28. Kawasaki, T.; Tsukiyama, K.; Irizawa, A. Dissolution of a fibrous peptide by terahertz free electron laser. Sci. Rep. 2019, 9, 10636. [Google Scholar] [CrossRef]
  29. Kawasaki, T.; Yaji, T.; Ohta, T.; Tsukiyama, K.; Nakamura, K. Dissociation of β-Sheet Stacking of Amyloid β Fibrils by Irradiation of Intense, Short-Pulsed Mid-infrared Laser. Cell. Mol. Neurobiol. 2018, 38, 1039–1049. [Google Scholar] [CrossRef]
  30. Kawasaki, T.; Fujioka, J.; Imai, T.; Tsukiyama, K. Effect of Mid-infrared Free-Electron Laser Irradiation on Refolding of Amyloid-Like Fibrils of Lysozyme into Native Form. Protein J. 2012, 31, 710–716. [Google Scholar] [CrossRef]
  31. Onami, Y.; Kawasaki, T.; Aizawa, H.; Haraguchi, T.; Akitsu, T.; Tsukiyama, K.; Palafox, M.A. Degradation of Human Serum Albumin by Infrared free-electron laser Enhanced by Inclusion of a Salen-Type Schiff Base Zn (II) Complex. Int. J. Mol. Sci. 2020, 21, 874. [Google Scholar] [CrossRef]
  32. Onami, Y.; Koya, R.; Kawasaki, T.; Aizawa, H.; Nakagame, R.; Miyagawa, Y.; Haraguchi, T.; Akitsu, T.; Tsukiyama, K.; Palafox, M.A. Investigation by DFT Methods of the Damage of Human Serum Albumin Including Amino Acid Derivative Schiff Base Zn(II) Complexes by IR-FEL Irradiation. Int. J. Mol. Sci. 2019, 20, 2846. [Google Scholar] [CrossRef]
  33. Takase, M.; Yagi, S.; Haraguchi, T.; Noor, S.; Akitsu, T. Linearly Polarized UV Light-Induced Optical Anisotropy of PVA Films and Flexible Macrocycle Schiff Base Ni(II), Cu(II), Zn(II) Dinuclear Complexes. Symmetry 2018, 10, 760. [Google Scholar] [CrossRef]
  34. Seki, T. The Chemical Society of Japan. In Essentials in Chemistry 33 Control of Molecular Orientation; Kyoritsu Shuppan Co., Ltd.: Tokyo, Japan, 2019; pp. 20–23. [Google Scholar]
  35. Natansohn, A.; Rochon, P. Photoinduced Motions in Azo-Containing Polymers. Chem. Rev. 2002, 102, 4139–4176. [Google Scholar] [CrossRef] [PubMed]
  36. Hisaki, I. (MS14) Symmetry, Asymmetry and Chirality in Molecular Aggregation. J. Jpn. Soc. Crystallogr. 2009, 51, 41–43. [Google Scholar] [CrossRef]
  37. Kuroda, R.; Harada, T.; Shindo, Y. A solid-state dedicated circular dichroism spectrophotometer: Development and application. Rev. Sci. Instrum. 2001, 72, 3802–3810. [Google Scholar] [CrossRef]
  38. Tschierske, C.; Ungar, G. Mirror Symmetry Breaking by Chirality Synchronisation in Liquids and Liquid Crystals of Achiral Molecules. Chemphyschem 2016, 17, 9–26. [Google Scholar] [CrossRef] [PubMed]
  39. Sekine, T.; Niori, T.; Sone, M.; Watanabe, J.; Choi, S.-W.; Takanishi, Y.; Takezoe, H. Origin of Helix in Achiral Banana-Shaped Molecular Systems. Jpn. J. Appl. Phys. 1997, 36, 6455. [Google Scholar] [CrossRef]
  40. Hough, L.E.; Jung, H.T.; Krüerke, D.; Heberling, M.S.; Nakata, M.; Jones, C.D.; Chen, D.; Link, D.R.; Zasadzinski, J.; Heppke, G.; et al. Helical Nanofilament Phases. Science 2009, 325, 456–460. [Google Scholar] [CrossRef] [PubMed]
  41. Sasaki, H.; Takanishi, Y.; Yamamoto, J.; Yoshizawa, A. Photo-Driven Chirality Switching in a Dark Conglomerate Phase of an Achiral Liquid Crystal Trimer. ChemistrySelect 2018, 3, 3278–3283. [Google Scholar] [CrossRef]
  42. Aritake, Y.; Takanashi, T.; Yamazaki, A.; Akitsu, T. Polarized spectroscopy and hybrid materials of chiral Schiff base Ni(II), Cu(II), Zn(II) complexes with included or separated azo-groups. Polyhedron 2011, 30, 886–894. [Google Scholar] [CrossRef]
  43. Takase, M.; Akitsu, T. Polymer Science Book Series—Volume # 1: “Polymer Science: Research Advances, Practical Applications and Educational Aspects”; Formatex Research Centre: Badajoz, Spain, 2016; pp. 301–308. [Google Scholar]
  44. Nakatori, H.; Haraguchi, T.; Akitsu, T. Polarized light induced molecular orientation control of rigid Schiff base Ni(II), Cu(II), Zn(II) binuclear complexes as polymer composites. Symmetry 2018, 10, 147. [Google Scholar] [CrossRef]
  45. Sheldrick, G.M. A short history of SHELX. Acta Crystallogr. Sect. A 2008, 64, 112–122. [Google Scholar] [CrossRef]
  46. Akitsu, T.; Ito, M.; Palafox, M. Theoretical interpretation of polarized light-induced supramolecular orientation on the basis of normal mode analysis of azobenzene as hybrid materials in PMMA with chiral Schiff base Ni(II), Cu(II), and Zn(II) complexes. J. Appl. Solut. Chem. Model. 2016, 5, 30–47. [Google Scholar] [CrossRef]
  47. Sekkat, Z.; Dumont, M. Photoinduced orientation of azo dyes in polymeric films. Characterization of molecular angular mobility. Synth. Met. 1993, 54, 373–381. [Google Scholar] [CrossRef]
  48. Moletti, A.; Coluccini, C.; Pasini, D.; Taglietti, A. A chiral probe for the detection of Cu(II) by UV, CD and emission spectroscopies. Dalton Trans. 2007, 16, 1588–1592. [Google Scholar] [CrossRef] [PubMed]
  49. Yamazaki, A.; Akitsu, T. Polarized spectroscopy and polarized UV light-induced molecular orientation of chiral diphenyl Schiff base Ni(II) and Cu(II) complexes and azobenzene in a PMMA film. RSC Adv. 2012, 2, 2975–2980. [Google Scholar] [CrossRef]
  50. SPring8Notice, Easy Explanation of Research Results X-ray Free Electron Laser Realized by SPring-8 Technology. Available online: http://www.spring8.or.jp/ja/news_publications/research_highlights/no_29/ (accessed on 21 September 2023).
  51. Yokoyama, M.; Oda, F.; Nomaru, K.; Koike, H.; Sobajima, M.; Miura, H.; Hattori, H.; Kawai, M.; Kuroda, H. First lasing of KHI FEL device at the FEL-SUT. Nucl. Instrum. Methods Phys. Res. 2001, 475, 38–42. [Google Scholar] [CrossRef]
  52. Tsukiyama, K. Infrared Free-Electron Laser (FEL-TUS) Material Creation and Application to Life Science and Medicine. Available online: https://shingi.jst.go.jp/pdf/2015/tus02.pdf (accessed on 21 September 2023).
  53. Miyazaki, D.; Ikeuchi, K. Basic Theory of Polarization and Its Applications.Transactions of Information Processing Society of Japan. Comput. Vis. Image Media 2008, 1, 64–72. [Google Scholar]
  54. Suzuki, M.; Toko, H. Beamline Optics Technology Series (9) Controlling the Polarization of Light. J. Jpn. Soc. Synchrotron Radiat. Res. 2006, 19, 444–447. [Google Scholar]
  55. Kuroda, H. Infrared Free-Electron Laser Facility of the Tokyo University of Science (FEL-TUS). Available online: http://www.jssrr.jp/journal/pdf/14/p175.pdf (accessed on 21 September 2023).
  56. Tokyo University of Science, Tsukiyama Lab., RESEARCH, Laser Spectroscopy and Photochemistry of Small Molecules. Available online: https://www.rs.kagu.tus.ac.jp/tsukilab/research_fel.html (accessed on 21 September 2023).
  57. Rinco, O.; Brenton, J.; Douglas, A.; Maxwell, A.; Henderson, M.; Indrelie, K.; Wessels, J.; Widin, J. The effect of porphyrin structure on binding to human serum albumin by fluorescence spectroscopy. J. Photochem. Photobiol. A Chem. 2009, 208, 91–96. [Google Scholar] [CrossRef]
  58. Hirakawa, K.; Ouyang, D.; Ibuki, Y.; Hirohara, S.; Okazaki, S.; Kono, E.; Kanayama, N.; Nakazaki, J.; Segawa, H. Photosensitized Protein-Damaging Activity, Cytotoxicity, and Antitumor Effect of P(V)porphyrins Using Long-Wavelength Visible Light through Electron Transfer. Chem. Res. Toxicol. 2018, 31, 371–379. [Google Scholar] [CrossRef]
  59. Sun, B.; Musgrave, I.F.; Day, A.I.; Heimann, K.; Keene, F.R.; Collins, J.G. Eukaryotic Cell Toxicity and HSA Binding of [Ru(Me4phen)(bb7)]2+ and the Effect of Encapsulation in Cucurbit[10]uril. Front. Chem. 2018, 6, 595. [Google Scholar] [CrossRef]
  60. Zhou, B.; Zhang, Z.; Zhang, Y.; Li, R.; Xiao, Q.; Liu, Y.; Li, Z. Binding of Cationic Porphyrin to Human Serum Albumin Studied Using Comprehensive Spectroscopic Methods. J. Pharm. Sci. 2009, 98, 105–113. [Google Scholar] [CrossRef]
  61. Cavicchioli, M.; Zaballa, A.M.L.; de Paula, Q.A.; Prieto, M.B.; Oliveira, C.C.; Civitareale, P.; Ciriolo, M.R.; Ferreira, A.M.D.C. Oxidative Assets Toward Biomolecules and Cytotoxicity of New Oxindolimine-Copper(II) and Zinc(II) Complexes. Inorganics 2019, 7, 12. [Google Scholar] [CrossRef]
  62. Dömötör, O.; Enyedy, A. Binding mechanisms of half-sandwich Rh(III) and Ru(II) arene complexes on human serum albumin: A comparative study. J. Biol. Inorg. Chem. 2019, 24, 703–719. [Google Scholar] [CrossRef] [PubMed]
  63. Akao, K. Development and Application of Secondary Structural Estimation Program of Protein for FTIR (IR-SSE). Jasco Rep. 2002, 44, 9–12. [Google Scholar]
  64. Urbanovský, P.; Kotek, J.; Carniato, F.; Botta, M.; Hermann, P. Lanthanide Complexes of DO3A–(Dibenzylamino)methylphosphinate: Effect of Protonation of the Dibenzylamino Group on the Water-Exchange Rate and the Binding of Human Serum Albumin. Inorg. Chem. 2019, 58, 5196–5210. [Google Scholar] [CrossRef]
  65. Reglinski, J.; Morris, S.; E Stevenson, D. Supporting conformational change at metal centres. Part 2: Four and five coordinate geometry. Polyhedron 2002, 21, 2175–2182. [Google Scholar] [CrossRef]
  66. He, W.; Li, Y.; Xue, C.; Hu, Z.; Chen, X.; Sheng, F. Effect of Chinese medicine alpinetin on the structure of human serum albumin. Bioorganic Med. Chem. 2005, 13, 1837–1845. [Google Scholar] [CrossRef]
  67. Kang, J.; Liu, Y.; Xie, M.-X.; Li, S.; Jiang, M.; Wang, Y.-D. Interactions of human serum albumin with chlorogenic acid and ferulic acid. Biochim. Biophys. Acta Gen. Subj. 2004, 1674, 205–214. [Google Scholar] [CrossRef]
  68. Rainey, K.H.; Patterson, G.H. Photoswitching FRET to monitor protein–protein interactions. Proc. Natl. Acad. Sci. USA 2019, 116, 864–873. [Google Scholar] [CrossRef]
  69. Sarver, R.W., Jr.; Krueger, W.C. Protein secondary structure from fourier transform infrared spectroscopy: A data base analysis. Anal. Biochem. 1991, 194, 89–100. [Google Scholar] [CrossRef]
  70. Zhong, Y.; Patel, S. Binding structures of tri-N-acetyl-β-glucosamine in hen egg white lysozyme using molecular dynamics with a polarizable force field. J. Comput. Chem. 2012, 34, 163–174. [Google Scholar] [CrossRef]
  71. Onami, Y.; Kawasaki, T.; Haraguchi, T.; Tsukiyama, K.; Moon, D.; Kitahama, Y.; Hosokai, T.; Mastuzaki, H.; Sakiyama, H.; Akitsu, T. Effect of dipeptide derivative Schiff-base Zn(II) complexes on lysozyme molecules damaged by means of IR-FEL irradiation. Trends Photochem. Photobiol. 2022, 21, 15–26. [Google Scholar]
  72. Rani, C.V.; Kesavan, M.P.; Kumar, G.G.V.; Jeyaraj, M.J.D.; Rajesh, J.; Rajagopal, G. Synthesis, physicochemical characterization and structural studies of new Schiff base ligand and its metal (II) complexes: In silico molecular docking analysis, antimicrobial activity and cytotoxicity. Appl. Organomet. Chem. 2018, 32, e4538. [Google Scholar] [CrossRef]
  73. Sciortino, G.; Garribba, E.; Maréchal, J.-D. Validation and Applications of Protein–Ligand Docking Approaches Improved for Metalloligands with Multiple Vacant Sites. Inorg. Chem. 2019, 58, 294–306. [Google Scholar] [CrossRef] [PubMed]
  74. Chemical Information Society, Crystal Structure Database/Compound Dictionary Crystal Structure Database CCDC Products, CSD-Discovery, GOLD. Available online: https://www.jaici.or.jp/db/crystal/ccdc/csd-discovery/gold/ (accessed on 21 September 2023).
  75. CCDC GOLD. Available online: https://www.ccdc.cam.ac.uk/solutions/software/gold/ (accessed on 21 September 2023).
  76. Inoue, T. Importance of The Basic Technique on Chemical Analysis (6). Chem. Times 2007, 203, 13–14. [Google Scholar]
  77. Sato, A. New Topics in Organic Elemental Analysis—The Best Determination Techniques for Carbon, Hydrogen, and Nitrogen and Their Applications. Chem. Educ. 2015, 63, 614. [Google Scholar]
  78. Fujisawa, N.; Onami, Y.; Kawasaki, T.; Haraguchi, T.; Akitsu, T.; Tsukiyama, K. Infrared free-electron laser or Polarized Ultraviolet Photolysis of Hierarchical and Chiral Components of Interleukin-6, AlanylAlanine and Alanine. Trends Pept. Protein Sci. 2020, 5, e8. [Google Scholar] [CrossRef]
Figure 1. Production of amyloid-β by amyloid-β precursor protein metabolism [2].
Inorganics 12 00050 g001
Figure 2. Metal interaction with amyloid-β [3].
Inorganics 12 00050 g002
Figure 3. Function of zinc in the brain in normal (left) or pathological (right) conditions [12].
Inorganics 12 00050 g003
Figure 4. Structure of C22H22Cl2N4O2Zn2 (CCDC 1569972). Atoms are colored gray for C, green for Cl, blue for N red for O and darkblue for Zn. H is hidden.
Inorganics 12 00050 g004
Figure 5. UV-vis spectra of C22H22Cl2N4O2Zn2 in the solid state (top), aqueous solution (middle), and PVA (bottom) [33].
Inorganics 12 00050 g005
Figure 6. Polarized UV-vis spectra for C22H22Cl2N4O2Zn2 + PVA at the 45° angle after irradiation with linearly polarized UV light. The UV-vis spectra show absorbance on the left π–π* near 250 nm and on the right CT bands near 360 nm [33].
Inorganics 12 00050 g006
Figure 7. Circular diagrams of polarized UV-vis spectra for C22H22Cl2N4O2Zn2 + PVA after irradiation with linearly polarized UV light. Polarizer angle depends on the absorbance of UV-vis spectra on the left π–π* near 250 nm and on the right CT bands near 360 nm [33].
Inorganics 12 00050 g007
Figure 8. Schematic diagram of X-FEL oscillation system [50].
Inorganics 12 00050 g008
Figure 9. Schematic diagram of IR-FEL oscillation system [51,52].
Inorganics 12 00050 g009
Figure 10. Salen-Type zinc complexes without amide bonds (ZnL). (left) Structure; (right) side view [31].
Inorganics 12 00050 g010
Figure 11. UV-Vis spectra of HSA + ZnL (blue), HSA (orange), and ZnL (green). Indicating π–π* bands at the red broken lines and n-π* bands at the pink broken lines, respectively [31].
Inorganics 12 00050 g011
Figure 12. CD spectra of (a) HSA and (b) HSA + ZnL [31].
Inorganics 12 00050 g012
Figure 13. Fluorescence spectra of (a) ZnL (λex = 360 nm), (b) ZnL (λex = 284 nm), (c) HSA (λex = 286 nm), and (d) HSA + ZnL (λex = 285 nm). Circles and arrows show an explanation of FRET [31].
Inorganics 12 00050 g013
Figure 14. Fluorescence 2D contour plot of (a) ZnL, (b) HSA, and (c) HSA + ZnL [31].
Inorganics 12 00050 g014
Figure 15. Images of cast films of (a) HSA + ZnL and (b) HSA. Squares indicated by arrows are mentioned in spectral information about the local area of the HSA film [31].
Inorganics 12 00050 g015
Figure 16. FT-IR spectra of (a,c) are HSA + ZnL, and (b,d) are HSA and IR-FEL irradiation at 1622 cm−1 ν(C=N) in terms of the α-helix (blue), β-sheet (orange), β-turn (gray), and other (yellow) [31,32]. The dashed line is the approximate straight line of the IR spectral change.
Inorganics 12 00050 g016
Figure 17. FT-IR spectra of (a) HSA + ZnL, (b) HSA after IR-FEL irradiation at 1652 cm−1 (amide I), (c) HSA + ZnL, and (d) HSA after IR-FEL irradiation at 1537 cm−1 (amide II) [31].
Inorganics 12 00050 g017
Figure 18. Secondary structure analysis of FT-IR spectra of (a) HSA + ZnL, (b) HSA after IR-FEL irradiation at 1652 cm−1 (amide I), (c) HSA + ZnL, and (d) HSA after IR-FEL irradiation at 1537 cm−1 (amide II) in terms of the α-helix (blue), β-sheet (orange), β-turn (gray), and other (yellow) [31,32]. The dashed line is the approximate straight line of the IR spectral change.
Inorganics 12 00050 g018
Figure 19. Structure of ZnGlyGlyH [71].
Inorganics 12 00050 g019
Figure 20. Structure of ZnGlyGlyPh [71].
Inorganics 12 00050 g020
Figure 21. Fluorescence measurement of lysozyme-bound ZnGlyGlyH (Lyz-ZnGlyGlyH). Arrow show an explanation of FRET [71].
Inorganics 12 00050 g021
Figure 22. Fluorescence measurement of lysozyme-bound ZnGlyGlyPh (Lyz-ZnGlyGlyPh) [71].
Inorganics 12 00050 g022
Figure 23. GOLD docking simulation of lysozyme-bound ZnGlyGlyH (Lyz-ZnGlyGlyH) [71].
Inorganics 12 00050 g023
Figure 24. GOLD docking simulation of lysozyme-bound ZnGlyGlyPh (Lyz-ZnGlyGlyPh) [71].
Inorganics 12 00050 g024
Figure 25. Electron density analysis of Lyz-ZnGlyGlyH [71].
Inorganics 12 00050 g025
Figure 26. Electron density analysis of Lyz-ZnGlyGlyPh [71].
Inorganics 12 00050 g026
Figure 27. Docking simulation of (a) ZnGlyGlyH and (b) ZnGlyGlyPh [71].
Inorganics 12 00050 g027
Table 1. R and S parameters of the polarized UV-vis spectra of C22H22Cl2N4O2Zn2 + PVA [33].
t/minR(π–π)S(π–π)R(CT)S(CT)
C22H22Cl2N4O2Zn2 + PVA01.0070.00231.0100.0033
0.51.0030.00111.1080.0346
10.9247−0.02581.0180.0061
30.9135−0.02971.0080.0026
50.9209−0.02710.9935−0.0022
100.9826−0.00581.0600.0196
Table 2. Geometrical parameters, bond lengths (in Å), and angles (in degrees) calculated using the B3LYP and MP2 methods in ZnL.
Parameters B3LYPMP2Parameters B3LYPMP2
Bond lengths:O−Zn1.9091.894Bond angles:O−Zn−O114.7119.7
N−Zn2.0142.019 N−Zn−N90.787.8
O⋯O3.2143.276 O25−Zn−N2894.594.6
O⋯O2.8662.800 O25−Zn−N29132.9130.0
Table 3. Geometrical parameters at center metal Zn in ZnGlyGlyH.
BondLengths/ÅBondAngles/°
Zn1−O12.012O1−Zn1−O2115.24
Zn1−O22.077O1−Zn1−N2160.39
Zn1−N12.236O2−Zn1−N1159.31
Zn1−N22.026N1−Zn1−N280.14
Table 4. Geometrical parameters at center metal Zn in ZnGlyGlyPh.
BondLengths/ÅBondAngles/°
Zn1−O11.904O1−Zn1−O2120.69
Zn1−O21.903O1−Zn1−N286.67
Zn1−N12.009O2−Zn1−N194.45
Zn1−N22.007N1−Zn1−N290.79
Disclaimer/Publisher’s Note: The statements, opinions and data contained in all publications are solely those of the individual author(s) and contributor(s) and not of MDPI and/or the editor(s). MDPI and/or the editor(s) disclaim responsibility for any injury to people or property resulting from any ideas, methods, instructions or products referred to in the content.

