1. Introduction
3D vision technology has been recognized as one of the most important technologies for mobile intelligent terminals to enter the new era of intelligent human-computer interaction [
1,
2,
3]. Up to now, 3D vision technology has been successfully applied to mobile terminals in many fields such as 3D live detection, virtual reality, augmented reality, and so on. The two mainstream technologies applied at mobile terminals are time-of-flight (TOF) and laser speckle-based structured light (SL), which are widely known as having low accuracy [
4,
5,
6]. Therefore, they cannot be used to obtain accurate 3D information, which significantly limits the application scope of 3D vision at intelligent terminals.
The major error sources of TOF come from multipath interference (MPI) and reflectivity-related distance variations, which have been the major bottleneck restricting the application of TOF in the field of precise measurement. The elimination of these major error sources has always been a research hot spot in the field of TOF [
7,
8,
9,
10,
11,
12,
13]. At present, most studies attempt to solve MPI problems from the TOF’s projection model itself, such as the multiple frequencies approach [
8], the sparse deconvolution approach [
9], the iterative computational approach [
10,
11], the direct and global separation approach [
12], and so on. However, most of these approaches have tried to eliminate MPI from the receiving waveform of TOF; therefore, their effect was rather limited. In recent years, deep learning methods have been introduced to solve MPI [
13]. Though these can remove the MPI and TOF data noise to some extent, their effect on real data may be limited because the training dataset can only be collected from simulated scenes.
As for the structured light (SL) technique, it can be generally divided into the temporally coded SL [
14,
15,
16,
17] and spatially coded SL (SCSL) [
18,
19,
20], depending on different codification strategies. Compared with the former, the latter can work with a single shot, which makes it a more efficient and applicable tool for 3D vision task on mobile intelligent terminals. Among the SCSL, laser speckle-based SL is currently one of the most popular 3D dynamic imaging solution for mobile terminals. For example, the Intel Realsense series depth cameras, Apple’s iPhone X smartphone, vivo’s Find X smartphone, and Orbbec’s Astra series depth cameras are all based on this technique. However, in laser speckle-based SL, the stochastic speckles are used for stereo correlation matching to provide depth information. The measurement accuracy is rather low due to block matching. Moreover, the statistically random pattern has the shortcomings of low spatial resolution and high sensitivity to noise. To improve its measurement accuracy, we proposed a dot-coded SL (DCDL) in our previous work [
20]. By adding coding information into the distribution of random dots, feature points can be located in sub-pixel precision and hence high-accuracy measurement can be achieved. However, limited by its coding strategies, of which the codeword at every image pixel is determined by its neighboring pattern elements, DCDL can only conduct sparse reconstruction.
From above analysis, it can be seen that TOF and DCSL have complementary characteristics. DCSL can provide high-accuracy and noise-clean point clouds, but it is plagued by coding density. In contrast, TOF can provide complete and dense point clouds, yet perplexed by MPI and reflectivity-related error sources. Therefore, to achieve accurate depth recovery, this paper explored fusing DCSL with TOF. Their fusion can make up for each other’s shortcomings and lead to accurate and dense depth recovery. The sparse points provided by DCSL can work as accurate “anchor points” to keep the correctness of the target scene’s structure, meanwhile, the result from TOF can guarantee dense and full-range measurement. In this way, high-density and high-accuracy depth measurements can be conducted in real time. To our knowledge, the fusion approach of TOF and DCSL has not yet been published or revealed.
This paper is structured as follows.
Section 2 exhibits the complementary characteristics of TOF and DCSL by measuring a typical object.
Section 3 presents the detailed introductions of the proposed technology and algorithm.
Section 4 describes the major experimental results.
Section 5 is the discussion. Finally, the conclusion is drawn in
Section 6.
2. Characteristic Comparison between TOF and DCSL
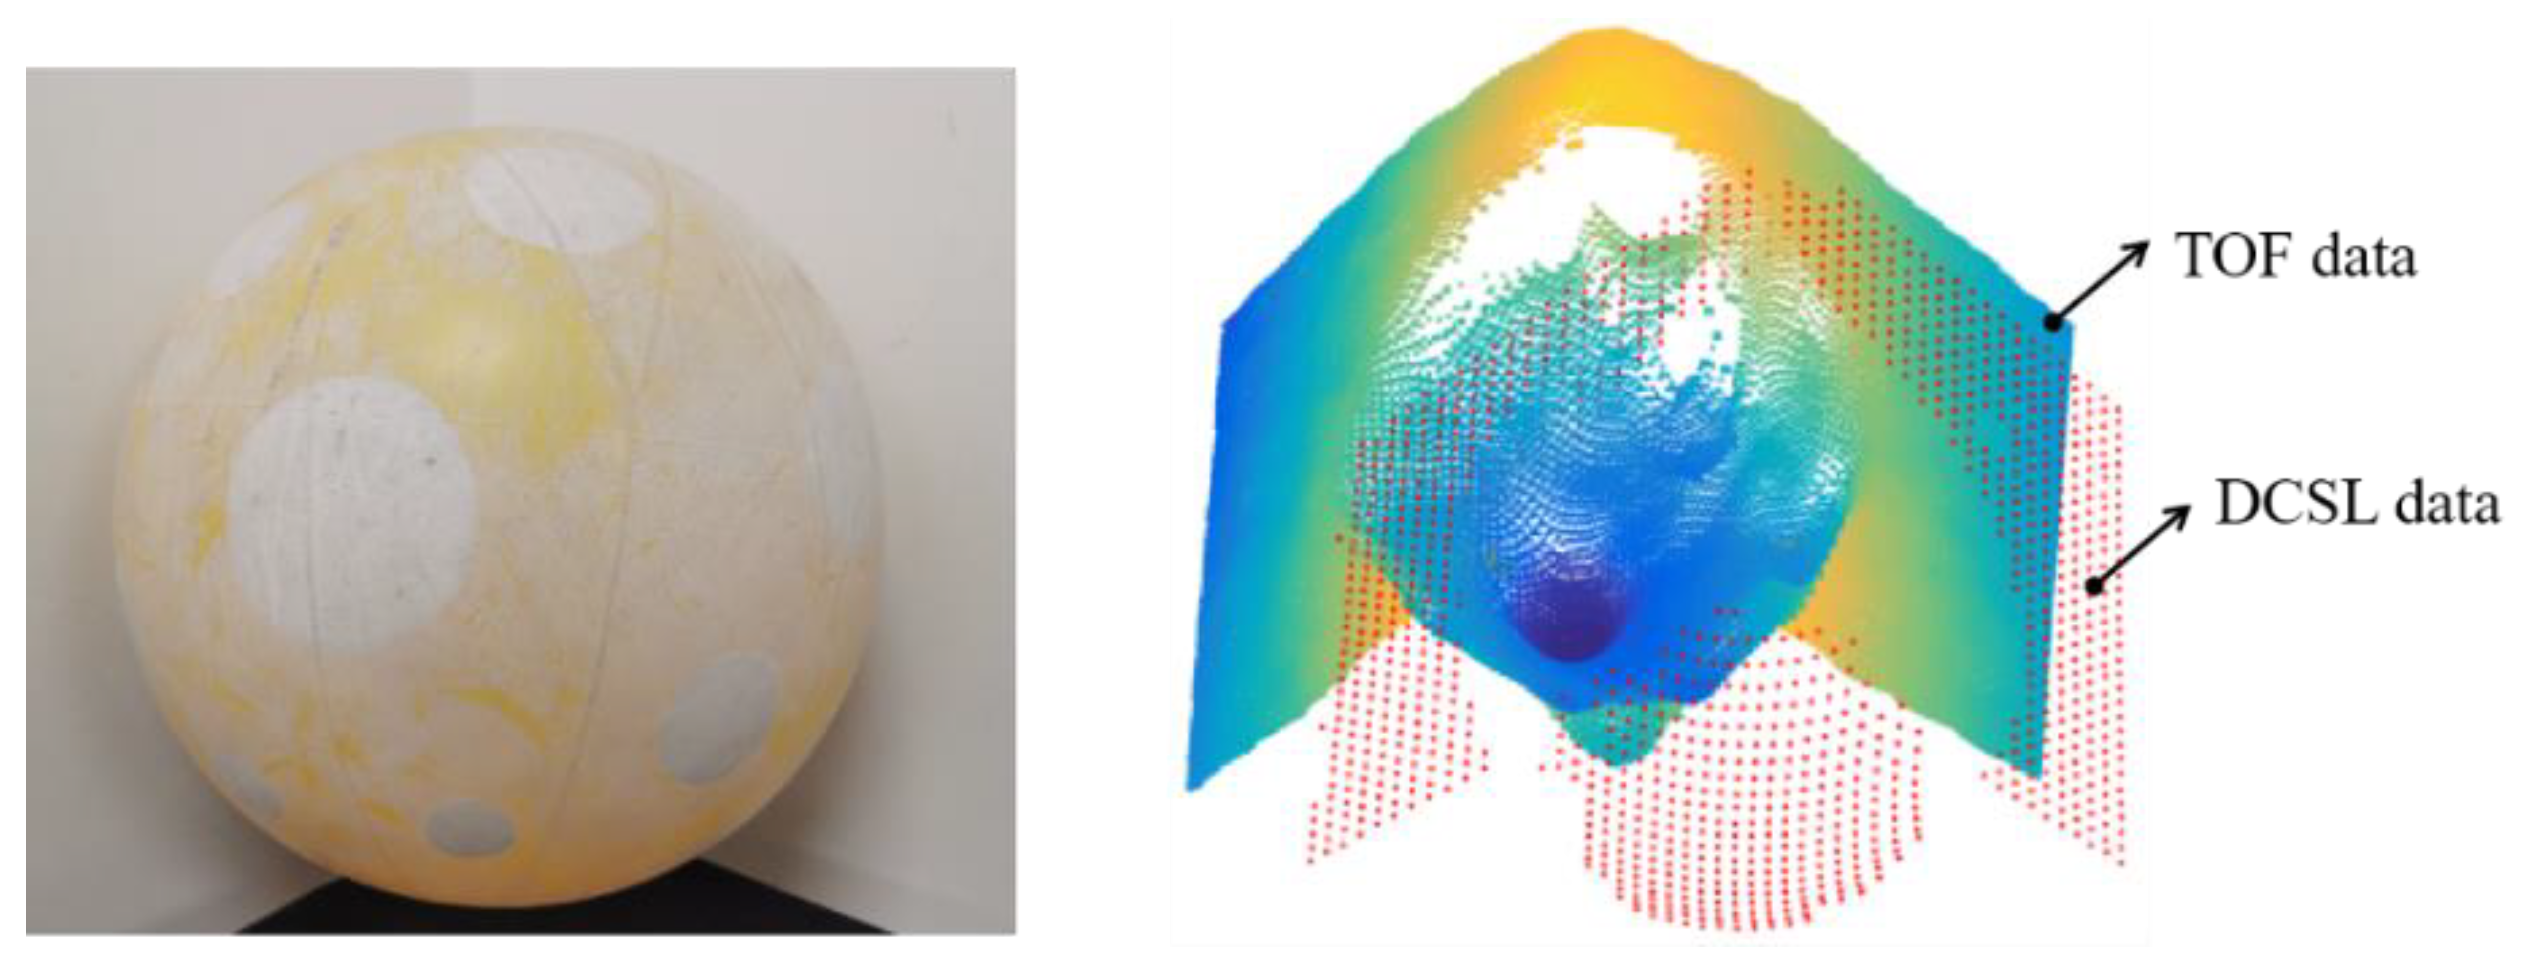
As a start, it is necessary to exhibit the complementary characteristics of TOF and DCSL. As mentioned above, the major error sources of TOF come from MPI and reflectivity-related distance variations. Therefore, we take a ball with multi-reflective properties as the target object, and put it in a corner of the wall, as shown in
Figure 1. The TOF camera here adopted a commercially available camera-Pico Zense DCAM710. The DCSL here used our system in [
20]. We reconstruct the ball with TOF and DCSL, respectively, and put the results in
Figure 1.
Consider TOF’s reconstruction data at first. It can be seen that it is very dense, and shows superior performance in depth discontinuous regions, such as the region between the ball’s edge and the background wall. However, because of MPI, the corner of a wall cannot be recovered correctly. More specifically, the right angle is reconstructed into an obtuse angle. In addition, the ball’s surface is deformed in regions that have different reflective properties. In contrast, the DCSL can reconstruct the surface of the ball and the background wall correctly. This is mainly because the reflected light in DCSL was encoded, while in TOF, the reflected light may possibly be disturbed by multiple reflections. Nevertheless, limited by the spatial codification strategies, the reconstruction data of DCSL is discrete. In most spatially coded SL, researchers try to achieve dense results through the interpolation method. However, the interpolation results are less reliable. Moreover, this method cannot handle the discontinuous regions well. Considering the complementary characteristics of TOF and DCSL, fusing them to obtain better results becomes an interesting possibility. The main challenge in fusing them is accurate data alignment method and effective fusion strategy.
3. Key Technology and Algorithm
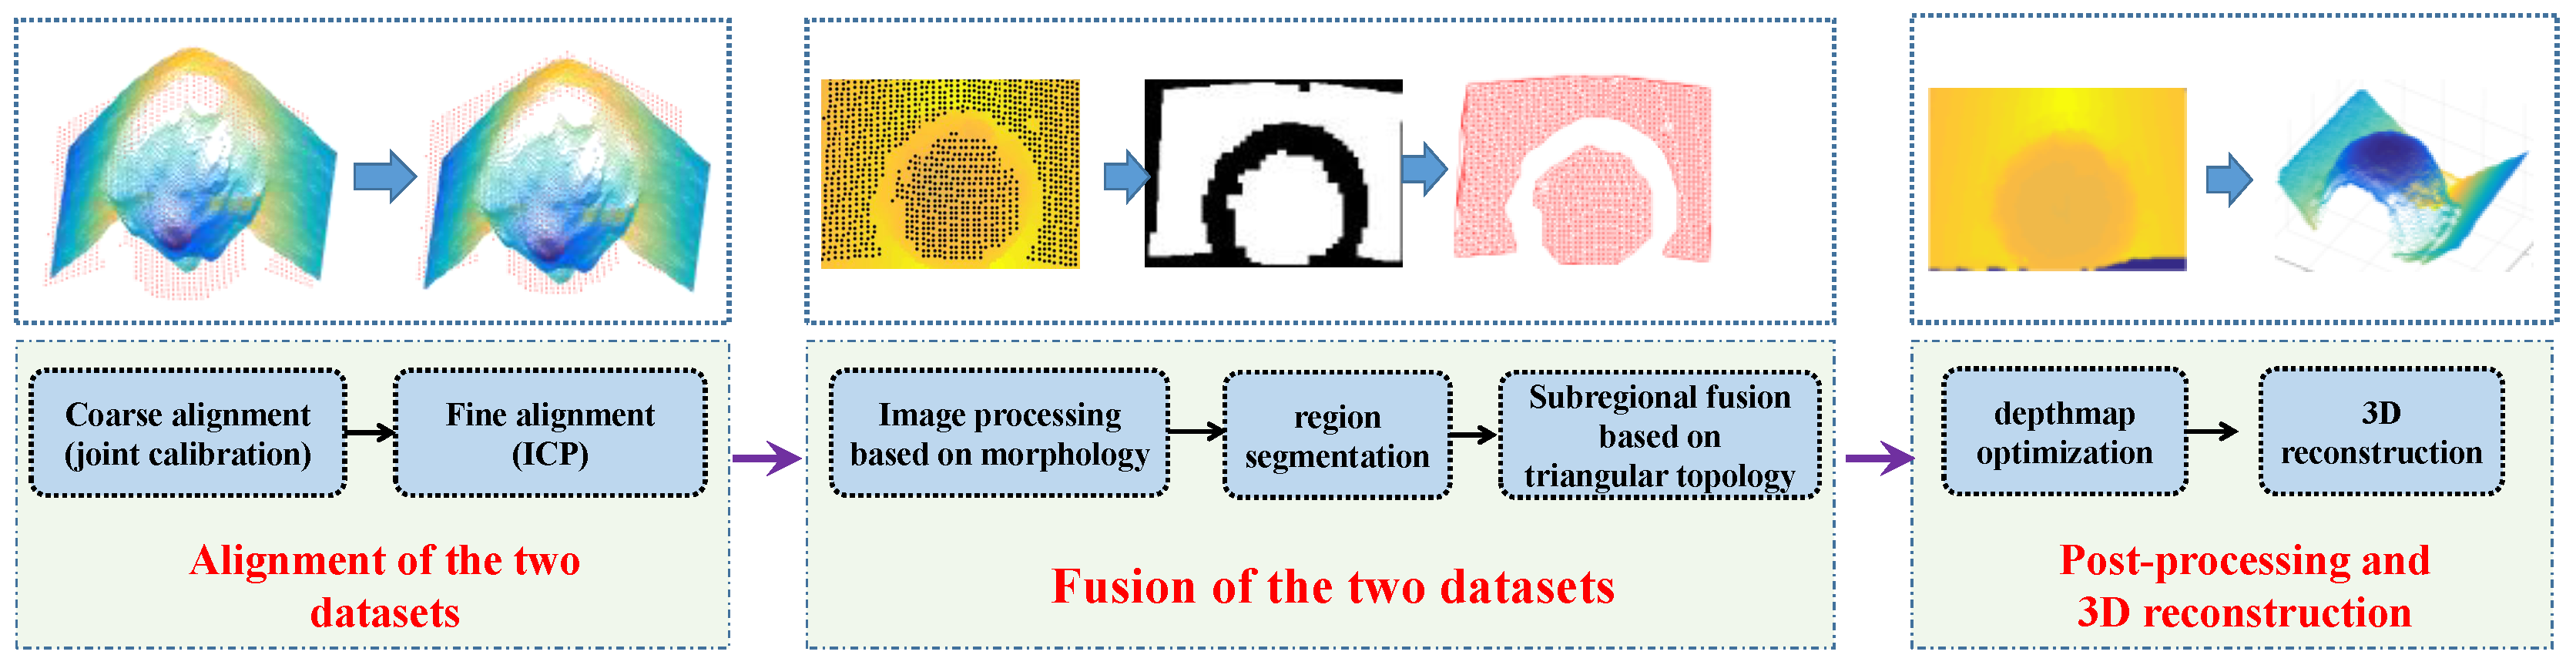
The overall algorithm pipeline is shown in
Figure 2, which includes three key procedures: data alignment, data fusion, and post processing. First, the two data sets from TOF and DCSL were initially aligned based on the calibrated parameters and ICP (iterative closest point). Second, to fuse them elaborately, the whole scene was segmented into different regions based on the morphological operation. After that, the final fusion was conducted region by region. At last, the necessary post-processing method was conducted to provide better result.
3.1. Data Alignment
Data alignment is the premise of data fusion. In our system, the reconstruction results of TOF and DCSL were recovered under different coordinate systems. Therefore, the first step is to align them in the same coordinate system. Let be TOF’s 3D point set with points denoted : for . Similarly, let be DCSL’s 3D point set with points denoted : for . The goal of data alignment is to make and as close as possible. In this paper, two steps of data alignment were adopted: coarse alignment and fine alignment.
Coarse alignment. Coarse alignment was conducted based on the calibrated stereo parameters between the TOF camera and DCSL camera. This is a typical stereo calibration procedure, and the optimal stereo calibration method in [
21] was adopted here. Through this method, the relative transformation
between these two systems can be determined. When both datasets have been retrieved, they can be initially unified by transforming DCSL data into the TOF camera’s coordinate system. Notably, it is necessary and better to put the DCSL camera and the TOF camera as close as possible in practice. In this way, the 3D information recovered by two different systems will have similar perspectives, which allows for a better fusion effect.
Fine alignment. After coarse alignment, the two data sets have been initially aligned, yet their positions may still mismatch. Therefore, fine alignment procedure is necessary. Here the accelerated ICP (iterative closest point) [
22] was adopted to estimate the finer position and orientation relationship
between two data sets. Through this method,
can be finely aligned to
by:
.
3.2. Data Fusion
After data alignment, data fusion can be conducted. However, because of the fact that large deviations may possibly exist in TOF data, it is a big challenge to fuse two datasets in 3D space directly. In this work, we tried to fuse them in 2.5D space, that is, the depth map space. The main procedures include depth remapping, region segmentation and sub-regional data fusion.
3.2.1. Calculate the Remapping Depth Information of the Aligned Point Clouds
First, calculate the remapping depth information of the aligned TOF and DCSL data through the following Equation (1),
In Equation (1), the symbol
denotes the round-up operator.
is the 3D coordinates of the point
. For TOF data,
. For the DCSL data,
.
and
denote the focal length and the image plane’s principal point of the TOF camera respectively. The depth value at the pixel
is
. By Equation (1), the depth map of TOF data and the aligned DCSL data can be achieved. Take the target scene in
Figure 1 as an example, the remapping depth maps are shown in
Figure 3.
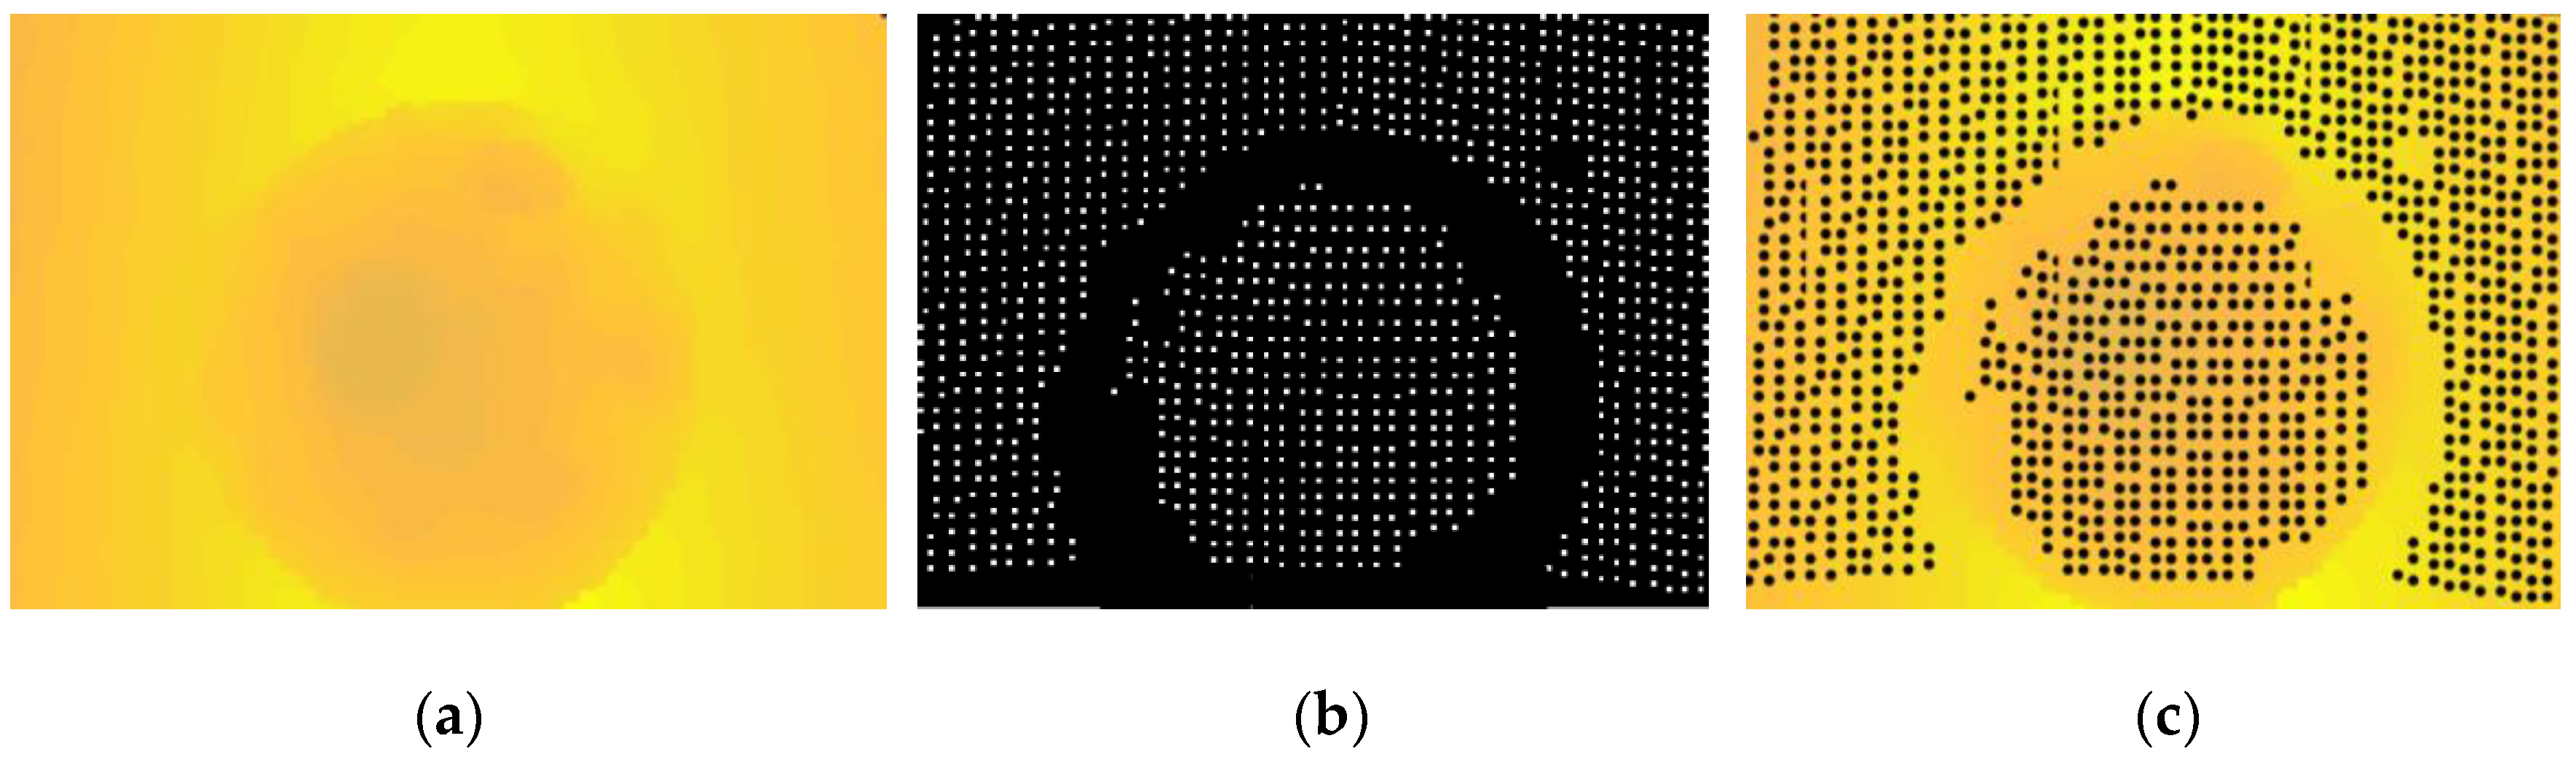
As can be seen from
Figure 3, there are some difficulties in fusing depth maps. First, limited by the working principle of DCSL, only continuous surfaces have effective data, such as the spherical surface and the background wall as displayed in
Figure 3b. In other words, DCSL cannot handle discontinuous regions. Yet thanks to the opposite characteristics of TOF, the depth information in discontinuous regions can be retrieved smoothly. Considering that, we developed the basic fusion strategy: in continuous regions, DCSL data was utilized to correct TOF data to improve accuracy, and in depth-discontinuous regions, TOF data was filled to guarantee completeness of the whole target scene. From this point, we adopted a sub-regional fusion strategy, which conducts fusion upon continuous and discontinuous regions separately. In continuous regions, TOF data can be corrected by DCSL data to achieve better accuracy, while in discontinuous regions where DCSL data was missing, TOF data was preserved to keep the completeness of the scene.
3.2.2. Region Segmentation in Depth Maps
In Equation (2), the symbol and denote the union and intersection sets respectively. denotes null set. and satisfies and respectively.
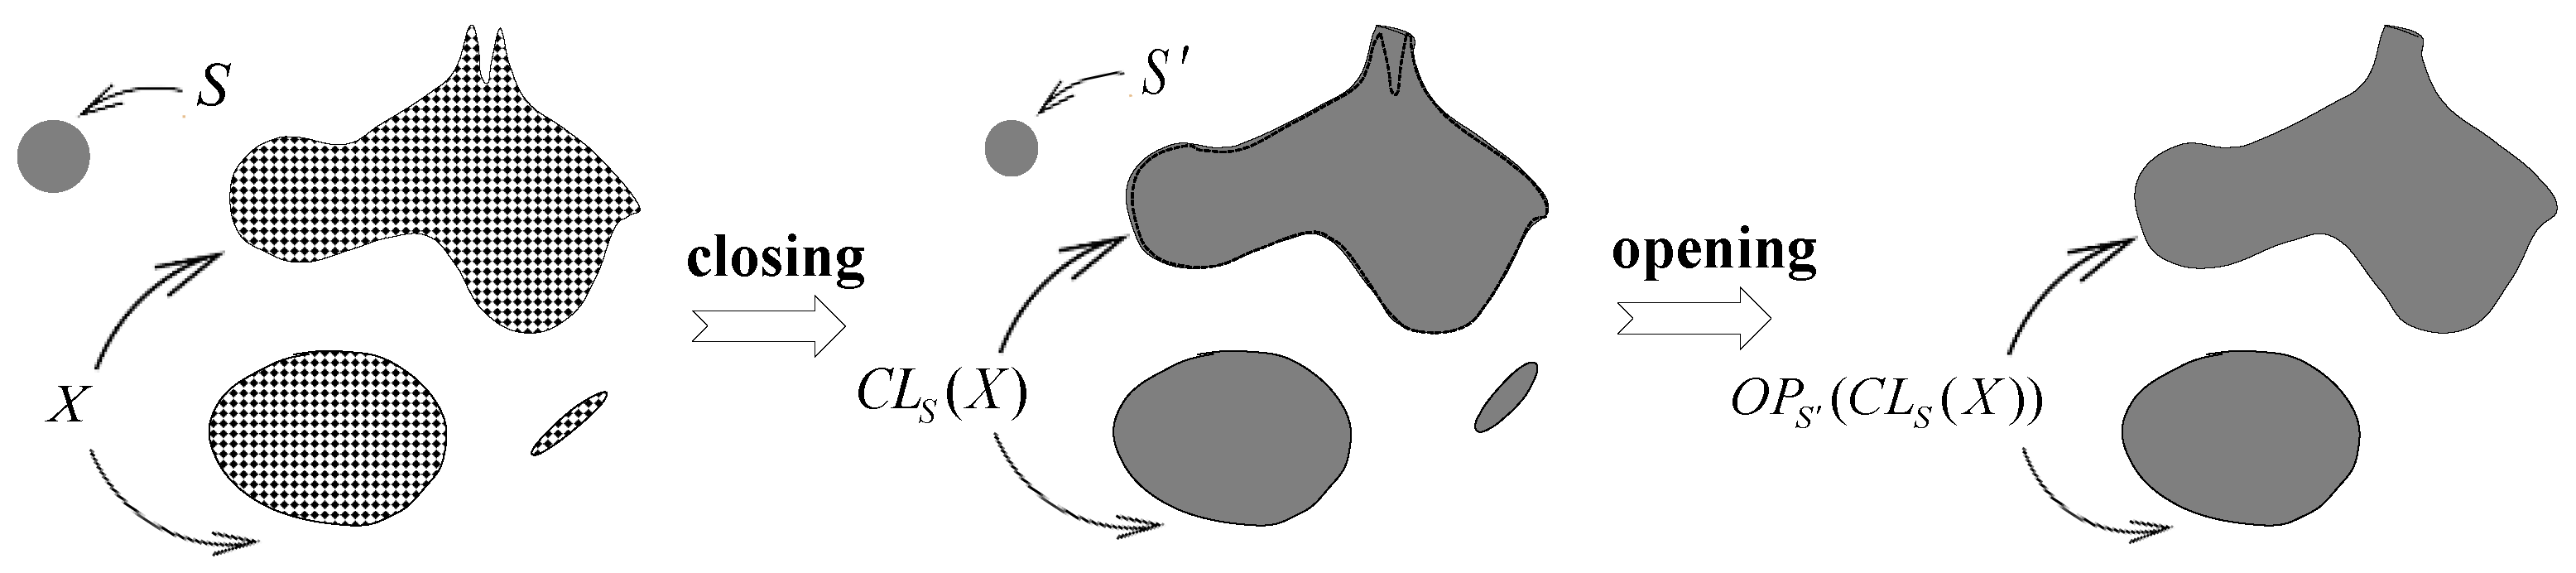
Segmentation of continuous regions. As shown in
Figure 3b, the depth data of DCSL was discrete; therefore, it is inappropriate to adopt common image segmentation algorithms directly. In this case, the morphological operation was adopted to connect adjacent pixels before region segmentation. Considering the discrete characteristic of DCSL’s depth data, a closing operation, followed by an opening operation, was conducted. The closing of the discrete depth data
by
, denoted by
, is defined as the dilation of
by a structuring element
followed by the erosion by
. In addition, the opening operation
is defined as the erosion of
by a structuring element
followed by the dilation by
. That is:
See
Figure 4 for an example of this morphological operation on discrete data.
For DCSL’s sparse data, the close operation above can help fill small holes and cracks, and the open operation can help remove isolated points, burr, and small bridges. It is noteworthy that the size and shape of structural elements have an important influence on the segmentation effect; therefore, it should be designed carefully by considering the sparsity of DCSL data in practice. Take the depth map in
Figure 3b as an example and its segmentation result with an 8 × 8 structural element in the closing operation and a 3 × 3 structural element in the opening operation was displayed in
Figure 5a. It can be observed that the whole depth map can be separated into two continuous regions, which are labeled 1 and 2 for convenience.
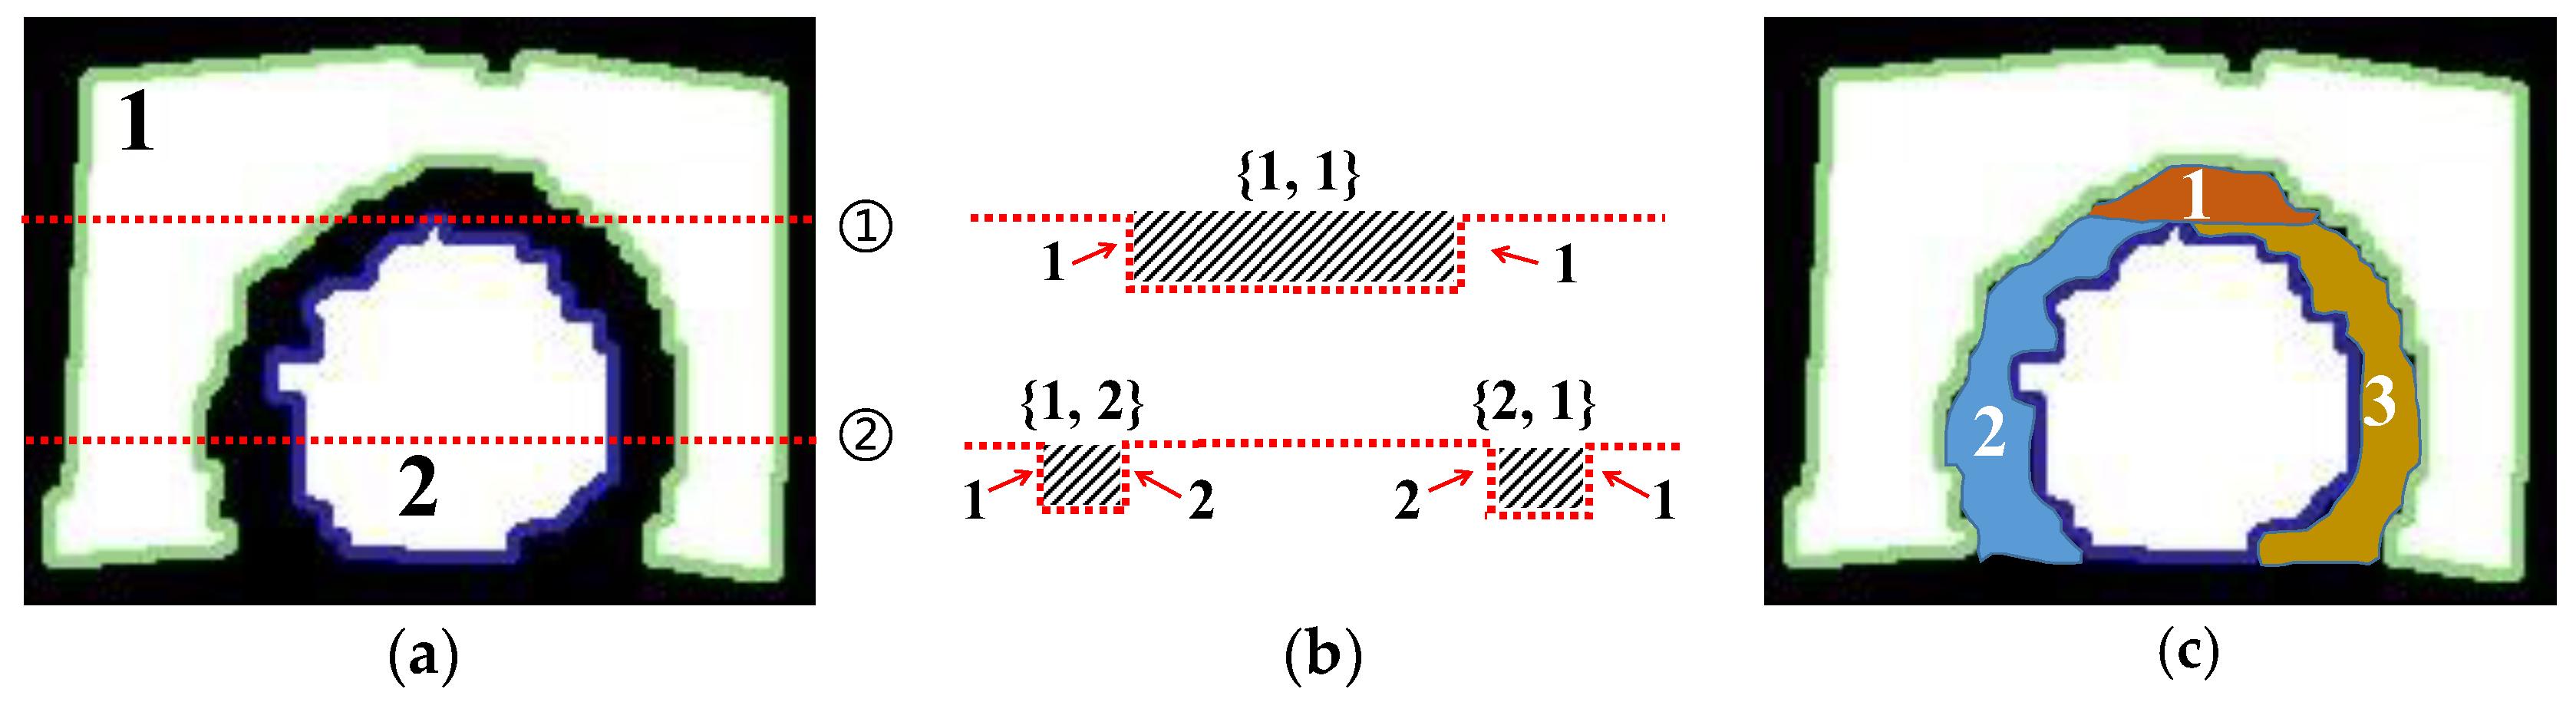
Segmentation of discontinuous regions. It is noteworthy that the discontinuous regions cannot be classified simultaneously by the above operations. In our fusion strategy, TOF data in continuous regions can be corrected by DCSL data, while in discontinuous regions, TOF data was preserved to keep the completeness of the whole scene. However, it is impossible to fill TOF data into the discontinuous regions as a whole, because TOF data may be distorted a lot in practice and great gaps may occur along the edge of filling. In this case, it is necessary to divide discontinuous regions into different sub-regions. Here we adopted a scanline-based method to finely segment different regions.
First, the canny operator was adopted to find corresponding contours of current regions, which were marked in green and blue lines as in
Figure 5a. Then, the whole image was scanned, as in
Figure 5a, from up to down. For each scanline, brightness variations will occur when meeting the detected contours, which is also the boundary between continuous and discontinuous regions. Here we denote the positions of brightness variation by the labels of the involved continuous region. Take the scanline ① in
Figure 5a,b as an example. Both the two positions where brightness variation occurs are labelled 1. Therefore, the definition of a discontinuous region can be set to be
, with
and
denoting
nearest left/right brightness variation positions respectively. Based on this definition, there are three discontinuous regions,
as displayed in
Figure 5c. In this way, all continuous and discontinuous regions of the image
as illustrated in Equation (2) can be achieved.
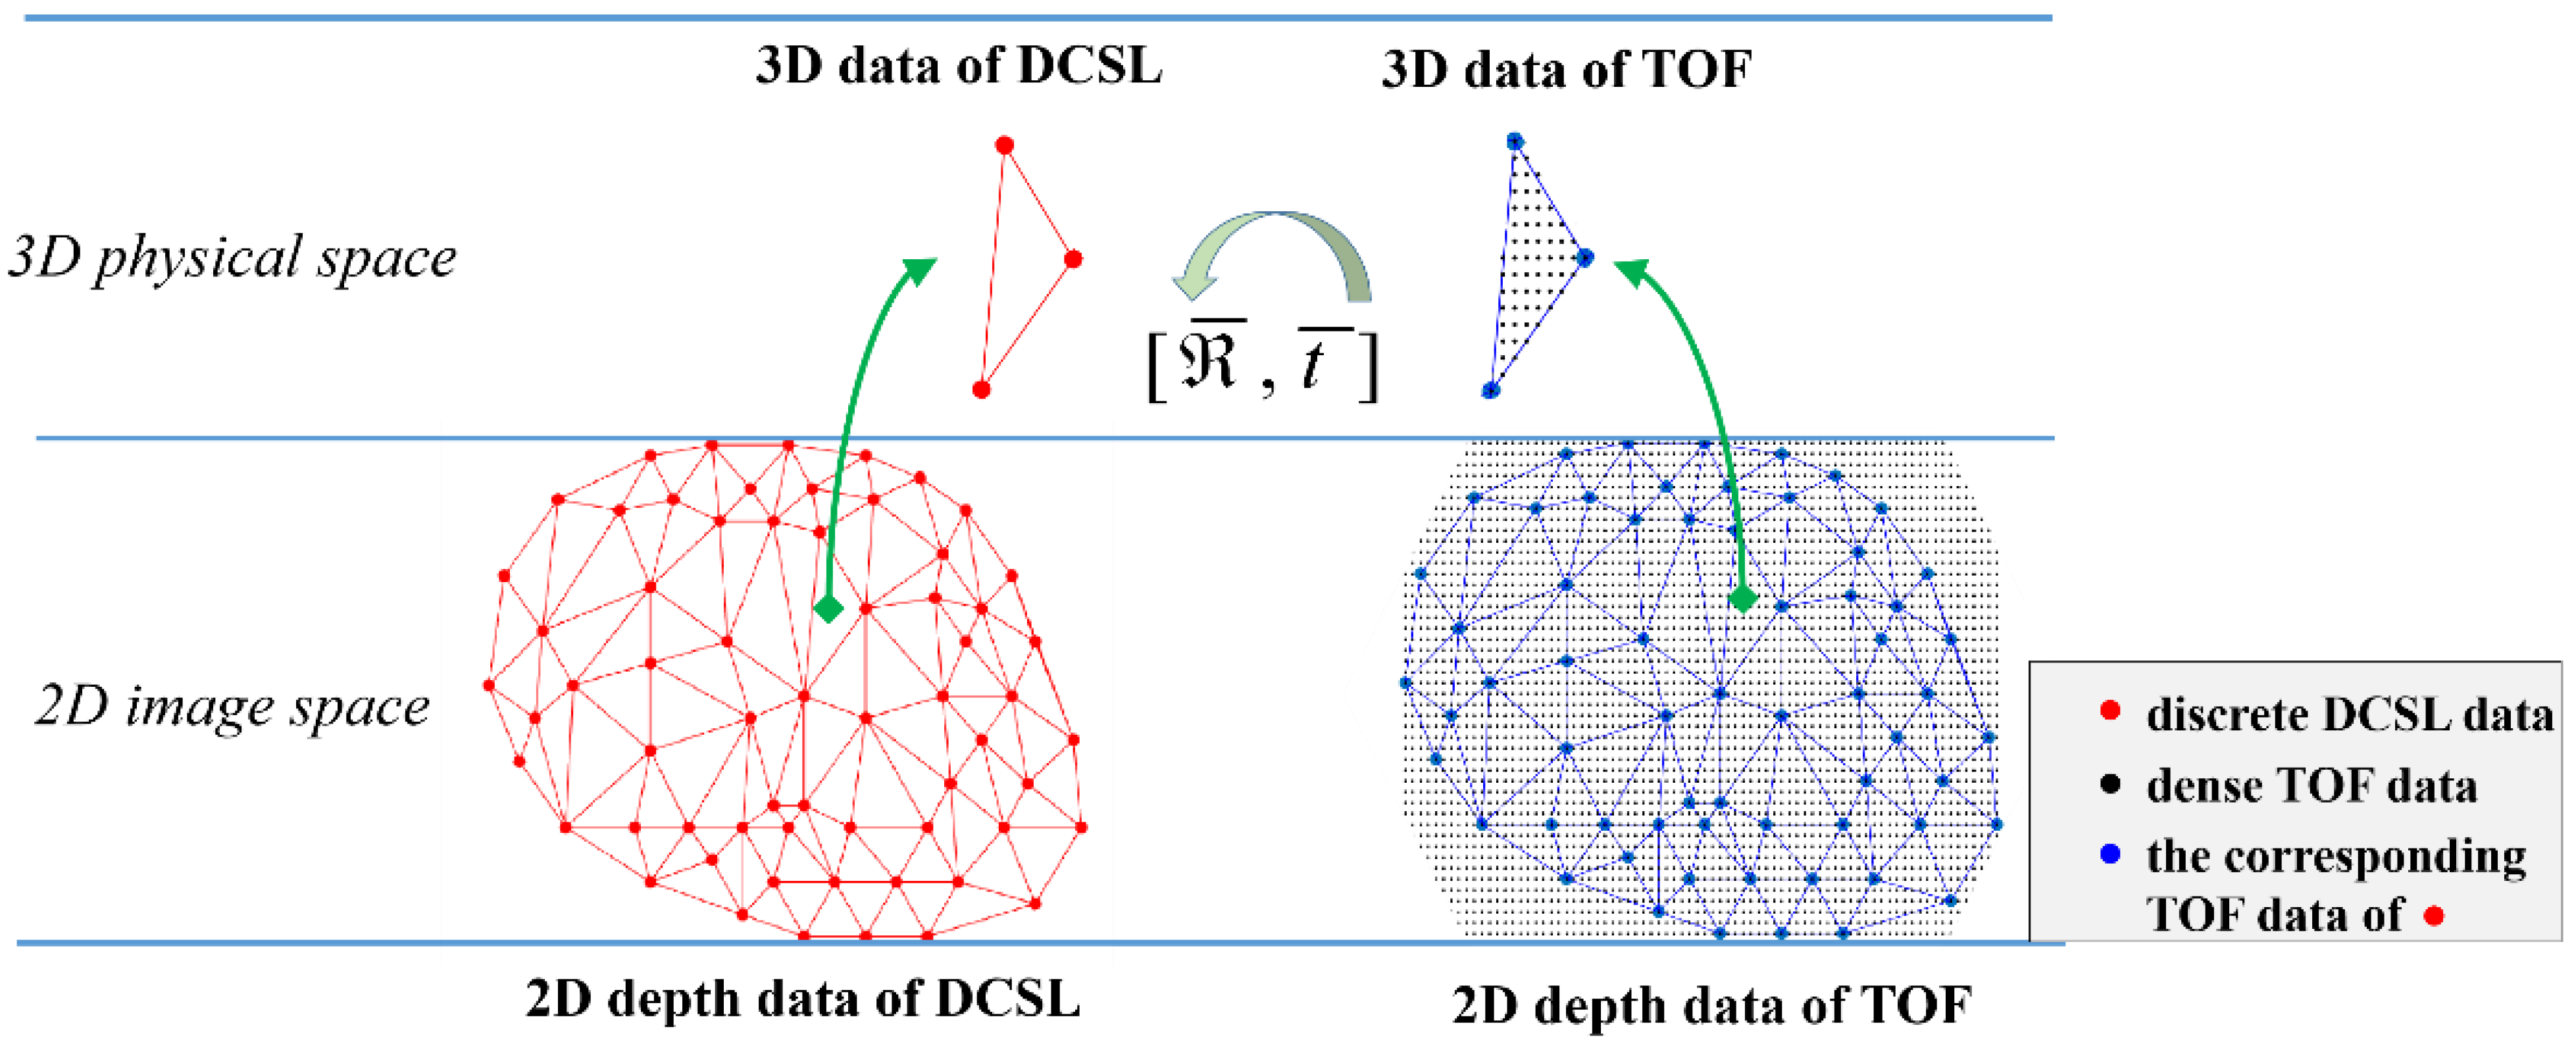
3.2.3. Sub-Regional Data Fusion
Since the depth maps of TOF and DCSL have been aligned in advance, they can be segmented synchronously into a series of continuous regions
and discontinuous regions
by the proposed method in
Section 3.2.2. After that, the data fusion can be conducted region by region. Note that DCSL data was missing in discontinuous regions; therefore, we preserve TOF data directly to keep the completeness of the whole scene, just as mentioned above. In continuous regions
, the key challenge is how to correct dense TOF data based on accurate yet discrete DCSL data. Considering the characteristics of TOF and DCSL data, a topology-based method was proposed. Take one of the continuous regions as an example. The basic procedure of fusion is displayed in
Figure 6.
First, the matching counterpart of each DCSL datum in TOF data was found. The matching result was determined to be the closest TOF point against each DCSL point in Euclidean distance. The matching point pairs of DCSL and TOF were denoted as
for simplicity. In
Figure 6, the point in
and
was marked as red and blue dots, respectively. Second, establish the Delaunay triangular topology based on
and
. Note that both
and
share the same topology structure and therefore each triangle is one to one correspondence. Then, we can improve the accuracy of the whole TOF data triangle by triangle. For every triangle in
and
, which were denoted as
and
for convenience, the best-fitting transformation that aligns
against
can be calculated based on the three vertices by adopting the method in [
23]. At last, with the calculated transformation matrix, all TOF data inside the triangle of
can be synchronously aligned against
. It can be seen that since their fusion was conducted triangle by triangle, with the overall precision being guaranteed by DCSL data, high-accuracy and high-density reconstruction can be accomplished.
3.3. Post-Processing of the Fused Depth Map
After the fusion strategy mentioned above, initial high-density and high-accuracy depth information can be achieved. However, even if the fusion is conducted delicately in sub-regions, there will still be small holes, cracks, noisy outliers, and so on. In this case, post-processing of the fused depth map was necessary. An edge-preserving filter was first adopted to smooth the depth noise while attempting to preserve edges [
1]. One-dimensional exponential moving average (EMA), with a coefficient
that determines the amount of smoothing, was used. Then, filtering was conducted by raster scanning the depth map in both axes recursively. The specific recursive equation is shown below.
Here denotes the newly recorded instantaneous depth value and denotes the EMA at any time . The symbol implies depth difference: . EMA was adopted only when neighboring pixels have a depth difference less than a pre-defined threshold . We empirically set and in practice. Then the spatial hole-filling method was used to fill small holes/cracks by making use of the neighboring left or right valid pixels within a specified radius. In this way, an optimal depth map can be achieved, and therefore more accurate reconstruction results can be obtained.
To sum up, by the fusion of TOF and DCSL data, the TOF data can be corrected by the accurate DCSL data, and the depth errors caused by MPI and surface reflectivity of the TOF camera can be effectively eliminated. At the same time, TOF data is used to fill the sparse structure of DCSL data, especially in discontinuous areas, which can greatly improve the density of reconstructed point clouds and keep the integrity of the target scene. In this way, high-accuracy and high-density 3D reconstruction can be accomplished.
4. Experimental Results
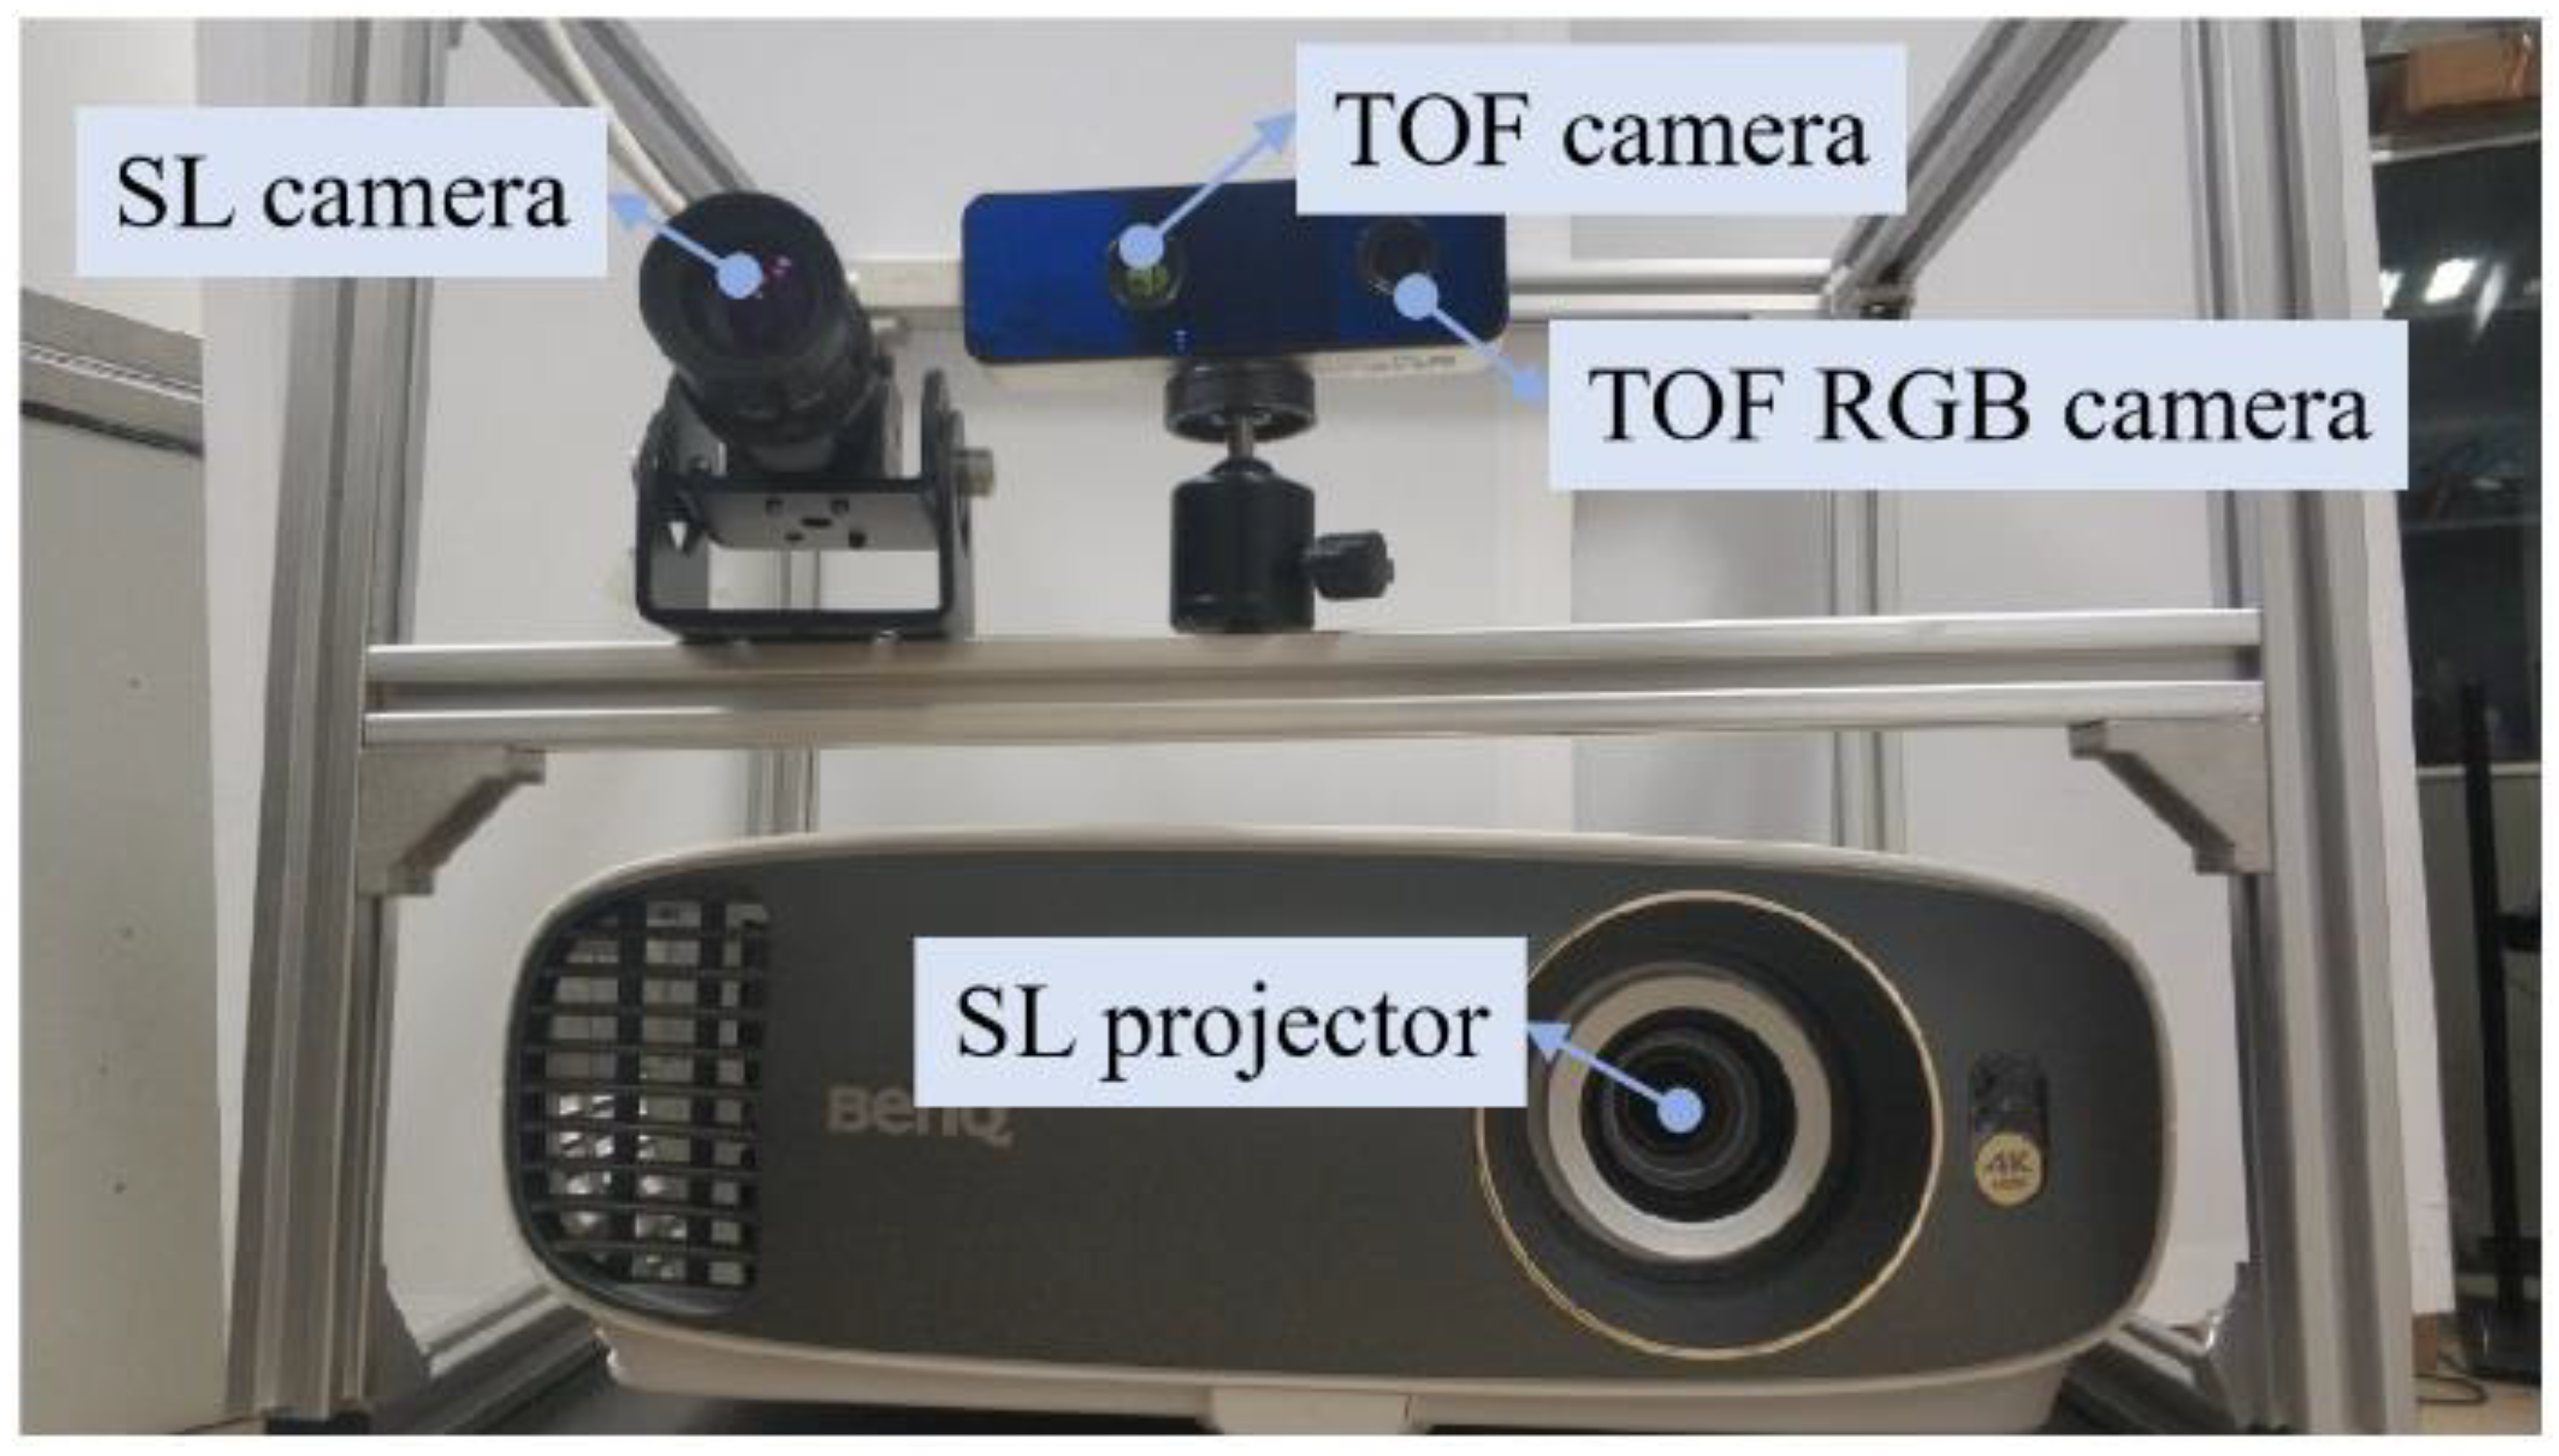
The prototype of the fusion system is shown in
Figure 7, which consists of a commercially available TOF camera (Pico Zense DCAM710, Pico Technology Co., Ltd., Cambridgeshire, UK) and a DCSL system. The TOF camera includes an infrared depth camera (640 × 480, 30 FPS) and an RGB camera (1920 × 1080, 30 FPS). The working distance of this system was 0.2~5.0 m. The DCSL system consists of an industrial camera of HIKVISION MV-CA003-21UM (640 × 480, 817 FPS, RMA Electronics, Inc., Hingham, MA, USA) and a projector of BENQ w1700s, BenQ, Taipei, Taiwan. The projector is of resolution 3840 × 2160, which has a projection ratio of 1.47~1.76:1. The calibration results of the system are shown in
Table 1.
4.1. Performance of the Proposed Fusion Method
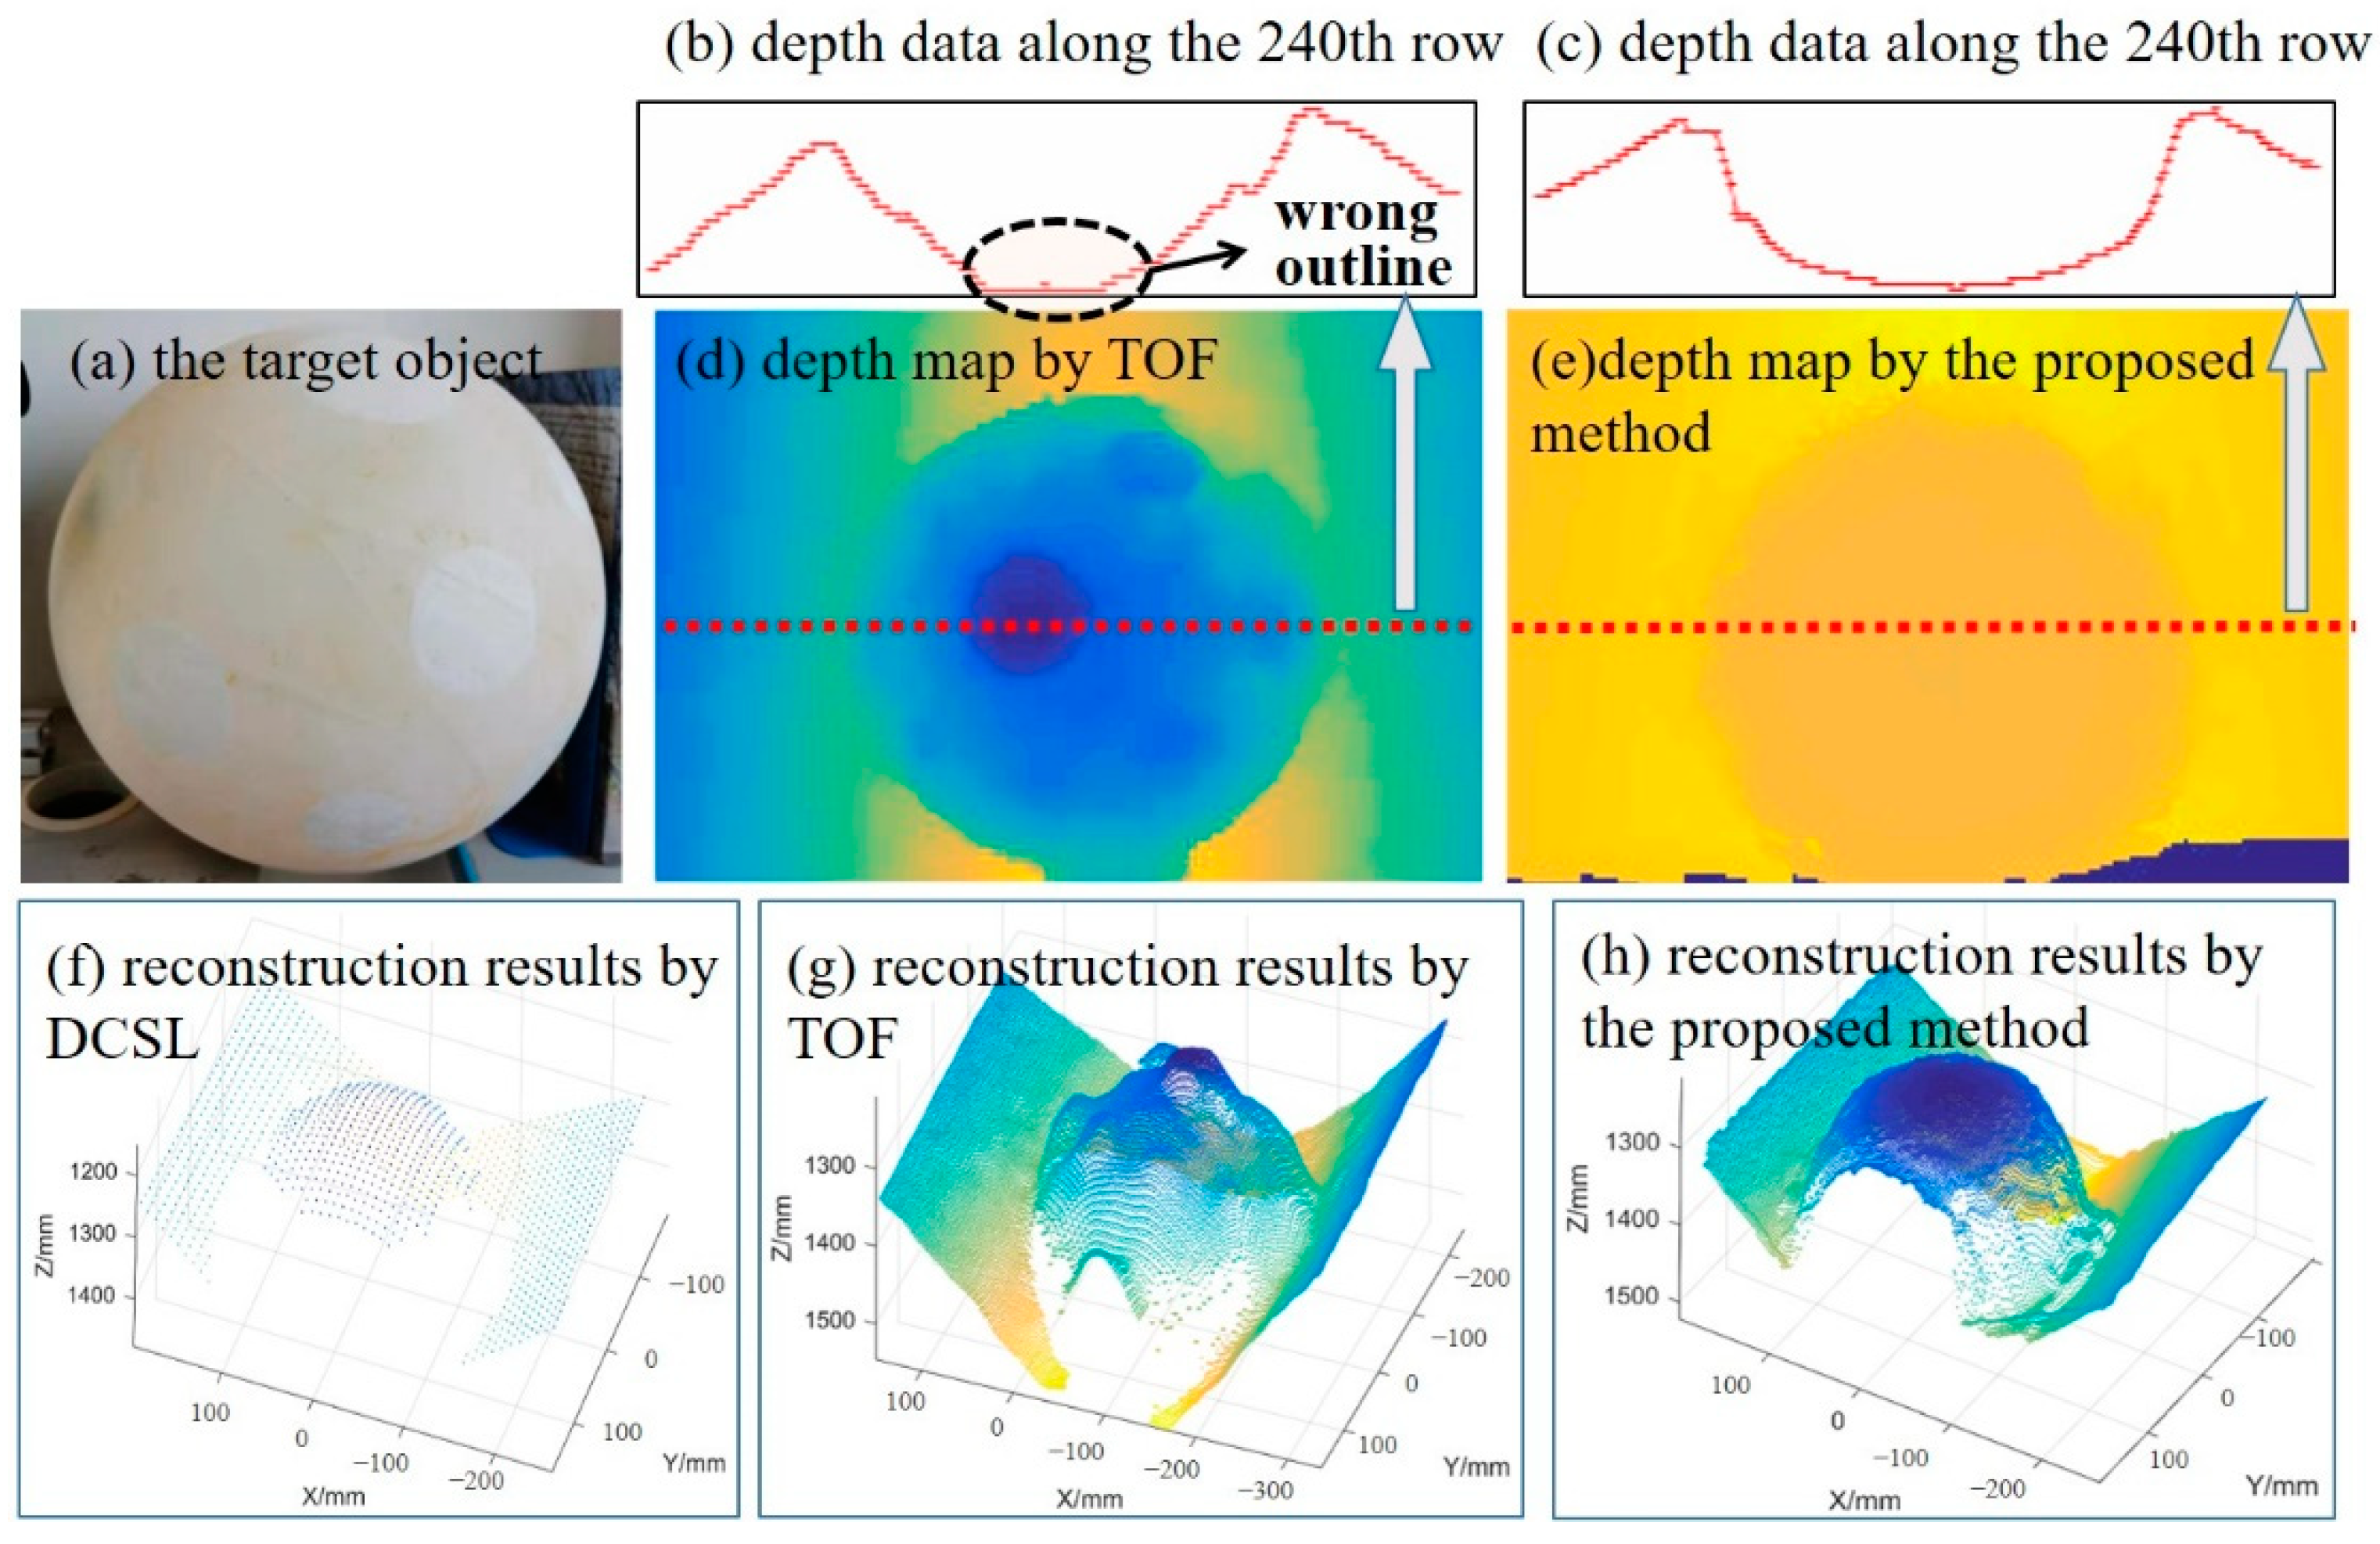
To demonstrate the benefits of the proposed fusion approach, we evaluate the accuracy of TOF, DCSL, and the proposed method comparatively in our first experiment. Two standard planes perpendicular to each other and a standard spherical surface with complex reflective properties were utilized as the measurement targets. Their reconstruction results are displayed in
Figure 8 and
Figure 9, respectively.
To evaluate the results quantitatively, experimental data were analyzed and are provided in
Table 2. Note that for two perpendicular planes, the number of reconstructed point clouds, the angle between the two planes, and the plane fitting errors were designated as the key indicators to evaluate the reconstruction effect. As for the spherical surface, the number of reconstructed point clouds, the sphere fitting error, and the diameter’s estimation error were designated as the key indicators.
Several observations can be made from this experiment. First, as shown in
Figure 8 and
Table 2, TOF can obtain much more dense point clouds, but it cannot measure perpendicular planes correctly due to MPI. Not only were the two planes reconstructed with large errors, but the intersection angle between them also shows obvious deviations. As shown in
Table 2, the angle error of TOF camera is as high as 10.05°. As a comparison, DCSL can only obtain a limited number of point clouds, but it can recover accurate 3D structures of the target objects. DCSL can handle MPI effect well, and the measured angle error was only 0.40°. The angle error of the proposed method is 0.62°. Though the accuracy is a little lower than DCSL, it is much better than TOF. Our method combines the advantages of TOF and DCSL, which can not only realize high-density point clouds, but also solve the problem of MPI. Second, it can be observed in
Figure 9 that the accuracy of TOF was largely affected by the reflectivity characteristic of target surfaces. Take the spherical surface as an example. The number of point clouds built by TOF was about 37000, while the DCSL can only build 1200 points. At the same time, the sphere fitting error of TOF data was 13.48 mm, which is mainly due to the multi-reflectivity-related deviations, while the DCSL can handle this problem well and the fitting error was only 0.54 mm. This clearly reflects their complementary characteristics. By fusing them, the proposed method obtained about 34000 points, and the sphere fitting error was 2.20 mm. This means that in our method, the final error of 3D reconstruction is greatly reduced compared with TOF under the condition of ensuring high-density performance.
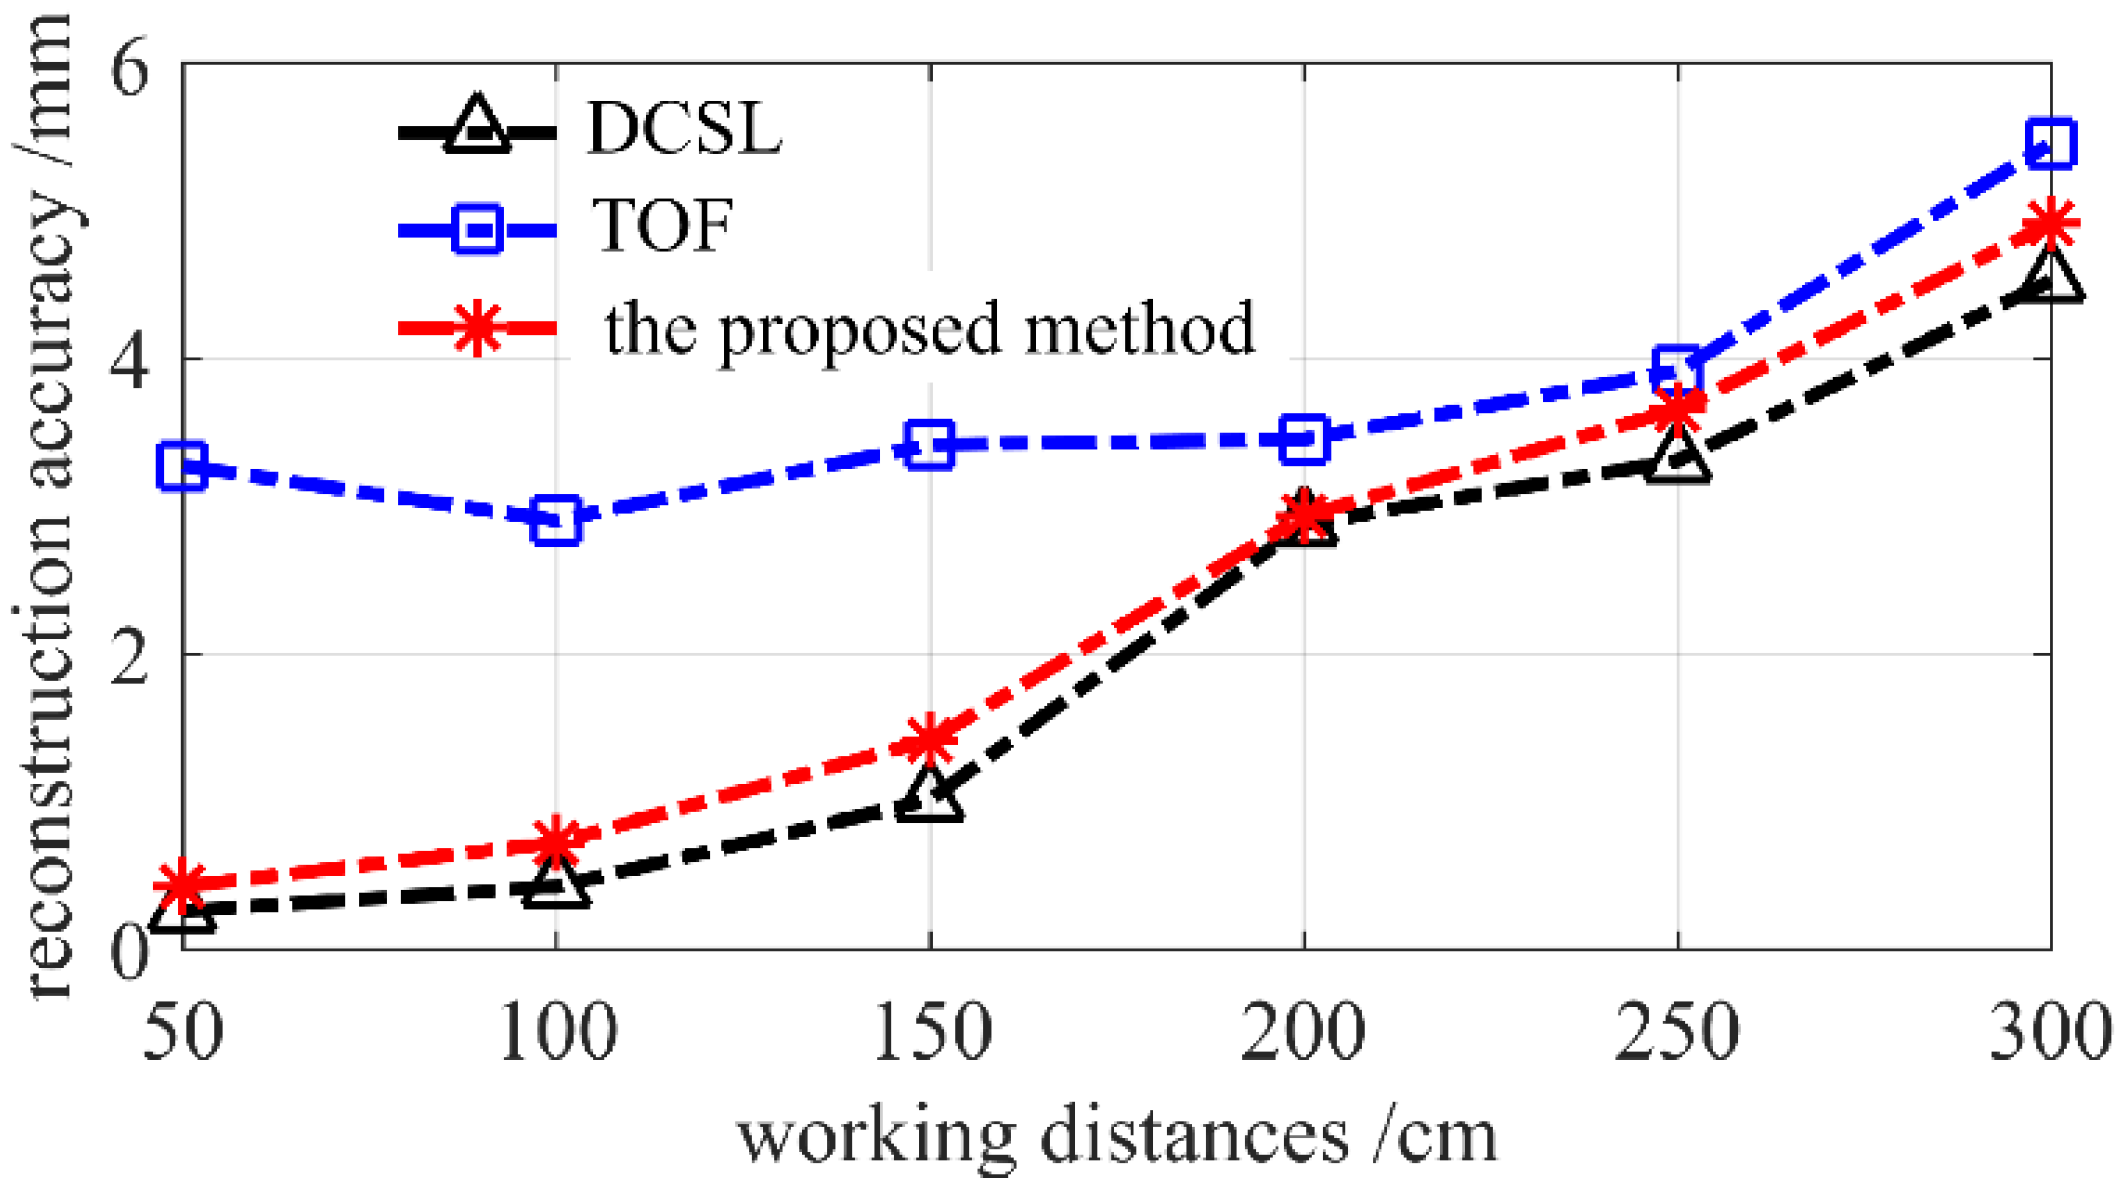
4.2. Performance of the Proposed Method in Different Working Distances
In the second experiment, the measurement accuracy of the proposed method was tested in different working distances. A standard plane which is of size 50 cm × 50 cm and owns the machining accuracy of ±5 μm was utilized as the target object. It was placed at different distances against the experimental setup and the standard deviation of the reconstructed plane was taken as the precision evaluation index. The comparative results of TOF, DCSL, and the proposed method are displayed in
Figure 10.
It can be observed in
Figure 10 that compared with TOF, the presented technique’s accuracy improves greatly at the working range from 0.5~3.0 m. Its advantage was especially obvious at the close range. Taking 1.0 m as an example, the accuracy of TOF and our method were 2.90 mm and 0.72 mm, respectively. The accuracy has been improved up to 75.17%. It is safe to conclude that by introducing DCSL into the TOF camera, submillimeter accuracy can be achieved at close range. With the increase of working distances, the advantages of DCSL become less and less obvious. This is the shortcoming of all methods that working based on the triangular reconstruction principles. Therefore, in long range, TOF begins to play an important role in our fusion method. In this way, both DCSL and TOF’s advantages can be combined effectively in real measurement.
It is noteworthy that the accuracy of the proposed method is slightly lower that DCSL method. At the working distance of 1.0 m, the accuracy of DCSL and the proposed method were 0.42 mm and 0.72 mm respectively. This is mainly because in the fusing process, the discrete data of DCSL were used to maintain the correct structure of 3D data, while local holes were filled with TOF’s dense data. Generally, the sparser the DCSL’s data, the lower the fusion accuracy. Therefore, it is easy to conclude that the sparsity of DCSL played an important role in determining the fusion accuracy. Further research and analysis was conducted in the next experiment.
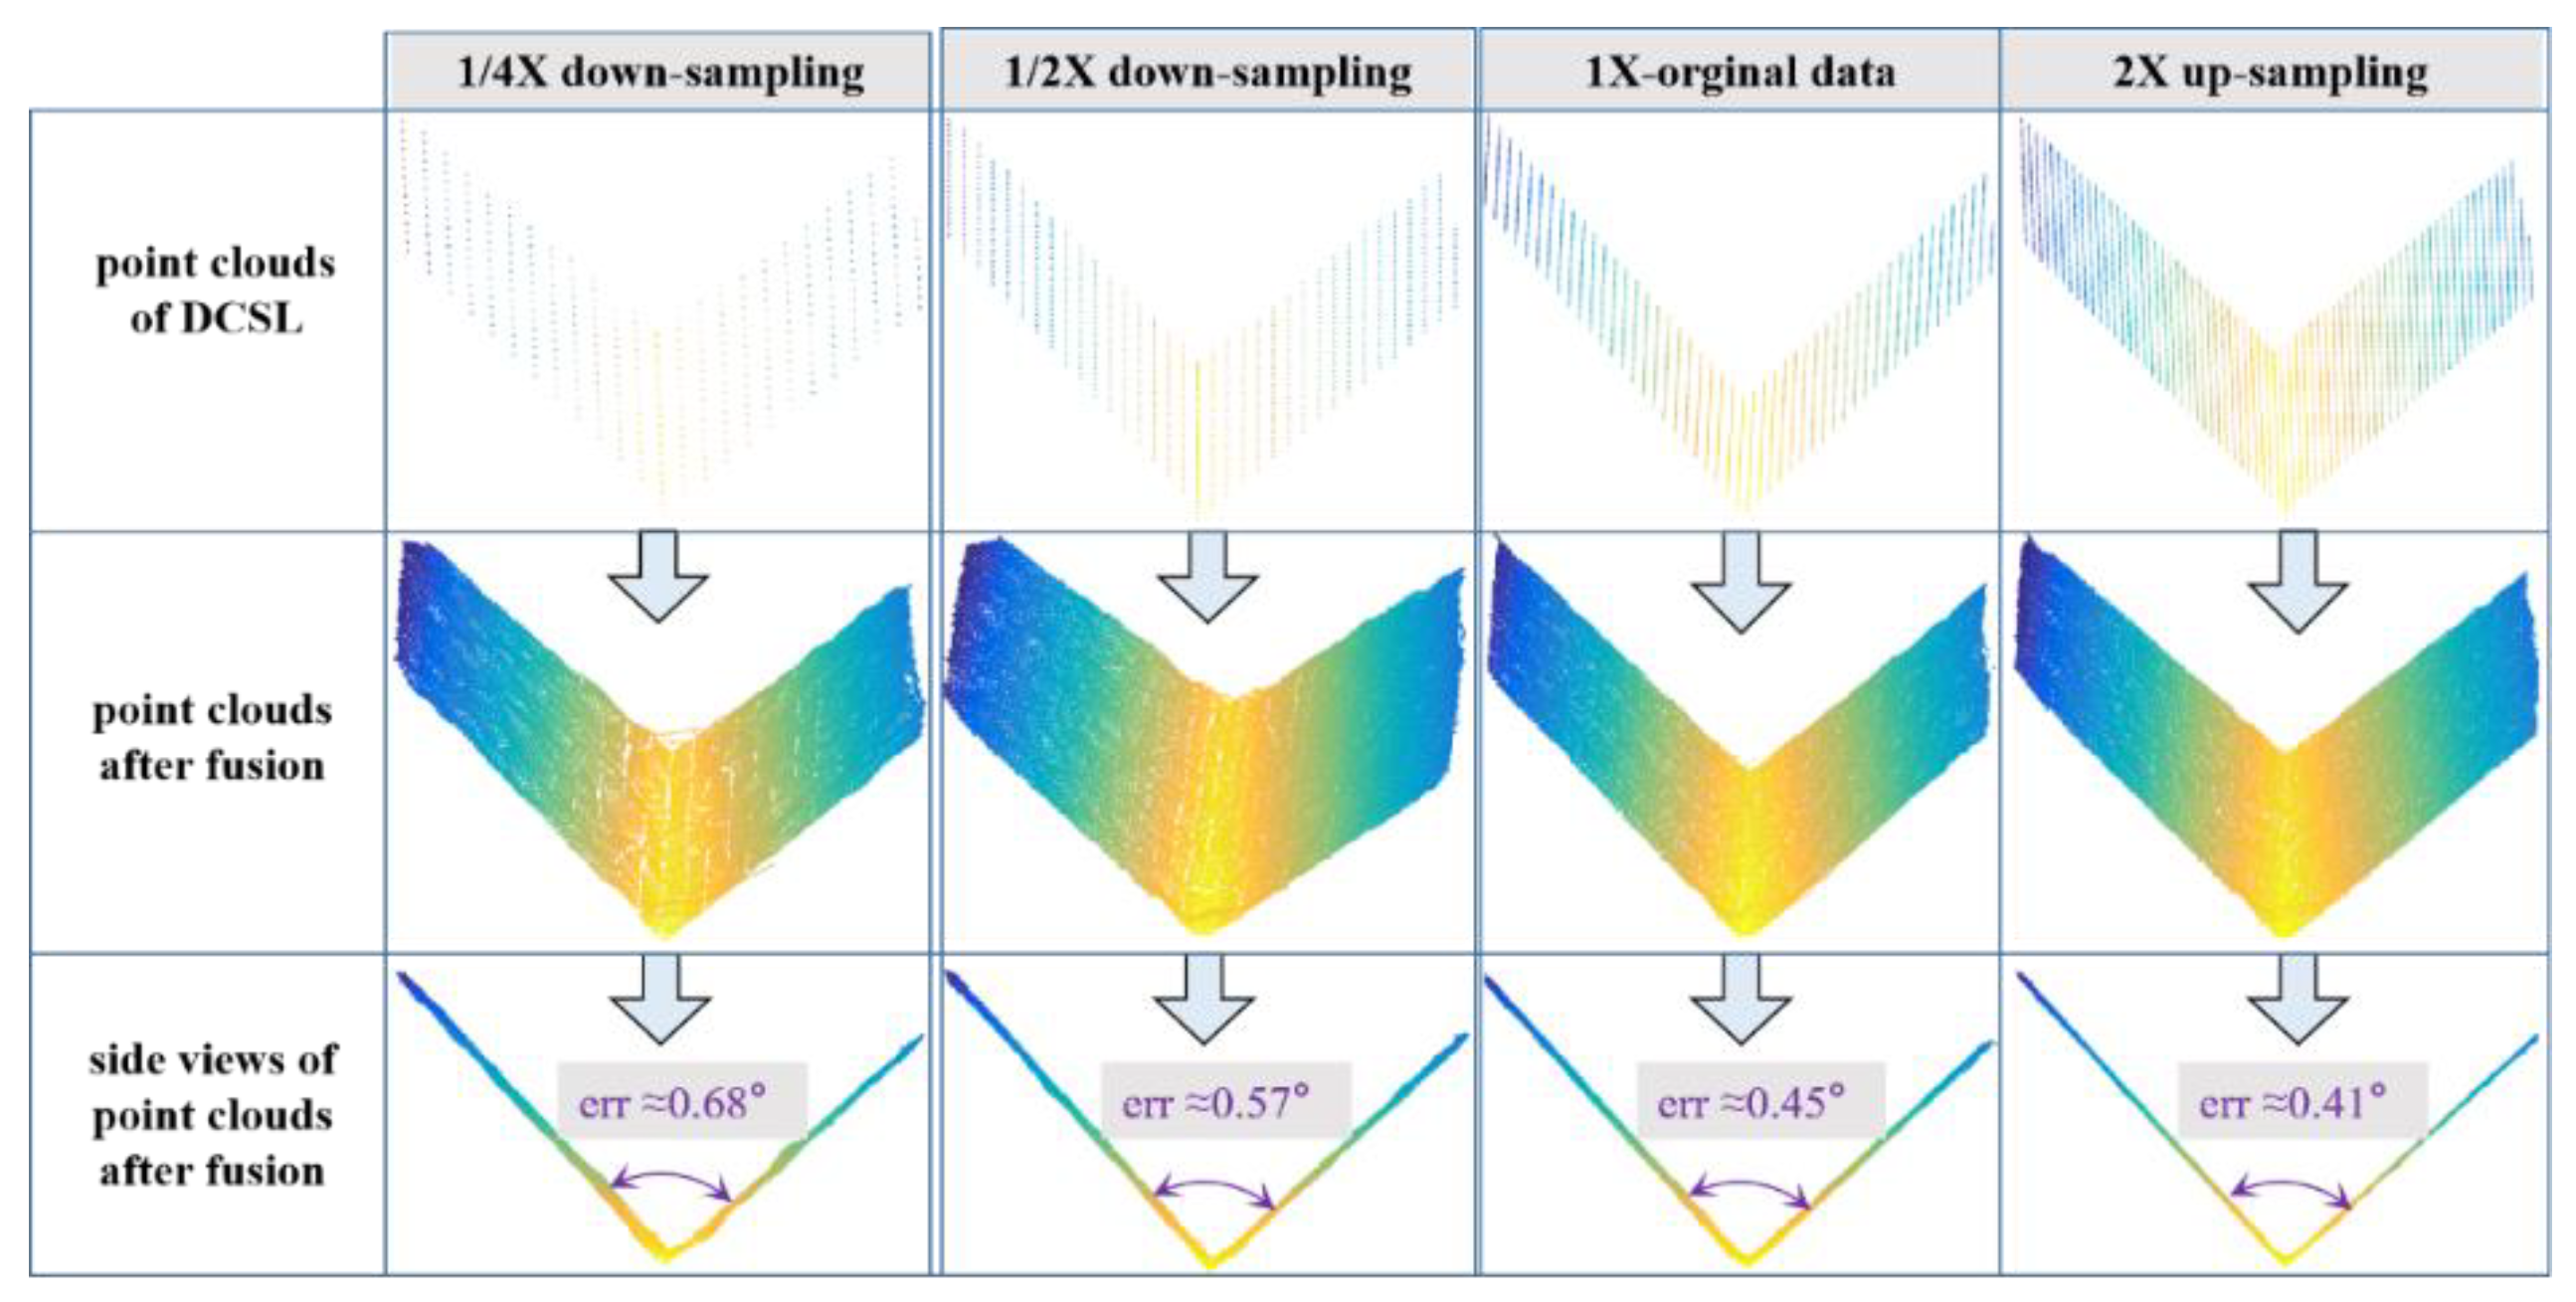
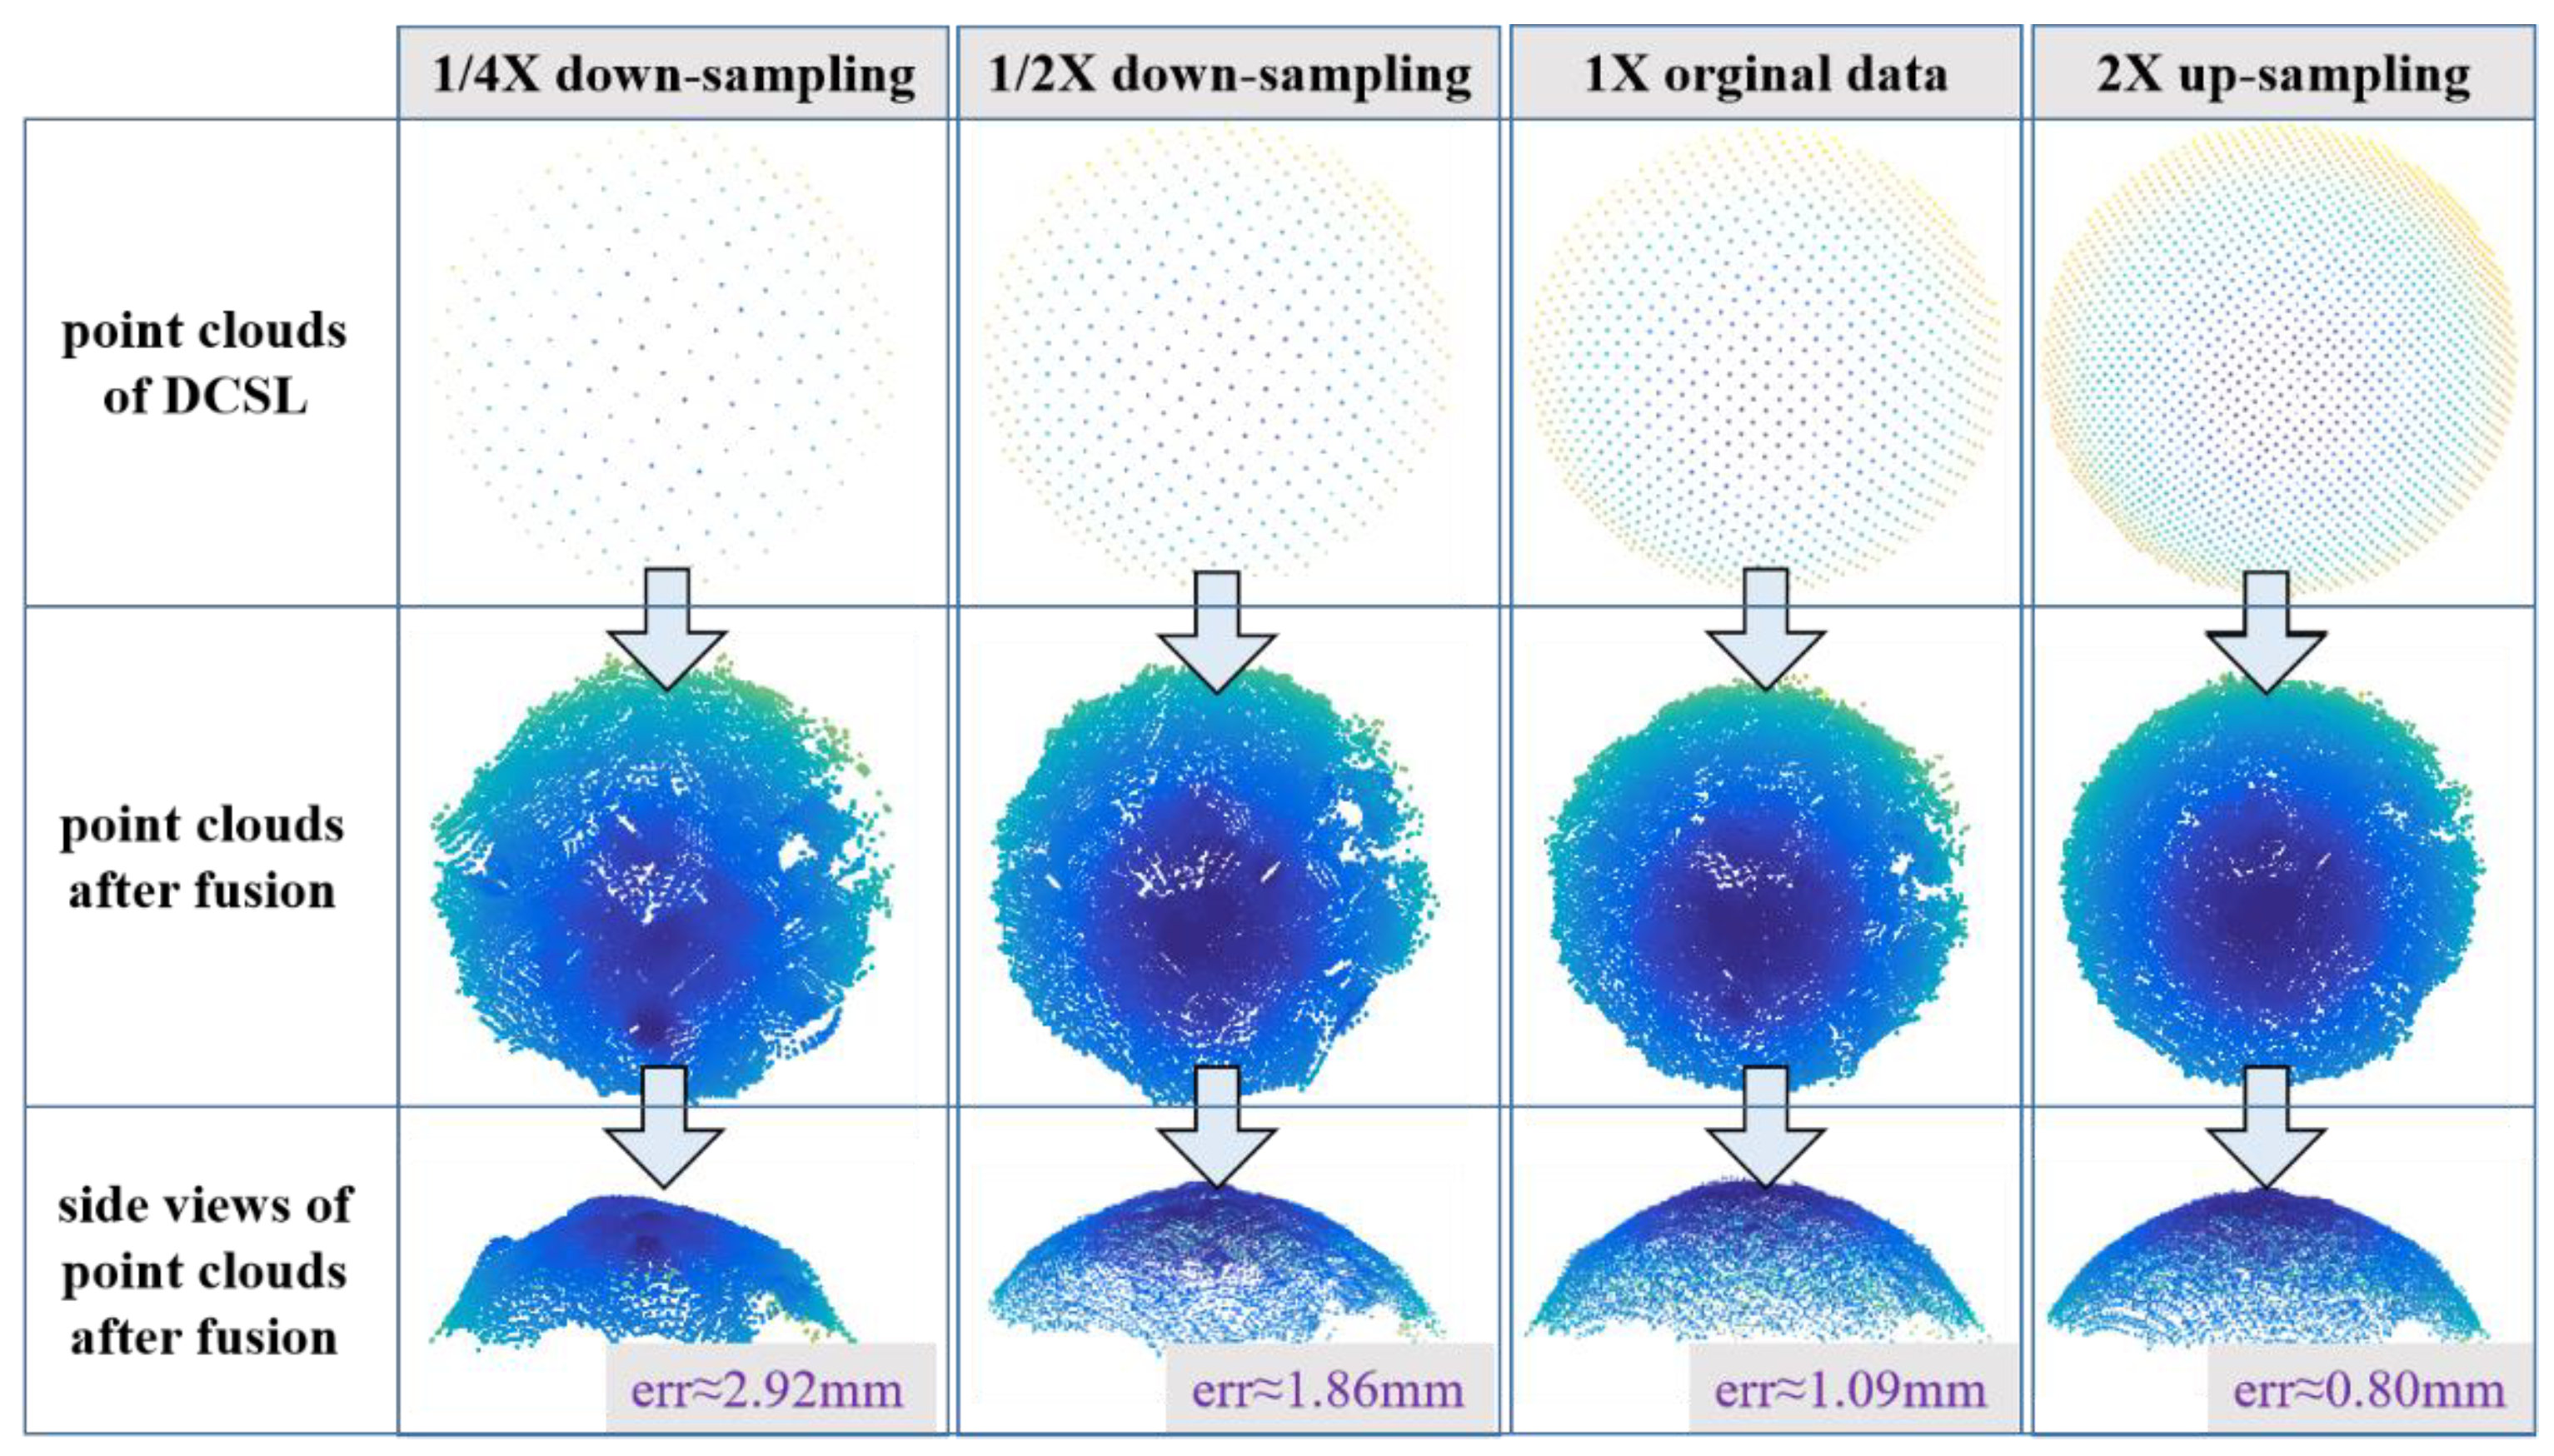
4.3. Performance of the Proposed Method w.r.t. the Sparsity of DCSL
The performance of our fusion method with regard to the sparsity of DCSL’s point clouds was explored in this experiment. The standard plane and sphere in
Figure 8a and
Figure 9a were taken as the target objects. The related TOF data remain unchanged, yet the DCSL data were sampled to simulate different sparsities. The original DCSL data were assumed to be X. Then, X was sampled with different ratios: 1/4, 1/2, 1, and 2. The results are denoted by 1/4X, 1/2X, 1X, and 2X accordingly. Note that 1/4X and 1/2X refer to the downing sampling operations and 2X refer to up sampling by data interpolation.
It can be seen from
Figure 11 and
Figure 12 that the sparsity of DCSL did have obvious effects on the final fusion accuracy. In the case of 1/4X density, the corner error of two perpendicular planes was 0.68°, while in the case of 2X density, the error was decreased to 0.41°. As for the sphere fitting errors, the error in the case of 1/4X density was as high as 2.92 mm, yet was only 0.80 mm in the case of 2X density. It is appropriate to conclude that the denser the DCSL data, the higher the fusion accuracy. This is easy to understand. The accurate DCSL data were designated as “anchor points” to keep the whole structure of target objects. More anchor points lead to higher precision. However, because the coding window of the DCSL pattern cannot be compressed to a very small size, the density of DCSL data was limited. In the practical design of the DCSL pattern, the optimal coding window should be chosen by considering both coding density and each pattern blocks’ recognition accuracy. Details refer to [
20].
4.4. Performance of the Proposed Method in Complex Scenes
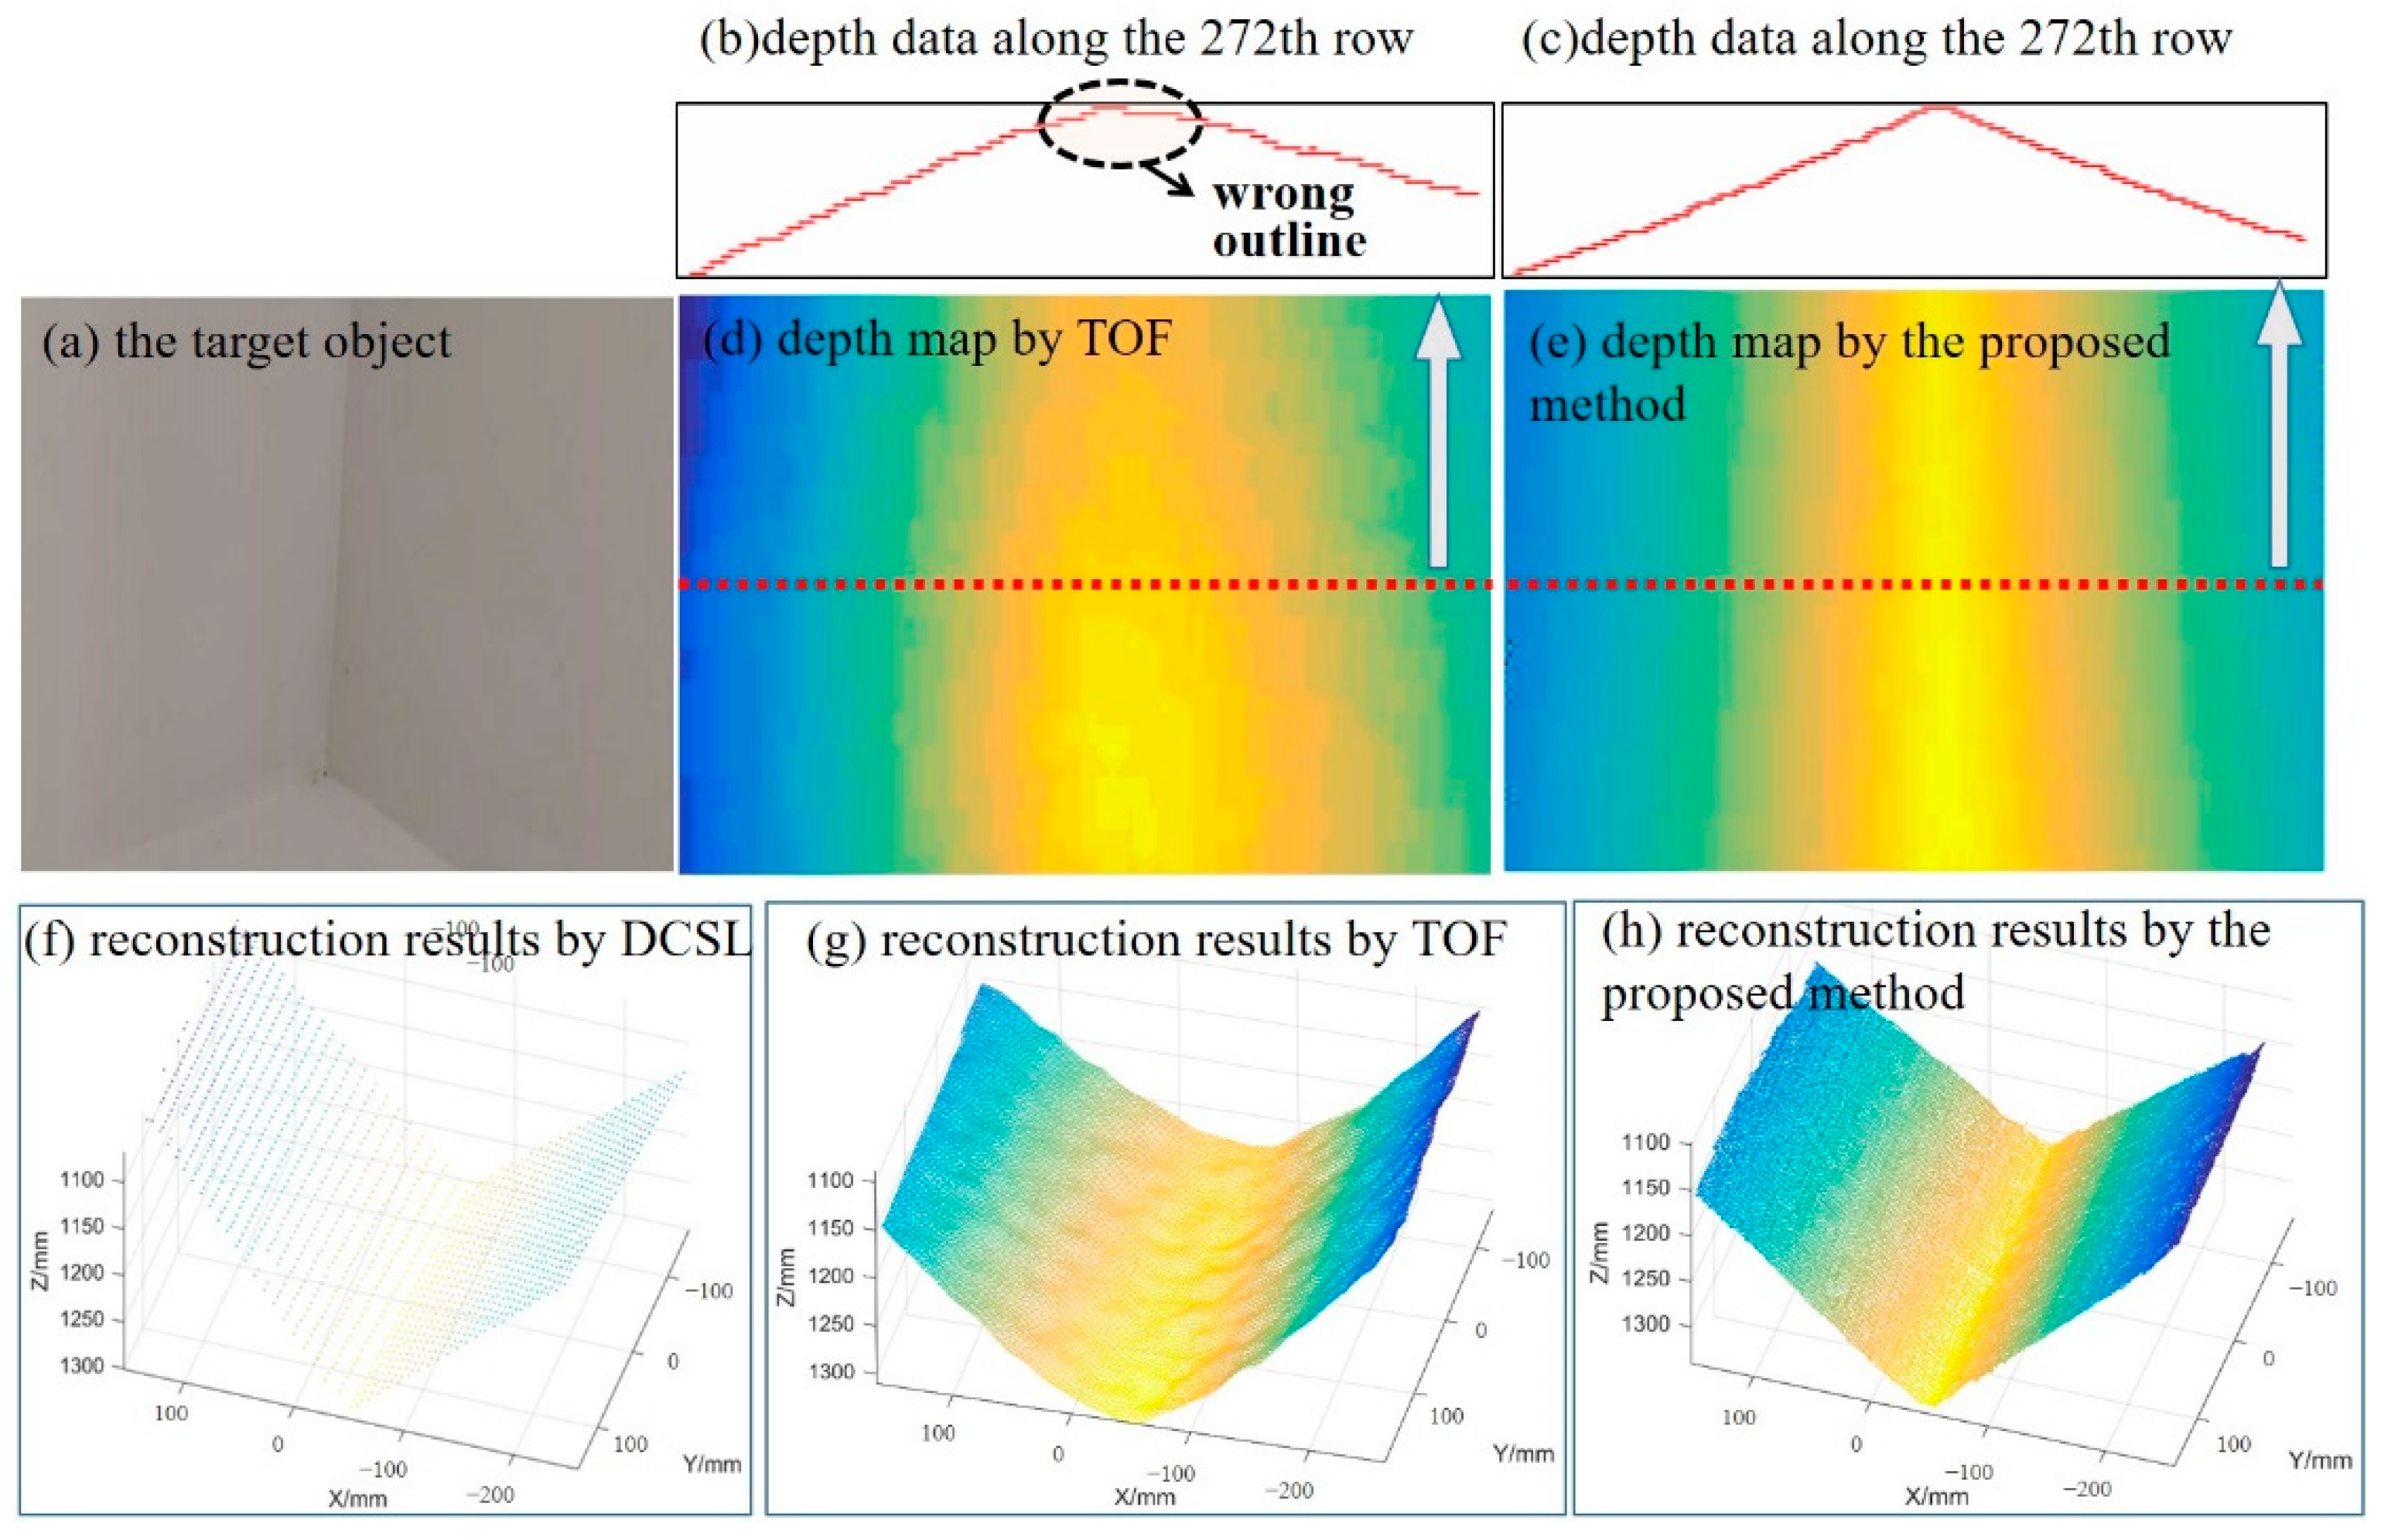
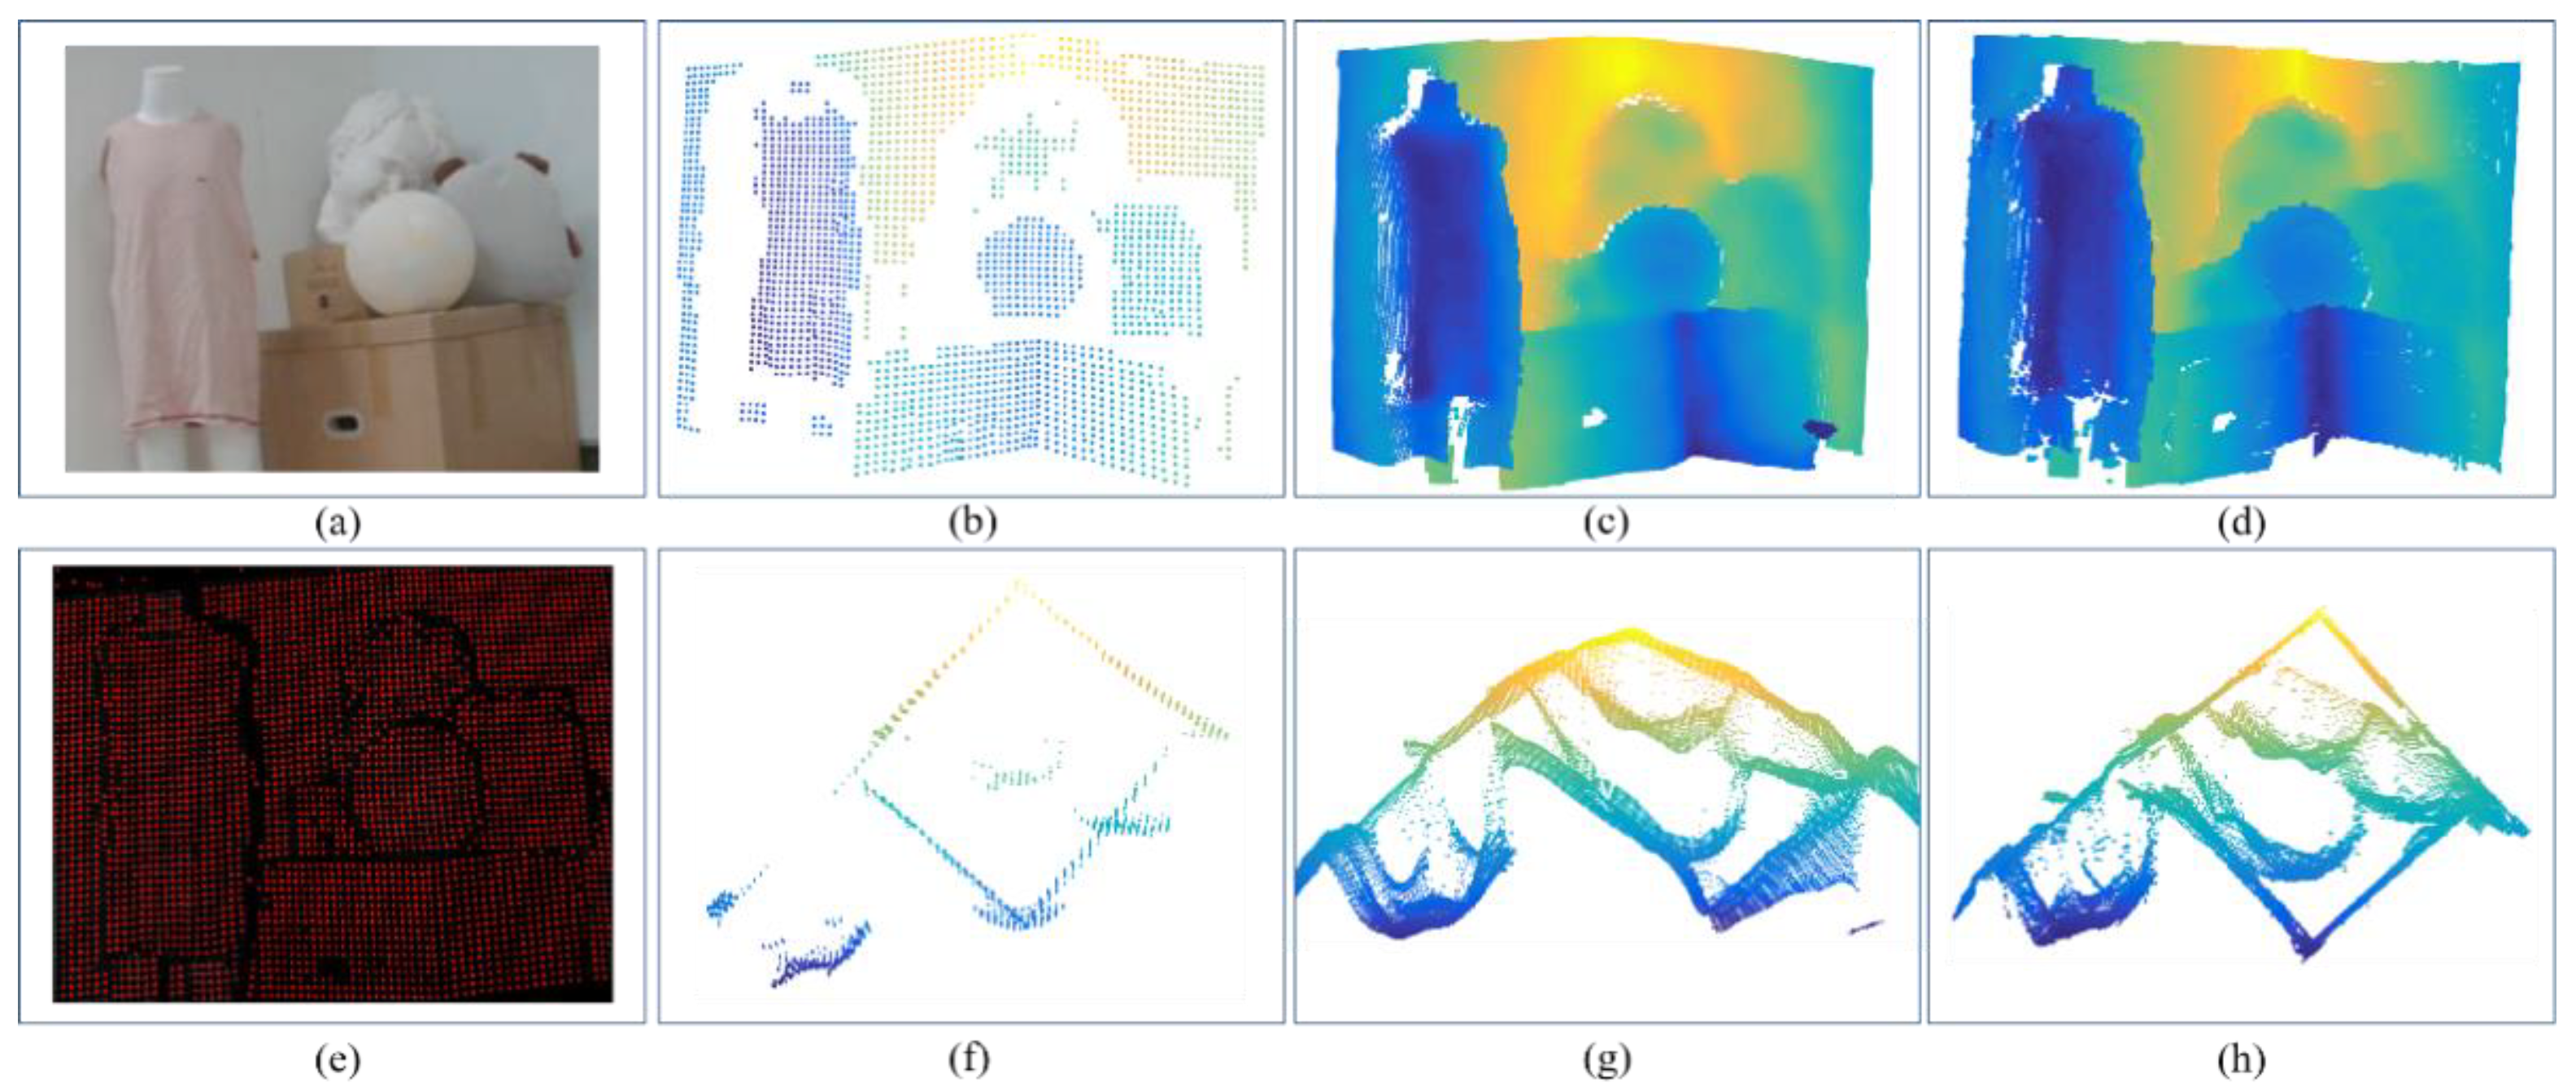
In the last experiment, we validate the performance of our fusion system in measuring complex scenes. The scenario is shown in
Figure 13a. Corners of the scene detected by using DCSL method were displayed in
Figure 13e. Point clouds reconstructed by DCSL, TOF, and the proposed method were put in
Figure 13b–d respectively. As shown in
Figure 13g, the cardboard box below the ball and the background wall show great deviations due to the MPI effect of TOF, while by introducing the accurate DCSL data, the whole structure of the target scene can be kept effectively. In this way, 3D depth information can be recovered densely and accurately.
5. Discussion
With the advent of the 5G era, mobile intelligent terminals such as mobile phones have become crucial portals for 3D visual data and AI perception. TOF and structured light, as the two most popular technologies applied at intelligent terminals, have been deeply and widely researched in recent years. However, both of them have their advantages and disadvantages. This paper explored a new 3D vision technology for intelligent terminals, which is a combination of these two mainstream depth cameras. Extensive experimental results validated that in our method, the MPI and reflectivity-related distance variations of TOF can be effectively eliminated. This shows great potential to accomplish high-accuracy and high-quality 3D measurement task at intelligent terminals, for example, 3D face accurate recognition, and 3D visual guidance and so on. In our next step, we will focus on developing miniaturized devices that can be inserted into intelligent terminals. Possible improvements include making TOF and DCSL share a common camera, designing miniaturized projection devices based on diffractive optical elements etc. In addition, a new fusion strategy based directly on the point clouds will also be explored. It should be pointed out that there may be new challenges and problems in developing miniaturized devices. For example, if TOF and DCSL share a camera, interference phenomenon may affect the reconstruction results, which will be considered in our future research.


