Article

Improvement of Retinal Images Affected by Cataracts

by
Enrique Gonzalez-Amador
1,2,
Justo Arines
3,4,*,
Pablo Charlón
5,6,
Nery Garcia-Porta
3,
Maximino J. Abraldes
7,8 and
Eva Acosta
2,4
1
Optics Laboratory, Universidad Politécnica de Tulancingo, Calle Ingenierías 100, Tulancingo 43629, Mexico
2
Departamento de Física Aplicada, Facultad de Física, Campus Vida, Universidad de Santiago de Compostela, 15782 Santiago de Compostela, Spain
3
Departamento de Física Aplicada, Facultad de Óptica y Optometría, Campus Vida, Universidad de Santiago de Compostela, 15782 Santiago de Compostela, Spain
4
iMatus Research Institute, Campus Vida, Universidad de Santiago de Compostela, 15782 Santiago de Compostela, Spain
5
Instituto Oftalmológico Victoria de Rojas, 15009 A Coruña, Spain
6
Hospital HM Rosaleda, 15701 Santiago de Compostela, Spain
7
Service of Ophthalmology, Complejo Hospitalario Universitario de Santiago de Compostela, 15706 Santiago de Compostela, Spain
8
CIMUS, University of Santiago de Compostela, 15782 Santiago de Compostela, Spain
*
Author to whom correspondence should be addressed.
Photonics 2022, 9(4), 251; https://doi.org/10.3390/photonics9040251
Submission received: 1 March 2022 / Revised: 6 April 2022 / Accepted: 8 April 2022 / Published: 10 April 2022
(This article belongs to the Special Issue Ocular Imaging for Eye Care)

Abstract

:
Eye fundus images are used in clinical diagnosis for the detection and assessment of retinal disorders. When retinal images are degraded by scattering due to opacities of the eye tissues, the precise detection of abnormalities is complicated depending on the grading of the opacity. This paper presents a concept proof study on the use of the contrast limited adaptive histogram equalization (CLAHE) technique for better visualization of eye fundus images for different levels of blurring due to different stages of cataracts. Processing is performed in three different color spaces: RGB, CIELAB and HSV, with the aim of finding which one better enhances the missed diagnostic features due to blur. The experimental results show that some fundus features not observable by naked eye can be detected in some of the space color processed with the proposed method. In this work, we also develop and provide an online image process, which allows clinicians to tune the default parameters of the algorithm for a better visualization of the characteristics of fundus images. It also allows the choice of a region of interest (ROI) within the images that provide better visualization of some features than those enhanced by the processing of the full picture.

1. Introduction

Cataract is a common eye condition which cause vision loss due to opacity of the crystalline lens. Its development is related with genetics, aging, systemic or ocular pathologies, or injuries [1]. The loss of vision is manifested by a reduction in contrast due to scattering at the tissues. This pathology not only limits vision to patients, but also can impede visualization of the eye fundus, confusing or complicating the diagnosis of ocular pathologies such as age-related macular degeneration or Stargardt disease [2], retinal detachment, diabetic retinopathy [3], or visceral leishmaniasis [4]. Systemic illness, such as diabetes, not only affects the eye fundus, inducing retinal hemorrhages and venous tortuosity, but also causes cataract development [3]. A crystalline lens might present different stages of cataracts, which cause a shift in the color temperature of retinal images to warmer temperatures and a reduction of the contrast due to intraocular scattering.
Detecting the finer details of the fundus images is very important for eye doctors to provide an accurate diagnosis. Improvement of blurred eye fundus images has been studied within the past decades to detect early stages of pathological processes that affect the retina. Most of these studies have focused on increasing the contrast of the arteriovenous tree to detect vascular diseases such as diabetic retinopathy [5,6,7,8]. Moreover, the ongoing efforts primarily focus on automatization of the detection thanks to artificial intelligence and neural networks not only in fundus photographs but also in Optical Coherence Tomography (OCT) images [9,10,11].
OCT [12,13] and Scanning Laser Ophthalmoscopy (SLO) [14] have changed clinical practice and opened new areas of understanding. However, they are not available to all eye care centers whereas the fundus cameras are. Retinal fundus images are widely and routinely used in the clinic to diagnose and monitor many ocular diseases.
Different studies have researched the improvement of the quality of retinal images aiming to color improvement for detection of the blood vessels, but only a few have included some slightly blurry images due to cataracts [13,15,16]. Moreover, the processing was performed on a grey level image or on the green channel to improve vessel detection. To our knowledge, a method focused on the improvement of color retinal images blurred by different grades of cataracts designed to facilitate the clinical evaluation of retinal diseases has not been provided.
The aim of this work is to preset a method to improve blurred images of the eye fundus degraded by cataracts for easing the clinical assessment of retinal pathologies. The method uses the CLAHE (contrast limited histogram equalization) algorithm, which enhances the local contrast of the images [17]. We show the improvement in terms of feature identification achieved in images blurred by cataracts of different severity in three different color spaces, RGB, CIELAB and HSV. The processed images are easier to interpret, showing better delimitation of retinal exudates, unseeing microaneurysm or hyalinized vessels, among other features.
The scheme of the paper is as follows. In Section 2, we provide the grading cataractous opacities leading to different levels of blur in the eye fundus images, the materials used to acquire the images and the methodology proposed. In Section 3 and Section 4, we present the results and the discussion. Finally, in Section 5, we present the conclusions.

2. Background and Method

Cataract classification: Many grading systems have been proposed to classify cataract severity. In this work, we follow the Lens Opacity Classification System II, LOCS II [18], which has four grades, classified depending on the quality of the retinal fundus images, and is commonly used in clinical settings, as well as in some methods for automatic grading [19].
-
Grade I or non-cataract corresponding to clear lens or early cataract: The lens is still clear, but patients begin to feel visual discomfort; nevertheless, the retinal images are clear.
-
Grade II or mild cataract: Lens begins to be slightly opaque and eye fundus images are dimmed. Small details of fundus images begin to fade out.
-
Grade III or moderate cataract: The opacity of the lens has increased, and images are blurred.
-
Grade IV or severe cataract: The cataract is very dense and features of the eye fundus can be hardly detected.
Materials: We used two sets of images. The first set was 15 images taken from a public database of retinal images taken in presence of cataracts (https://www.kaggle.com/jr2ngb/cataractdataset) (accessed on 10 February 2022) [20]. These images present two different sizes (2592 × 1728 and 2464 × 1632). They were organized in three groups of five images, with groups corresponding to mild, moderate and severe cataracts, respectively. The classification, which followed LOCS II, was performed by two clinicians independently, with both clinicians being in agreement regarding the cataract stage of the images selected. The second set of 17 JPG retinal images was taken from the private database of images of the Universitary Hospital of Santiago de Compostela (obtained with a Midriatic Retinographer NIDEK CO., LTD at the Ophthalmology Service). Before taking the images, the permission to use them for research purposes was explained to each patient, and written informed consent was obtained. The study was conducted in accordance with the tenets of the Declaration of Helsinki. From the hospital database, we preset one image representative to each cataract stage to show how the algorithm can help to assess a better diagnostic (although the algorithm showed comparable results for all the images processes with our software). The size of these images was 2976 × 2976 pixels.
Computational Technique: A wide range of image processing techniques have been suggested to perform image enhancement of clear retinal images. Contrast Enhancement (CE) via histogram equalization (HE) is a method that expands the intensity distribution of a gray image to utilize all the dynamic range of the picture [21]. The method is particularly useful for dark images but not for images with varying contrast characteristics. Here, Adaptive Histogram Equalization (AHE) [22] and, later, CLAHE become more efficient [23,24]. CLAHE is designed to work adaptively on the image by enhancing contrast in several small regions called tiles or blocks. The contrast is enhanced at each tile followed by a clipping. Both parameters must be determined by the user.
Image processing: We developed the algorithm in Matlab 2021a. It consists of 5 steps:
  • The JPG image is split to RGB channels. RGB channels are converted to CIE 1976 lab (CIELAB) or HSV [25,26] channels.
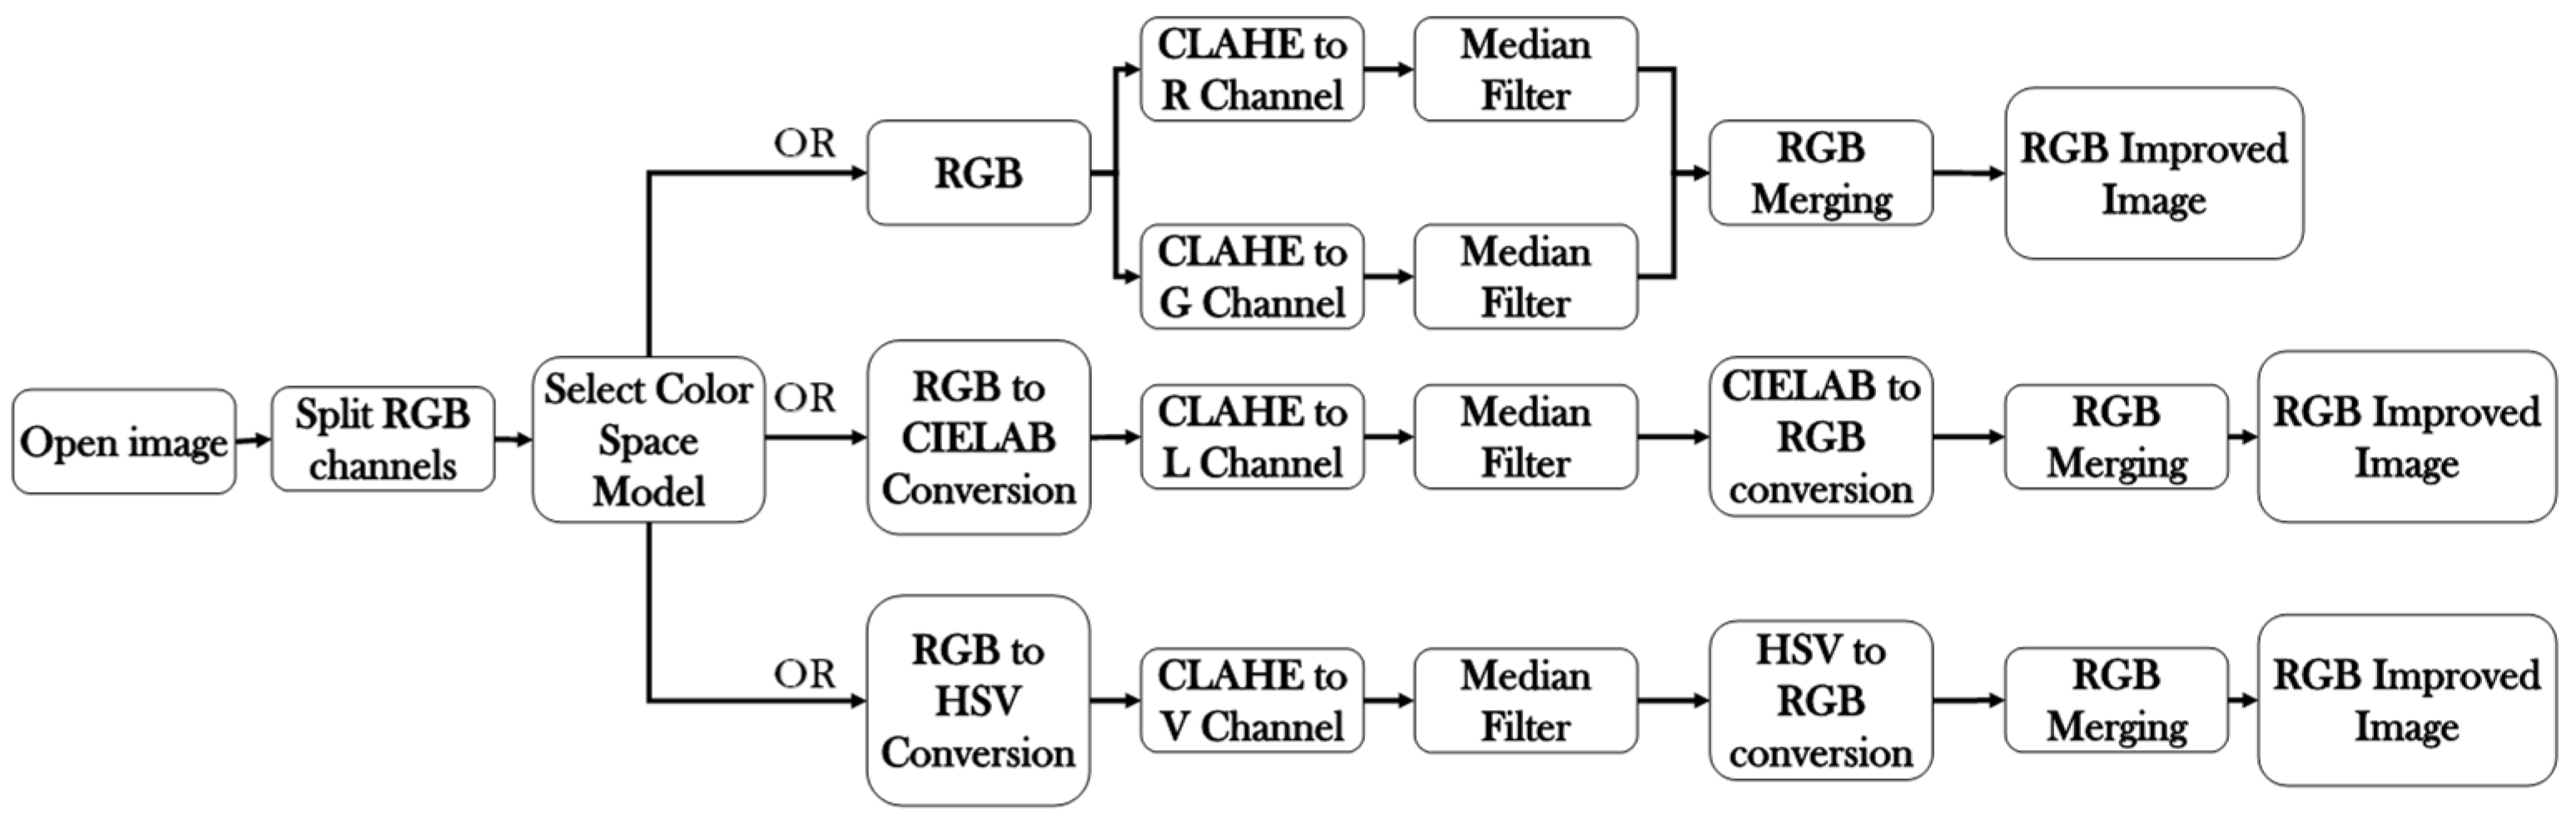
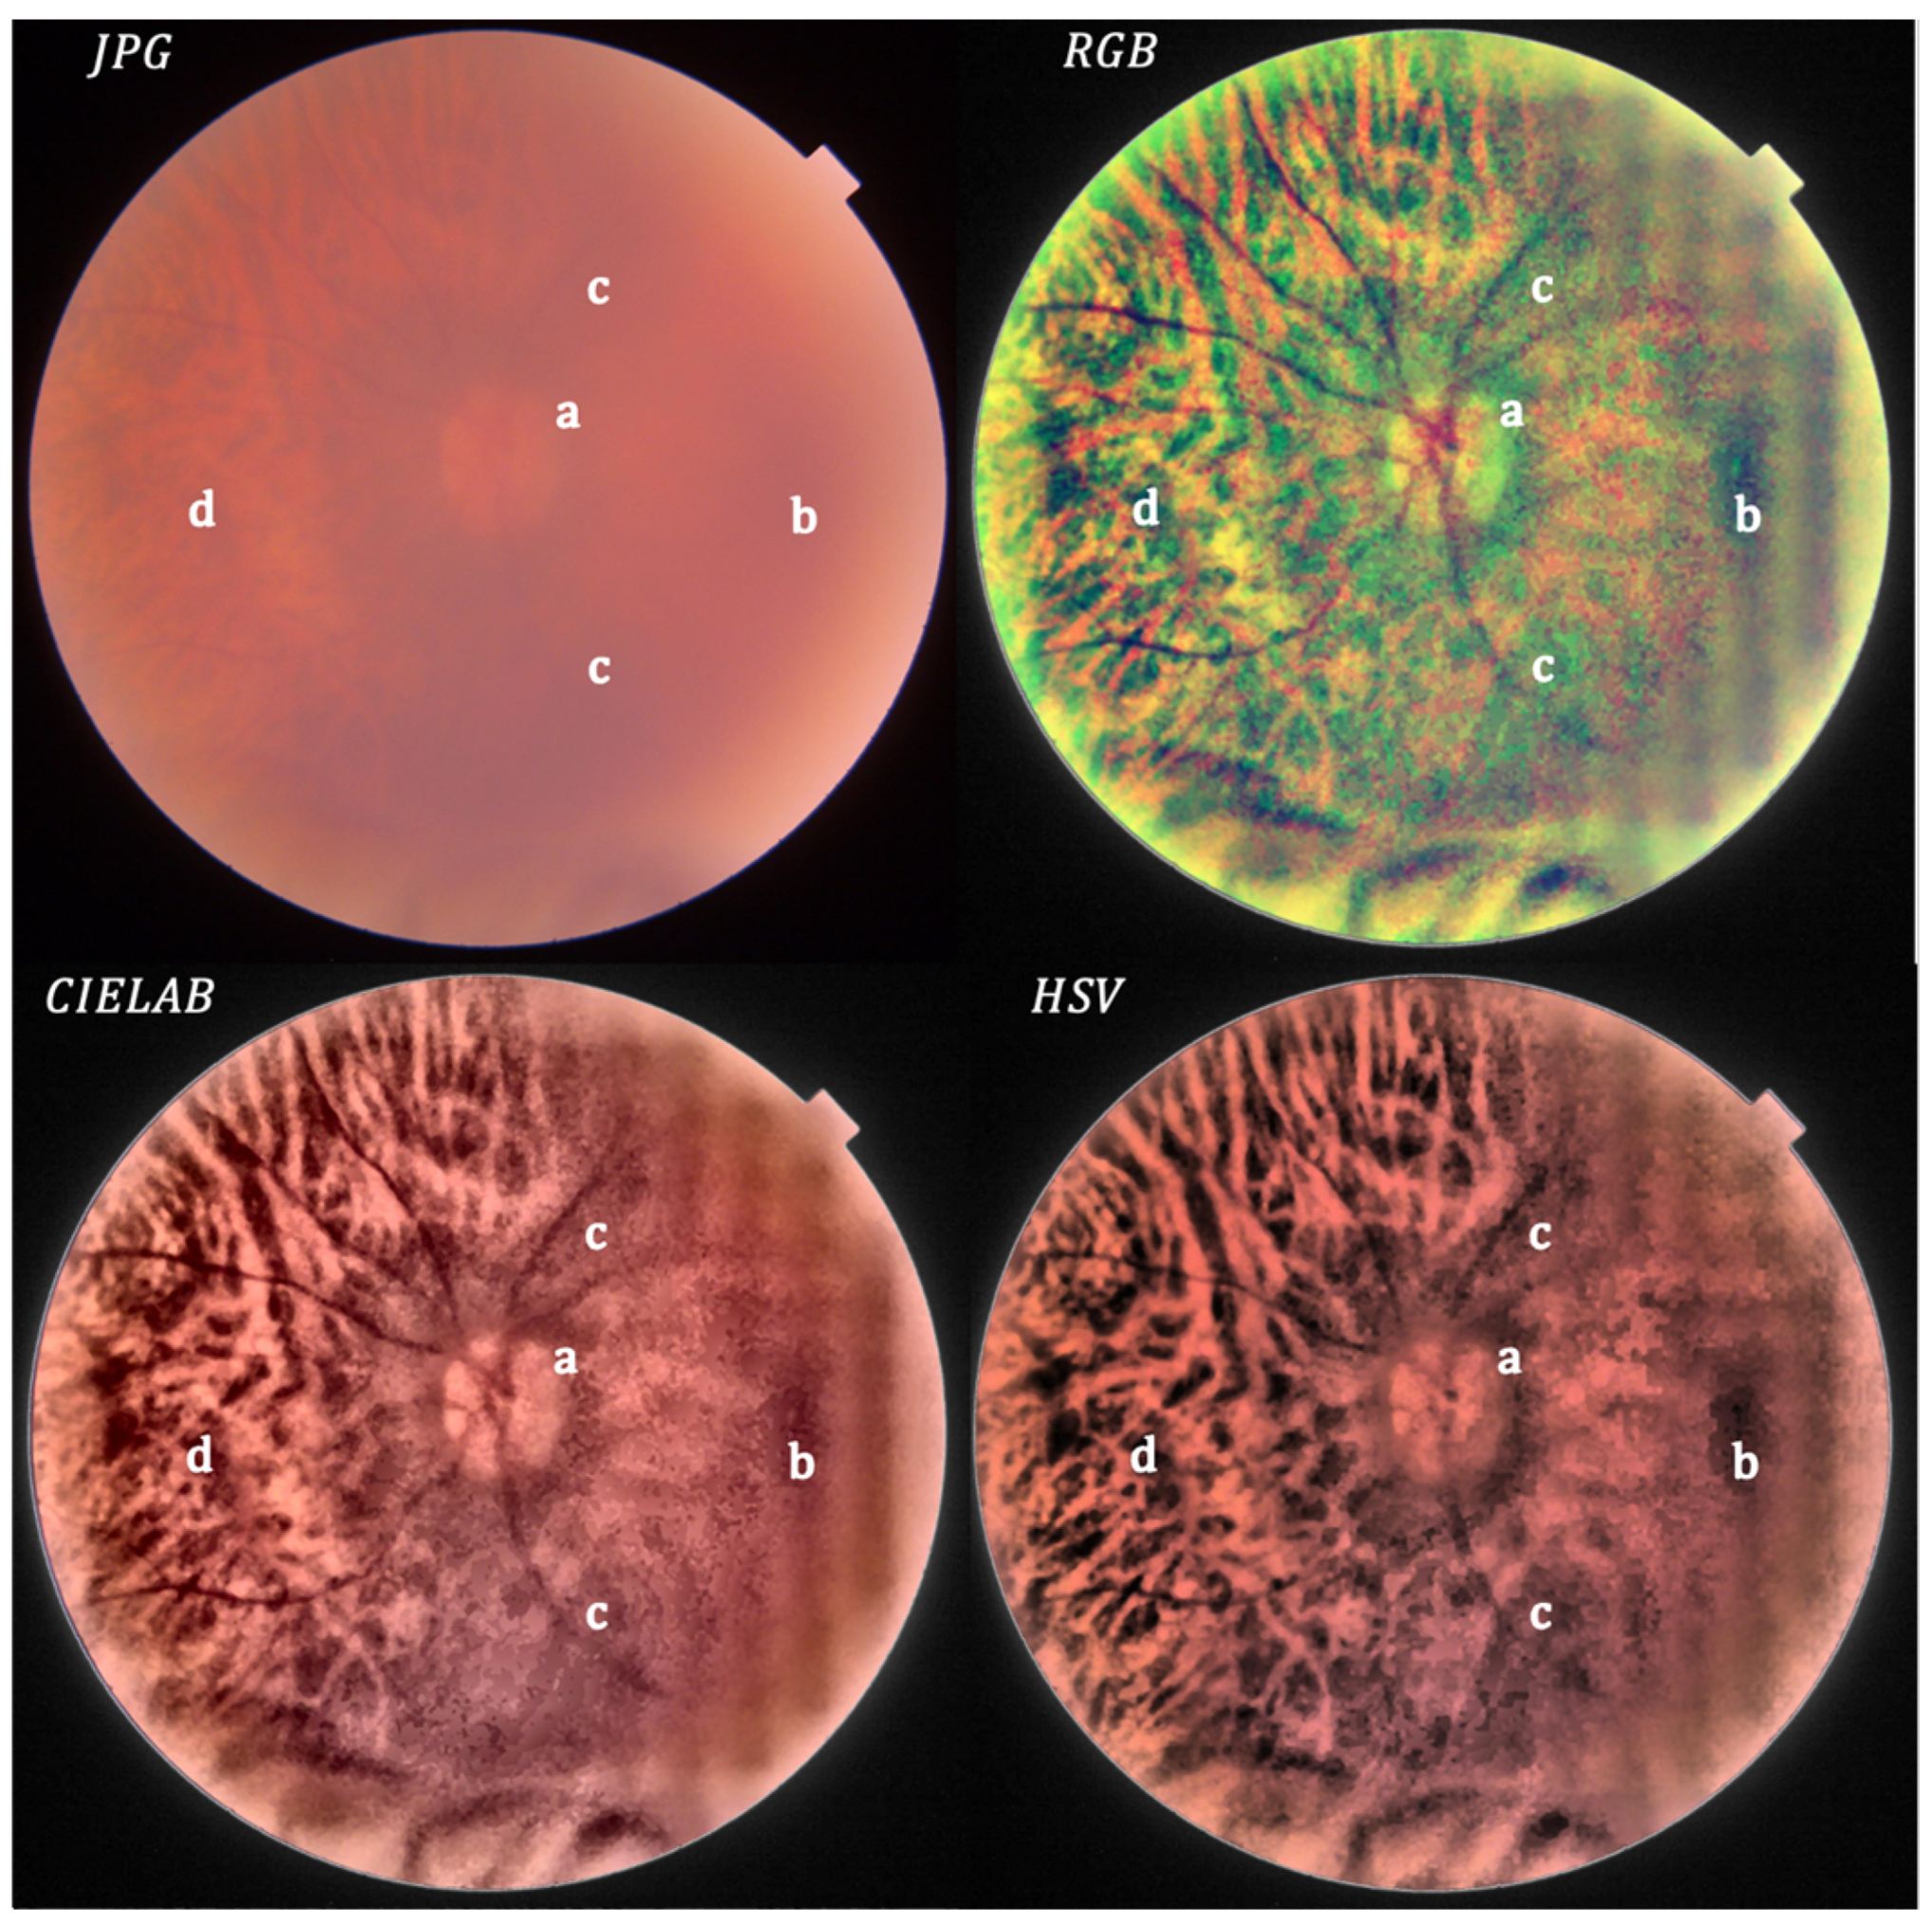
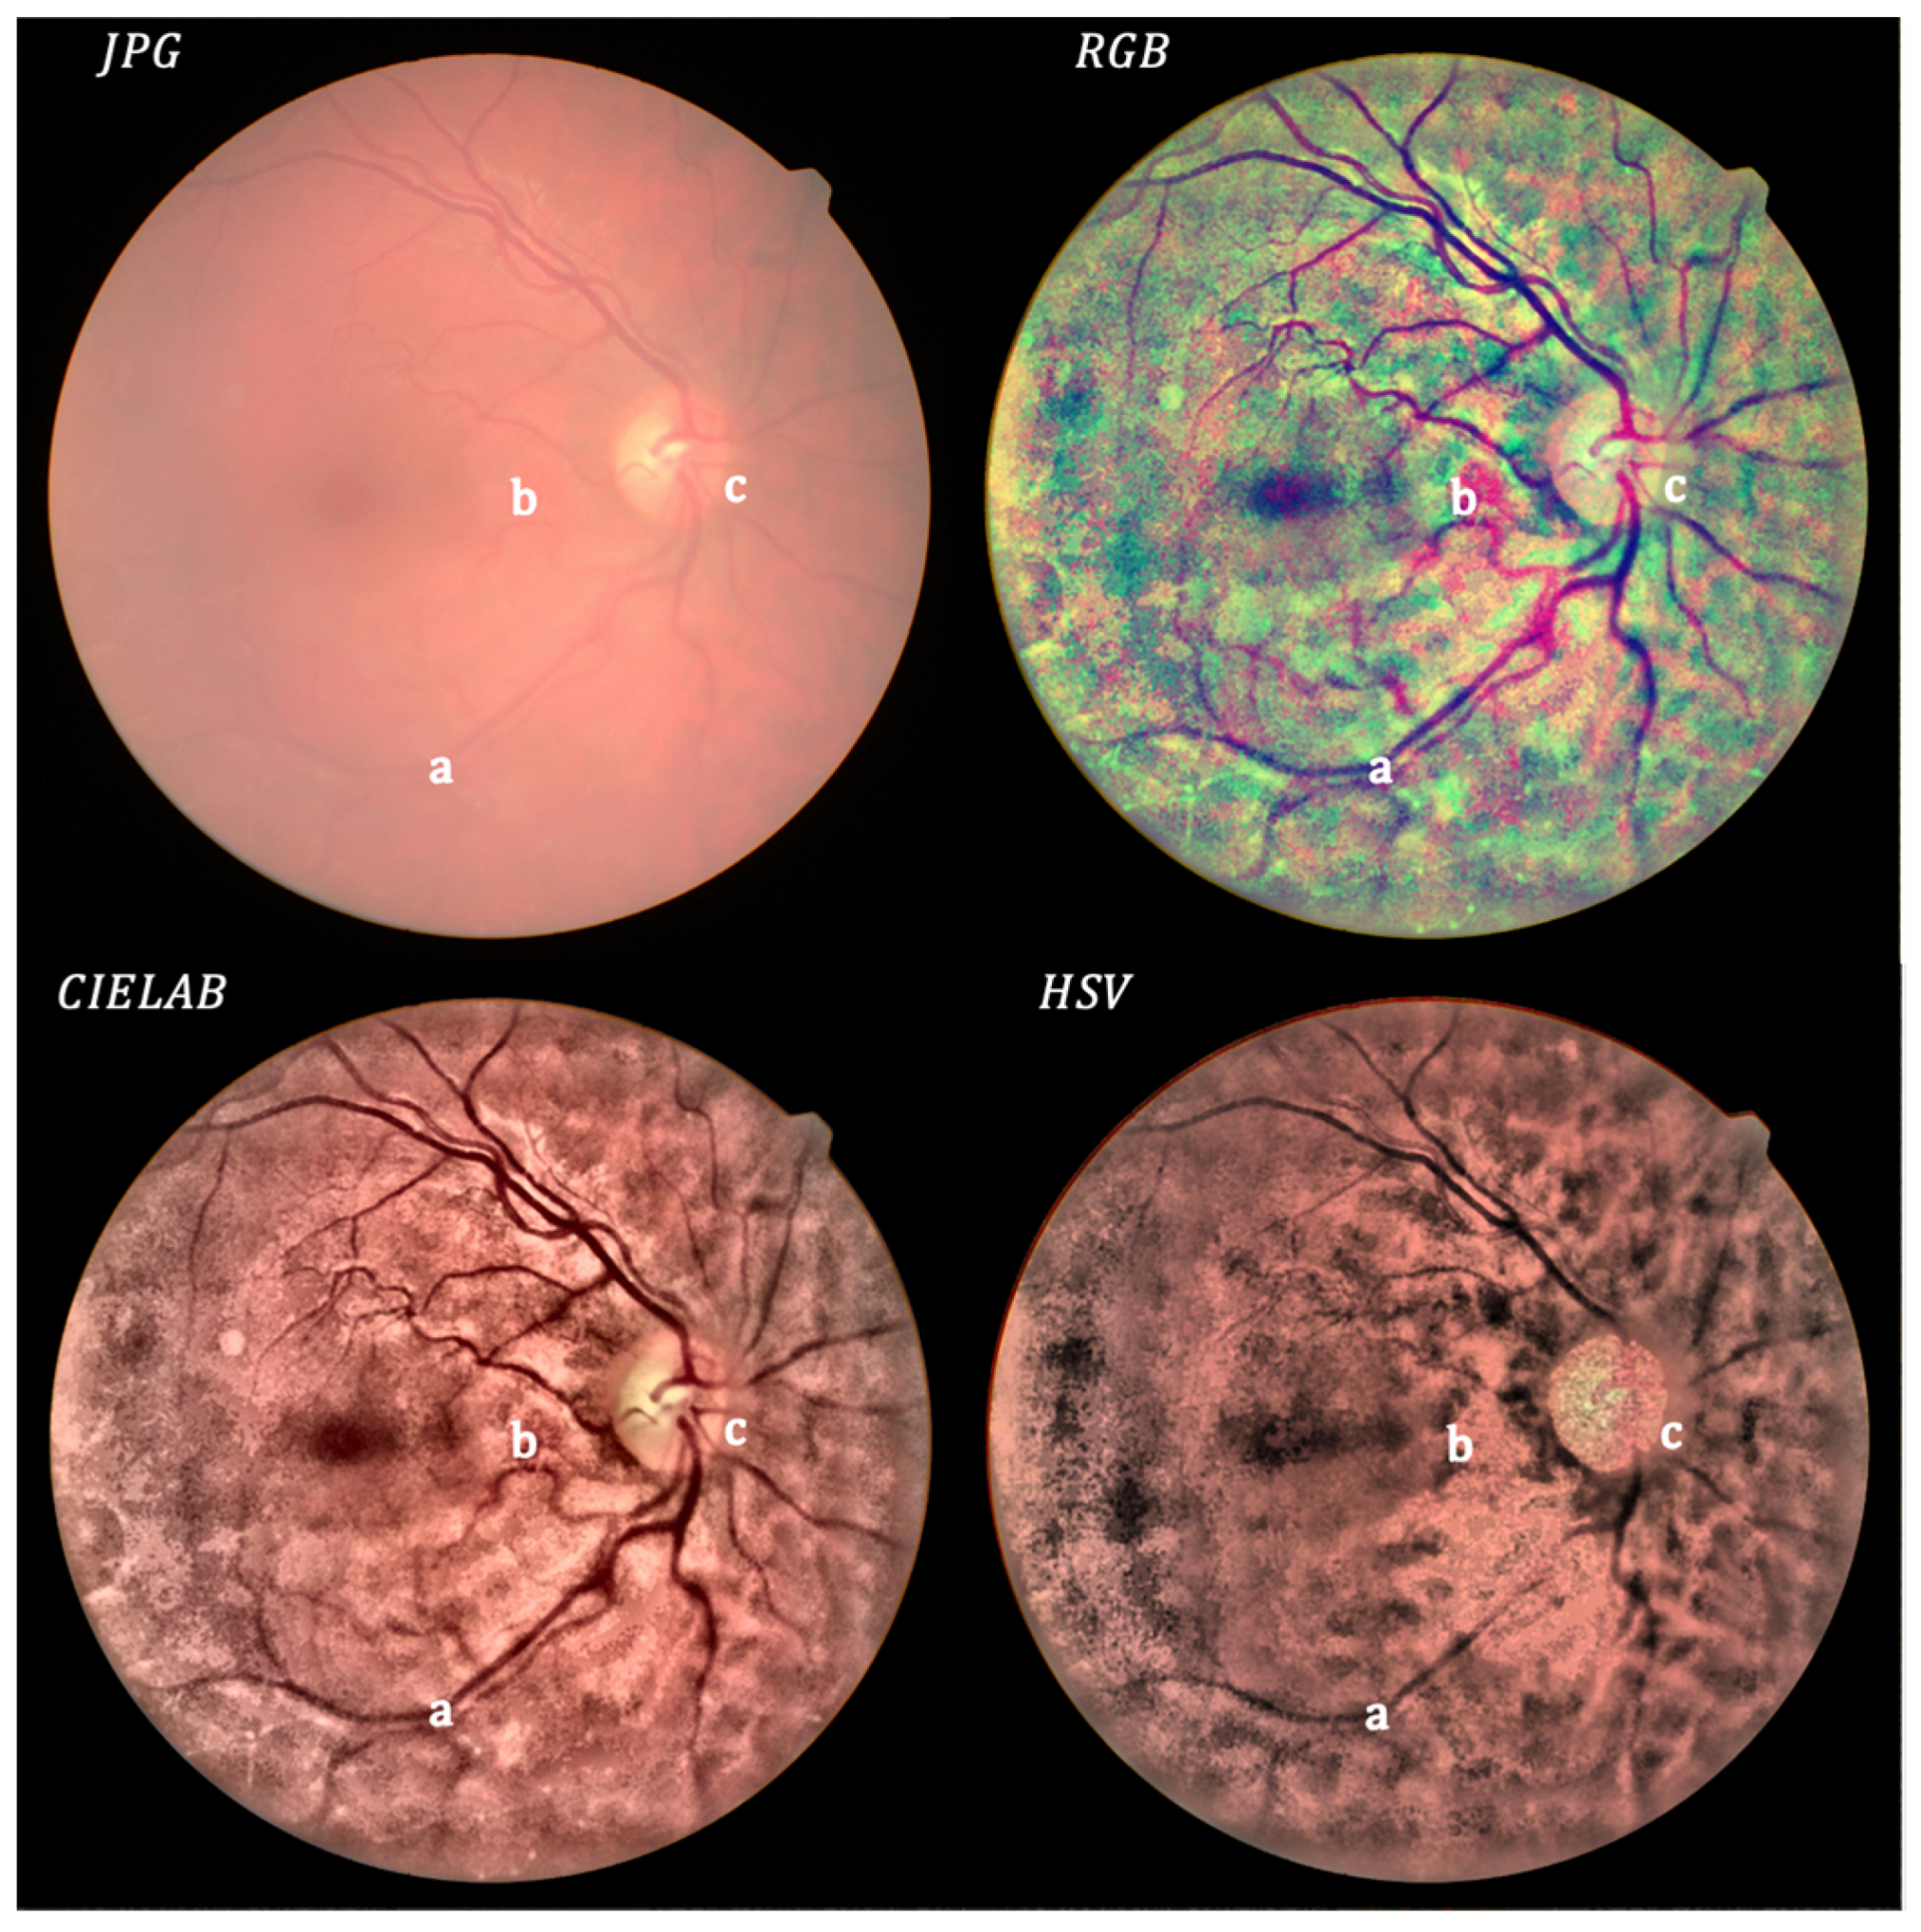
  • Local histogram equalization is performed in the R and G channels of RGB, L channel for CIELAB, and V channel for HSV, respectively.
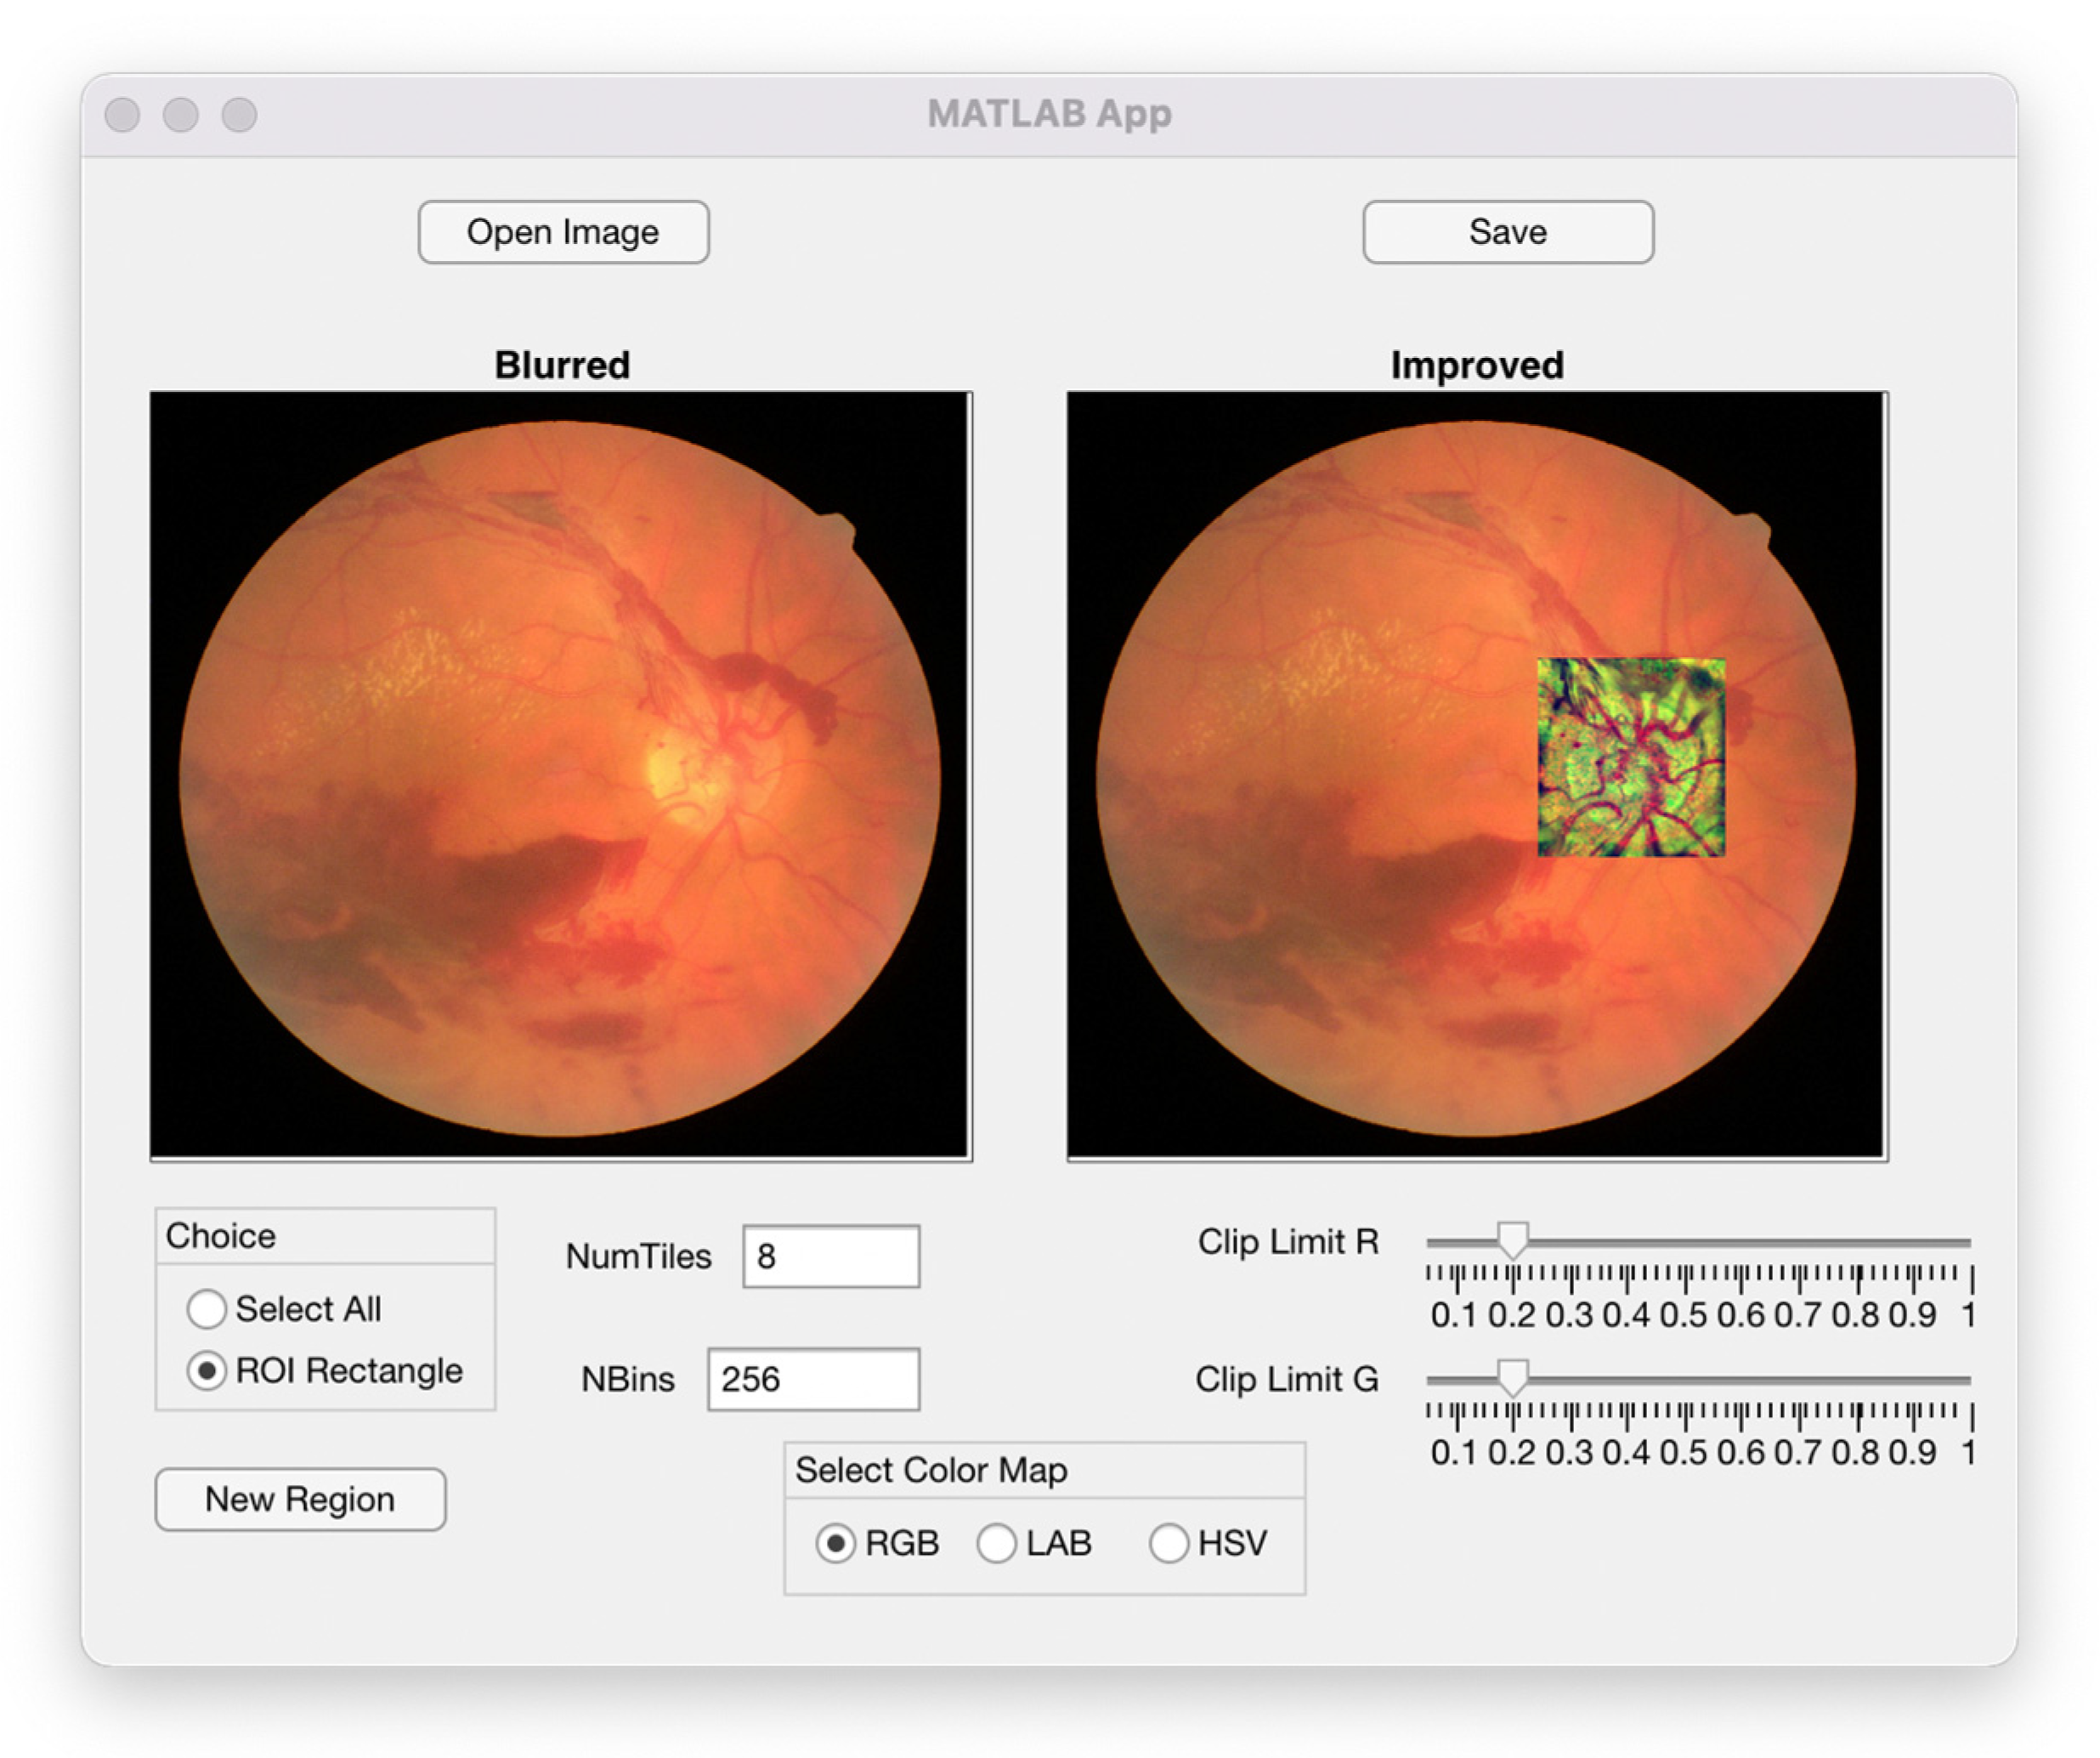
  • We use the Matlab built-in function adapthisteq() that uses CLAHE to enhance the contrast in the channels. This function needs three input parameters: ‘NBins’ is number of bins of the histogram used to improve contrast, ‘NumTiles’ is the size of the rectangular region where the local contrast enhancement will be performed and ‘ClipLimit’ is a contrast factor that avoids the oversaturation in some regions of the image. Below, we explain how we chose the default values for retinal images affected by the same stage of cataract.
  • Median filtering of processed channels for noise removal: We used the Matlab built-in function medfilt2() over a region of 11 × 11 pixels to remove high-frequency noise amplified during the local histogram equalization.
  • RGB merging, and CIELAB or HSV to RGB conversion.
Figure 1 shows the block diagram of the method.
After merging, CIELAB and HSV provide color images close to true color, while RGB merging provides false color images. It is possible to adjust the color balance to obtain true color images, but we did not add this additional step in this work because we believe that image details can be more easily detected by eye professionals without this image alteration. The software (Cataract.deHaze_v1.exe) can be downloaded for its use at the webpage of the research group, https://photonics4life.es/software/ (accessed on 6 April 2022).
How to choose CLAHE parameters:
-
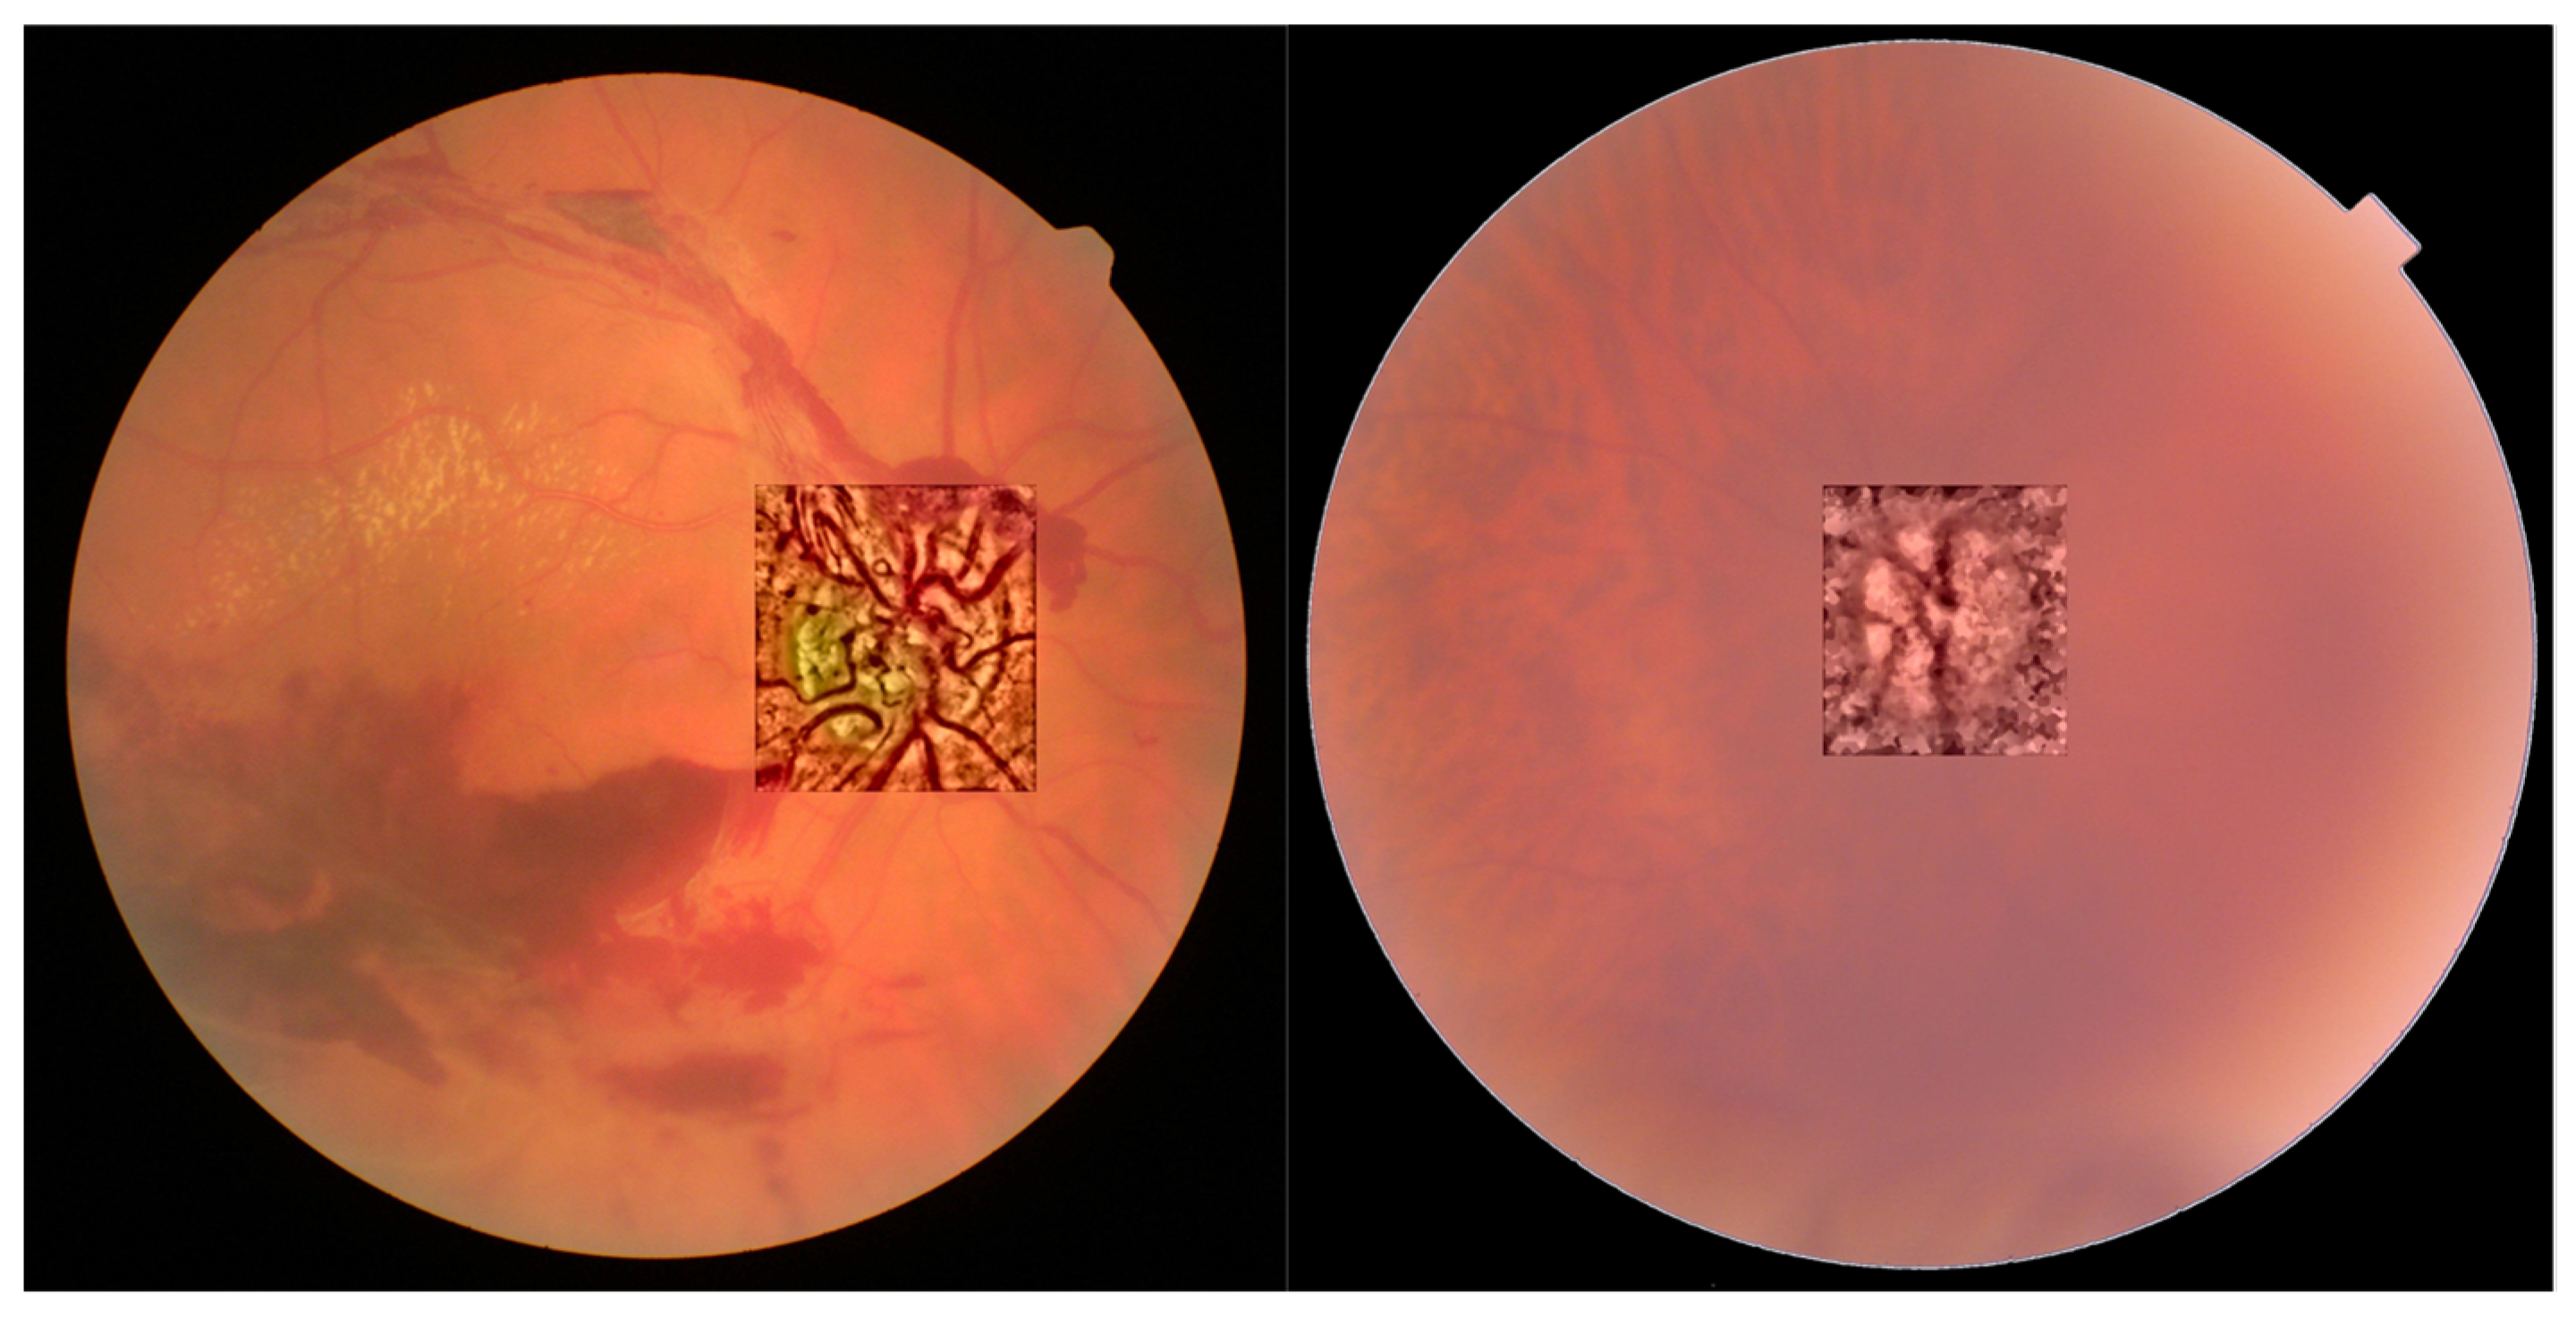
NTiles and NBins: NTiles defines the block size or local region around a pixel for which the histogram is equalized. This size should be larger than the size of features to be preserved or enhanced. Moreover, the number of histogram bins used for histogram equalization within a block should be smaller than the number of pixels in the block. All images from both data sets are 8-bit images, and their size is 2592 × 1728 or 2464 × 1632 for the public dataset and 2976 × 2976 for our dataset. We used NTiles = 16 and NBins = 256 in all processed images presented in the manuscript. Larger values are not meaningful, and reducing the number of bins reduces the dynamic range of the output image and, therefore, the quality of enhanced details by limiting the change in intensity to improve contrast. For the images ROIs containing the optical disk presented in this work, we used NTiles = 8 and NBins = 256. Nevertheless, the developed interface allows the user to choose different values for NBins and NTiles depending on the bit depth and region of interest to be processed.
-
ClipLimit: This value limits the amplification of noise or artifacts avoiding peaks in the histogram. We have processed all images for both data sets and in those without cataracts or mild cataracts we found that ClipLimit values between 0.05 and 0.3 provided the best results being 0.1 the one that fitted for most of images. For moderate cataracts values range from 0.1 to 0.3 being 0.2 the one that fitted for most of them. For severe cataracts the range goes from 0.1 to 0.5 being 0.3 the one that provided best results for most of images. These values apply to all channels of the different color maps. We must point out here that the quality of processed images does not change dramatically with ClipLimit values in the above mentioned ranges, leaving the choice to the user.
-
In all cases we found that 0.2 can be considered as the default value for ROI’s of about 600 × 600 pixels containing the optical disk.

3. Results

In Figure 2, Figure 3 and Figure 4, we show images selected from the public database obtained as representative cases of mild, moderate and severe cataracts, and processed in the three color spaces, RGB, CIELAB and HSV.
In Figure 5, Figure 6, Figure 7 and Figure 8, we show four images obtained under no cataract, mild, moderate and severe cataracts levels, taken at the Ophthalmology Service of the University Hospital of the University of Santiago de Compostela. These images were chosen to show the enhancement obtained for different grades of cataracts in retinas showing different pathological features. These figures are labeled with small letters placed close to pathological details for discussion.
In Figure 9, we show a snapshot of the interface of the software. In the menu, the retinal image must be loaded. The processed image appears in the screen automatically. The default parameters needed by the CLAHE algorithm are set as those explained above, but the program makes it possible to choose all of them depending on the characteristics of the pictures provided by different retinographers. The program also allows the selection of rectangular regions of interest (ROI) within the image where details want to be detected.
In Figure 10, we show the results of applying the algorithm for the CIELAB color space in the region of the optic disc, allowing for an improved visualization of its vascularization, which may help in the early detection of neovascularization associated to pathologies such as proliferative diabetic retinopathy.

4. Discussion

Figure 2, Figure 3 and Figure 4 show a general trend, with the enhancement provided by the algorithm depending on the grade of the cataract. Images processed in the CIELAB color space provide good retinal details, while the HSV images show a clearer choroid. The RGB images are a mixture of CIELAB and HSV images, facilitating the identification of the nature of the lesions. For example, in the first row of Figure 2, the RGB space helps the detection of the damaged region in the nasal parafovea. In the third row of Figure 3, the image obtained in the CIELAB space shows clearly how the peripapillary exudates. In this image, the RGB version shows the presence of hemorrhage in the inferotemporal arcade with greater detail. In Figure 4 (severe cataract,) the software allows the detection of the optic disc and vasculature, and the visualization of the macular region with enough quality to detect relevant lesions.
Figure 5, Figure 6, Figure 7 and Figure 8 show the results obtained from some of the images obtained at the Universitary Hospital of Santiago de Compostela. Again, the increase of the contrast and visualization of details is noticeable for the RGB and CIELAB images, allowing for a faster identification of most of the retinal structures.
In Figure 5, corresponding to non-cataract, the original image is clear. After processing, details arise in the RGB and CIELAB images, whereas not much improvement can be seen for the HSV images, in which the optic disk is missing. The processed image allows a good visualization of the fibrovascular proliferations (a), hemorrhages (b) and hyalinized vessels (c). Note the excellent visualization of blood flow fragmentation in a superior temporal vessel (d), specially for the RGB case, due to the false color. The extension of the hard exudates (e) is easier to delimit, being higher than expected considering the unprocessed image. The processed image shows an unseeing microaneurysm (f) and microhemorrhage (g).
In Figure 6, a good enhancement can be observed between the original retinography and the processed images, mainly for the RGB and CIELAB color spaces. The processed images clearly show the superficial retinal vascular plexus (a). The presence of preretinal hemorrhagic (b) and neovascularization (c) can also be observed. The optic nerve is well defined.
Figure 7 shows an intense blurring in the original retinography, while the processed images in RGB and CIELAB allow a good visualization of the optic nerve (a), retinal vessels (b), chorioretinal tapetum (c), fibrovascular tissue (d) and hemorrhage (e). In addition, the impacts of photocoagulation (f) can be better identified. Macula visualization (g) is much better than in the original image, making it possible to observe the health of pigmentary epithelium and the shining of the epiretinal membrane (h), which are not visible in the original image. In addition, it is easier to identify hyalinized vessels (i) and blow flow fragmentation in the superior temporal vessel (j).
In Figure 8, the processed image in RGB and CIELAB shows very good resolution, enabling the observation of the optic disc (a), macula (b), superficial retinal vascular plexus (c) and chorioretinal tapetum (d) in comparison to the unprocessed image.
All retinal features and pathologies were analyzed by the clinicians, who are the coauthors of this work. They agreed and recognized the different retinal features and did not find artifacts that could resemble retinal details. Artifacts in the shape of lines or squares appear always in severe cataracts. In mild and moderate cataract images, artifacts appear in the blurry regions close to the edges of the images. Therefore, the appearance of these artifacts is closely related to the degree of blurriness of the image. The spatial frequency of the lines or squares depends on the block size. The bigger the value of NTiles, the higher the frequency of the artifacts.
Finally, in Figure 11, we show the grey profiles along one vessel in two of the images presented in this work, which clearly show the enhancement of details for the different colormaps. These profiles are commonly used for automatic detection of vasculature in retinal images [10].

5. Conclusions

Cataracts reduce the contrast of retinal images, impairing the identification of the structures and signs of ocular and systemic pathologies. Therefore, the development of image processing strategies oriented to remove the blur induced by cataracts of different stages is of relevance not only for visual exploration of the retina, but also for automatic diagnosis. The present work is a concept probe study where we tested the proposed algorithm with 15 images from a public database and 17 images from our own database. In these images, the clinicians involved in the study did not identify any false features that could have been induced by the image processing algorithm. Our work shows the benefits of improving the contrast of color images by applying the contrast limited histogram equalization method (CLAHE), in combination with high-frequency filtering, in specific channels of three different color spaces: the R and G channels for RGB images, L channel for CIELAB images, and H channel for HSV images. We showed that the proposed algorithm provides the visualization of features in the processed images that can be hardly seen or detected in the original ones. RGB and CIELAB images provided better results than HSV ones. RGB images obtained after processing were kept in false color because they provided a better subjective identification of retinal pathological details. CIELAB processed images only needed processing in one channel, which did not sacrifice quality. HSV images provided the worse results near the optic disc. Finally, we share the interface used in our study, which can be download from the webpage of our research group at https://photonics4life.es/software/ (accessed on 6 April 2022). Future versions of the software will be also available.

Author Contributions

Conceptualization, E.A.; methodology, E.A., E.G.-A., J.A. and P.C.; software, E.G.-A., J.A. and E.A.; validation, J.A., N.G.-P., P.C. and M.J.A.; formal analysis, E.A., E.G.-A. and J.A.; investigation, E.A., E.G.-A., J.A., N.G.-P., P.C. and M.J.A.; resources, E.A. and J.A.; data curation, E.A., E.G.-A. and J.A.; writing—original draft preparation, E.A., E.G.-A., J.A. and N.G.-P.; writing—review and editing, E.A., E.G.-A., J.A. and N.G.-P.; visualization, E.A., E.G.-A. and J.A.; supervision, E.A.; funding acquisition, E.A., J.A. and N.G.-P. All authors have read and agreed to the published version of the manuscript.

Funding

This work has been funded by Ministerio de Ciencia e Innovación PID2020-115909RB-I00. Nery Garcia-Porta is supported financially by a Maria Zambrano contract at USC under the grants call for the requalification of the Spanish university system 2021–2023, funded by the European Union—NextGenerationEU.

Institutional Review Board Statement

The study was conducted in accordance with the Declaration of Helsinki, and approved by the Ethics Committee of Universidade de Santiago de Compostela for studies involving humans.

Informed Consent Statement

Written informed consent was obtained from all subjects involved in the study.

Data Availability Statement

Public database https://www.kaggle.com/jr2ngb/cataractdataset accessed on 10 February 2022).

Conflicts of Interest

The authors declare no conflict of interest.

References

  1. Lumbroso, B.; Rispoli, M.; Savastano, M.C. Clinical Applications of OCT SSADA Angiography in Everyday Clinical Practice. In Clinical OCT Angiography Atlas, 2nd ed.; Jaypee Brothers Medical Publishers: New Delhi, India, 2015. [Google Scholar]
  2. Tsang, S.H.; Sharma, T. Atlas of Inherited Retinal Diseases; Springer International Publishing: Cham, Switzerland, 2018; pp. 139–151. [Google Scholar]
  3. Wang, W.; Lo, A.C. Diabetic retinopathy: Pathophysiology and treatments. Int. J. Mol. Sci. 2018, 19, 1816. [Google Scholar] [CrossRef] [Green Version]
  4. Maude, R.J.; Ahmed, B.W.; Rahman, A.H.M.W.; Rahman, R.; Majumder, M.I.; Menezes, D.B.; Abu Sayeed, A.; Hughes, L.; MacGillivray, T.J.; Borooah, S.; et al. Retinal changes in visceral leishmaniasis by retinal photography. BMC Infect. Dis. 2014, 14, 527. [Google Scholar] [CrossRef] [Green Version]
  5. Van den Berg, T.J. Intraocular light scatter, reflections, fluorescence and absorption: What we see in the slit lamp. Ophthalmic Physiol. Opt. 2018, 38, 6–25. [Google Scholar] [CrossRef] [PubMed] [Green Version]
  6. Abràmoff, M.D.; Garvin, M.K.; Sonka, M. Retinal imaging and image analysis. IEEE Rev. Biomed. Engine 2010, 3, 169–208. [Google Scholar] [CrossRef] [PubMed] [Green Version]
  7. Bouhous, A.; Kemih, K. Novel encryption method based on optical time-delay chaotic system and a wavelet for data transmission. Opt. Laser Technol. 2018, 108, 162–169. [Google Scholar] [CrossRef]
  8. Salamat, N.; Missen, M.M.S.; Rashid, A. Diabetic retinopathy techniques in retinal images: A review. Artif. Intell. Med. 2019, 97, 168–188. [Google Scholar] [CrossRef] [PubMed]
  9. Islam, M.T.; Imran, S.A.; Arefeen, A.; Hasan, M.; Shahnaz, C. Source and camera independent ophthalmic disease recognition from fundus image using neural network. In Proceedings of the 2019 IEEE International Conference on Signal Processing, Information, Communication & Systems (SPICSCON), Dhaka, Bangladesh, 28–30 November 2019; pp. 59–63. [Google Scholar]
  10. Dash, J.; Bhoi, N. A thresholding-based technique to extract retinal blood vessels from fundus images. Future Comput. Inform. J. 2017, 2, 103–109. [Google Scholar] [CrossRef]
  11. Ramos-Soto, O.; Rodríguez-Esparza, E.; Balderas-Mata, S.E.; Oliva, D.; Hassanien, A.E.; Meleppat, R.K.; Zawadzki, R.J. An efficient retinal blood vessel segmentation in eye fundus images by using optimized top-hat and homomorphic filtering. Comput. Methods Programs Biomed. 2021, 201, 105949. [Google Scholar] [CrossRef] [PubMed]
  12. Meleppat, R.K.; Miller, E.B.; Manna, S.K.; Zhang, P.; Pugh, E.N., Jr.; Zawadzki, R.J. Multiscale Hessian filtering for enhancement of OCT angiography images. In Proceedings of the Ophthalmic Technologies XXIX, San Francisco, CA, USA, 2–7 February 2019; p. 108581K. [Google Scholar]
  13. Peli, E.; Peli, T. Restoration of retinal images obtained through cataracts. IEEE Trans. Med. Imaging 1989, 8, 401–406. [Google Scholar] [CrossRef] [PubMed]
  14. Meleppat, R.K.; Ronning, K.E.; Karlen, S.J.; Burns, M.E.; Pugh, E.N., Jr.; Zawadzki, R.J. In vivo multimodal retinal imaging of disease-related pigmentary changes in retinal pigment epithelium. Sci. Rep. 2021, 11, 16252. [Google Scholar] [CrossRef] [PubMed]
  15. Russell, G.; Oakley, J.P.; McLoughlin, N.; Nourrit, V. Enhancement of color retinal images in poor imaging conditions. In Proceedings of the 2012 IEEE International Conference on Imaging Systems and Techniques Proceedings, Manchester, UK, 16–17 July 2012; pp. 176–178. [Google Scholar]
  16. Shen, Z.; Fu, H.; Shen, J.; Shao, L. Modeling and Enhancing Low-Quality Retinal Fundus Images. IEEE Trans. Med. Imaging 2020, 40, 996–1006. [Google Scholar] [CrossRef] [PubMed]
  17. Pizer, S.M.; Johnston, R.E.; Ericksen, J.P.; Yankaskas, B.C.; Muller, K.E. Contrast-limited adaptive histogram equalization: Speed and effectiveness. In Proceedings of the First Conference on Visualization in Biomedical Computing, Atlanta, Georgia, 22–25 May 1990. [Google Scholar]
  18. Chylack, L.T.; Leske, M.C.; McCarthy, D.; Khu, P.; Kashiwagi, T.; Sperduto, R. Lens opacities classification system II (LOCS II). Arch. Ophthalmol. 1989, 107, 991–997. [Google Scholar] [CrossRef] [PubMed]
  19. Cao, L.; Li, H.; Zhang, Y.; Zhang, L.; Xu, L. Hierarchical method for cataract grading based on retinal images using improved Haar wavelet. Inf. Fusion 2020, 53, 196–208. [Google Scholar] [CrossRef]
  20. Cataract Dataset. Available online: https://www.kaggle.com/jr2ngb/cataractdataset/code (accessed on 2 February 2022).
  21. Zimmerman, J.B.; Pizer, S.M.; Staab, E.V.; Perry, J.R.; McCartney, W.; Brenton, B.C. An evaluation of the effectiveness of adaptive histogram equalization for contrast enhancement. IEEE Trans. Med. Imaging 1988, 7, 304–312. [Google Scholar] [CrossRef] [PubMed] [Green Version]
  22. Hummel, R. Image enhancement by histogram transformation. Comput. Graph. Image Process. 1977, 6, 184–195. [Google Scholar] [CrossRef]
  23. Zuiderveld, K. Contrast limited adaptive histogram equalization. In Graphics gems IV; Academic Press Professional, Inc.: San Diego, CA, USA, 1994; pp. 474–485. [Google Scholar]
  24. Stark, J.A. Adaptive image contrast enhancement using generalizations of histogram equalization. IEEE Trans. Image Process. 2000, 9, 889–896. [Google Scholar] [CrossRef] [PubMed] [Green Version]
  25. Robertson, A.R. The CIE 1976 color-difference formulae. Color Res. Appl. 1977, 2, 7–11. [Google Scholar] [CrossRef]
  26. Gonzalez, R.C.; Woods, R.E. Digital Image Processing, 2nd ed.; Prentice Hall: Hoboken, NJ, USA, 2002; pp. 282–330. [Google Scholar]
Figure 1. Block diagram of the method.
Photonics 09 00251 g001
Figure 2. Processed images for the case of mild cataract.
Photonics 09 00251 g002
Figure 3. Processed images for the case of moderate cataract.
Photonics 09 00251 g003
Figure 4. Processed images for the case of severe cataract.
Photonics 09 00251 g004
Figure 5. Non-cataract: original (upper left) and processed images.
Photonics 09 00251 g005
Figure 6. Mild cataract: original (upper left) and processed images.
Photonics 09 00251 g006
Figure 7. Moderate cataract: original (upper left) and processed images.
Photonics 09 00251 g007
Figure 8. Severe cataract: original (upper left) and processed image.
Photonics 09 00251 g008
Figure 9. Image of the menu used for running the algorithm.
Photonics 09 00251 g009
Figure 10. Optical disc region for non-cataract with bleeding (left) and severe cataract (right).
Photonics 09 00251 g010
Figure 11. Grey profiles along vertical lines drawn in the images. Grade I cataract (upper row) and grade IV cataract (lower row). BW original image (left column); BW improved CIELAB image (central column); grey profiles in arbitrary units (right column).
Photonics 09 00251 g011
Publisher’s Note: MDPI stays neutral with regard to jurisdictional claims in published maps and institutional affiliations.

