Abstract
We study the output of a semiconductor laser with optical feedback operated in the low-frequency fluctuations (LFFs) regime and subject to weak sinusoidal current modulation. In the LFF regime, the laser intensity exhibits abrupt drops, after which it recovers gradually. Without modulation, the drops occur at irregular times, while, with weak modulation, they can lock to the external modulation and they can occur, depending on the parameters, every two or every three modulation cycles. Here, we characterize experimentally the locking regions and use the well-known Lang–Kobayashi model to simulate the intensity dynamics. We analyze the effects of several parameters and find that the simulations are in good qualitative agreement with the experimental observations.
1. Introduction
Locking is a phenomenon that ubiquitously occurs in oscillators that are subject to an external periodic forcing, and refers to the synchronization, or to the adjustment, of the oscillator’s rhythm, to that of the external forcing. Locking has many applications, for example, for cardiac re-synchronization after arrhythmia, for deep brain stimulation, jet lag re-adjustment, etc. [1,2,3].
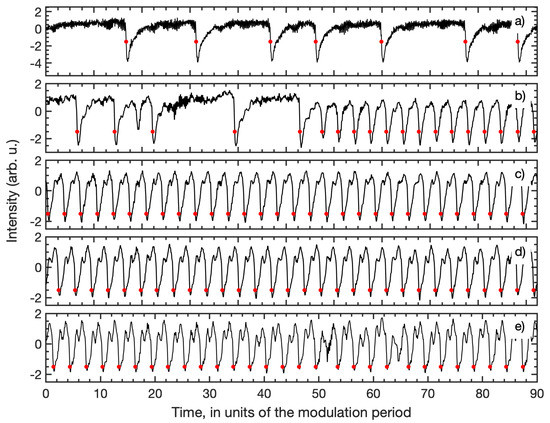
A semiconductor laser whose pump current is periodically modulated is a stochastic nonlinear oscillator that can shows bistability and a chaotic output [4,5], and that allows controlled experiments in order to understand how locking emerges and how it depends on the parameters of the laser and of the external signal. With weak optical feedback, the laser intensity shows feedback-induced fluctuations that, under appropriate conditions, can be controlled by periodic current modulation. In particular, a weak modulation of the laser current can control the low-frequency fluctuations (LFFs) that occur when the laser operates near the threshold [4]. Without current modulation, the laser intensity shows irregular and abrupt drops (that in the following we will refer to as spikes), while with current modulation, under appropriate conditions, the spikes lock to the modulation (see Figure 1), and they occur with a rhythm that depends on the frequency of the modulation [6,7,8,9,10,11,12,13,14,15,16,17].

Figure 1.
Available online: examples (accessed on) of intensity time series recorded with different modulation amplitudes. (a) , (b) (c) , (d) , and (e) of the dc level mA. The modulation frequency is MHz. The red dots indicate the detected spike times.
In recent years, we have performed detailed experiments on the modulated LFF dynamics, characterizing the temporal correlations in the spike times [18,19], the role of the modulation waveform [20], and the degree of locking [21] and we compared the spiking LFF dynamics with simulations of a weakly forced neuron [22]. We have also discovered that weak sinusoidal modulation can generate time-crystal-like behavior [23,24] because it can produce highly regular subharmonic locking, but not harmonic locking [25,26]. The lack of harmonic locking under weak sinusoidal modulation could be understood when using the well-known Lang–Kobayashi (LK) model [27] to simulate the intensity dynamics [28].
The goal of this work is to perform an in-depth comparison of experimental observations and the predictions of the LK model. This paper is organized as follows. In Section 2, we present the LK model, in Section 3 we describe the experimental setup and datasets, in Section 4 we present the comparison of observations and simulations, and in Section 5, we present the discussion and the conclusions.
2. Model
The Lang–Kobayashi rate equations describing a single-mode semiconductor laser with weak optical feedback and sinusoidal pump current modulation are [26,27,28]:
Here, E represents the slowly varying complex optical field ( is proportional to the laser intensity) and N, the carrier density. , , and are the feedback strength, the delay time, and the feedback phase, respectively; where is the photon lifetime, where is the carrier lifetime, is the gain and is the gain saturation coefficient, is the linewidth enhancement factor. is a complex Gaussian white noise that takes into account spontaneous emission and D is the strength of the noise. is the dc value of the pump current parameter, which is proportional to [29], with being the dc value of the pump current and the threshold current without feedback. and are the modulation amplitude and frequency, respectively.
The model equations were integrated with the same procedure and parameters as in [26,28] that fit the experimental conditions: ns, ns, , , = 30 ns, ns, , and ns. To detect the spike times, the intensity time series, , was band-pass filtered to simulate the finite bandwidth of the experimental detection system, and was then normalized to zero mean and unit variance. Then, a spike was detected whenever the intensity dropped below a threshold, .
To analyze the statistical characteristics of the spikes, for each set of parameters five intensity time series were simulated, starting from random initial conditions and using different noise seeds, and from them, after disregarding a transient time, the average number of spikes, the average inter-spike interval (IS), and the average standard deviation of the distribution of ISIs were calculated.
3. Experimental Setup and Datasets
The experimental setup and datasets were described in [20]. A diode laser with center wavelength of 685 nm (Thorlabs HL6750MG, Newton, NJ, USA) was used, whose temperature and current were stabilized with an accuracy of 0.01 C and 0.01 mA, respectively. A beam splitter sent 90% of the light reflected by a mirror back to the laser, and the other 10% to the detection system: a high-speed photo-detector (Thorlabs Det10A/M) connected to an amplifier (Femto HSA-Y-2-40, Berlin, Germany) whose output was recorded with a digital oscilloscope (Agilent Technologies Infiniium DSO9104A, 1 GHz bandwidth). A 500 MHz Bias-T in the laser mount was used to modulate the laser current with a periodic signal generated by an arbitrary waveform generator (Agilent 81150A, Santa Clara, CA, USA). The length of the external cavity was 70 cm, which gave a feedback delay time of 4.7 ns. The threshold current of the free-running laser was mA, and with optical feedback, it was reduced to mA (7.2% reduction). In the experiments, three modulation parameters were varied, the dc value of the laser current, , the amplitude, , and frequency, , of the driving signal, and for each set of parameters, three modulation waveforms were used (pulse-down, pulse-up, and sinusoidal). Here, we analyze the data recorded with sinusoidal modulation. Specifically, we analyze the ISIs recorded with different , , and .
4. Results
Figure 1 presents experimental intensity time series recorded without current modulation (top panel) and with current modulation of increasing amplitude (panels b–e). We see that for intermediate modulation amplitudes the spikes become periodic and a spike occurs every three modulation cycles (locking 3:1). Model simulations that show good agreement with these observations were presented in [26] (Figure 4).
To perform a systematic comparison of experiments and model simulations, we analyze how the statistics of the ISIs depend on the amplitude and on the frequency of the modulation. Specifically, we analyze the number of spikes, the mean ISI normalized to the modulation period, , and the coefficient of variation, , that measures the relative width of the ISI distribution ( where and are the mean and the standard deviation of the ISI distribution). The results are presented in Figure 2 and Figure 3, for the experimental and the simulated data, respectively. We see a good qualitative agreement: the number of spikes increases in the regions of locking, which are seen as a well-defined cyan region (locking 2:1, ) and a yellow region (locking 3:1, ), and in these regions is small, revealing a narrow ISI distribution.

Figure 2.
Analysis of the experimental inter-spike intervals (ISIs). (a): number of spikes (in color code) vs. the modulation amplitude and frequency; (b): mean ISI normalized to the modulation period (the red color represents ); (c) coefficient of variation. The dc value of the pump current is as in Figure 1.

Figure 3.
As in Figure 2, but obtained from model simulations with 0.99, other parameters are as indicated in the text.
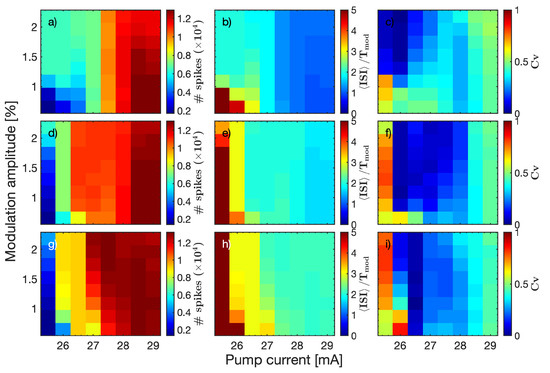
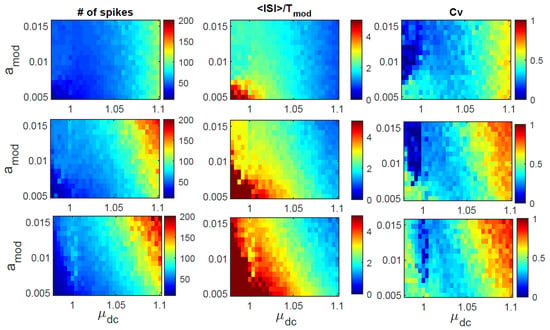
Let us next compare the combined effect of varying the dc value of pump current and the modulation amplitude, keeping the modulation frequency fixed. In Figure 4 and Figure 5, we present the analysis of experimental and simulated ISIs, respectively. In both figures, from top to bottom, 26 MHz, 44 MHz, and 55 MHz. We again observe a very good qualitative agreement between experiments and simulations. As or increase, we see that the number of spikes increases (left column) and the mean ISI decreases (in the blue regions, the mean ISI becomes equal to or smaller than the modulation period). However, we see in the right column that the coefficient of variation increases with or , which indicates that 1:1 locking is not achieved.

Figure 4.
Experimental characterization of the locking region as a function of the modulation amplitude and the dc value of the pump current, for different modulation frequencies. (a,d,g) number of spikes; (b,e,h) ; (c,f,h) coefficient of variation. (a–c) 26 MHz; (d–f) 44 MHz; (g–i) 55 MHz.

Figure 5.
As Figure 4, but obtained from model simulations. First row, 26 MHz; second row, 44 MHz; and third row, 55 MHz. We again see a tendency of the mean ISI to decrease as the dc value of the pump current increases, but no 1:1 locking is obtained because in the region where , the width of the distribution of ISIs, measured by the coefficient of variation, is quite large.
In Figure 4b, we note that for large enough the mean ISI is approximately equal to the modulation period, but there is no 1:1 locking because the ISI distribution is quite broad (the coefficient of variation is ). One could wonder if for other modulation frequencies, harmonic locking could be obtained. To address this point, we examine the statistics of the ISIs as a function of the modulation amplitude and frequency. The results are presented in Figure 6 (experimental data recorded with mA) and in Figure 7 (simulated data with ). In Figure 6b, we see, for low modulation frequencies, a blue region that indicates , but in this region is large (). In Figure 7b, we also see a blue region with similar characteristics. In contrast with the experiments, in the simulation, 3:1 locking is not seen because the yellow region in Figure 7b is quite narrow, and in this region, is large.

Figure 6.
As Figure 2, but the dc value of the pump current is mA. (a) number of spikes; (b) ; (c) coefficient of variation.

Figure 7.
As Figure 3, but 1.01, other parameters are as indicated in the text.
5. Conclusions
We have studied the dynamics of a semiconductor laser with optical feedback and current modulation, which operates in the LFF regime. We have analyzed how the number of spikes and how the mean and the standard deviation of the ISI distribution vary with the modulation parameters: the dc value, the amplitude, and the frequency. We have found a very good agreement between experimental observations and the simulations of the LK model. With increasing , tends to decrease, but, at least in the range of modulation amplitudes studied here, no 1:1 locking was found. Harmonic locking can be observed with larger modulation amplitudes [28], but in that case the intensity dynamics are dominated by the modulation and the feedback-induced spikes are rather small.
The main motivation of our study was to understand the locking phenomena of a diode laser, from the point of view of nonlinear dynamics. In that sense, model simulations have been performed to further understand why small-amplitude sinusoidal current modulation does not produce harmonic locking. Since we have found well-defined regions of subharmonic locking (exploring the parameters space pump current, modulation amplitude, and modulation frequency) our results may be of interest for applications that use small-amplitude electric modulation to generate highly regular optical pulsing with a repetition rate in the MHz range.
It will be interesting for future work to understand how the locking behavior depends on the feedback strength, i.e., to characterize the transition from locked sinusoidal-like oscillations (without optical feedback) to locked feedback-induced spikes. It will also be interesting to analyze if the interplay of noise, delayed feedback, and current modulation can produce locking regions where the spikes are emitted with a very regular timing.
Author Contributions
Conceptualization, methodology, analysis, and writing, J.T.-A. and C.M. All authors have read and agreed to the published version of the manuscript.
Funding
This research was funded by the Spanish Ministerio de Ciencia, Innovacion y Universidades (PGC2018-099443-B-I00) and the ICREA ACADEMIA program of Generalitat de Catalunya.
Data Availability Statement
The experimental sequences of inter-spike-intervals are available https://doi.org/10.5281/zenodo.5913506 (accessed on 25 January 2022).
Conflicts of Interest
The authors declare no conflict of interest.
References
- Winfree, A.T. The Geometry of Biological Time; Springer: London, UK, 2001. [Google Scholar]
- Pikovsky, A.; Rosenblum, M.; Kurths, J. Synchronization: A Universal Concept in Nonlinear Sciences; Cambridge University Press: Cambridge, UK, 2001. [Google Scholar]
- Glass, L. Synchronization and rhythmic processes in physiology. Nature 2001, 410, 277. [Google Scholar] [CrossRef] [PubMed]
- Ohtsubo, J. Semiconductor Lasers: Stability, Instability and Chaos, 4th ed.; Springer: Berlin, Germany, 2017. [Google Scholar]
- Erneux, T.; Glorieux, P. Laser Dynamics; Cambridge University Press: Cambridge, UK, 2010. [Google Scholar]
- Baums, D.; Elsasser, W.; Gobel, E.O. Farey tree and Devil’s staircase of a modulated external-cavity semiconductor laser. Phys. Rev. Lett. 1989, 63, 155. [Google Scholar] [CrossRef]
- Sacher, S.; Baums, D.; Panknin, P.; Elsasser, W.; Gobel, E.O. Intensity instabilities of semiconductor-lasers under current modulation, external light injection, and delayed feedback’. Phys. Rev. A 1992, 45, 1893. [Google Scholar] [CrossRef]
- Takiguchi, Y.; Liu, Y.; Ohtsubo, J. Low-frequency fluctuation induced by injection-current modulation in semiconductor lasers with optical feedback. Opt. Lett. 1998, 23, 1369. [Google Scholar] [CrossRef] [PubMed]
- Sukow, D.W.; Gauthier, D.J. Entraining power-dropout events in an external-cavity semiconductor laser using weak modulation of the injection current. IEEE J. Quantum Electron. 2000, 36, 175. [Google Scholar] [CrossRef]
- Mendez, J.M.; Laje, R.; Giudici, M.; Aliaga, J.; Mindlin, G.B. Dynamics of periodically forced semiconductor laser with optical feedback. Phys. Rev. E 2001, 63, 066218. [Google Scholar] [CrossRef] [PubMed]
- Lawrence, J.S.; Kane, D.M. Nonlinear dynamics of a laser diode with optical feedback systems subject to modulation. IEEE J. Quantum Electron. 2002, 38, 185. [Google Scholar] [CrossRef][Green Version]
- Marino, F.; Giudici, M.; Barland, S.; Balle, S. Experimental evidence of stochastic resonance in an excitable optical system. Phys. Rev. Lett. 2002, 88, 040601. [Google Scholar] [CrossRef] [PubMed]
- Lam, W.-S.; Guzdar, P.N.; Roy, R. Effect of spontaneous emission noise and modulation on semiconductor lasers near threshold with optical feedback. Int. J. Mod. Phys. B 2003, 17, 4123. [Google Scholar] [CrossRef]
- Toomey, J.P.; Kane, D.M.; Lee, M.W.; Shore, K.A. Nonlinear dynamics of semiconductor lasers with feedback and modulation. Opt. Express 2010, 18, 16955. [Google Scholar] [CrossRef]
- Ahmed, M.; El-Sayed, N.Z.; Ibrahim, H. Chaos and noise control by current modulation in semiconductor lasers subject to optical feedback. Eur. Phys. J. D 2012, 66, 141. [Google Scholar] [CrossRef]
- Spitz, O.; Wu, J.G.; Carras, M.; Wong, C.W.; Grillot, F. Chaotic optical power dropouts driven by low frequency bias forcing in a mid-infrared quantum cascade laser. Sci. Rep. 2019, 9, 4451. [Google Scholar] [CrossRef] [PubMed]
- Spitz, O.; Wu, J.G.; Herdt, A.; Carras, M.; Elsasser, W.; Wong, C.W.; Grillot, F. Investigation of chaotic and spiking dynamics in mid-infrared quantum cascade lasers operating continuous-waves and under current modulation. IEEE J. Sel. Top. Quantum Electron. 2019, 25, 1200311. [Google Scholar] [CrossRef]
- Aragoneses, A.; Sorrentino, T.; Perrone, S.; Gauthier, D.J.; Torrent, M.C.; Masoller, C. Experimental and numerical study of the symbolic dynamics of a modulated external-cavity semiconductor laser. Opt. Express 2014, 22, 4705. [Google Scholar] [CrossRef] [PubMed]
- Sorrentino, T.; Quintero-Quiroz, C.; Aragoneses, A.; Torrent, M.C.; Masoller, C. Effects of periodic forcing on the temporally correlated spikes of a semiconductor laser with feedback. Opt. Express 2015, 23, 5571. [Google Scholar] [CrossRef]
- Tiana-Alsina, J.; Quintero-Quiroz, C.; Panozzo, M.; Torrent, M.C.; Masoller, C. Experimental study of modulation waveforms for entraining the spikes emitted by a semiconductor laser with optical feedback. Opt. Express 2018, 26, 9298. [Google Scholar] [CrossRef] [PubMed]
- Tiana-Alsina, J.; Quintero-Quiroz, C.; Torrent, M.C.; Masoller, C. Quantifying the degree of locking in weakly forced stochastic systems. Phys. Rev. E 2019, 99, 022207. [Google Scholar] [CrossRef]
- Tiana-Alsina, J.; Quintero-Quiroz, C.; Masoller, C. Comparing the dynamics of periodically forced lasers and neurons. New J. Phys 2019, 21, 103039. [Google Scholar] [CrossRef]
- Yao, N.Y.; Nayak, C. Time crystals in periodically driven systems. Phys. Today 2018, 71, 40. [Google Scholar] [CrossRef]
- Sacha, K.; Zakrzewski, J. Time crystals: A review. Rep. Prog. Phys. 2018, 81, 016401. [Google Scholar] [CrossRef]
- Tiana-Alsina, J.; Masoller, C. Time crystal dynamics in a weakly modulated stochastic time delayed system. Bull. Am. Phys. Soc. 2022; Submitted. [Google Scholar]
- Tiana-Alsina, J.; Masoller, C. Dynamics of a semiconductor laser with feedback and modulation: Experiments and model comparison. Opt. Express, 2022; in press. [Google Scholar] [CrossRef]
- Lang, R.; Kobayashi, K. External optical feedback effects on semiconductor injection-laser properties. IEEE J. Quantum Electron. 1980, 16, 347. [Google Scholar] [CrossRef]
- Tiana-Alsina, J.; Masoller, C. Locking phenomena in semiconductor lasers near threshold with optical feedback and sinusoidal current modulation. Appl. Sci. 2021, 11, 7871. [Google Scholar] [CrossRef]
- Barland, S.; Spinicelli, P.; Giacomelli, G.; Marin, F. Measurement of the working parameters of an air-post vertical-cavity surface-emitting laser. IEEE J. Quantum Electron. 2005, 41, 1235. [Google Scholar] [CrossRef]
Publisher’s Note: MDPI stays neutral with regard to jurisdictional claims in published maps and institutional affiliations. |
© 2022 by the authors. Licensee MDPI, Basel, Switzerland. This article is an open access article distributed under the terms and conditions of the Creative Commons Attribution (CC BY) license (https://creativecommons.org/licenses/by/4.0/).