Review

Line Field Optical Coherence Tomography

1
Department of Electrical Engineering and Electronics, University of Liverpool, Liverpool L69 3GJ, UK
2
Department of Eye and Vision Science, University of Liverpool, Liverpool L7 8TX, UK
*
Author to whom correspondence should be addressed.
Photonics 2022, 9(12), 946; https://doi.org/10.3390/photonics9120946
Submission received: 26 October 2022 / Revised: 23 November 2022 / Accepted: 1 December 2022 / Published: 7 December 2022
(This article belongs to the Special Issue Recent Advances in Optical Coherence Tomography)

Abstract

:
The line field (LF) design choice for the lateral image formation mechanism (lateral format) has historically been a fraction of the whole optical coherence tomography (OCT) field. However, as the OCT technology develops, the parallelised acquisition of LF-OCT formats (LF-time domain (TD)-OCT, LF-spectral domain (SD)-OCT, LF-swept source (SS)-OCT) offers benefits and capabilities, which may mean it is now becoming more mainstream. Prior reviews on OCT have focused on scanning point (SP) and, to a lesser extent, full field (FF), lateral formats, with, to our knowledge, no prior review specifically on the LF lateral format. Here, we address this gap in the literature by reviewing the history of each LF-OCT format, identifying the applications it has had and providing generic system design overviews. We then provide an analysis and discussion of the benefits and drawbacks of the format.

1. Context, Introduction and Scope of Review

The term, technique and seminal paper on optical coherence tomography (OCT) was published in 1991 [1] by David Huang et al. of James Fujimoto’s research group at MIT. This paper became the catalyst of what is now a massive research (over 28,000 research papers with “optical coherence tomography” or related terms in the title [2]) and commercial (over USD 1 billion sales per year [3,4]) field. However, the original paper only described one specific type of OCT system, namely, scanning point (SP) sequential time domain (TD), which is a tiny fragment (by concept, number of recent papers and current sales figures) of this field. In subsequent years, the field has been developed and the term subsequently broadened. Here, we can define OCT to be any tomographic imaging where the axial resolution of the signal is achieved by low coherence interferometry (LCI) [5,6]. There are two key properties of this definition that have contributed to the success of the technique. Firstly, LCI detection provides excellent signal to noise ratio (SNR) values, usually within a few dB of the fundamental photon shot noise limit, providing a far higher image dynamic range than any competitive technique, such as confocal microscopy, and this high SNR also allows it to be readily adapted into functional imaging modalities, such as OCT angiography (OCTA) [7] and optical coherence elastography (OCE) [8]. Secondly, the axial ranging and resolution are independent of the optics used and lateral resolution (with some potential minor caveating for high numerical aperture (NA) systems [9]). For example, this means that systems can have a high axial resolution while maintaining a large imaging depth of field. This is not possible in confocal microscopy.
Since 1991, OCT technology has expanded, and there are a wide variety of possible technical solutions for devices to obtain fundamentally the same result. However, any true OCT system can be characterised by two properties: how the image is axially resolved and how it is laterally resolved. Both properties have three common groupings of solutions each, giving a total of nine types of true OCT systems. Table 1 shows these characterising properties and gives an early seminal paper for each of the nine true OCT types. For axial resolution, the three methods, TD (which can be further subdivided into three categories: conventional sequential, linear (see chapter 12 in Ref. [10]) and off-axis [11]), spectral domain (SD) [12] and swept source (SS) [13], are very well explained in the majority of OCT textbooks [10,14,15] and review papers [16,17,18,19,20,21,22,23], so we will not re-cover this material here.
Closely related and partially overlapping linear TD, another axial resolution format commonly referred to as OCT in the literature is axial–lateral (AL) (also known as grating-generated OCT). However, as investigated by Tang et al. [24], the mechanism of resolution is dependent on the lateral resolving optics. Therefore, we do not consider it a true OCT setup according to our definition; instead, we labelled it pseudo-OCT and highlighted it in yellow in Table 1. Importantly for this review, we identified LF-AL systems, whereas, although LF linear-TD systems—which have independence between the axial and lateral resolution but are otherwise conceptually identical—appear theoretically possible, we did not come across a publication of such a system, and it is likely to be impractical.
Figure 1 shows the three lateral resolution methods (formats). Historically and currently, SP, where a point (beam) of light is raster scanned over the sample to construct B-scan and 3D tomography, is the most common type. One reason for this is that SP systems can be easily realised with fibre optic setups, making them easy, convenient and compact to engineer. Full field is the opposite approach, with the optics set up in the same manner as a standard camera, collecting lateral information simultaneously. The immediately apparent additional issue in comparison to SP systems, if using spatially coherent light sources [25], is that out of focus light at the detector can give cross-talk artefact signals, which can be detrimental to image quality. For FF TD (but not FF SS) systems, this is usually overcome by using light sources (e.g., thermal or large surface area LED) (and appropriate illumination optics) that give low spatial coherence illumination at the object plane. (Conversely, these sources are unsuitable for SP OCT due to the resultant low point intensity.) FF is the most common alternative lateral format, with recent reviews by Thouvenin et al. [26] and Wang et al. [27]. Line field (LF) is half way between SP and FF, with a line across the sample or patient being illuminated and imaged. In one lateral dimension, it is the same as SP, while in the other, it is the same as FF. Although LF-OCT is covered in the broader scope of Ref. [28], to the authors’ knowledge, there has been no previous specific comprehensive review on the topic of LF-OCT, leaving a gap in the prior literature. This topic area is highlighted in green in Table 1.
The term holographic line field does appear in the literature, although in all cases reviewed, we class this as a misnomer, depending on the definition of “holographic” used. For instance, the opening sentence on holography from the Encyclopædia Britannica [38] is the “means of creating a unique photographic image without the use of a lens”. This definition reflects that holography is the effective recording of a far-field diffraction field, with (complex/3D/real) image reconstruction (of the desired object plane) by either illumination of the physical recording medium with the reference light or by numerical calculation in digital holography [39]. Such a holographic OCT system has been demonstrated in an FF-SS format by Hillman et al. [40] of the University of Lubeck group. The identified misnomered systems are all LF-TD setups and will be discussed in that section.
One technique that blurs the boundary between LF and SP formats, but will not be considered within the scope of the rest of this review, is spectrally encoded line field (SELF) OCT, which has been developed and demonstrated by the Nanyang Technological University group [41]. This technique creates a chromatically dispersed short LF; however, the scanning is performed as in a SP system, overlapping the LFs and allowing all the spectral information for each lateral point to be collected. In comparison to conventional SP systems, this allows higher optical powers to be used safely [42] and better effective temporal sampling for OCT angiography [43].
In this review paper, we aim to cover the history, technical variations, applications and provide discussion on the pros, cons and likely future direction of all OCT types using the LF lateral format. The remainder of this paper is organised as follows. Section 2 covers the technical details common to all LF formats. We then provide a review of the history, construction and current applications of each LF-OCT axial type: Section 3—SD-OCT, Section 4—TD-OCT and AL-OCT, and Section 5—SS-OCT. In Section 6, we discuss separately the potential benefits, which may lead to more widespread use, and the potential drawbacks of the lateral format, which have prevented it from becoming the default OCT type already. In Section 7, brief conclusions on the LF-OCT format are drawn. Although we endeavoured to provide as comprehensive a review as possible, we cannot guarantee our identified literature is a complete reflection of the whole LF-OCT sub-field.

2. Design Choices Common to All LF-OCT Axial Formats

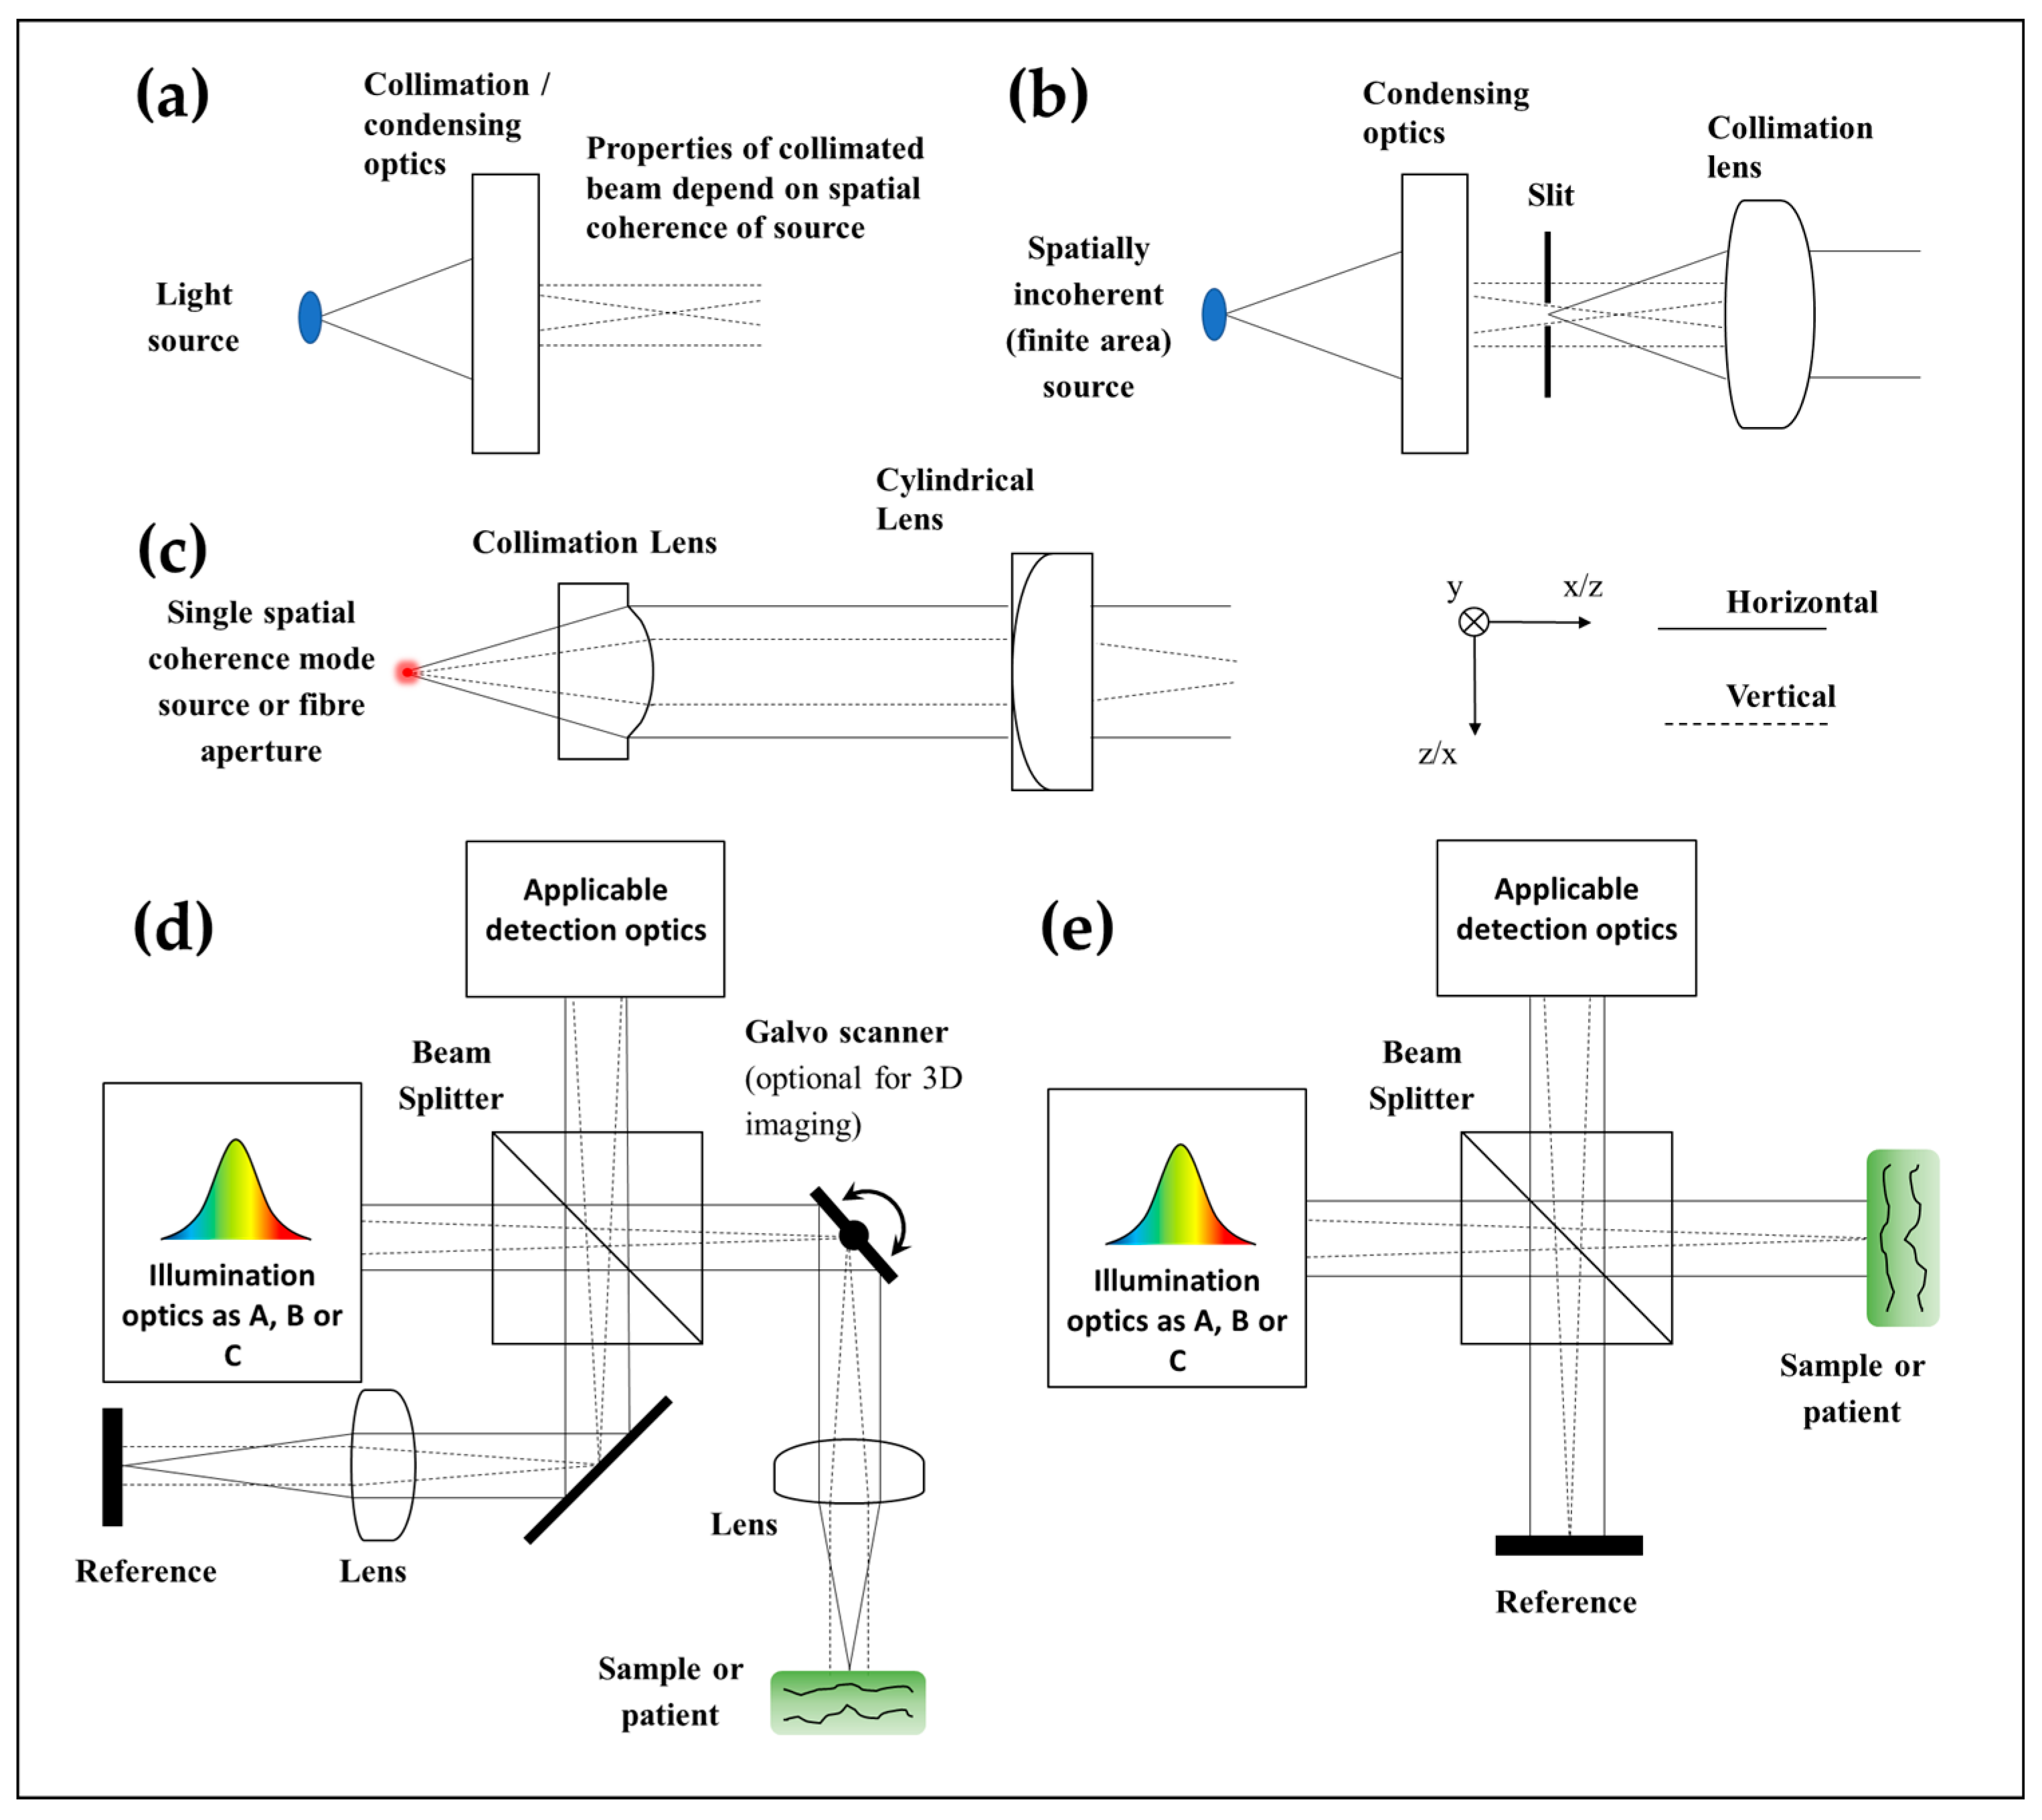
Before each individual axial format is reviewed, we will first cover the design variations common to multiple LF-OCT formats. A design choice applicable to all LF-OCT formats is how to achieve LF illumination. We can divide the illuminating optics path into two combined halves: the first half in the illumination arm of the interferometer where it is not shared with the imaging path (Figure 2a–c) and the second half where it is (Figure 2d,e). Regarding the first half of the illumination path, first, we will note that in some configurations, it is technically feasible, and practical for large spatial area (spatially incoherent) thermal sources, to use full field illumination instead [35,44] (Figure 2a). For efficient use of single spatial coherence mode light sources, for some configurations or to achieve confocal gating, it is essential to have line field illumination. For spatially incoherent sources, the practical way to do this is the illumination of a preceding slit and the imaging of this slit onto the sample [45] (Figure 2b). For single spatial mode sources, the most efficient method instead is the use of an astigmatic optical component, i.e., a cylindrical, acylindrical or Powell lens (Figure 2c).
Of greatest relevance when an astigmatic optic (Figure 2c) is being used, but also applicable to the other two configurations (Figure 2a,b), for the first half of the illumination path; there are two optical configurations of the second half that can be applied to generate the line field—negative and positive. In Figure 2d (and all the other true OCT diagram examples in this paper), the line field is generated negatively. For a negatively generated line field, the illumination path shares an objective lens with the imaging path. In the astigmatic case (Figure 2c), for the use of this configuration (Figure 2d), the astigmatic lens acts to defocus/de-collimate in the line dimension at the object plane, while the objective brings the light in the lateral dimension (perpendicular to the line dimension), unaffected by the astigmatic optic, to a focus at the object plane (i.e., removal of the astigmatic optic would result in single point illumination). In the slit generation case (Figure 2b), the objective creates an image of the slit at the object plane, and in the FF illumination case (Figure 2a), the objective lens will have an effect of flipping between critical and Kohler illumination or similar. The light returned (from the object plane) through the objective lens is then focused at infinity (collimated) and is then handled by appropriate optics in the collection arm. Because there is no requirement for components between the sample/patient and the objective lens, this configuration is recommended where optical performance is prioritised.
Figure 2e shows the alternative positive line field generation, where the optics in the illumination arm solely control light illumination. The illumination and imaging paths share no optics (or theoretically, a zero optical power system). In the astigmatic optic case (Figure 2c), the astigmatic optic directly creates the line focus at the imaging plane. A modification within the illumination arm of the given slit illumination example (Figure 2b) would be required to bring the slit to focus on the object plane. For the FF illumination (Figure 2a), likewise, the optics in the illumination arm would determine the type of illumination. In this positive illumination case (Figure 2e), the objective lens has to be behind the beam splitter separating the illumination and collection arms. As this is generally a cube beam splitter, this adds a significant amount of glass being imaged through adding optical aberrations. As a result, this configuration is generally [46,47] used (in combination with a LF-SD slit-less design) where minimising the cost and complexity, by minimising the amount of optics, is the priority.
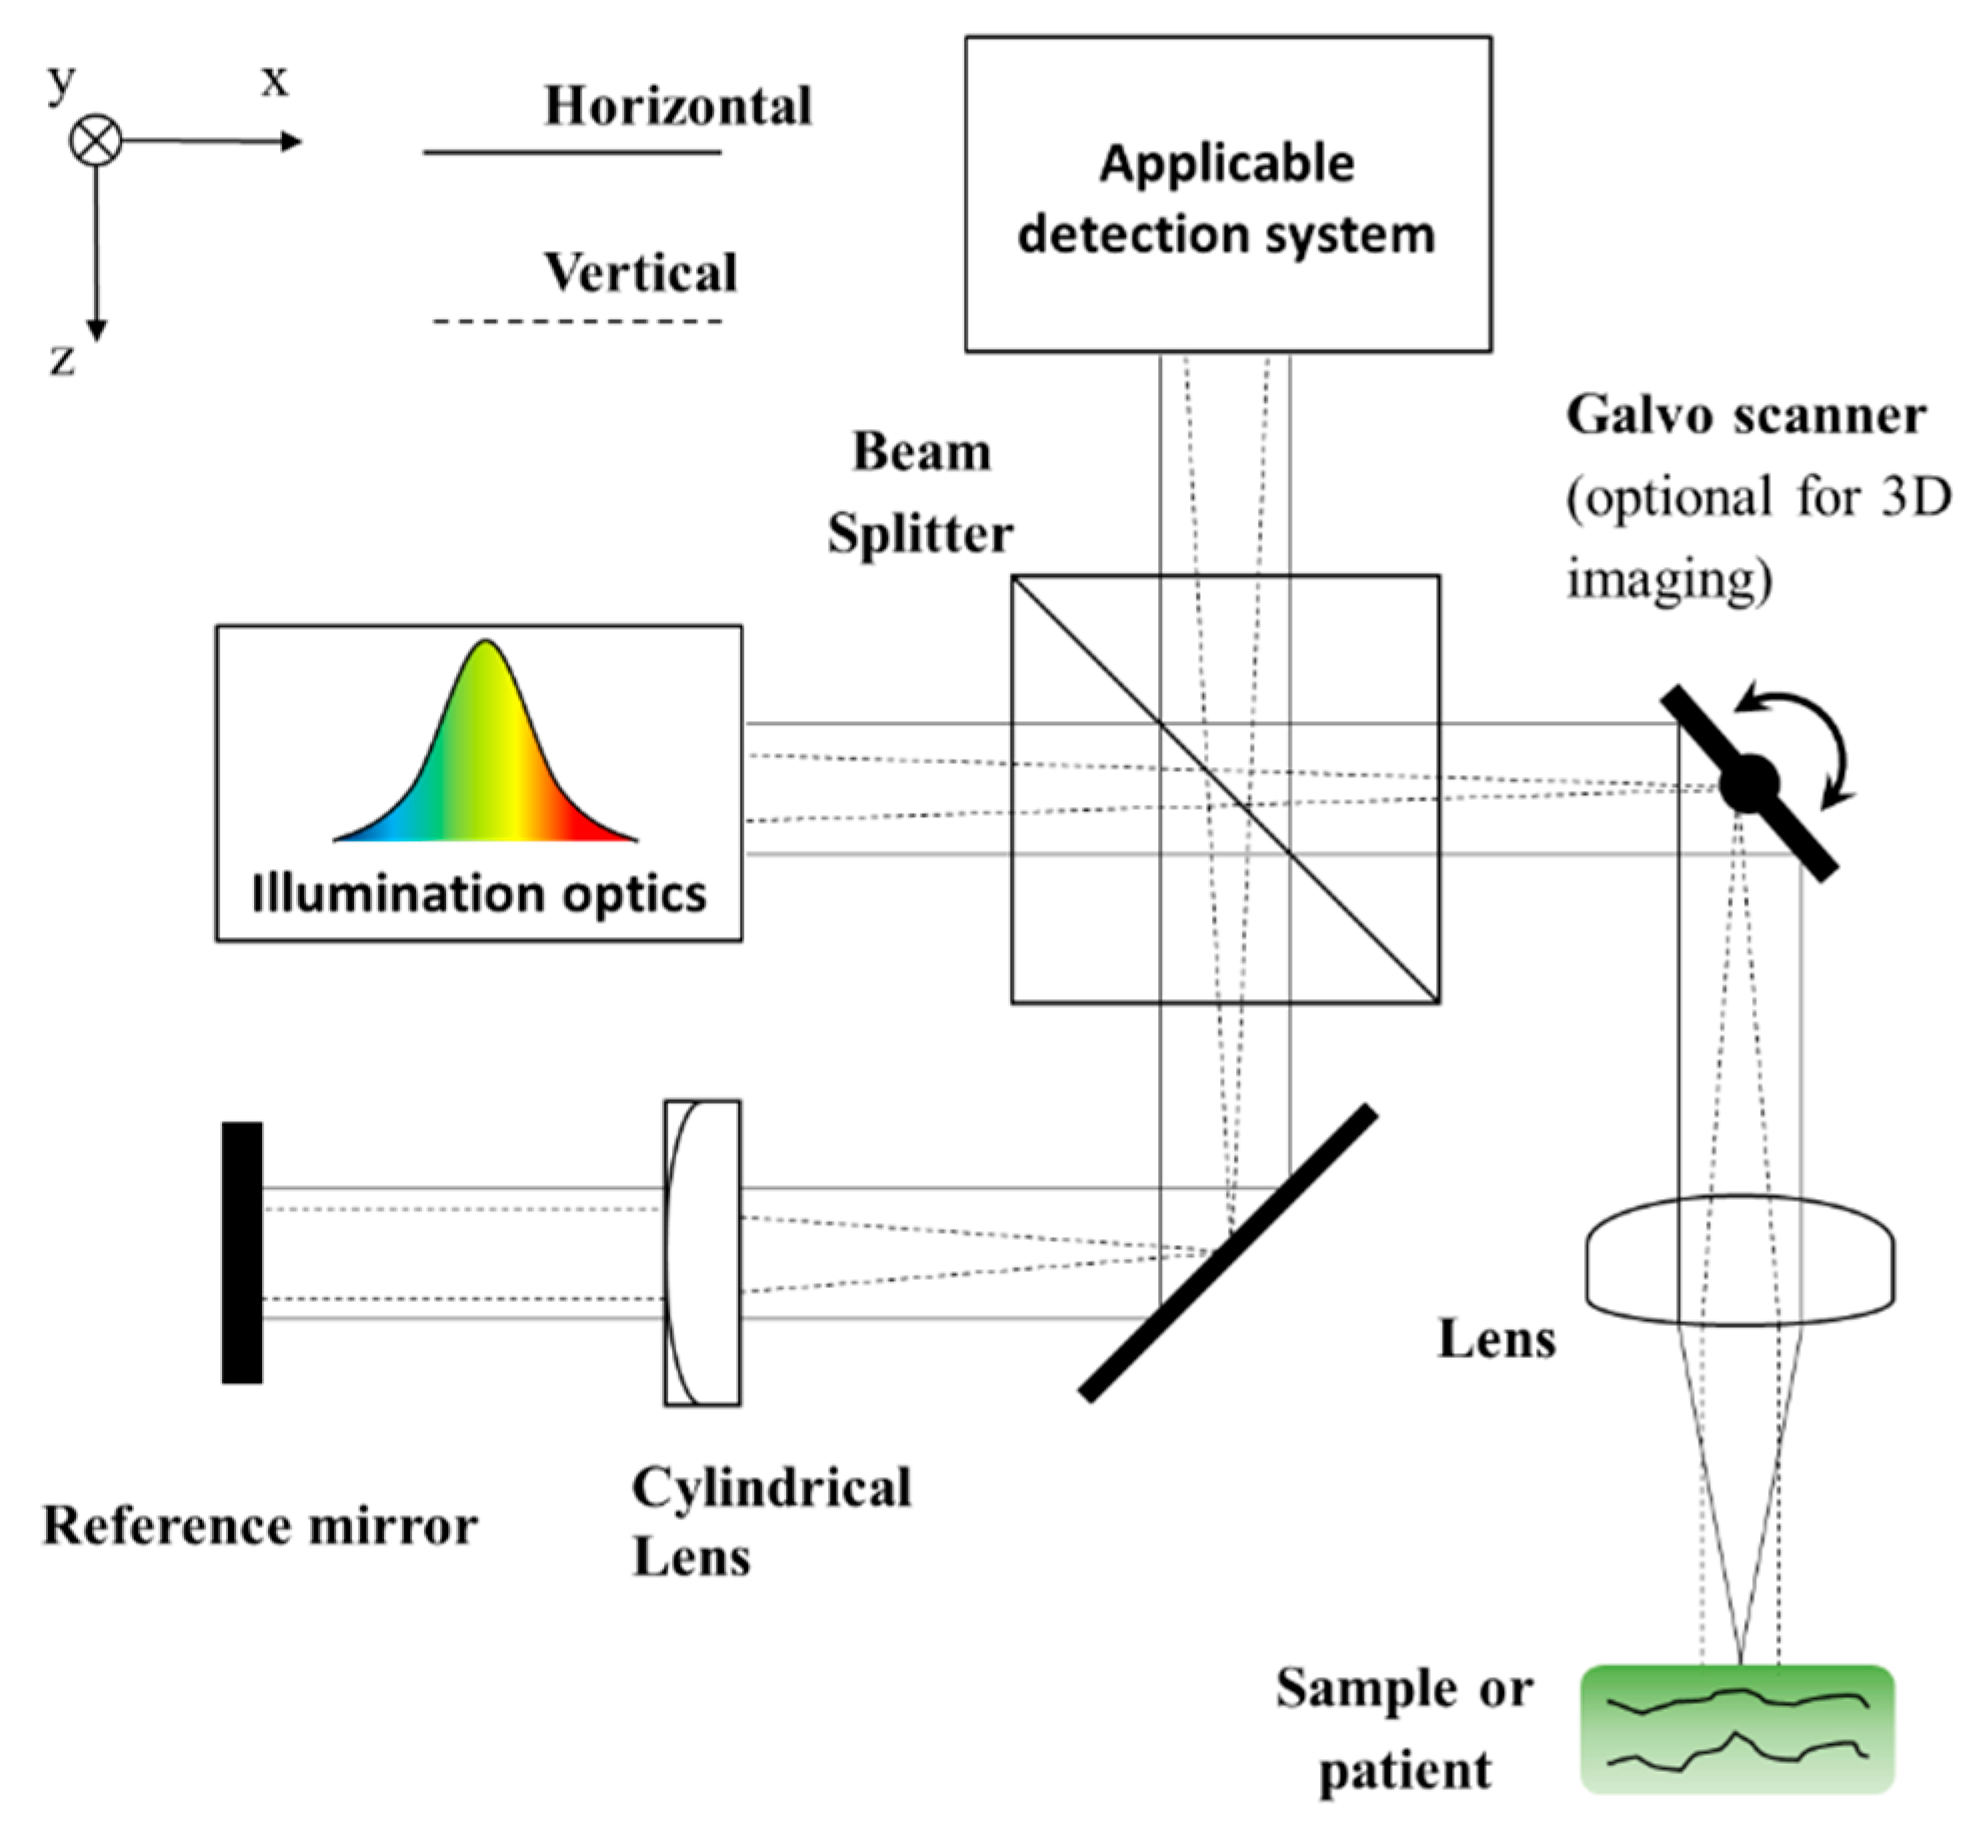
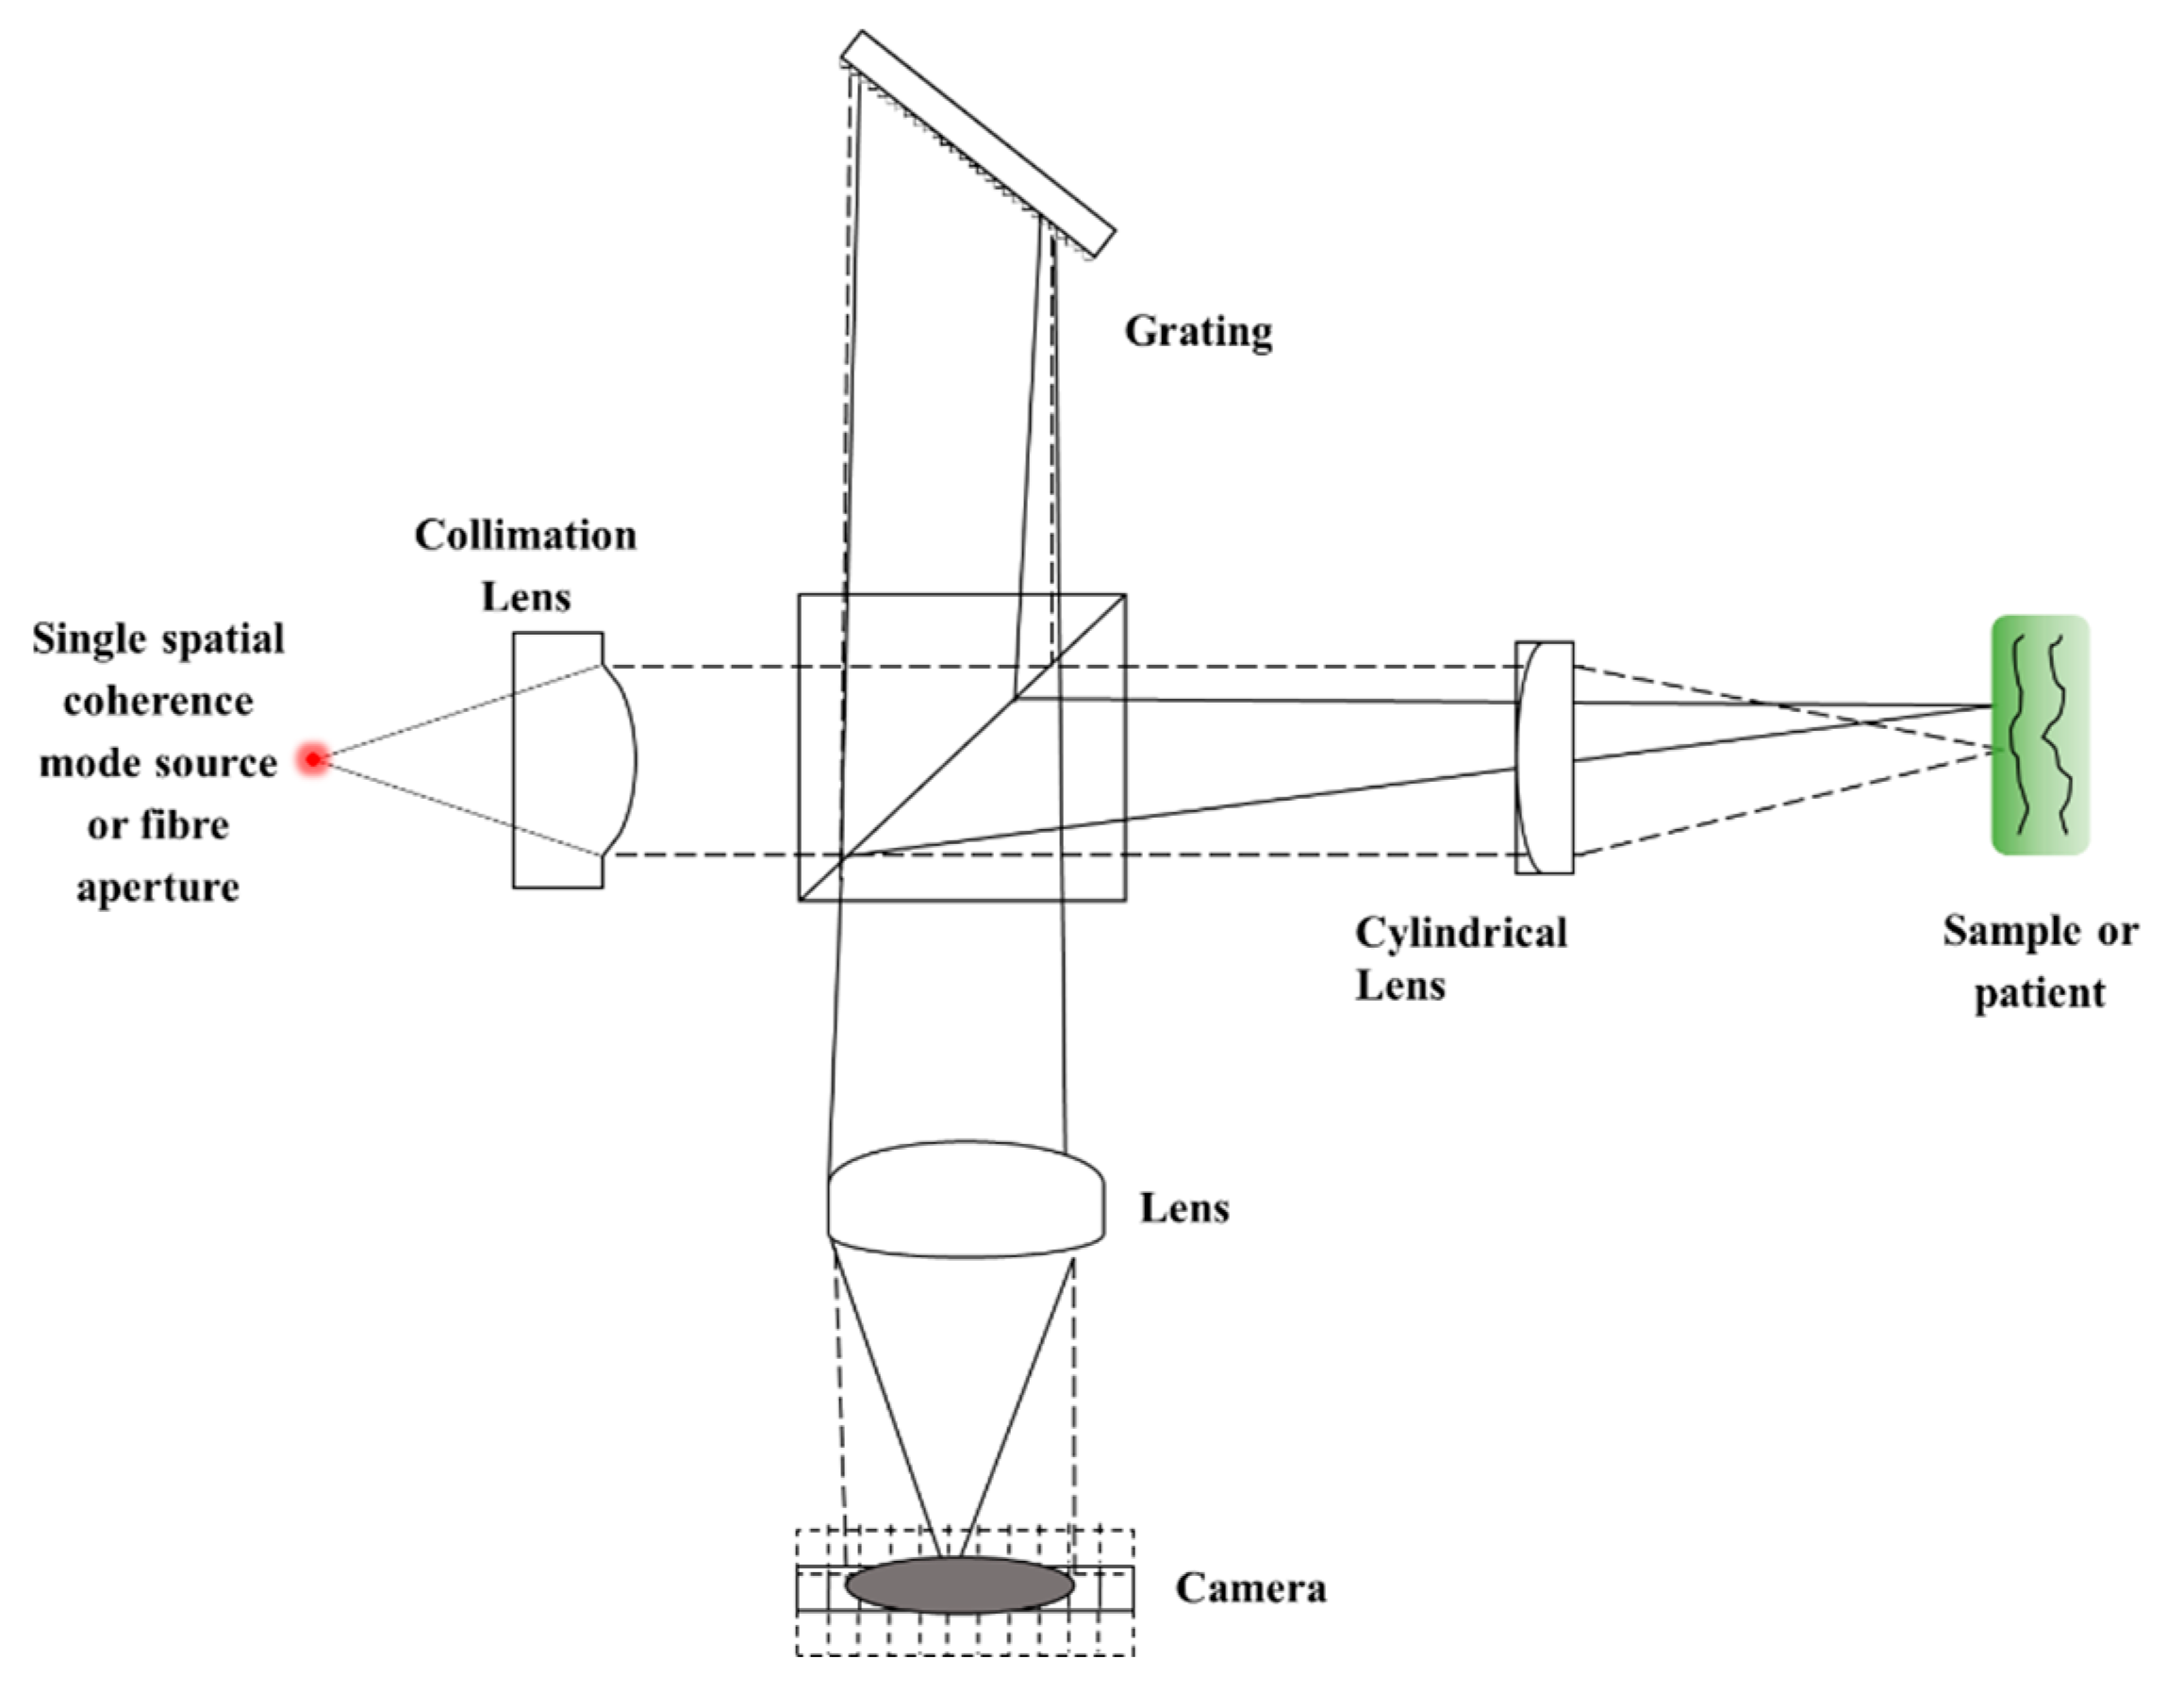
Another design choice applicable to all LF true OCT formats is how to path the light in the reference arm. In the other examples throughout this paper, a Linnik approach has been adopted; that is, the optics in the reference arm is identical to the sample arm. For spatially incoherent sources, this is essential to achieve interference, while for single spatial mode sources, the benefit of this approach is the dispersion of optical components being automatically matched. For single spatial mode sources, the alternative approach [48,49,50] is to re-collimate the light in the reference arm by means of a second cylindrical lens (or other astigmatic optics), as shown in Figure 3. If the amount and cost of optics in the sample arm are large, the benefit of this arrangement is that it does not have to be duplicated. Usually, due to the differences in amounts of optical glass in each arm, a physical dispersion correction (e.g., a pair of prisms) will have to be added to the setup.
Finally, there are design choices that are common to all OCT systems. In terms of the interferometer, we are not aware of any free space arrangement commonly applied to OCT that would not be feasible in a LF format. Indeed, there are examples of both Linnik [51,52,53] and non-Linnik [48,49,50] Michelson types, Mach–Zehnder [54], Mirau [55,56] and Fizeau [57] interferometers. Going beyond the bounds of interferometry, therefore OCT, the engineered reference can be removed entirely and rely on certain samples to provide their own reference path in reflectometry, giving quasi-tomograms [58]. There are two key properties of a light source that determine whether it is suitable for a given application and OCT format: spectral bandwidth and spatial coherence. In terms of the LF format, there are no additional factors affecting spectral bandwidth that need to be considered in comparison to other OCT formats, so we will not discuss this further here. The axial resolution (which is fundamentally light travel time difference resolution) follows the same laws of physics as any other OCT. For any OCT, the (normalised) axial point spread function (PSF) (I), in terms of time delay (t), is given by the Fourier transform (FT) of the effective spectra (S’) as a function of angular frequency (ω):
I ( t ) = F T ( S ( ω ) )
This (for simplicity here ignoring the second and higher order phase dispersion (i.e. group dispersion) between the two paths, which is generally corrected for anyway but is a separate topic) is converted to distance within the sample by
z = t c 2 n G
where c is the speed of light in a vacuum, factor 2 occurs due to the light traversing the distance twice in reflection mode imaging, and nG is the group refractive index of the material over that distance. In short, the general result is that a larger bandwidth and shorter central wavelength (higher angular frequency) give a better axial resolution.
For spatial coherence, as LF is a halfway house between SP, which strongly favours spatially coherent sources, and FF, which favours to some extent spatially incoherent sources due to the suppression of unwanted optical cross-talk (see Section 6.2.1 for further details), it is reasonable to assume that both spatially coherent and incoherent sources would be utilised, and, certainly in the older literature, this is true [44]. However, especially given the advent of supercontinuum light sources [52,53,59,60] and (to a lesser extent in terms of the available bandwidth) broadband composite SLD light sources, meaning that the available bandwidth is no longer a dependent factor in the selection, the majority of modern systems utilise a spatially coherent source. The ability of single mode spatially coherent sources to efficiently create line field illumination (all the light can be focused to a line of width (diffraction or aberration) limited by the optics; this cannot be achieved for spatially incoherent sources) means that the imaging speed is much higher. This more efficient confocal gate results in lower integration times, meaning in vivo imaging is practical due to lower washout [48]. The 1D confocal gate and use of decent optics mean that cross-talk is not normally a practical issue of concern (see Section 6.2.1 for further details).
Although, due to point vs. field illumination, a theoretical argument could be made that confocal gating could lead to some small improvement in the lateral PSF (resolution) in otherwise equivalent imaging systems, this effect is generally not regarded as significant to the authors’ knowledge. The lateral resolution of OCT systems is therefore independent of its lateral format (e.g., LF); it is determined by the optics (ignoring holographic setups) used. The diffraction limit (best achievable) for lateral resolution for any OCT system will be given approximately by the Abbe formula:
D = λ 2 N A
where λ is the wavelength, and NA is the numerical aperture (NA) of the system (usually determined by objective lens). High NA optics therefore give better lateral resolution; however, for any OCT system that does not use a sequential TD axial format, this is an issue, because the depth of field (volume depth in reasonable focus) is proportional to the Rayleigh length, which, with paraxial and geometrical approximations, is crudely given by
r 2 λ 4 N A 2
Therefore, the objective lens choice for any OCT system that does not use sequential TD for axial resolution (i.e., covering LF, FF or SD lateral formats) is a compromise on the choice of NA in order to achieve both the lateral resolution and depth of field required for a given application. The additional factors to be considered in a system’s optic design include the required lateral image size, detector dimensions and physically available optics.

3. Spectral Domain (SD)

3.1. SD: Timeline of Published Developments and Applications

The first LF SD OCT and the first LF true OCT system was published by Zuluaga and Richards-Kortum from the University of Texas, Austin, in 1999 [35]. In 2003, Vakhtin et al. [57] of Southwest Sciences published a modification of this design using a Fizeau interferometer design and demonstrated ex vivo imaging of biological samples. The year 2005 was a seminal year for LF SD OCT, with Grajciar et al. of the massive OCT group at the Medical University (MU) of Vienna demonstrating in vivo imaging of the cornea [61]. Zhang et al. of Indiana University not only first demonstrated in vivo imaging of the retina, but the system also utilised physical adaptive optics to give field-leading image quality [62]. Exporting this technology away from OCT, Endo et al., University of Tsukuba, produced the first publication on the application of this technology to profilometry measurements [51] in metrology. The next year, 2006, this same Tskuba group demonstrated in vivo dermatological OCT imaging [63], showing the commonality between the two fields. Reolon et al., University of St Etienne, were the second group to demonstrate the profilometry application [60]. Manuel H. De la Torre-Ibarra, Centro de Investigaciones en Óptica Asociación Civil, completed his thesis [64] and published [65], in collaboration with Ruiz and Huntley of Loughborough University, the first demonstration of phase microscopy/imaging with an LF-SD setup. The use of Fourier phase [47,49,66,67] information enables a wide variety of functional imaging applications.
By 2007, the principles and the practical imaging capability of LF SD OCT had been established. Považay, Drexler and Leitgeb of MU Vienna published a book chapter [28] covering both, new at the time, LF-SD and FF-SS OCT formats. From this point onwards, the key publications focused on performance improvement, more complex technology and new applications. Nakamura et al. [48] of the Tsukuba group also demonstrated in vivo imaging of the retina. The focus of this paper was on delivering improved imaging speed—51.5 and 831 kA-Scans/s for volume and single B-Scan captures, respectively. The same first author and group also published the first paper [68] on using digital adaptive optics in LF-SD format. Bu, Wang and Susaki [69] of the Chinese Academy of Sciences and Niigata University published the first paper to construct full range (FR) SD OCT images, that is, separate out positive and negative Fourier images to double the effective depth range, in a LF setup. This was performed in the relative standard (for SP formats) of phase modulating the reference path. The following year, 2008, the same group utilised a different method to obtain FR, which is only possible in the LF format, using a tilted reference (with relatively smaller sample NA) allowing a separation of positive and negative Fourier image components with a preceding lateral Fourier transform [70]. Additionally, in 2008, Graf, Brown and Wax of the Duke University group published a paper [44] focused on optimising optics spacing in the interferometer (4f format) and using a low spatial coherent (thermal) light source. They applied this to imaging ex vivo samples.
In 2009, Witte et al., VU University, published [71] an alternative method, not unique to the LF format, for FR, this being the utilisation of physical dispersion and numerical dispersion correction (NDC). Yaqoob et al., MIT, published a seminal paper [66] demonstrating the full capabilities of the LF-SD format for Fourier-phase-based measurements. In 2010, Grajciar et al., MU Vienna, also demonstrated [49] this property, as well as a leading imaging speed of 512 kA-Scan/s. The year 2010 also saw the first [72] of a series [73] of publications by Mohammad Kamal from his PhD [74], developing a complete reflective-optics-based system, thereby removing chromatic dispersion and chromatic aberrations as a factor in ultra-high axial resolution (UHR) systems. The drawback of this is instead having to contend with worse achromatic aberration issues induced by using off-axis reflective optics, which is likely why we are not aware of any subsequent research or applications using this concept.
The year 2011 produced one of the most prestigious publications covered by the review. Robles et al. of the Duke University group published a paper on true colour OCT in Nature Photonics [59]. This is an example of where, although a LF format was used, this was regarded as a minor technical detail by the authors and not part of the main narrative. The design of the LF-SD-OCT system used in this work was almost identical in layout to the original Zuluaga and Richards-Kortum [35] paper. In the same year, Francisco Robles also published a study on the use of phase measurement with a LF-SD setup to measure the refractive index and dispersion [75]. Additionally, in 2011, Taufiq Widjanarko from the Loughborough University group published his PhD thesis [76] investigating both profilometry and phase measurement applications with LF-SD setups.
In 2012, Xiao and Fu, Huazhong University of Science and Technology, published [77] a system more focused towards OCM, improving lateral resolutions at the cost of DoF, which also used a halogen light source to achieve high axial resolution. In 2013, Huang et al. [78], Chinese Academy of Sciences, published an update on their group’s lateral carrier method for FR and also [78] the use of lateral averaging in LF-SD to reduce speckle. The years 2014 and 2015 saw a series of publications [79,80,81] by Chen et al., Zhejiang University, applying the format for industrial applications. Additionally, in 2015, Zhang et al. [47], Guangdong University of Technology, and Zhong et al. [67], Fuzhou University, both produced publications on functional imaging applications for industrial applications. Certainly, between 2012 and 2015, the Chinese groups seem to have had the most interest in the format, applying it to industrial quality assurance applications.
In 2015, the publication by de J. Briones-R. et al. [82] showed that the Centro de Investigaciones en Óptica was still actively developing phase-resolved imaging applications. In 2016, the publications by Barrick et al. [53], University of North Carolina at Chapel Hill, and ourselves [52], University of Liverpool, showed that the interest by Western research groups in the format had re-emerged and focused on applying new hardware available to improve on what had been achieved before. Barrick et al. [53] focused on speed and sensitivity in ex vivo scenarios, utilising a massively (relative to most OCT systems) powerful light source. For our part [52], we were interested in developing and improving the technology for UHR imaging of the cornea, demonstrated ex vivo as the basis of future in vivo/clinical devices. We also demonstrated it is feasible to take an OCT B-scan image within the timeframe of a single light source pulse using this format, although we are not aware of anyone pursuing this currently. Additionally, in 2016, Iris Schmidt in collaboration with the MU Vienna group published a dissertation [83] seemingly working towards a UHR LF-SD setup for the imaging/resolution of tear film thickness, and Dawei Tang, University of Huddersfield, published his thesis [84] on profilometry applications of the format.
In 2017, we applied our setup for a phase measurement of the slow deformation process occurring in de-swelling corneas [85], and we also started a series [86,87] of publications using LF-SD technology in industrial (specifically, automotive paint) applications. In 2018, Al-Qazwini et al. [88], National University of Singapore, improved the lateral image sensitivity roll off by replacing the cylindrical lens in the format with a Powell lens. Note that this improvement is transferable to all LF formats, not just LF-SD. With this configuration, they performed high-speed in vivo imaging of chicken embryos. Additionally, in 2018, Dong et al. [89], Beihang University and Guangdong University of Technology, appeared to be the first to use the format for OCE, and Lin et al. [90], Fuzhou University, have published a profilometry application. With a conference publication in 2019 [91] and peer-reviewed publication in 2022 [92], at the time of writing, Han et al., University of Waterloo and Nanyang Technological University, are currently the field leaders in the application of the format to OCM/micro-OCT. In 2020, Jessica Barrick, University of North Carolina at Chapel Hill, published her thesis [93] focused on a magneto-motive application for the ultra-fast system they published previously. In 2021, Xing et al. [94] of the Nanjing Normal University research group published a visible wavelength slit-less Linnik OCM design, applied to imaging of rodent brains.
Finally, in the year of writing, 2022, Sing et al. [95] of the University of Houston OCE group have also been working on using the format for OCE, and our group [56] have demonstrated an in vivo UHR measurement application in the cornea.
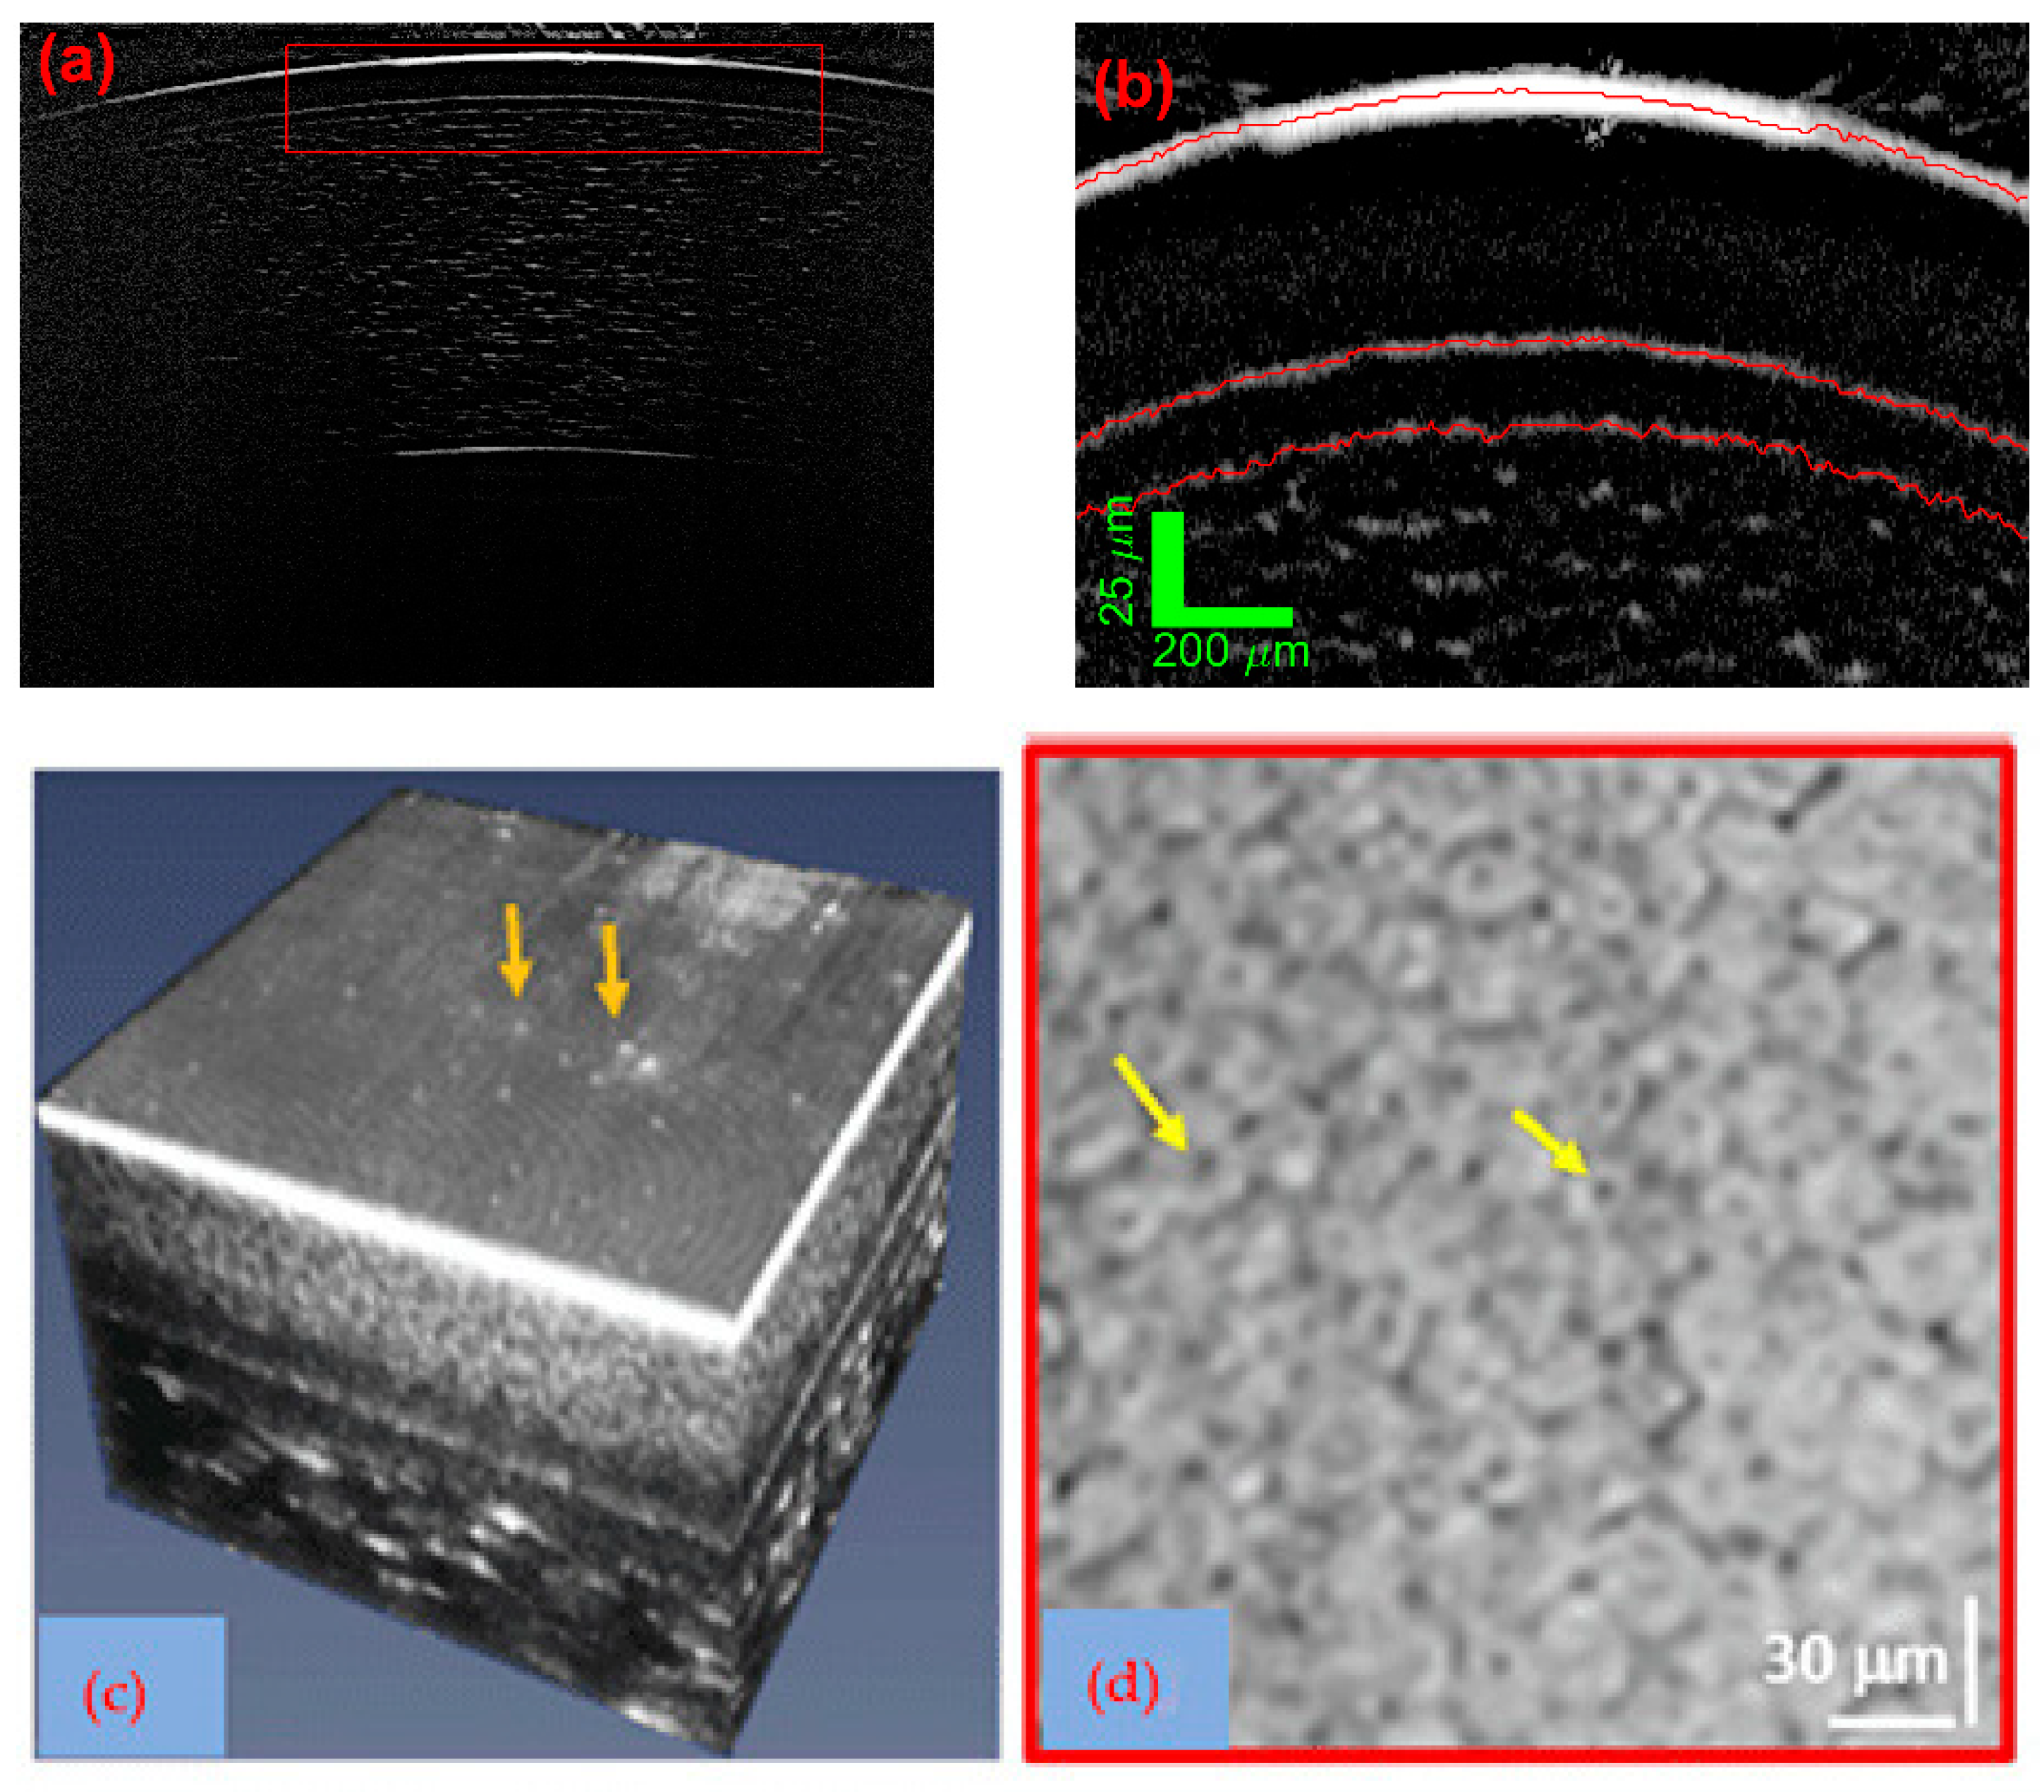
Figure 4 gives recent examples of the image quality that can be achieved by LF-SD-OCT systems. The examples shown highlight the high axial and combined high axial and lateral resolution capabilities of LF SD OCT.

3.2. SD: System Construction Guide

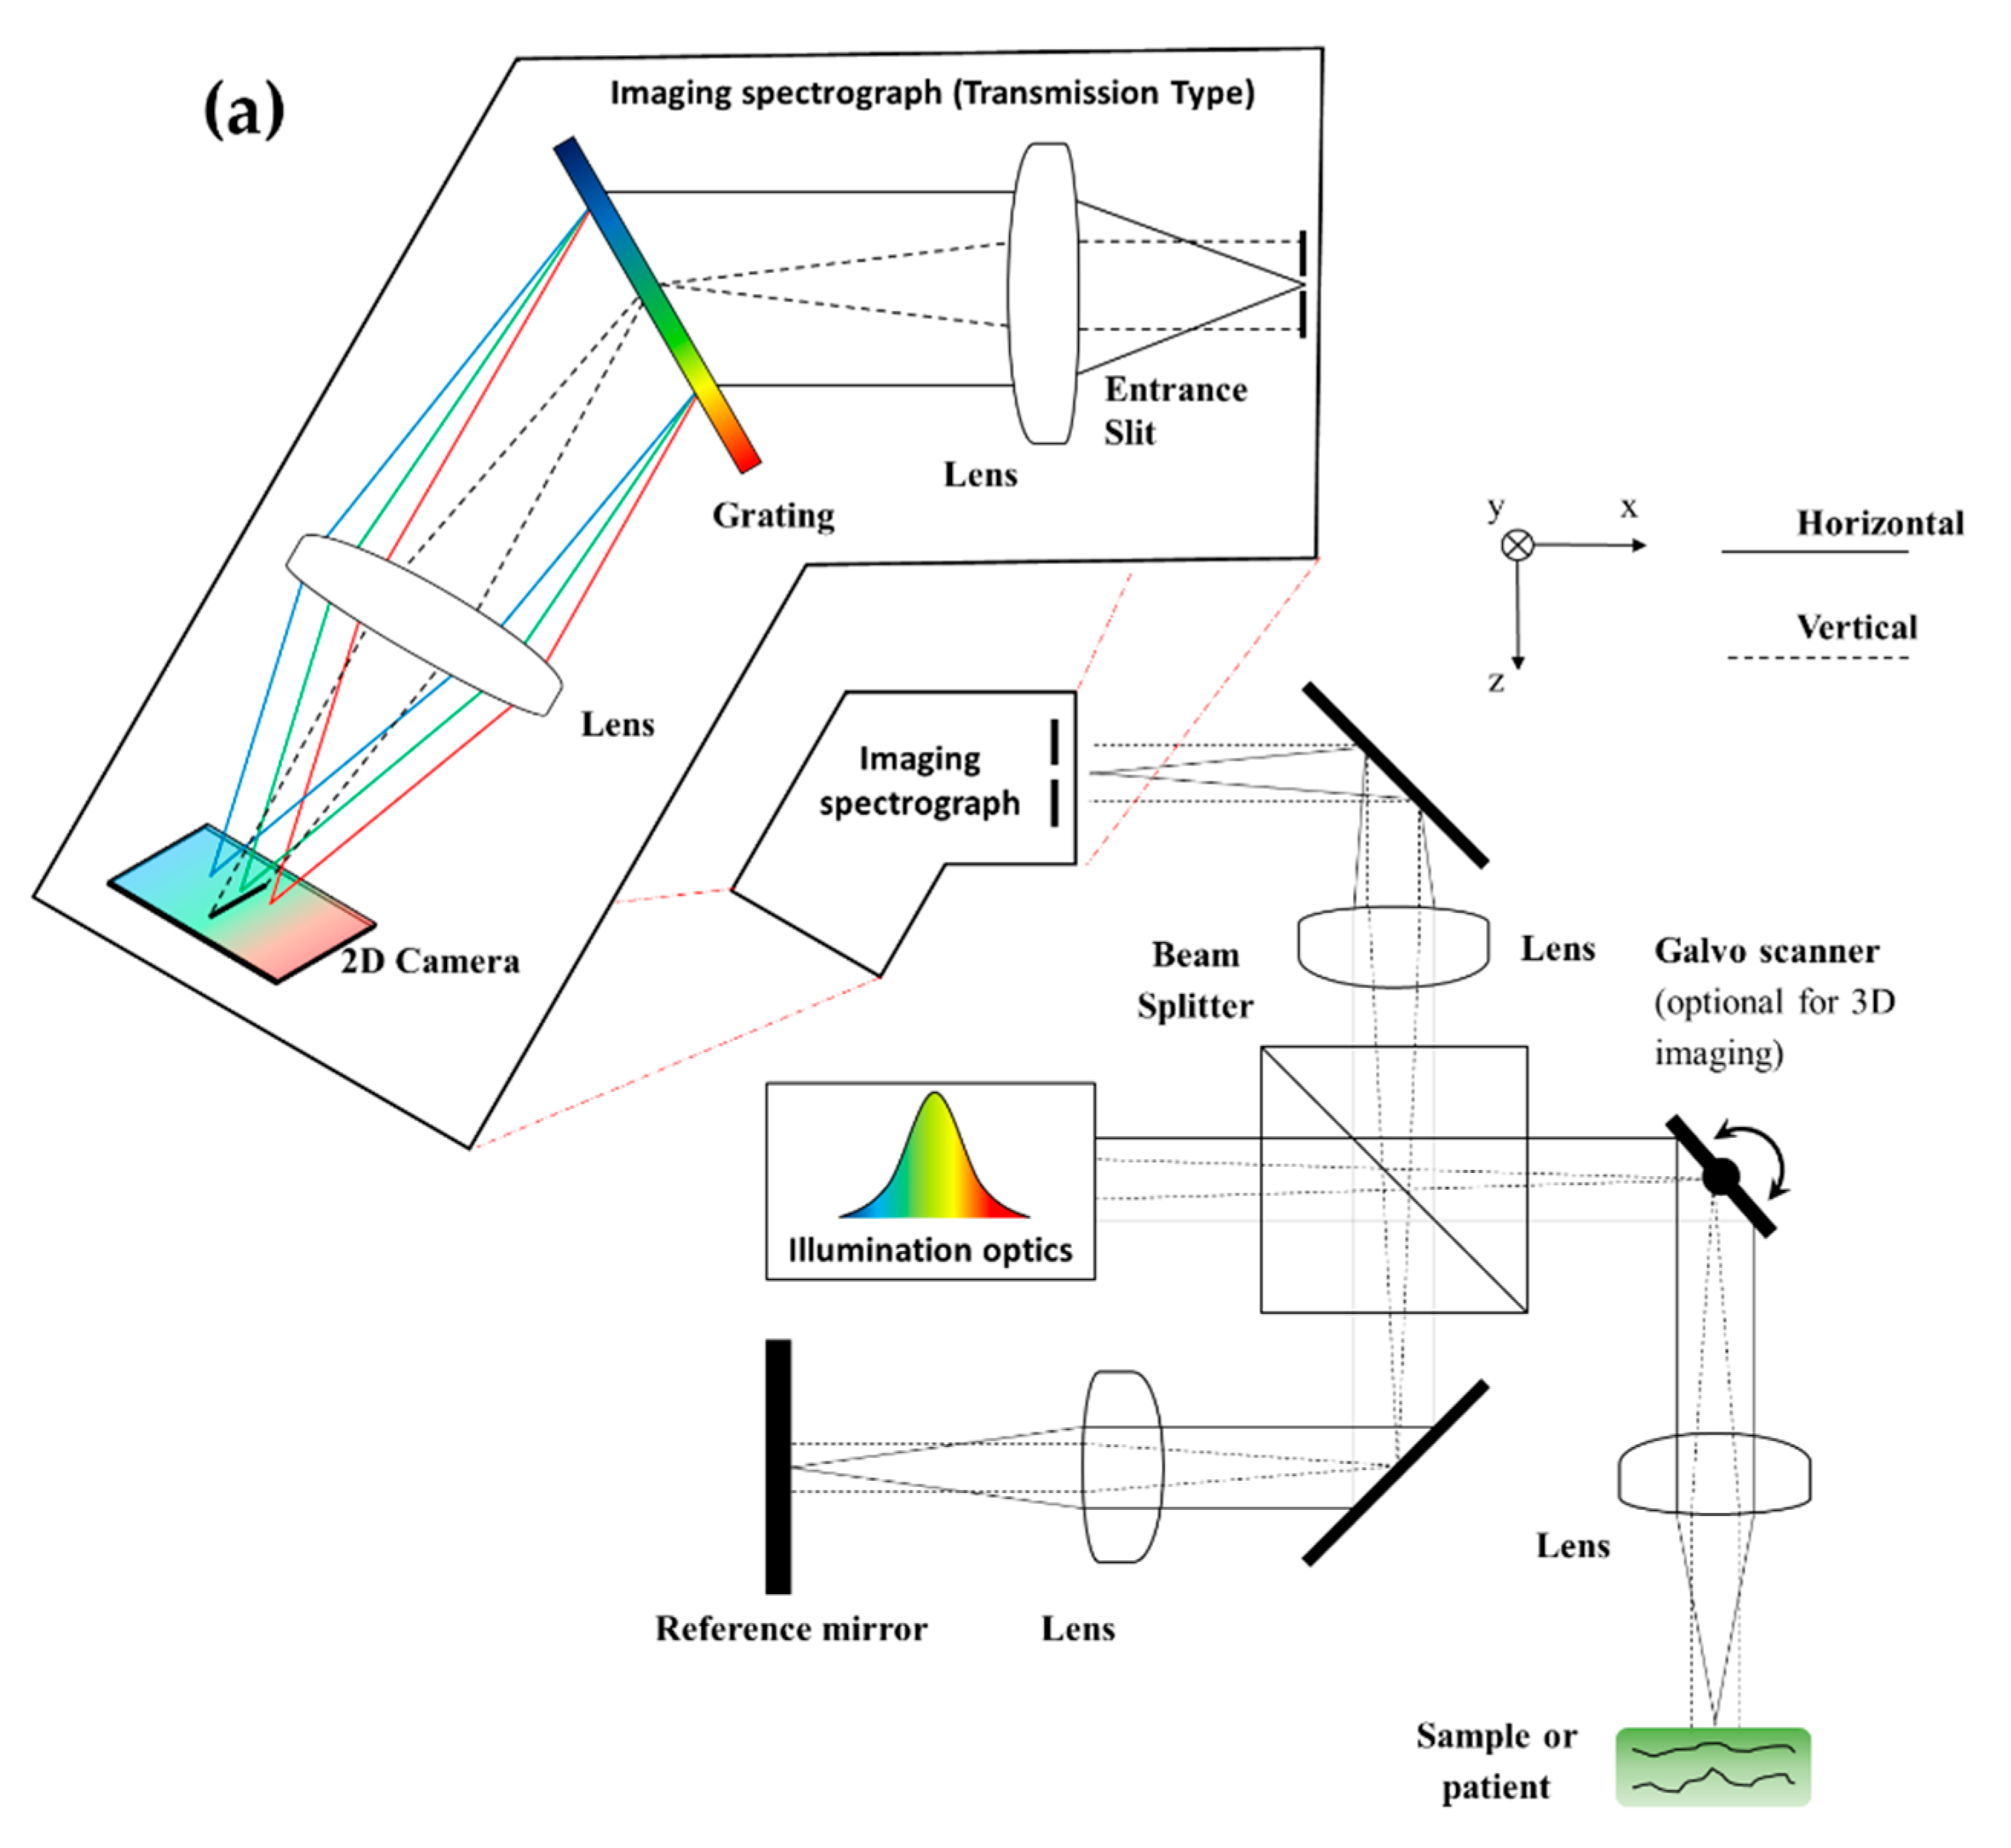
There are two main categories of LF-SD-OCT designs: slited and slit-less. The first type, as in Zuluaga and Richards-Kortum [35], is the slited design. This design (example shown in Figure 5a) is essentially two separate devices, separated by a slit. Note that if the slit is removed, an effectively equivalent slit-less design is obtained, though without obtaining the benefit of reducing the number of optics. The first half of the system is the LF interferometer, consisting of a light source, the optics for line field illumination, any type of interferometer arrangement and apparatus creating separate reference (generally of a single reference reflection) and sample paths, and finally, there are optics to create an image of the illuminated line of the reference and sample paths on the slit. The second half of the system then simply involves an imaging spectrograph, which then measures the interference spectrum at each point on the slit. For building an initial system, using an off-the-shelf imaging spectrograph is a common [35,52,57,59] approach to simplify the construction. However, factors [96] such as non-ideal optical performance, physical size and cost of the available hardware mean that as the research progresses, the systems generally move onto custom transmission spectrograph designs [56,92], giving the smallest physical size and the best optical fidelity for the bandwidth used. The benefits of a slited design are that it allows 1D confocal gating, reducing out of focus light arriving at the detector and thereby limiting cross-talk artefacts, and that each half of the system can be aligned separately, reducing the chance of unidentified misalignment. Slited constructions are the current choice where optical performance is the primary criterion [56,59,92].
A slit-less design (Figure 5b), to our knowledge first published independently by both Endo et al. [51] and Grajciar et al. [49] in 2005, removes the slit and, usually, the lenses on either side of it. The light returned through the objective(s) from both paths is (generally) already collimated, so it can go straight into the diffraction grating. Then, the final lens forms the interference spectra on the camera. This compaction of the optical design means that this is the preferred format where cost [46], size and/or optical efficiency [53] are the objectives. The drawback is the loss of the confocal gate, which can lead to additional shot noise from additional out of focus incoherent light and potentially cross-talk artefacts if out of focus light is coherent. Note, however, that an argument can be made that if the reference light is ideally focused over the whole camera, then the additional coherent cross-talk part should be identical to a slited equivalent, as the different wavelengths of light should not be coherent with each other. However, there will be some additional shot noise from this additional incoherent light.

4. Time Domain (TD) including Axial–Lateral (AL)

4.1. Axial–Lateral (AL) (Also Known as Grating Generated)

The first applicable LF publication we identified in our literature search involved the pseudo-OCT technique AL. This research work was conducted by Zeylikovich, Gilerson and R. R. Alfano in 1998 [37] of the City University of New York group, more famous for their role in developing supercontinuum light sources [97,98]. The design they presented, as we generalised in Figure 6, is a straightforward realisation of the principle. The actual mechanism of tomographic image formation is more complex than what might be expected for this setup. Recently (2019), Tang et al. [24] published an improved theoretical description of how these systems work, highlighting the complex optic interdependencies.
The most substantial set of works on AL were all first authored by Yuuki Wanatabe, Yamagata University, and published between 2006 and 2008 [99,100,101,102]. These works demonstrated minor variations of the method and its utilization practicality for capturing tomographic images, such as in vivo images of the finger [101].
Certainly, in the experience of the authors, apart from being an interesting curiosity, this technique has not made any lasting impact in any application. Two reasons can be suggested for this. Firstly, the technique parallelises the collection of axial image data but remains TD. Therefore, the technique loses the inherent SNR benefits of SD and SS systems [103], but unlike standard TD setups, as it is still axially parallel. So, it cannot benefit from being able to dynamically control the focus during an axial scan to keep the coherent plane in focus, thereby decoupling practical DoF in high lateral resolution in OCM/micro-OCT applications. Secondly, as described by Tang et al. [24], the tomographic image formation is dependent on the light being out of focus to some degree; therefore, the imaging resolution properties are never going to reach the imaging potential of the optics used, unlike true OCT methods. Although there is an initial argument that AL systems require few components and are therefore low cost, with only the addition of a reference interface, any AL system could be reassembled into the equivalent slit-less SD setup with inherently improved performance.
Figure 7 shows an example of arguably the best images that have been taken with AL pseudo-OCT—the in vivo imaging of skin. To our knowledge, this is the closest to clinically relevant data that has been captured with the AL format.

4.2. Sequential TD

Somewhat surprisingly, as the earlier axial format, the first LF sequential TD paper we identified was from 2007 by Chen et al. [34] of the original OCT group at MIT, some 8 years after LF-SD and 9 years after LF-AL. The reason for this is probably the lack of an obvious reason to use the format, unlike LF-SD and LF-AL, which both offered the ability to collect the B-Scan image in a single shot with no moving parts. Traditional TD requires axial scanning in either the sample/patient or the reference arms. Chen et al.’s [34] motivation for this format was to obtain a mix of benefits from the different conventional approaches of FF-TD and SP-TD in the application of OCM. The key aspect is that the 1D confocal gate allows a spatially coherent light source to be used, but with sufficient parallelism, which reduces the demands on galvo hardware when scaling to faster speeds. The authors published a follow-up paper on this work in 2012 [104].
In 2016, Liu et al. [105] of the Houston OCE group presented a format they misnomered (according to the definitions we use here) as “line field low coherence holography”. The lateral imaging format is entirely conventional in terms of lenses, with the image, and not a far field diffraction field, being captured. The system has a very conventional LF-TD layout, but with only phase modulation in the reference arm for the capture of signal from one depth, which would be described as the “en-face” image/plane in an equivalent 2D FF OCT setup [23,30,106]. The bandwidth used was extremely low (for OCT), giving a low axial resolution, which increased the depth of material (in each A-Scan) the signal was collected from. The phase information was then extracted to measure deformation for OCE. The technique can be considered a form of electronic speckle pattern interferometry, sometimes known as TV holography, but not true holography. In 2017 [107], the authors simplified the method; as the OCE dynamics already provides the relative displacements, the phase shifting apparatus can be removed, resulting in a completely static reference arm. Following this (misnomer) naming convention, in 2018, Ginner et al. [54] of the MU Vienna group published such a system but for en-face imaging of the retina. The setup was still LF-TD but using a Mach–Zander interferometer instead of a Michelson arrangement. Based on the LF-SD literature, they applied the Bu [70] method of FR imaging with tilted reference in this TD setup. The use of DAO to correct near-field focus brings it a little closer to true holography.
One key advantage of sequential TD-OCT is that the optics’ focal plane inside the sample can be actively kept aligned with the coherent gated plane. This means that the optical depth of field (DoF) is not a factor in design choice, allowing high NA lenses to be used to obtain the high lateral resolution required for OCM applications without drawbacks. The University of Paris-Saclay group has taken full advantage of this not only to give it a research future but also a commercial clinical future. Dubois et al. [108], in 2018, combined the format with broadband supercontinuum light sources and fully applied this dynamic-focusing capability. One way of looking at this design is as a line-field confocal microscope but with the SNR/sensitivity and axial resolution enhanced by UHR-LCI (i.e., UHR-OCT-like). This format allows a practical realisation of the resolution values in the region of 1 × 1 × 1 um for cellular-level imaging. As a result, the Dubois et al. group have subsequently published a series [55,109] of articles on the topic, mainly focused on dermatological applications, and have spun out a company, DAMAE Medical [110], selling clinically certified LF-TD instruments.
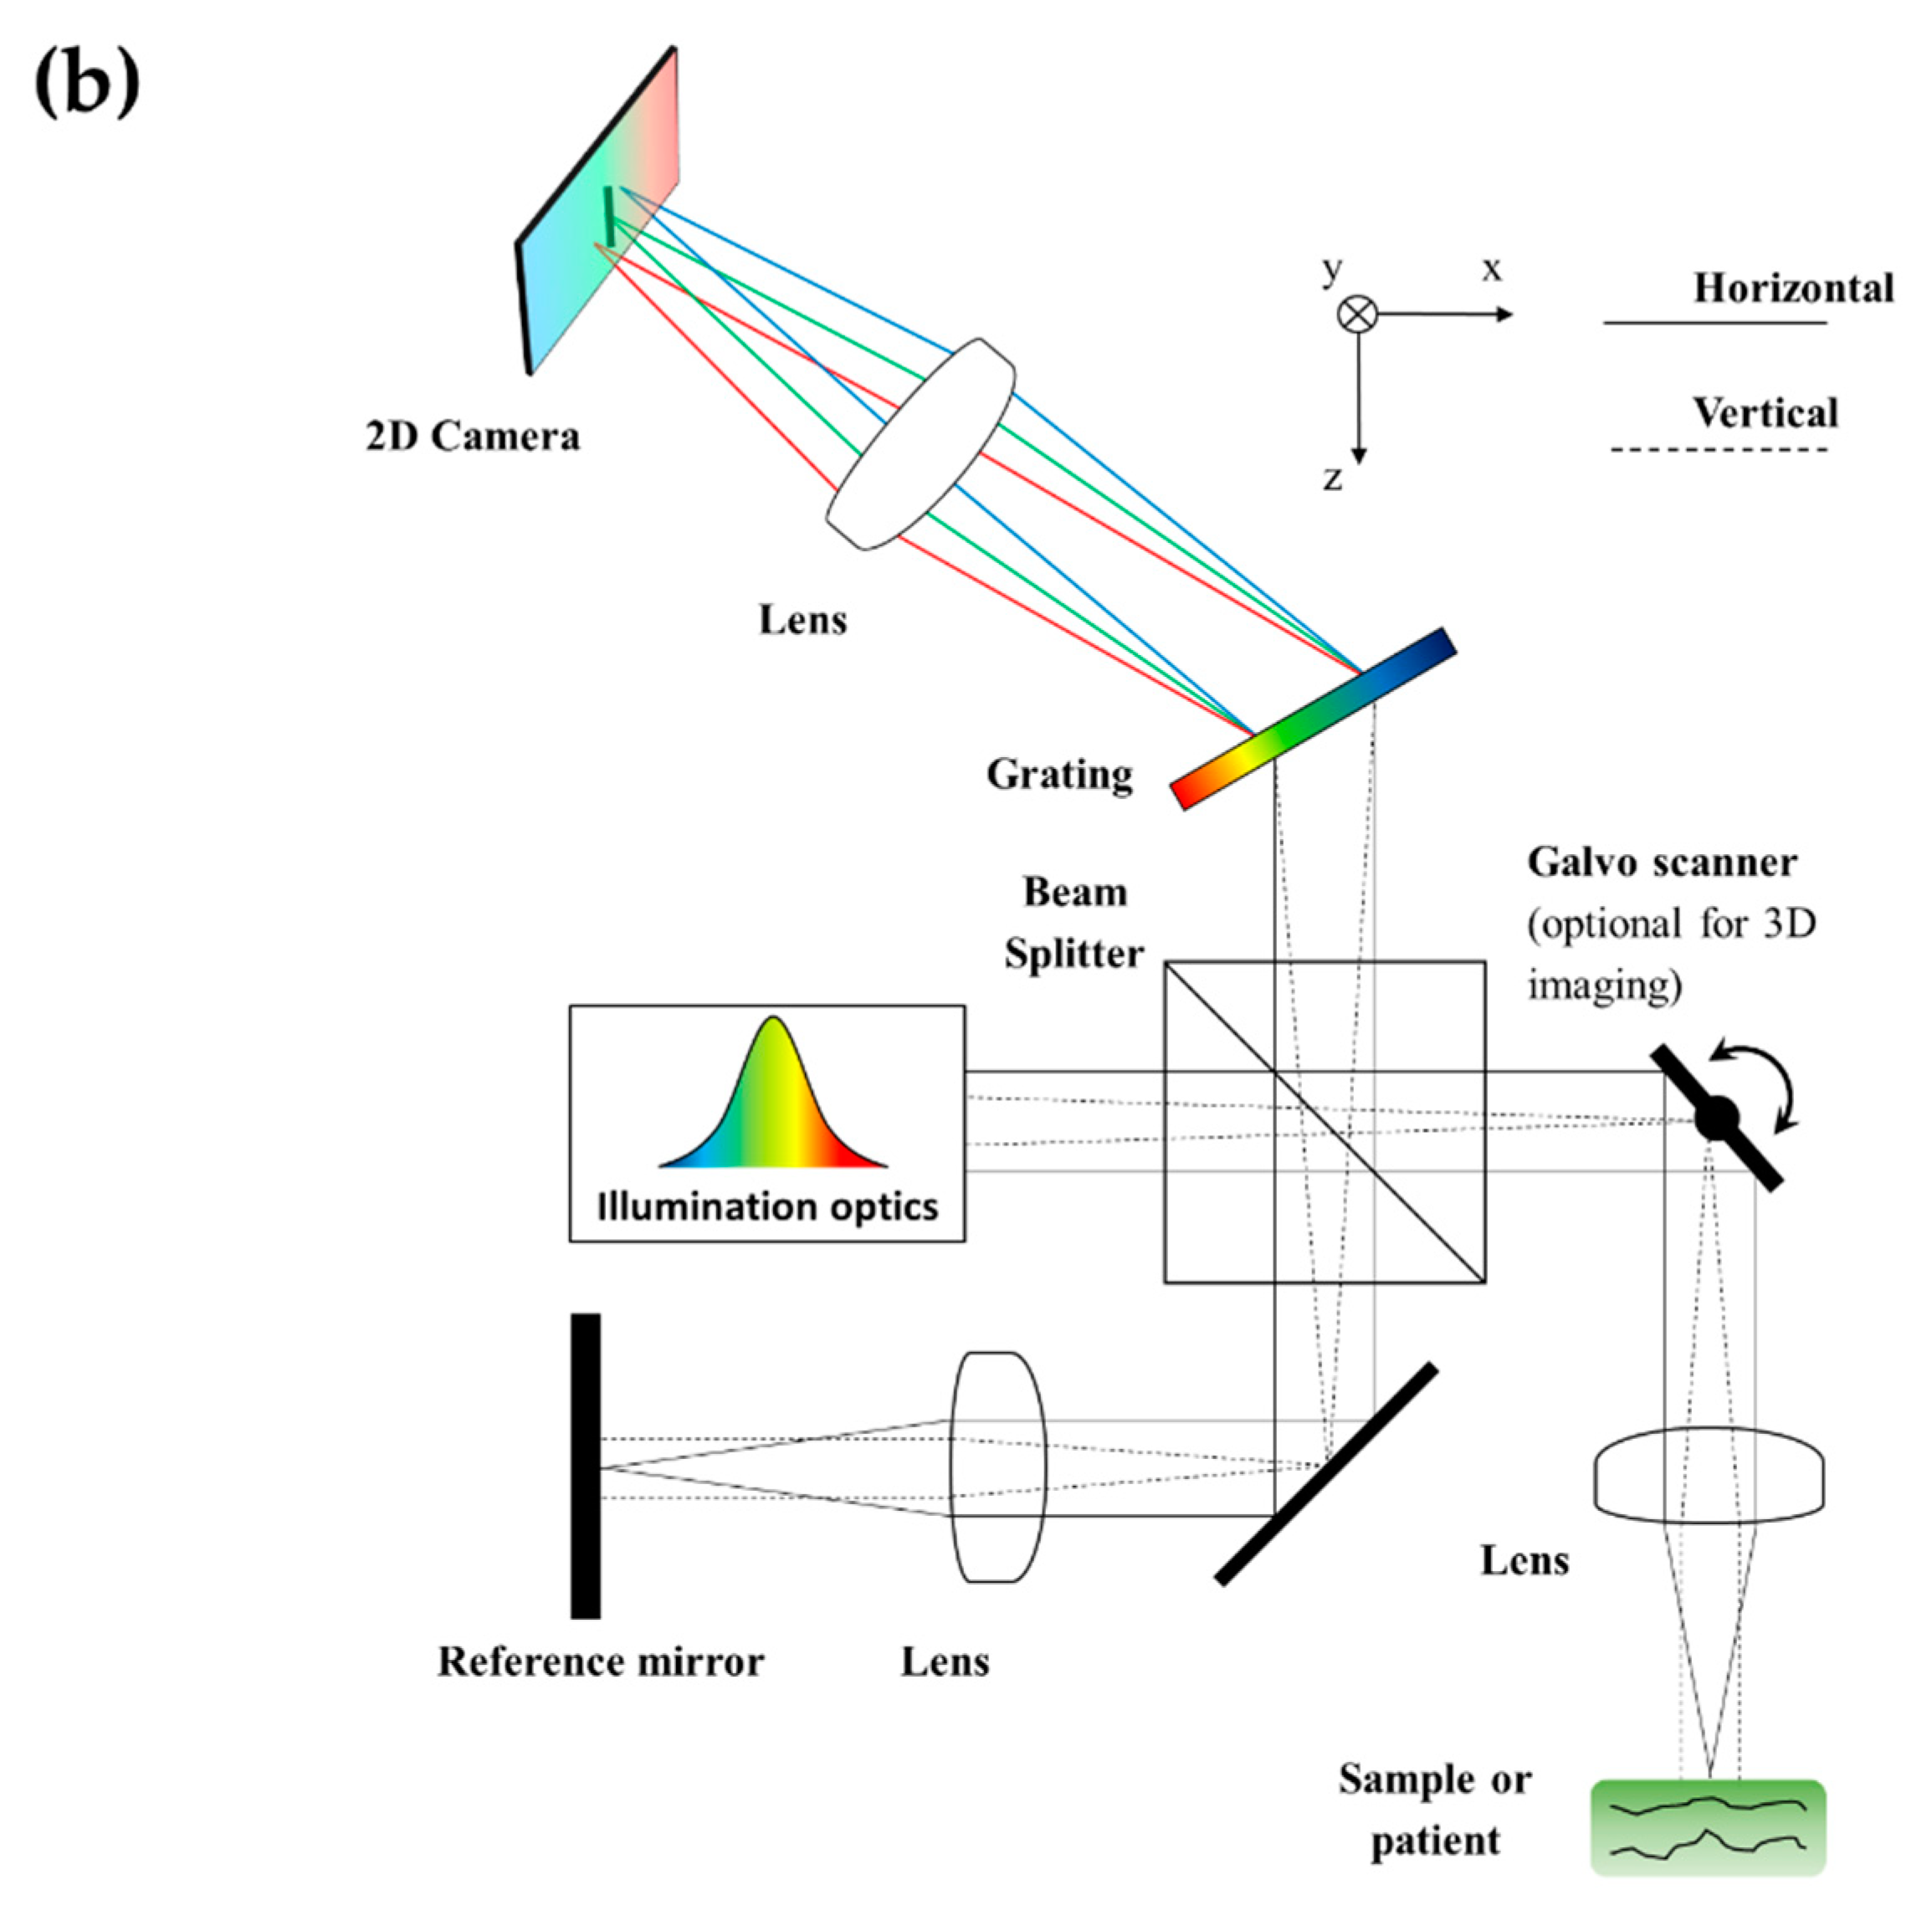
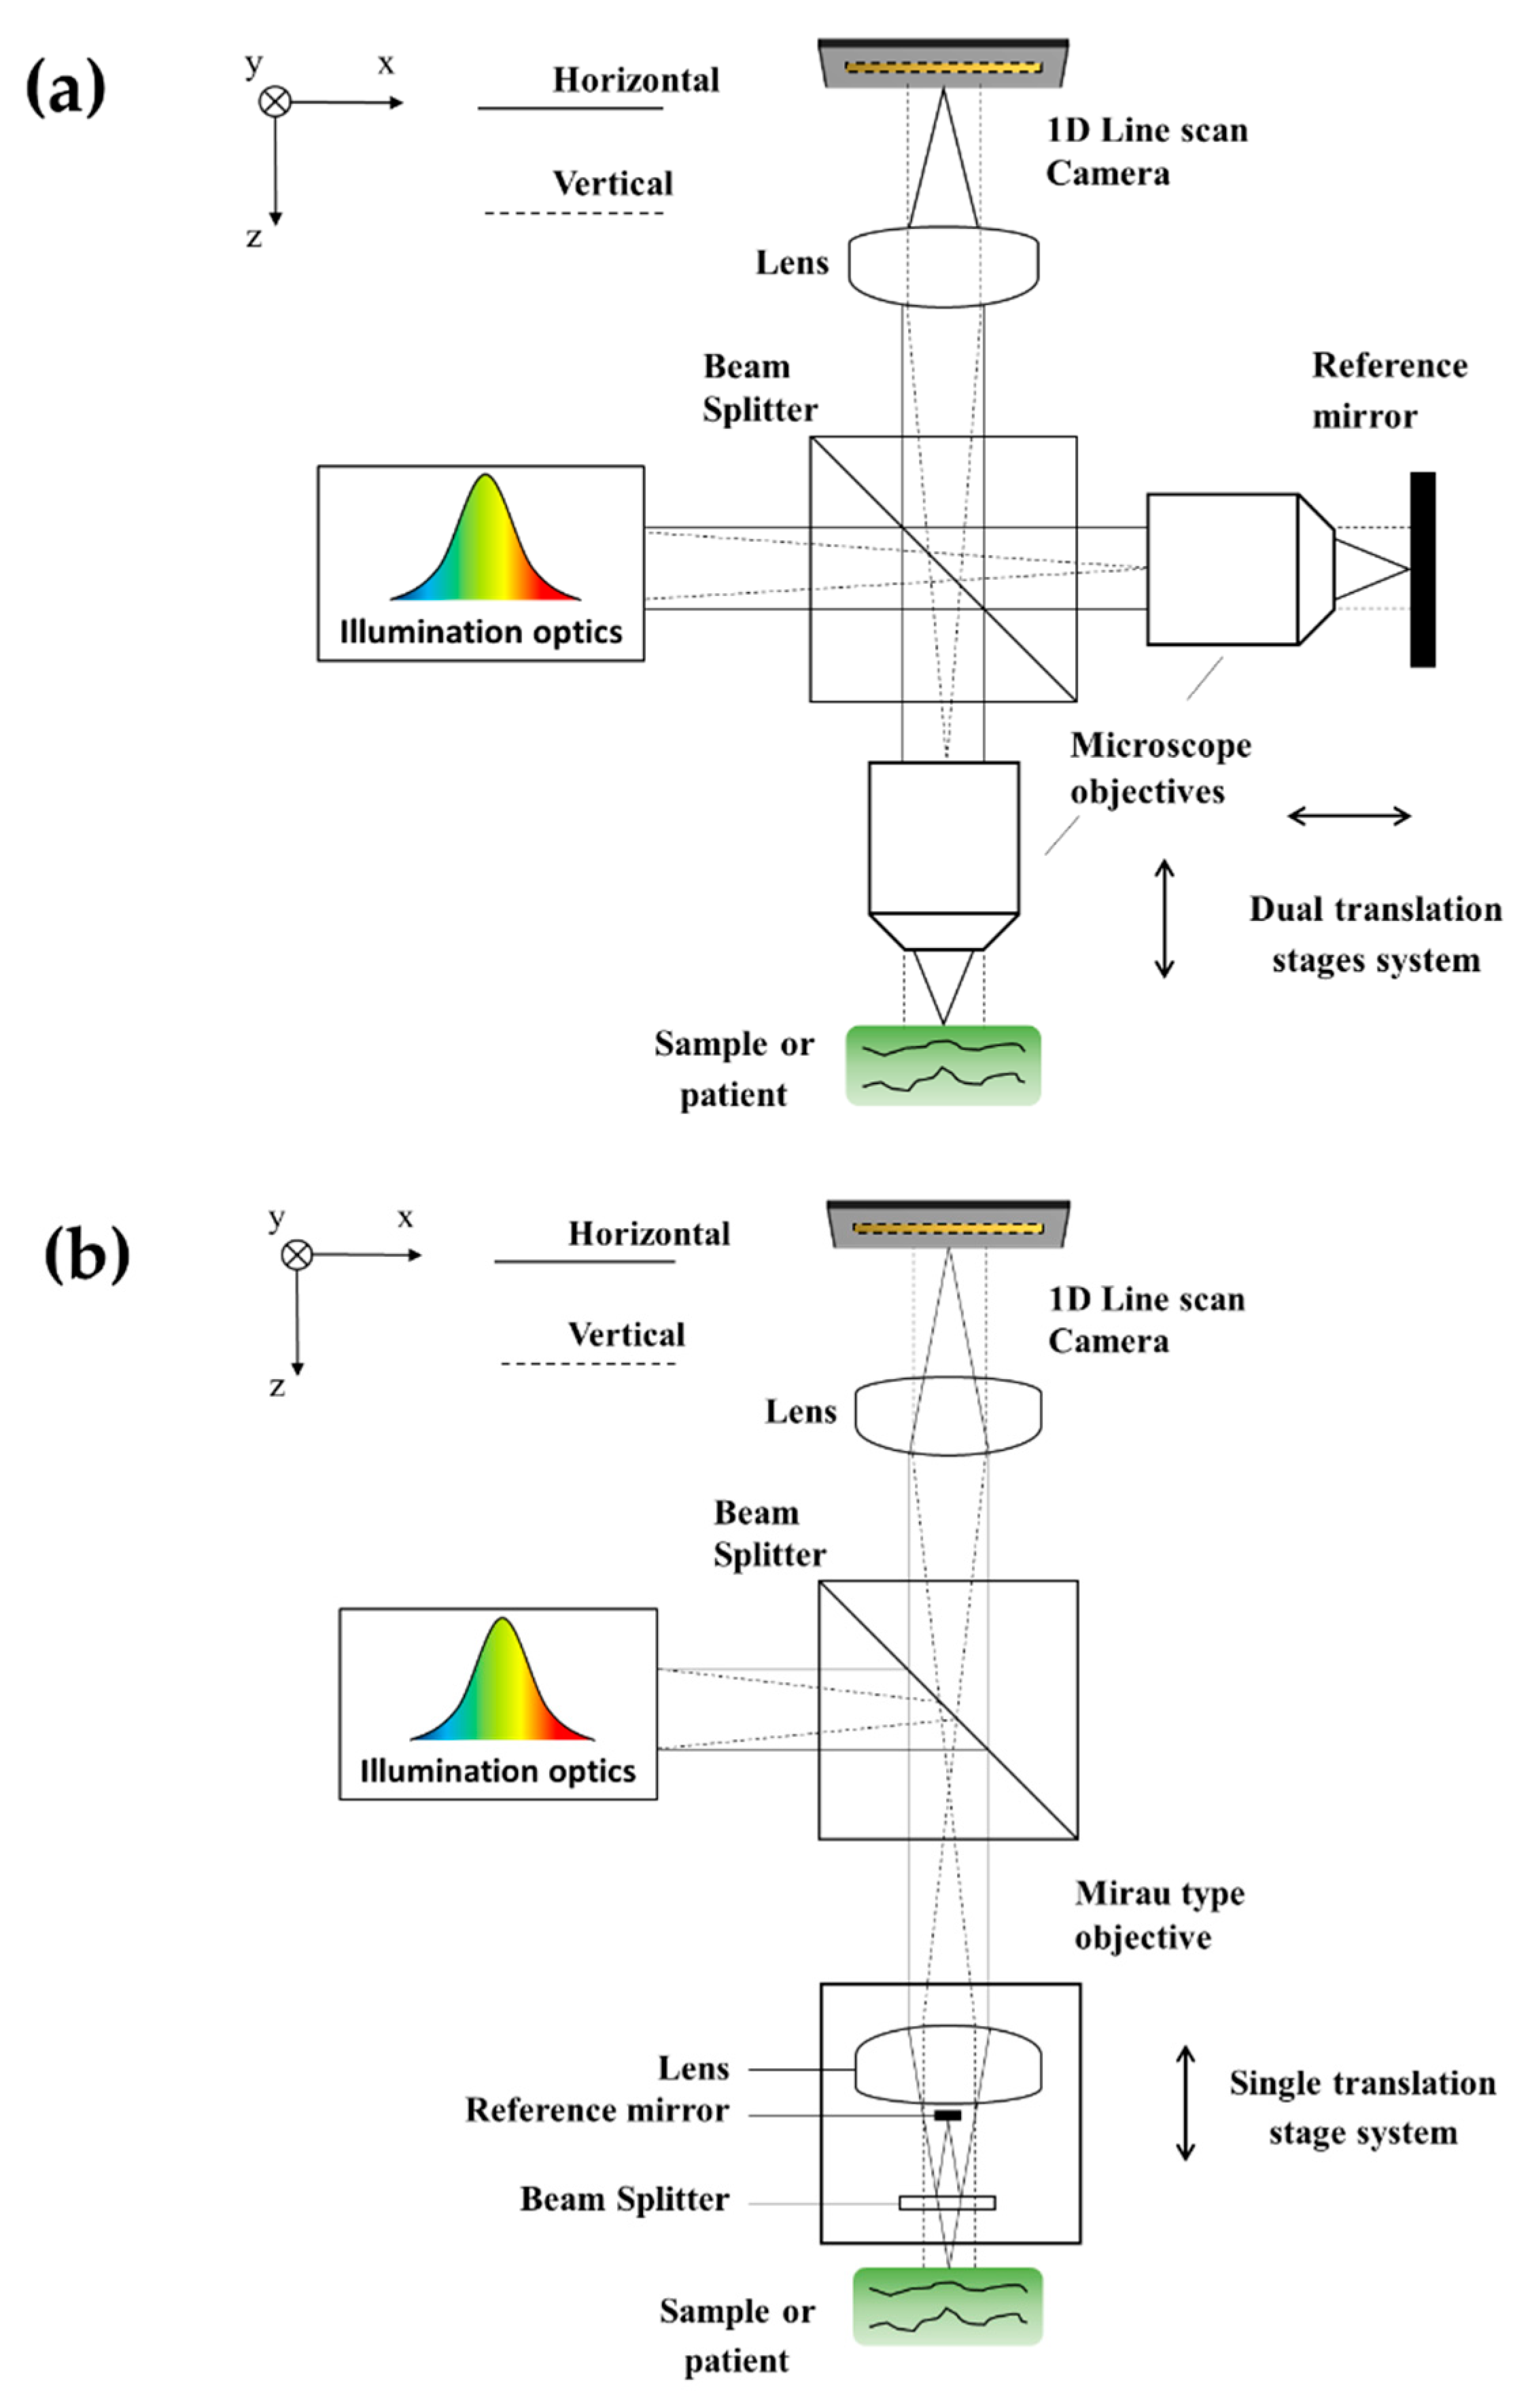
Figure 8a shows the generic OCM optimised setup of TD-LF-OCT, following from Dubois et al. [108], which has made the technique commercially viable. The Linnik interferometer with the two piezo electric stages is key to realising the dynamic matching of the focal and coherence plane. Figure 8b shows a simplified version with a Mirau interferometer using only a single axial translation stage. All the LF-TD setups we are aware of utilise a negative arrangement of the astigmatic optic. Although a positive arrangement is possible, this would lose the demonstrated key benefits of the format. Detection (and confocal gate) is performed by a line-scan camera.
Figure 9 shows the image quality and resolution, which LF TD OCT can achieve in its current dermatological applications. The cell-level structure is well resolved.

5. Swept Source (SS)

The first LF-SS publication we identified was in 2008 by Lee and Kim [36] of Yonsei University. This was followed in 2009 by a conference paper by Mujat et al. [111] of Physical Sciences, Inc., showing that there was at least some commercial interest in the format at the time. However, we did not identify any significant subsequent publications until 2014, when Fechtig et al. [50] of the massive OCT group at Medical University of Vienna utilised the properties of the technique to achieve 1 M AScan/s imaging rate with a high 90 dB sensitivity. The following year [112], 2015, they demonstrated in vivo structural and functional (angiography) imaging of the retina with this performance and also demonstrated applying DAO and FR processing [113].
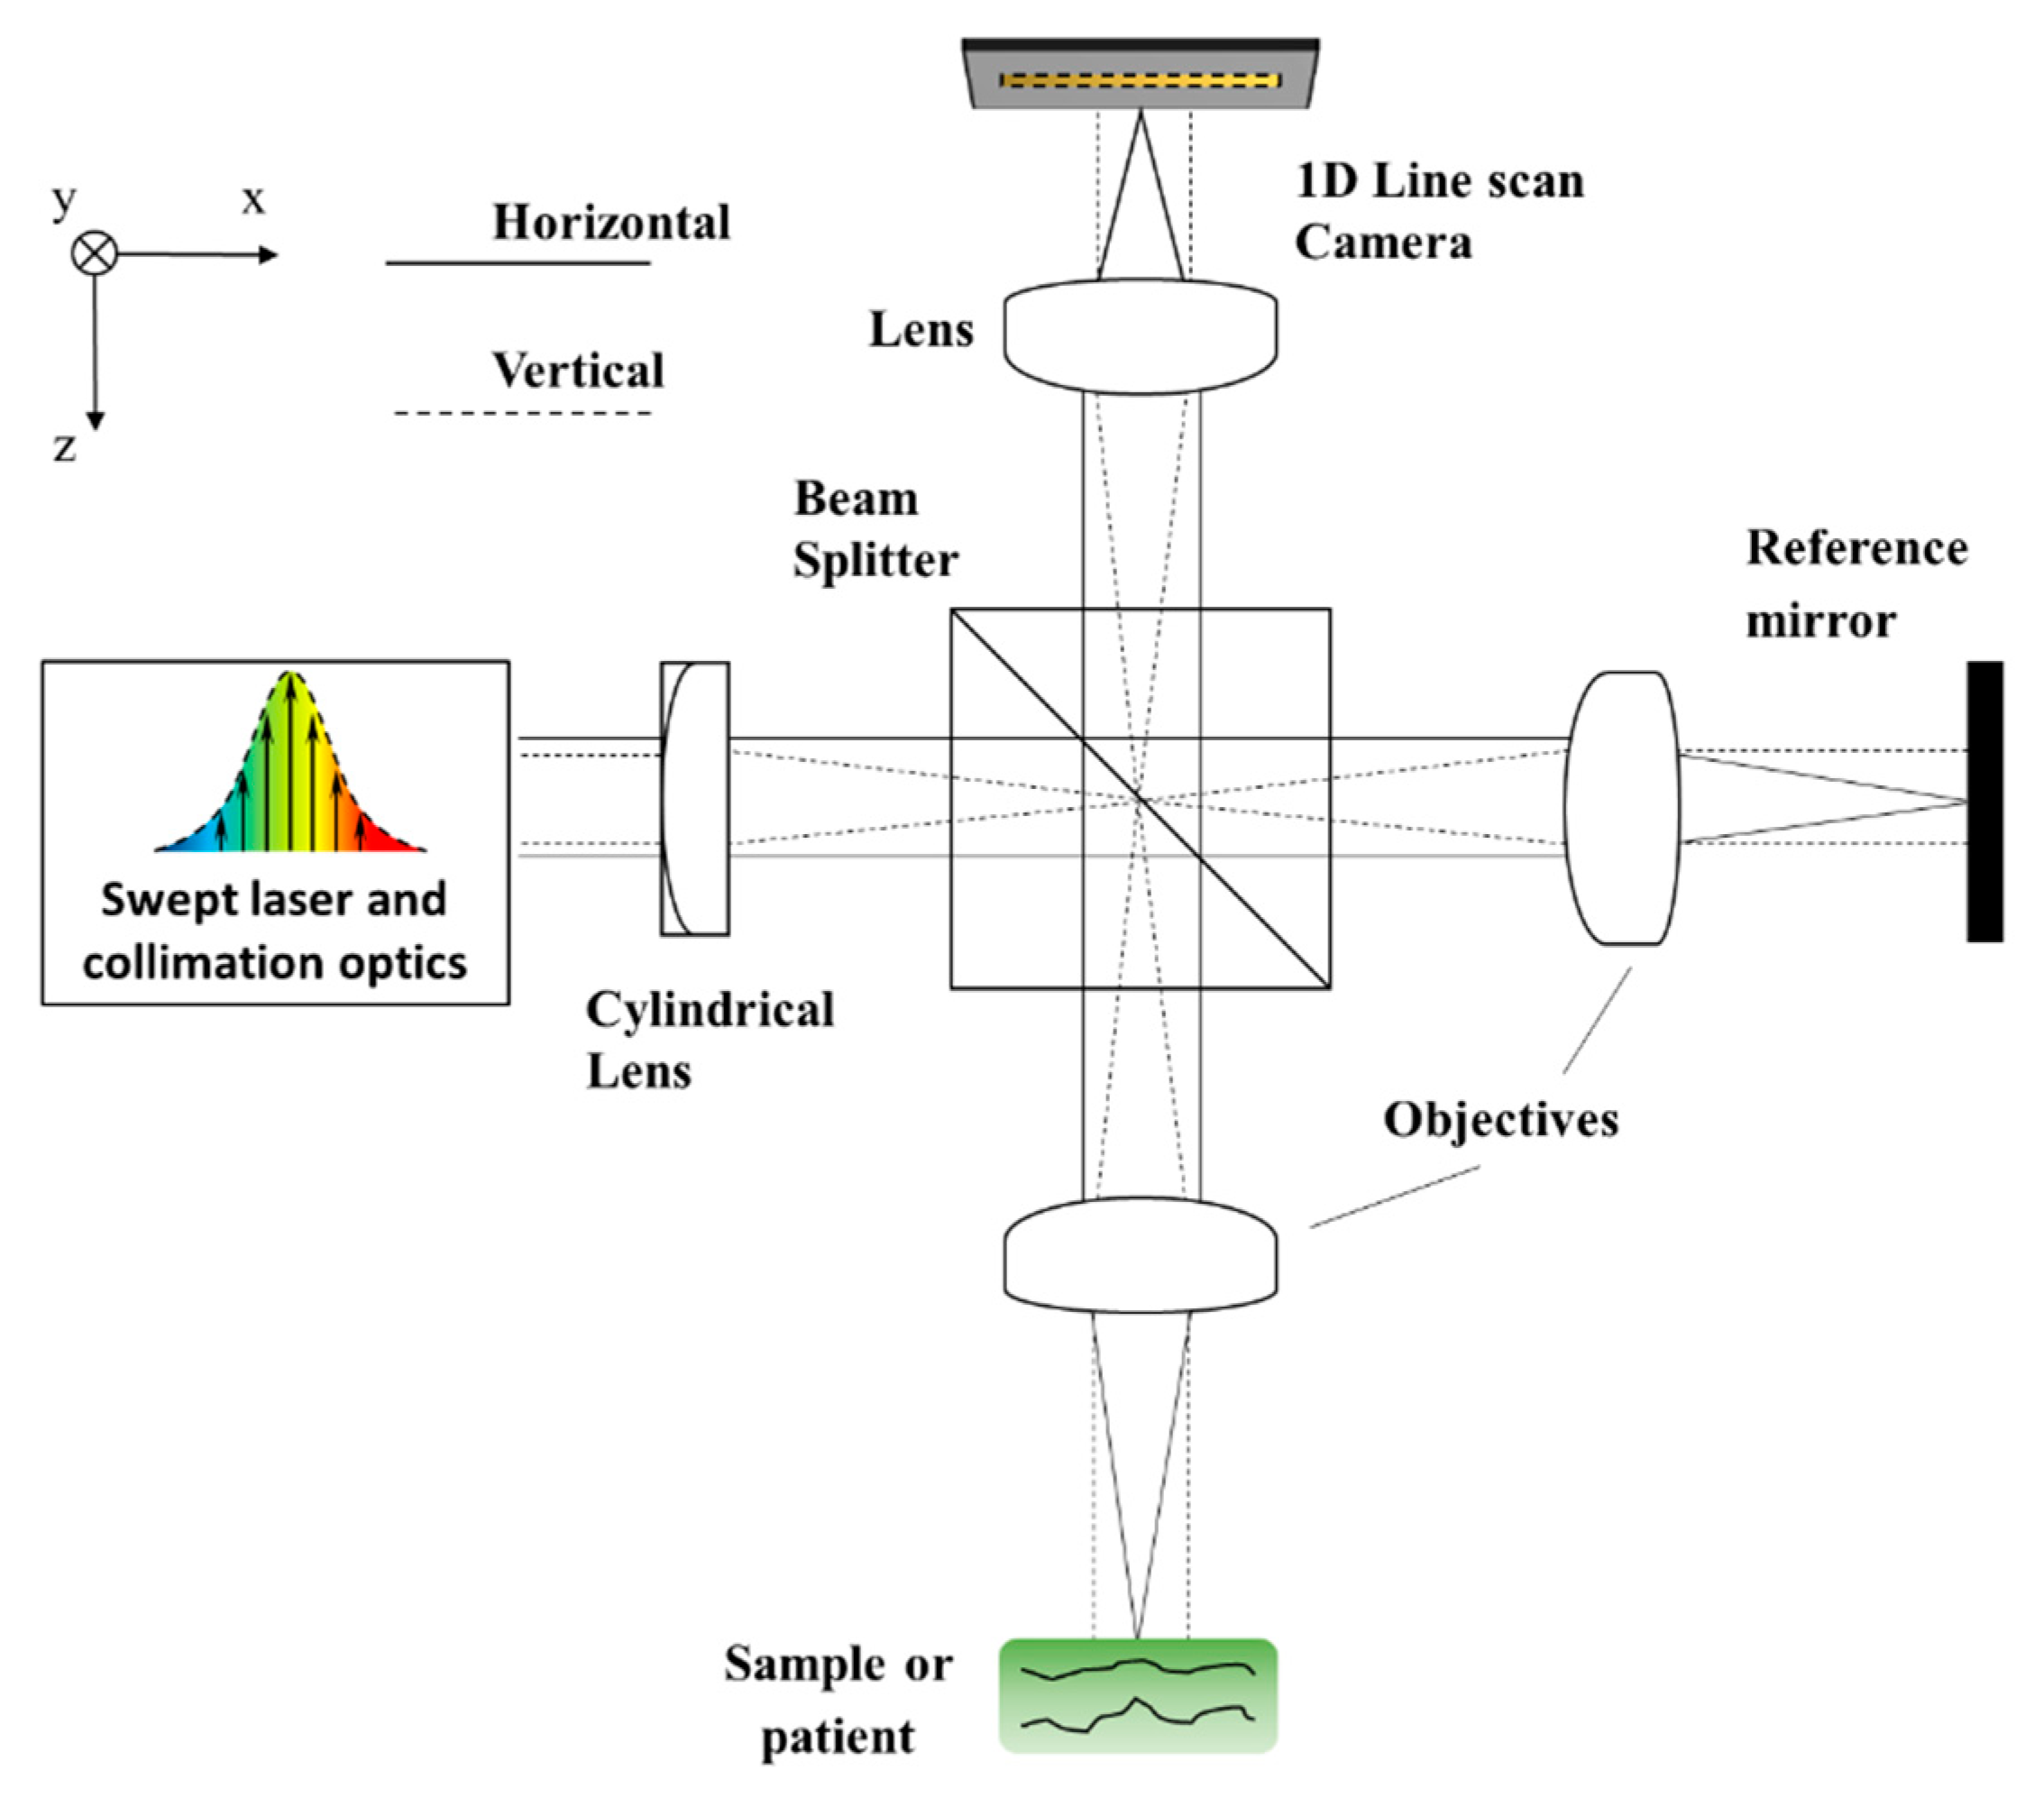
Figure 10 shows the general design of LF-SS setups. These are the most straightforward in terms of total components, discounting the complexity of the swept source itself to accurately temporally encode optical frequency; like LF-SD, the interferometer has fixed arms, but the imaging spectrograph part is entirely replaced with just a 1D camera. Although a positive astigmatic optic arrangement is possible, all the designs we encountered were of the negative arrangement. This will be partly due to the fact that a positive arrangement would not give a total reduction in the amount of optics, unlike the case with LF-SD. Both Linnik [36] and recollimation [50] arrangements of the reference arm have been used. Overall, this format provides large imaging depth and high sensitivity but low axial resolution properties of the SS element. The parallelisation of the LF element enables faster imaging with low sweeping speed sources compared to SP systems.
Figure 11 shows the cross-sectional and en-face image quality, which can be produced by LF SS OCT. The SS format gives excellent SNR and imaging depth, allowing imaging deep into the choroid, while the lateral optical performance is sufficient to identify individual cone receptors.

6. Discussion

6.1. Potential Benefits

In terms of reasons to adopt an LF configuration over a conventional SP one, in the next two sections, we suggest two different generic scenarios where this would be favourable. In the third section, we discuss benefits vs. FF.

6.1.1. Overcoming Hardware and Safety Limitations for Higher Speeds

Maintaining high image SNR/sensitivity could be regarded as rule zero for building an OCT system. Therefore, as system designers strive for ever faster speeds, they will not do so at the cost of SNR/sensitivity. At the fundamental level, the choice of the lateral format should have no effect on the system’s SNR/sensitivity, given the same/equivalent technical performance of components (the most important in the context of this argument being the quantum efficiency and duty cycle of the detector). The SNR/sensitivity of most OCT setups is constrained by photon shot noise at the detector. The shot SNR/sensitivity depends solely on the number of photons detected per A-scan; whether each A-Scan is imaged sequentially or in parallel makes no fundamental difference. Therefore, for the same or equivalent components and same designed SNR/sensitivity, a SP and LF format would have exactly the same speed.
However, practical constraints mean that there are two arguments in terms of how a LF system could be faster than a SP system. Firstly, there is the light source power safety limitation. One way of improving speed is increasing the number of photons per unit time; however, the optical power onto a patient can only be raised up to a certain point before it would become hazardous (in non-medical applications, there are also going to be power thresholds beyond which damage or unwanted heating would occur). For the imaging of certain locations, the parallel illumination of the LF format allows a higher total illuminating power to be used than for an equivalent SP system. To give a very crude (each application will require its own thorough risk analysis to identify the most restrictive limitation for a scenario) and best case scenario mathematical quantitative description of this, say a material can be imaged with an intensity (I) of 1 kW/cm2. Total safe power is
P = I A
where A is the area illuminated (approximating uniform illumination). For an SP OCT with a spot size of 10 × 10 µm (approximating a square spot); this would give a maximum total power (P) of 1 mW. For an equivalent LF-OCT collecting 1000 A-scans per B-Scan, with an illuminated area of 10 µm × 10 mm (approximating uniform line field intensity), the power limit is 1 W. As the number of photons are proportional to power, to image at the same SNR and sensitivity, this would give a 1000-time increase in the A-Scan rate (i.e., in a perfect parallelisation scenario, the imaging speed is increased by the number of parallelised A-scans). Note that in most real scenarios, the increase in safe power, therefore the maximum imaging speed, is not going to be as much as the parallelisation multiple, but in most scenarios (corneal imaging setups can be an exception due to the eye forming a quasi-Fourier image on the retina), it will still be significantly larger than in SP systems. This argument is most relevant for retinal imaging, where the increased power limit of the LF format can be applied to increase the imaging speed of the already fast SS systems further [21]. This higher speed, and therefore less relative motion between A-Scans in a 3D volume, may also benefit the inclusion of DAO [68] in future clinical OCT systems, increasing the image quality available to clinicians.
Secondly, in SP systems, increasing the imaging speed means that the galvo (or resonant) mirror, and for SS, the swept source light source, has to be driven at increasingly faster speeds, increasing the cost and engineering demands of these components. The parallelisation of the detection of A-Scans means that this required speed is lowered by orders of magnitude, reducing the costs and engineering demands of ever faster speeds. To provide a crude quantification, take a continuous capture of 1000 × 1000 A-Scans volume at 10 M A-Scan/s (i.e., 0.1 s per volume). For SP OCT, the fast axis requires driving the mirror at 5 kHz triangular wave or 10 kHz sawtooth wave (for less A-scan spacing distortion in the slow axis). For LF-OCT, only a slow axis motion of 5 Hz triangular wave (and without any spacing distortion) is required. Likewise, for a SS axial format, a SP system would also require a 10 MHz sweep rate, while LF would only be 10 kHz.

6.1.2. Low-Cost and Industrial Setups

Particularly for the LF-SD format, the capture of a B-Scan image with no expensive and/or delicate moving parts makes it an attractive choice for both low-cost OCT designs [46] and in industrial applications [79,80,81,114]. For building a system at minimum cost, the mechanics to capture an accurate B-Scan image presents a significant challenge, which the LF format removes. In industrial settings, where OCT may be utilised as an in-line quality control tool within the production line, the dirty and noisy (vibrations) environment will be detrimental to galvo or other scanning mechanics. The removal of moving parts in the LF format means this is not an issue, and with the product already moving through on the production line, it means that the full 3D data of the product can be captured, as has been proposed for the glass industry [79,80,81].
For LF-SD (and non-sequential TD), the prevalence of 2D cameras means there is no increase in detector cost compared to their SP alternatives. However, for SS and sequential TD, the requirement for a 1D camera, as opposed to a point detector, may result in some increase in cost by comparison. For digital acquisition (DAQ) electronics, an LF format may provide cost benefits over equivalent SP systems, as the parallelisation reduces by orders of magnitude (or in some cases, removes) the high-speed synchronisation specification.

6.1.3. Benefits vs. FF

To make a comparison between LF and FF lateral formats, it is necessary to consider the three axial formats separately.
For SS, LF represents a middle ground between SP and FF. The argued benefits of LF apply to FF systems but to a more extreme degree. A simplified argument to choose the lateral format based on the source would be faster swept sources favouring SP, with slower swept sources favouring FF, and with some middle ground favouring LF. In terms of imaging performance, LF does retain a confocal gate, which will limit the potential multiple scattering cross-talk artefacts compared to FF.
For SD, although FF is possible [32], the need for the physical optical components mapping LF to FF and the fact that the number of captured voxels, in a 3D space, is limited to the 2D number of pixels on the camera mean that the sampling achievable is relatively sparse. As a result, there has not been a significant volume of further research published on the concept, and we can regard it as currently impractical. Therefore, to obtain the benefits of parallel A-Scan detection in a SD axial format, LF is the only practical lateral option.
For TD, the major benefit of LF over FF is the confocal gating, which, as already discussed in Section 4.2, has been fully exploited by the Paris-Saclay group. In 2012, Chen et al. of the MIT group compared the practically achieved sensitivities and showed that LF typically performed better than FF but worse than SP (Table 1 in Ref. [104]).

6.2. Potential Limitations vs. SP

Although we showed that there has been continued utilisation of the LF format in OCT since the late 1990s, and we are suggesting that the format is likely becoming more prevalent due to the reasons presented in Section 6.1, historically, the field is a tiny fraction of the size of SP systems. We can suggest three dominant reasons for this.

6.2.1. Cross-Talk

The main concern for many people in the field regarding any parallel OCT format is optical cross-talk between the A-Scans. This is where photons arrive at an A-Scan detector whose initial scattering location originates from outside the ideal object location for that A-Scan but remain coherent with the reference path. This generates some form of additional artefact image signals, which can be regarded as de facto noise. We can split cross-talk into two separate causative phenomena: local single scattering blurring and more global multiple scattering.
Local single scattering blurring, i.e., the optical lateral point spread function, is straightforward. Even in optically perfect (diffraction limited) systems and at the focal plane, there is always going to be some finite point spread function of light from the sample at the detector array. In the axial dimension, this is complemented with the time-travelled temporal coherence PSF. Therefore, any resulting voxel in the final image data is composed of signal from a corresponding 3D PSF volume. As the light generating the signal is coherent, this will result in speckle (for irregular samples) or diffraction (for regular samples) image texture artefacts. There are two theoretical scenarios where the reduction in confocal gating of LF, in comparison to SP, may have a noticeable effect on equivalent images due to single point blurring. Firstly, away from the focal plane, this effective lateral PSF will broaden substantially. For TD setups, although ideally the temporal coherence gate will be kept aligned to the confocal plane, the additional out of focus light from less confocal gating will have mildly detrimental effects, e.g., additional shot noise. For SD and SS setups, SP OCT can image away from the focal plane due to the much greater sensitivity of a coherence gate in comparison to a confocal gate. In this case, confocal gating in this scenario can be theorised to act like a numerical aperture gate, preferentially allowing photons scattered back close to the optical axis, as opposed to those scattered at high NA angles, which will not pass the confocal gate when originating away from the (con)focal plane, effectively giving higher depth of field optics away from the focal plane. Therefore, it could be hypothesised that LF formats of OCT could be more prone to image blurring away from the focal plane than equivalent SP formats; however, we are not aware of any publication where this effect has been identified. Therefore, it is not likely to be a significant issue compared to other factors in OCT design. Secondly, optical design imperfections can lead to light arriving at the wrong pixels on the detector (blurring for diffuse samples, systematic for specular samples). Our group [96] has studied the effect of choice of imaging spectrograph design in LF-SD, showing that the optically imperfect Czerny–Turner spectrograph, widely used [35,44,52,59] as an easy off-the-shelf component for such devices, results in a visual increase in image artefacts for certain samples. However, when imaging a realistic sample (a cornea), we concluded that such drawbacks were likely qualitatively insignificant compared to other factors, such as UHR performance and overall SNR values. For TD and SS systems, excluding design or construction/alignment errors, we are not aware of an equivalent scenario where optical performance would be intrinsically limited by a design choice. For AL, as discussed in Section 4.1, this form of optical imperfection is inherent.
Most commonly, when referring to cross-talk, people will be actually referring specifically to an output of multiple scattering. A photon illuminated onto one A-Scan position will be scattered once from there; it may then undergo additional intermediate scattering collisions, but it will end up with a final scattering location in a different A-Scan position, from where it will be returned and imaged by the system. It should be noted that multiple scattering itself can occur entirely within just one confocally gated A-Scan, with the effect often being evident in SP systems, such as when imaging highly scattering paint on a glass interface where ghost scattering signal can be seen apparently coming from below the glass interface. However, with less confocal gating, the severity of this effect would be expected to increase, as more—and from further than their intended illumination location—multiple scattered photons would be captured.
Boris Karamata at the Swiss Federal Institute of Technology conducted his PhD [115] mathematically analysing, with experimental validation, the phenomenon of multiple scattering in the FF format. This resulted in a series of publications [25,116,117]. We are not aware of equivalent analysis being performed specifically for the LF format of OCT; however, a mathematical comparison of LF and SP confocal gating has been performed in the context of laser scanning ophthalmoscopy (LSO) [118]. Here, the findings back up the broad arguments made here, namely that LF has a measurable decrease in confocal gating in comparison to SP but is still far superior to FF in that regard.
Finally, regarding cross-talk, although much can be made, as we have here, of the theoretical drawbacks due to it, we are not aware of any reported practical situation where this effect has proven to be a significant detrimental factor in a final application. However, it has been shown in a TD-OCM context that the overall sensitivities of published LF systems are lower than for SP systems [104], and this may be related to the degree of confocal gating.

6.2.2. Non-Fibre Optic

A key factor in the scarcity of the LF format, in comparison to SP, is the ease of engineering. LF is only practically realisable as free space optics throughout, which takes up space, is delicate, and is rigid. By comparison, SP can be implemented with fibre optics, which means everything apart from the final objective lens and any scanning mechanism can be implemented well away from the scan head, limiting the size at the working location. It is this feature, which makes applications such as endoscopy feasible with OCT. Fibre optics setups are also robust and flexible, both literally and metaphorically. It is easy to attribute some of the reasons for the commercial explosion of OCT, after its inception in the 1990s, to its fibre optic construction. Therefore, the LF formats will always be at a disadvantage in this regard.

6.2.3. Washout (SD, AL, Linear and off-Axis TD) or A-Scan Motion Artefacts (SS, Sequential TD)

One of the motivations for using a LF lateral format, instead of SP, are the fast imaging speeds. However, for lower imaging speeds, the parallelisation can cause issues due to the fact that for a given A-Scan rate, the time to collect each individual A-Scan is going to be orders of magnitude longer. Especially in the case of in vivo imaging, the motion of the sample in this collection time is going to cause issues.
In the case of parallel detection of axial data (SD, AL, linear and off-axis TD), this motion during the collection time results in washout of the interference fringes, as they are incoherently averaged out, removing the image signal. For a mathematical example, take an OCT system capturing a 1000 A-Scan B-Scans at 10 k A-Scans/s with a 10% duty cycle. For SP, the A-Scan integration time is 10 µs, while for LF, it is 10 ms. Nakamura et al. [48] evaluated this issue for in vivo imaging, showing that with integrations of the order of 100 s us, the effect will be noticeable. Our observations during recent in vivo work [56] confirm this in practice, although the detrimental effect did not inhibit the work.
In the case of sequential collection of axial data, for SS OCT, the spectral data will be distorted, but this is correctable in the processing [112,119]. For sequential TD, the axial (and lateral) motion is only going to result in some spatial distortion of the produced image.

6.3. Likely Trends in Applications

For LF-SD, the recent clinical focus of the work has been in the cornea [56,92]. Historically [62], retinal imaging has been demonstrated, with potential to increase the imaging speed (due to larger total optical power safety limit) and provide high axial resolution, and further development is likely. It would also be straightforward to transfer this format to all existing external imaging clinical OCT areas, such as dermatology and dentistry. Away from medicine, the removal of moving parts and lateral phase stability give LF-SD advantages over SP-SD systems. Therefore, a continued output of research for industrial applications is likely.
For LF-TD, it has already established a commercial presence in dermatology [110]. Adapting this technology for cellular scale imaging of the cornea and other external clinical OCT areas should be straightforward and may emerge. Away from medicine, as an OCM technique, the likely applications are as alternatives to other microscopy techniques.
For LF-SS, only retinal imaging applications have been reported, and the likely follow-on research on this would be from groups also researching FF-SS. From this perspective, if FF-SS is proven to be effective in practice, there may be little interest in LF-SS from these parties. The other likely source of application development for LF-SS applications may come from existing LF-SD research groups for applications that require larger imaging depth range over axial resolution. Here, the possible application areas would be the same as for LF-SD.
Finally, we will recap the endoscopic and similar applications where imaging head size is critical. Due to the free space nature of LF systems, they are not likely to become a viable alternative to fibre-optic-based SP systems in the near future.

6.4. Summary

Table 2 provides a concluding summary of the LF-OCT formats, and Table 3 gives their current quantitative performance metrics.

7. Conclusions

The LF lateral format has historically formed only a small fraction of academic work carried out in OCT, and until very recently, it has not been pursued as a commercial format. This can be attributed to expectations that the format would have worse imaging performance due to reduced confocal gating in comparison to the equivalent SP system, losing the benefits of fibre optic construction and drawbacks related to having a longer A-Scan integration time for a given A-Scan rate. Here, we reviewed the work carried out in the field, showing that these perceived limitations are either insignificant or can be overcome. Going forward, with SP systems running up against the resultant greater engineering demands for ever increasing imaging speed desired, it is likely that the LF lateral format comes into the mainstream as more research and commercial projects turn to it as an alternative to ease these engineering demands. Removing the need for galvo scanning the LF format also has benefits in low-cost (particularly SD), industrial and certain specialist applications, such as phase microscopy.

Author Contributions

Conceptualisation, S.L. and Y.-C.S.; methodology, S.L., Z.Z. and Y.-C.S.; writing—original draft preparation, S.L. and Z.Z.; writing—review and editing, S.L., Z.Z. and Y.-C.S.; supervision, Y.-C.S. and Y.Z.; project administration, Y.-C.S. and Y.Z.; funding acquisition, Y.-C.S. and Y.Z. All authors have read and agreed to the published version of the manuscript.

Funding

This research was partly funded by the UK EPSRC Research Grant No. EP/R014094/1, EP/W006405/1 and by the National Institute for Health Research (NIHR) under its i4i Program (Grant Reference Number II-LA-0813-20005 and II-LA-1116-20008). The views expressed are those of the authors and not necessarily those of the NHS, the NIHR or the Department of Health.

Conflicts of Interest

The authors declare no conflict of interest beyond citations of our own work within this review article. The funders had no role in the design of the study; in the collection, analyses, or interpretation of data; in the writing of the manuscript; or in the decision to publish the results.

References

  1. Huang, D.; Swanson, E.A.; Lin, C.P.; Schuman, J.S.; Stinson, W.G.; Chang, W.; Hee, M.R.; Flotte, T.; Gregory, K.; Puliafito, C.A.; et al. Optical Coherence Tomography. Science 1991, 254, 1178–1181. [Google Scholar] [CrossRef] [Green Version]
  2. Clarivate. Web of Science. 2022. Available online: https://clarivate.com/webofsciencegroup/solutions/web-of-science/ (accessed on 15 September 2022).
  3. Future_Market_Insights_Inc. Optical Coherence Tomography Market. Available online: https://www.futuremarketinsights.com/reports/optical-coherence-tomography-equipment-market (accessed on 15 September 2022).
  4. Grand_View_Research_Inc. Optical Coherence Tomography Market Size, Share & Trends Analysis Report by Type (Doppler, Handheld), by Technology (TD-OCT, FD-OCT), by Application (Ophthalmology, Oncology), and Segment Forecasts, 2022–2030. Available online: https://www.grandviewresearch.com/industry-analysis/optical-coherence-tomography-oct-market (accessed on 15 September 2022).
  5. Youngquist, R.C.; Carr, S.; Davies, D.E. Optical coherence-domain reflectometry: A new optical evaluation technique. Opt. Lett. 1987, 12, 158–160. [Google Scholar] [CrossRef]
  6. Fercher, A.; Mengedoht, K.; Werner, W. Eye-length measurement by interferometry with partially coherent light. Opt. Lett. 1988, 13, 186–188. [Google Scholar] [CrossRef] [PubMed]
  7. De Carlo, T.E.; Romano, A.; Waheed, N.K.; Duker, J.S. A review of optical coherence tomography angiography (OCTA). Int. J. Retin. Vitr. 2015, 1, 5. [Google Scholar] [CrossRef] [PubMed] [Green Version]
  8. Larin, K.V.; Sampson, D.D. Optical coherence elastography—OCT at work in tissue biomechanics [Invited]. Biomed. Opt. Express 2017, 8, 1172–1202. [Google Scholar] [CrossRef] [PubMed] [Green Version]
  9. Abdulhalim, I. Spatial and temporal coherence effects in interference microscopy and full-field optical coherence tomography. Ann. Der Phys. 2012, 524, 787–804. [Google Scholar] [CrossRef]
  10. Drexler, W.; Fujimoto, J.G. Optical Coherence Tomography: Technology and Applications; Springer: Berlin/Heidelberg, Germany, 2015; Volume 2. [Google Scholar]
  11. Sudkamp, H.; Koch, P.; Spahr, H.; Hillmann, D.; Franke, G.; Münst, M.; Reinholz, F.; Birngruber, R.; Hüttmann, G. In-vivo retinal imaging with off-axis full-field time-domain optical coherence tomography. Opt. Lett. 2016, 41, 4987–4990. [Google Scholar] [CrossRef] [Green Version]
  12. Fercher, A.F.; Hitzenberger, C.K.; Kamp, G.; El-Zaiat, S.Y. Measurement of intraocular distances by backscattering spectral interferometry. Opt. Commun. 1995, 117, 43–48. [Google Scholar] [CrossRef]
  13. Chinn, S.R.; Swanson, E.A.; Fujimoto, J.G. Optical coherence tomography using a frequency-tunable optical source. Opt. Lett. 1997, 22, 340–342. [Google Scholar] [CrossRef]
  14. Bille, J.F. High Resolution Imaging in Microscopy and Ophthalmology: New Frontiers in Biomedical Optics; Springer: Cham, Switzerland, 2019. [Google Scholar]
  15. Izatt, J.A.; Choma, M.A. Theory of Optical Coherence Tomography. In Optical Coherence Tomography, Biological and Medical Physics; Springer: Berlin, Germany, 2008; pp. 47–72. [Google Scholar]
  16. Schmitt, J.M. Optical coherence tomography (OCT): A review. IEEE J. Sel. Top. Quantum Electron. 1999, 5, 1205–1215. [Google Scholar] [CrossRef]
  17. Fercher, A.F.; Drexler, W.; Hitzenberger, C.K.; Lasser, T. Optical coherence tomography—principles and applications. Rep. Prog. Phys. 2003, 66, 239–303. [Google Scholar] [CrossRef]
  18. Tomlins, P.H.; Wang, R.K. Theory, developments and applications of optical coherence tomography. J. Phys. D Appl. Phys. 2005, 38, 2519. [Google Scholar] [CrossRef]
  19. Zysk, A.M.; Nguyen, F.T.; Oldenburg, A.L.; Marks, D.L.; Boppart, S.A. Optical coherence tomography: A review of clinical development from bench to bedside. J. Biomed. Opt. 2007, 12, 051403. [Google Scholar] [CrossRef] [Green Version]
  20. Marschall, S.; Sander, B.; Mogensen, M.; Jørgensen, T.M.; Andersen, P.E. Optical coherence tomography—Current technology and applications in clinical and biomedical research. Anal. Bioanal. Chem. 2011, 400, 2699–2720. [Google Scholar] [CrossRef] [Green Version]
  21. Drexler, W.; Liu, M.; Kumar, A.; Kamali, T.; Unterhuber, A.; Leitgeb, R.A. Optical coherence tomography today: Speed, contrast, and multimodality. J. Biomed. Opt. 2014, 19, 071412. [Google Scholar] [CrossRef]
  22. Fujimoto, J.; Swanson, E. The Development, Commercialization, and Impact of Optical Coherence Tomography. Investig. Ophthalmol. Vis. Sci. 2016, 57, OCT1–OCT13. [Google Scholar] [CrossRef] [Green Version]
  23. Dubois, A.; Boccara, C. L’OCT plein champ. M/S Méd. Sci. 2006, 22, 859–864. [Google Scholar] [CrossRef] [Green Version]
  24. Tang, D.; Henning, A.; Gao, F.; Gribble, A.; Jiang, X. Improved description of the signal formation in grating generated-optical coherence tomography. Opt. Express 2019, 27, 33999–34010. [Google Scholar] [CrossRef]
  25. Karamata, B.; Lambelet, P.; Laubscher, M.; Salathe, R.P.; Lasser, T. Spatially incoherent illumination as a mechanism for cross-talk suppression in wide-field optical coherence tomography. Opt. Lett. 2004, 29, 736–738. [Google Scholar] [CrossRef]
  26. Thouvenin, O.; Apelian, C.; Nahas, A.; Fink, M.; Boccara, C. Full-field optical coherence tomography as a diagnosis tool: Recent progress with multimodal imaging. Appl. Sci. 2017, 7, 236. [Google Scholar] [CrossRef]
  27. Wang, L.; Fu, R.; Xu, C.; Xu, M. Methods and applications of full-field optical coherence tomography: A review. J. Biomed. Opt. 2022, 27, 050901. [Google Scholar] [CrossRef] [PubMed]
  28. Regar, E.; van Leeuwen, A.; Serruys, P.W. New parallel frequency domain techniques for volumetric OCT Boris Považay, Wolfgang Drexler, Rainer A Leitgeb. In Optical Coherence Tomography in Cardiovascular Research; CRC Press: Boca Raton, FL, USA, 2007; pp. 237–246. [Google Scholar]
  29. Zeylikovich, I.; Alfano, R. Ultrafast dark-field interferometric microscopic reflectometry. Opt. Lett. 1996, 21, 1682–1684. [Google Scholar] [CrossRef] [PubMed]
  30. Beaurepaire, E.; Boccara, A.C.; Lebec, M.; Blanchot, L.; Saint-Jalmes, H. Full-field optical coherence microscopy. Opt. Lett. 1998, 23, 244–246. [Google Scholar] [CrossRef] [PubMed]
  31. von der Burchard, C.; Moltmann, M.; Tode, J.; Ehlken, C.; Sudkamp, H.; Theisen-Kunde, D.; König, I.; Hüttmann, G.; Roider, J. Self-examination low-cost full-field OCT (SELFF-OCT) for patients with various macular diseases. Graefe’s Arch. Clin. Exp. Ophthalmol. 2021, 259, 1503–1511. [Google Scholar] [CrossRef] [PubMed]
  32. Nguyen, T.-U.; Pierce, M.C.; Higgins, L.; Tkaczyk, T.S. Snapshot 3D optical coherence tomography system using image mapping spectrometry. Opt. Express 2013, 21, 13758–13772. [Google Scholar] [CrossRef]
  33. Bonin, T.; Franke, G.; Hagen-Eggert, M.; Koch, P.; Hüttmann, G. In vivo Fourier-domain full-field OCT of the human retina with 1.5 million A-lines/s. Opt. Lett. 2010, 35, 3432–3434. [Google Scholar] [CrossRef] [Green Version]
  34. Chen, Y.; Huang, S.-W.; Aguirre, A.D.; Fujimoto, J.G. High-resolution line-scanning optical coherence microscopy. Opt. Lett. 2007, 32, 1971–1973. [Google Scholar] [CrossRef]
  35. Zuluaga, A.F.; Richards-Kortum, R. Spatially resolved spectral interferometry for determination of subsurface structure. Opt. Lett. 1999, 24, 519–521. [Google Scholar] [CrossRef]
  36. Lee, S.-W.; Kim, B.-M. Line-field optical coherence tomography using frequency-sweeping source. IEEE J. Sel. Top. Quantum Electron. 2008, 14, 50–55. [Google Scholar] [CrossRef]
  37. Zeylikovich, I.; Gilerson, A.; Alfano, R. Nonmechanical grating-generated scanning coherence microscopy. Opt. Lett. 1998, 23, 1797–1799. [Google Scholar] [CrossRef]
  38. Encyclopædia Britannica, Inc. Holography. In Encyclopedia Britannica; Encyclopædia Britannica, Inc.: Chicago, IL, USA, 2022. [Google Scholar]
  39. Schnars, U.; Jüptner, W.P. Digital recording and numerical reconstruction of holograms. Meas. Sci. Technol. 2002, 13, R85. [Google Scholar] [CrossRef] [Green Version]
  40. Hillmann, D.; Lührs, C.; Bonin, T.; Koch, P.; Hüttmann, G. Holoscopy—Holographic optical coherence tomography. Opt. Lett. 2011, 36, 2390–2392. [Google Scholar] [CrossRef] [Green Version]
  41. Liu, X.; Yu, X.; Tang, H.; Cui, D.; Beotra, M.R.; Girard, M.J.; Sun, D.; Gu, J.; Liu, L. Spectrally encoded extended source optical coherence tomography. Opt. Lett. 2014, 39, 6803–6806. [Google Scholar] [CrossRef]
  42. Yu, X.; Liu, X.; Chen, S.; Luo, Y.; Wang, X.; Liu, L. High-resolution extended source optical coherence tomography. Opt. Express 2015, 23, 26399–26413. [Google Scholar] [CrossRef]
  43. Chen, S.; Lin, K.; Liu, L. High dynamic range blood flow imaging with spectrally extended line field OCTA. In Proceedings of the Optical Coherence Tomography 2022, Fort Lauderdale, FL, USA, 24–27 April 2022; p. CM4E. 2. [Google Scholar]
  44. Graf, R.; Brown, W.; Wax, A. Parallel frequency-domain optical coherence tomography scatter-mode imaging of the hamster cheek pouch using a thermal light source. Opt. Lett. 2008, 33, 1285–1287. [Google Scholar] [CrossRef] [Green Version]
  45. Yurdakul, C.; Millar, D.S.; Mansour, H.; Wang, P.; Kojima, K.; Koike-Akino, T.; Parsons, K.; Orlik, P.V. Line-field Coherent Sensing with LED Illumination. arXiv 2022, arXiv:2202.12161. [Google Scholar]
  46. Nandakumar, H.; Srivastava, S. Low cost open-source OCT using undergraduate lab components. In Optical Coherence Tomography and Its Non-Medical Applications; IntechOpen: Rijeka, Croatia, 2020; p. 75. [Google Scholar]
  47. Zhang, Y.; Dong, B.; Bai, Y.; Ye, S.; Lei, Z.; Zhou, Y. Measurement of depth-resolved thermal deformation distribution using phase-contrast spectral optical coherence tomography. Opt. Express 2015, 23, 28067–28075. [Google Scholar] [CrossRef]
  48. Nakamura, Y.; Makita, S.; Yamanari, M.; Itoh, M.; Yatagai, T.; Yasuno, Y. High-speed three-dimensional human retinal imaging by line-field spectral domain optical coherence tomography. Opt. Express 2007, 15, 7103–7116. [Google Scholar] [CrossRef] [Green Version]
  49. Grajciar, B.; Lehareinger, Y.; Fercher, A.F.; Leitgeb, R.A. High sensitivity phase mapping with parallel Fourier domain optical coherence tomography at 512,000 A-scan/s. Opt. Express 2010, 18, 21841–21850. [Google Scholar] [CrossRef]
  50. Fechtig, D.J.; Schmoll, T.; Grajciar, B.; Drexler, W.; Leitgeb, R.A. Line-field parallel swept source interferometric imaging at up to 1 MHz. Opt. Lett. 2014, 39, 5333–5336. [Google Scholar] [CrossRef]
  51. Endo, T.; Yasuno, Y.; Makita, S.; Itoh, M.; Yatagai, T. Profilometry with line-field Fourier-domain interferometry. Opt. Express 2005, 13, 695–701. [Google Scholar] [CrossRef] [PubMed]
  52. Lawman, S.; Dong, Y.; Williams, B.M.; Romano, V.; Kaye, S.; Harding, S.P.; Willoughby, C.; Shen, Y.-C.; Zheng, Y. High resolution corneal and single pulse imaging with line field spectral domain optical coherence tomography. Opt. Express 2016, 24, 12395–12405. [Google Scholar] [CrossRef] [PubMed] [Green Version]
  53. Barrick, J.; Doblas, A.; Gardner, M.R.; Sears, P.R.; Ostrowski, L.E.; Oldenburg, A.L. High-speed and high-sensitivity parallel spectral-domain optical coherence tomography using a supercontinuum light source. Opt. Lett. 2016, 41, 5620–5623. [Google Scholar] [CrossRef]
  54. Ginner, L.; Schmoll, T.; Kumar, A.; Salas, M.; Pricoupenko, N.; Wurster, L.M.; Leitgeb, R.A. Holographic line field en-face OCT with digital adaptive optics in the retina in vivo. Biomed. Opt. Express 2018, 9, 472–485. [Google Scholar] [CrossRef] [PubMed]
  55. Dubois, A.; Xue, W.; Levecq, O.; Bulkin, P.; Coutrot, A.-L.; Ogien, J. Mirau-based line-field confocal optical coherence tomography. Opt. Express 2020, 28, 7918–7927. [Google Scholar] [CrossRef]
  56. Lawman, S.; Mason, S.; Kaye, S.B.; Shen, Y.-C.; Zheng, Y. Accurate In Vivo Bowman’s Thickness Measurement Using Mirau Ultrahigh Axial Resolution Line Field Optical Coherence Tomography. Transl. Vis. Sci. Technol. 2022, 11, 6. [Google Scholar] [CrossRef]
  57. Vakhtin, A.B.; Kane, D.J.; Wood, W.R.; Peterson, K.A. Common-path interferometer for frequency-domain optical coherence tomography. Appl. Opt. 2003, 42, 6953–6958. [Google Scholar] [CrossRef] [Green Version]
  58. Lawman, S.; Williams, B.M.; Zheng, Y.; Shen, Y.-C. Quasi-tomography by free space line field spectral domain optical coherence reflectometry. Meas. Sci. Technol. 2020, 31, 065203. [Google Scholar] [CrossRef]
  59. Robles, F.E.; Wilson, C.; Grant, G.; Wax, A. Molecular imaging true-colour spectroscopic optical coherence tomography. Nat. Photonics 2011, 5, 744–747. [Google Scholar] [CrossRef] [Green Version]
  60. Reolon, D.; Jacquot, M.; Verrier, I.; Brun, G.; Veillas, C. Broadband supercontinuum interferometer for high-resolution profilometry. Opt. Express 2006, 14, 128–137. [Google Scholar] [CrossRef]
  61. Grajciar, B.; Pircher, M.; Fercher, A.F.; Leitgeb, R.A. Parallel Fourier domain optical coherence tomography for in vivo measurement of the human eye. Opt. Express 2005, 13, 1131–1137. [Google Scholar] [CrossRef]
  62. Zhang, Y.; Rha, J.T.; Jonnal, R.S.; Miller, D.T. Adaptive optics parallel spectral domain optical coherence tomography for imaging the living retina. Opt. Express 2005, 13, 4792–4811. [Google Scholar] [CrossRef]
  63. Yasuno, Y.; Endo, T.; Makita, S.; Aoki, G.; Itoh, M.; Yatagai, T. Three-dimensional line-field Fourier domain optical coherence tomography for in vivo dermatological investigation. J. Biomed. Opt. 2006, 11, 014014. [Google Scholar] [CrossRef]
  64. Manuel, H. 3D Digital Holographic Interferometry and Spectral Optical Coherence Tomography for the Measurement of Strain in Metallic Objects and Phase in Biological Tissues. Ph.D. Thesis, M.C. Manuel Humberto De la Torre Ibarra, Centro de Investigaciones en Óptica, León, Mexico, 2006. [Google Scholar]
  65. Manuel, H.; Ruiz, P.D.; Huntley, J.M. Double-shot depth-resolved displacement field measurement using phase-contrast spectral optical coherence tomography. Opt. Express 2006, 14, 9643–9656. [Google Scholar]
  66. Yaqoob, Z.; Choi, W.; Oh, S.; Lue, N.; Park, Y.; Fang-Yen, C.; Dasari, R.R.; Badizadegan, K.; Feld, M.S. Improved phase sensitivity in spectral domain phase microscopy using line-field illumination and self phase-referencing. Opt. Express 2009, 17, 10681–10687. [Google Scholar] [CrossRef] [Green Version]
  67. Zhong, J.; Zhong, S.; Zhang, Q.; Yao, L. Two-dimensional optical coherence tomography for real-time structural dynamical characterization. Opt. Lasers. Eng. 2015, 66, 74–79. [Google Scholar] [CrossRef] [Green Version]
  68. Nakamura, Y.; Sugisaka, J.-I.; Sando, Y.; Endo, T.; Itoh, M.; Yatagai, T.; Yasuno, Y. Complex numerical processing for in-focus line-field spectral-domain optical coherence tomography. Jpn. J. Appl. Phys. 2007, 46, 1774. [Google Scholar] [CrossRef]
  69. Bu, P.; Wang, X.; Sasaki, O. Full-range parallel Fourier-domain optical coherence tomography using sinusoidal phase-modulating interferometry. J. Opt. A Pure Appl. Opt. 2007, 9, 422. [Google Scholar] [CrossRef]
  70. Bu, P.; Wang, X.; Sasaki, O. One-shot parallel complex Fourier-domain optical coherence tomography using a spatial carrier frequency. Opt. Eng. 2008, 47, 050502. [Google Scholar] [CrossRef] [Green Version]
  71. Witte, S.; Baclayon, M.; Peterman, E.; Toonen, R.; Mansvelder, H.; Groot, M.L. Single-shot two-dimensional full-range optical coherence tomography achieved by dispersion control. Opt. Express 2009, 17, 11335–11349. [Google Scholar] [CrossRef] [Green Version]
  72. Kamal, M.; Narayanswamy, S.; Packirisamy, M. Optical design of a line-focused forward-viewing scanner for optical coherence tomography. Appl. Opt. 2010, 49, 6170–6178. [Google Scholar] [CrossRef]
  73. Kamal, M.; Sivakumar, N.R.; Packirisamy, M. Optimized off-axis cylindrical mirror-focused line-scanning system for optical coherence tomography imaging applications. J. Biomed. Opt. 2012, 17, 056006. [Google Scholar] [CrossRef] [PubMed]
  74. Kamal, M. Reflective Optics-Based Line-Scanning Spectral Domain Optical Coherence Tomography System. Ph.D. Thesis, Concordia University, Montreal, QC, Canada, 2011. [Google Scholar]
  75. Robles, F.E.; Satterwhite, L.L.; Wax, A. Nonlinear phase dispersion spectroscopy. Opt. Lett. 2011, 36, 4665–4667. [Google Scholar] [CrossRef] [PubMed] [Green Version]
  76. Widjanarko, T. Hyperspectral Interferometry for Single-Shot Profilometry and Depth-Resolved Displacement Field Measurement. Ph.D. Thesis, Taufiq Widjanarko, Loughborough University, Loughborough, UK, 2011. [Google Scholar]
  77. Xiao, Q.; Fu, L. High resolution, real-time line-field fourier-domain interferometry. J. Innov. Opt. Health Sci. 2012, 5, 1250009. [Google Scholar] [CrossRef]
  78. Huang, B.J.; Bu, P.; Wang, X.Z.; Nan, N.; Guo, X. Speckle reduction in parallel optical coherence tomography by spatial compounding. Opt. Laser Technol. 2013, 45, 69–73. [Google Scholar] [CrossRef]
  79. Zhao, C.; Chen, Z.-Y.; Ding, Z.-H.; Li, P.; Shen, Y.; Ni, Y. Line-field parallel spectral domain optical coherence tomography and its application in defect inspection. Acta Phys. Sin. 2014, 63, 194201. [Google Scholar] [CrossRef]
  80. Chen, Z.; Shen, Y.; Bao, W.; Li, P.; Wang, X.; Ding, Z. Identification of surface defects on glass by parallel spectral domain optical coherence tomography. Opt. Express 2015, 23, 23634–23646. [Google Scholar] [CrossRef]
  81. Chen, Z.Y.; Zhao, C.; Shen, Y.; Li, P.; Wang, X.P.; Ding, Z.H. Ultrawide-field parallel spectral domain optical coherence tomography for nondestructive inspection of glass. Opt. Commun. 2015, 341, 122–130. [Google Scholar] [CrossRef]
  82. Briones-R, M.d.J.; De La Torre-Ibarra, M.H.; Mendoza-Santoyo, F.; Pedroza-G, J. Simultaneous birefringence imaging and depth phase resolved measurement using a Fourier domain OCT system. Opt. Lasers. Eng. 2015, 68, 104–110. [Google Scholar] [CrossRef]
  83. Schmidt, I. Thermal Light Tear Film Imaging with Spectral Domain Optical Coherence Tomography (SD-OCT). Diploma Thesis, Technische Universität Wien, Wien, Austria, 2016. [Google Scholar]
  84. Tang, D. Investigation of Line-Scan Dispersive Interferometry for In-Line Surface Metrology. Ph.D. Thesis, University of Huddersfield, Huddersfield, UK, 2016. [Google Scholar]
  85. Lawman, S.; Madden, P.W.; Romano, V.; Dong, Y.; Mason, S.; Williams, B.M.; Kaye, S.B.; Willoughby, C.E.; Harding, S.P.; Shen, Y.-C.; et al. Deformation velocity imaging using optical coherence tomography and its applications to the cornea. Biomed. Opt. Express 2017, 8, 5579–5593. [Google Scholar] [CrossRef] [Green Version]
  86. Lawman, S.; Williams, B.M.; Zhang, J.; Shen, Y.-C.; Zheng, Y. Scan-Less Line Field Optical Coherence Tomography, with Automatic Image Segmentation, as a Measurement Tool for Automotive Coatings. Appl. Sci. 2017, 7, 351. [Google Scholar] [CrossRef] [Green Version]
  87. Lawman, S.; Zhang, J.; Williams, B.M.; Zheng, Y.; Shen, Y. Applications of optical coherence tomography in the non-contact assessment of automotive paints. In SPIE Optical Metrology, Proceedings of the Optical Measurement Systems for Industrial Inspection X, Munich, Germany, 25–29 June 2017; SPIE: Bellingham, WA, USA, 2017. [Google Scholar]
  88. Al-Qazwini, Z.; Ko, Z.Y.G.; Mehta, K.; Chen, N. Ultrahigh-speed line-scan SD-OCT for four-dimensional in vivo imaging of small animal models. Biomed. Opt. Express 2018, 9, 1216–1228. [Google Scholar] [CrossRef]
  89. Dong, B.; Zhang, Y.; Pan, B. Enhancing the dynamic range of phase-sensitive optical coherence elastography by overcoming speckle decorrelation. Opt. Lett. 2018, 43, 5805–5808. [Google Scholar] [CrossRef]
  90. Lin, J.; Zhong, S.; You, T.; Zhang, Q.; Tong, J. Curvature Radius Measurement of Lens by Using Line Field Spectral Domain Optical Coherence Tomography. In FZU-OPU-NTOU Joint Symposium on Advanced Mechanical Science & Technology for Industrial Revolution 4.0; Springer: Singapore, 2016; pp. 113–119. [Google Scholar]
  91. Han, L.; Hosseiaee, Z.; Tan, B.; Bizheva, K. High resolution line-field SD-OCT with 2.5 kHz frame rate for cellular resolution imaging of biological tissue. In SPIE BIOS, Proceedings of Optical Coherence Tomography and Coherence Domain Optical Methods in Biomedicine XXIII, San Francisco, CA, USA, 2–7 February 2019; SPIE: Bellingham, WA, USA, 2019; pp. 123–128. [Google Scholar]
  92. Han, L.; Tan, B.; Hosseinaee, Z.; Chen, L.K.; Hileeto, D.; Bizheva, K. Line-scanning SD-OCT for in-vivo, non-contact, volumetric, cellular resolution imaging of the human cornea and limbus. Biomed. Opt. Express 2022, 13, 4007–4020. [Google Scholar] [CrossRef]
  93. Barrick, J. Development of a Line-Field Magneto-Motive Optical Coherence Tomography System. Ph.D. Thesis, The University of North Carolina at Chapel Hill, Ann Arbor, MI, USA, 2020. [Google Scholar]
  94. Xing, F.; Lee, J.-H.; Polucha, C.; Lee, J. Design and optimization of line-field optical coherence tomography at visible wavebands. Biomed. Opt. Express 2021, 12, 1351–1365. [Google Scholar] [CrossRef]
  95. Singh, M.; Schill, A.W.; Nair, A.; Aglyamov, S.R.; Larina, I.V.; Larin, K.V. Ultra-Fast Line-Field Optical Coherence Elastography at 11.5 MHz. In Proceedings of the Optical Coherence Tomography 2022, Fort Lauderdale, FL, USA, 24–27 April 2022; p. CTu4E. 2. [Google Scholar]
  96. Lawman, S.; Romano, V.; Madden, P.; Mason, S.; Williams, B.; Zheng, Y.; Shen, Y.-C. Supercontinuum Ultra-High Resolution Line-Field OCT; Experimental Spectrograph Comparison and Comparison with Current Clinical OCT Systems by the Imaging of a Human Cornea; SPIE: Bellingham, WA, USA, 2018; Volume 10591. [Google Scholar]
  97. Alfano, R.; Shapiro, S. Emission in the region 4000 to 7000 Å via four-photon coupling in glass. Phys. Rev. Lett. 1970, 24, 584. [Google Scholar] [CrossRef]
  98. Zeylikovich, I.; Alfano, R. Coherence properties of the supercontinuum source. Appl. Phys. B 2003, 77, 265–268. [Google Scholar] [CrossRef]
  99. Watanabe, Y.; Yamada, K.; Sato, M. Three-dimensional imaging by ultrahigh-speed axial-lateral parallel time domain optical coherence tomography. Opt. Express 2006, 14, 5201–5209. [Google Scholar] [CrossRef]
  100. Watanabe, Y.; Yamada, K.; Sato, M. In vivo non-mechanical scanning grating-generated optical coherence tomography using an InGaAs digital camera. Opt. Commun. 2006, 261, 376–380. [Google Scholar] [CrossRef]
  101. Watanabe, Y.; Takasugi, Y.; Yamada, K.; Sato, M. Axial-lateral parallel time domain OCT with an optical zoom lens and high order diffracted lights for variable imaging range. Opt. Express 2007, 15, 5208–5217. [Google Scholar] [CrossRef]
  102. Watanabe, Y.; Sato, M. Quasi-single shot axial-lateral parallel time domain optical coherence tomography with Hilbert transformation. Opt. Express 2008, 16, 524–534. [Google Scholar] [CrossRef] [PubMed]
  103. Leitgeb, R.; Hitzenberger, C.K.; Fercher, A.F. Performance of fourier domain vs. time domain optical coherence tomography. Opt. Express 2003, 11, 889–894. [Google Scholar] [CrossRef] [PubMed]
  104. Chen, Y.; Huang, S.-W.; Zhou, C.; Potsaid, B.; Fujimoto, J.G. Improved detection sensitivity of line-scanning optical coherence microscopy. IEEE J. Sel. Top. Quantum Electron. 2011, 18, 1094–1099. [Google Scholar] [CrossRef] [PubMed] [Green Version]
  105. Liu, C.-H.; Schill, A.; Wu, C.; Singh, M.; Larin, K.V. Non-contact single shot elastography using line field low coherence holography. Biomed. Opt. Express 2016, 7, 3021–3031. [Google Scholar] [CrossRef] [PubMed] [Green Version]
  106. Leitgeb, R. En face optical coherence tomography: A technology review. Biomed. Opt. Express 2019, 10, 2177–2201. [Google Scholar] [CrossRef]
  107. Liu, C.-H.; Schill, A.; Raghunathan, R.; Wu, C.; Singh, M.; Han, Z.; Nair, A.; Larin, K.V. Ultra-fast line-field low coherence holographic elastography using spatial phase shifting. Biomed. Opt. Express 2017, 8, 993–1004. [Google Scholar] [CrossRef] [Green Version]
  108. Dubois, A.; Levecq, O.; Azimani, H.; Davis, A.; Ogien, J.; Siret, D.; Barut, A. Line-field confocal time-domain optical coherence tomography with dynamic focusing. Opt. Express 2018, 26, 33534–33542. [Google Scholar] [CrossRef]
  109. Ogien, J.; Levecq, O.; Azimani, H.; Dubois, A. Dual-mode line-field confocal optical coherence tomography for ultrahigh-resolution vertical and horizontal section imaging of human skin in vivo. Biomed. Opt. Express 2020, 11, 1327–1335. [Google Scholar] [CrossRef]
  110. OCT_News. Damae Medical Raises €5M in Series a Financing to Accelerate the European Deployment of Its Deeplive Platform and Revolutionize Skin Cancer Screening, Diagnosis and Monitoring. Available online: http://www.octnews.org/articles/12119830/damae-medical-raises-eur5m-in-series-a-financing-t/ (accessed on 16 September 2022).
  111. Mujat, M.; Iftimia, N.V.; Ferguson, R.D.; Hammer, D.X. Swept-source parallel OCT. In SPIE BIOS, Proceedings of the Optical Coherence Tomography and Coherence Domain Optical Methods in Biomedicine XIII, San Jose, CA, USA, 24–29 January 2009; SPIE: Bellingham, WA, USA, 2009; pp. 140–147. [Google Scholar]
  112. Fechtig, D.J.; Grajciar, B.; Schmoll, T.; Blatter, C.; Werkmeister, R.M.; Drexler, W.; Leitgeb, R.A. Line-field parallel swept source MHz OCT for structural and functional retinal imaging. Biomed. Opt. Express 2015, 6, 716–735. [Google Scholar] [CrossRef] [Green Version]
  113. Fechtig, D.J.; Kumar, A.; Drexler, W.; Leitgeb, R.A. Full range line-field parallel swept source imaging utilizing digital refocusing. J. Mod. Opt. 2015, 62, 1801–1807. [Google Scholar] [CrossRef]
  114. Zhao, Z.; Zhang, Z.; Lawman, S.J.; Yin, Z.; Hu, Y.; Xu, J.; Shen, Y. Characterization of Electrical–Thermal–Mechanical Deformation of Bonding Wires Under Silicone Gel Using LF-OCT. IEEE Trans. Power Electron. 2021, 36, 11045–11054. [Google Scholar] [CrossRef]
  115. Karamata, B. Multiple Scattering in Wide-Field Optical Coherence Tomography; EPFL: Lausanne, Switzerland, 2004. [Google Scholar]
  116. Karamata, B.; Leutenegger, M.; Laubscher, M.; Bourquin, S.; Lasser, T.; Lambelet, P. Multiple scattering in optical coherence tomography. II. Experimental and theoretical investigation of cross talk in wide-field optical coherence tomography. JOSA A 2005, 22, 1380–1388. [Google Scholar] [CrossRef]
  117. Karamata, B.; Lambelet, P.; Leutenegger, M.; Laubscher, M.; Bourquin, S.; Lasser, T. A semi-analytical model accounting for multiple scattering in optical coherence tomography. In SPIE BIOS, Proceedings of the Coherence Domain Optical Methods and Optical Coherence Tomography in Biomedicine IX, San Jose, CA, USA, 23–26 January 2005; SPIE: Bellingham, WA, USA, 2005; pp. 386–396. [Google Scholar]
  118. Hammer, D.X.; Ferguson, R.D.; Ustun, T.E.; Bigelow, C.E.; Iftimia, N.V.; Webb, R.H. Line-scanning laser ophthalmoscope. J. Biomed. Opt. 2006, 11, 041126. [Google Scholar] [CrossRef]
  119. Yasin Alibhai, A.; Or, C.; Witkin, A.J. Swept source optical coherence tomography: A review. Curr. Ophthalmol. Rep. 2018, 6, 7–16. [Google Scholar] [CrossRef]
  120. Zuluaga, A.F.; Chang, S.K.; Richards-Kortnm, R. Combined sub-surface imaging and surface spectroscopic imaging in biological samples. In Proceedings of the Biomedical Optical Spectroscopy and Diagnostics 2000, Miami Beach, FL, USA, 2 April 2000; p. SuG3. [Google Scholar]
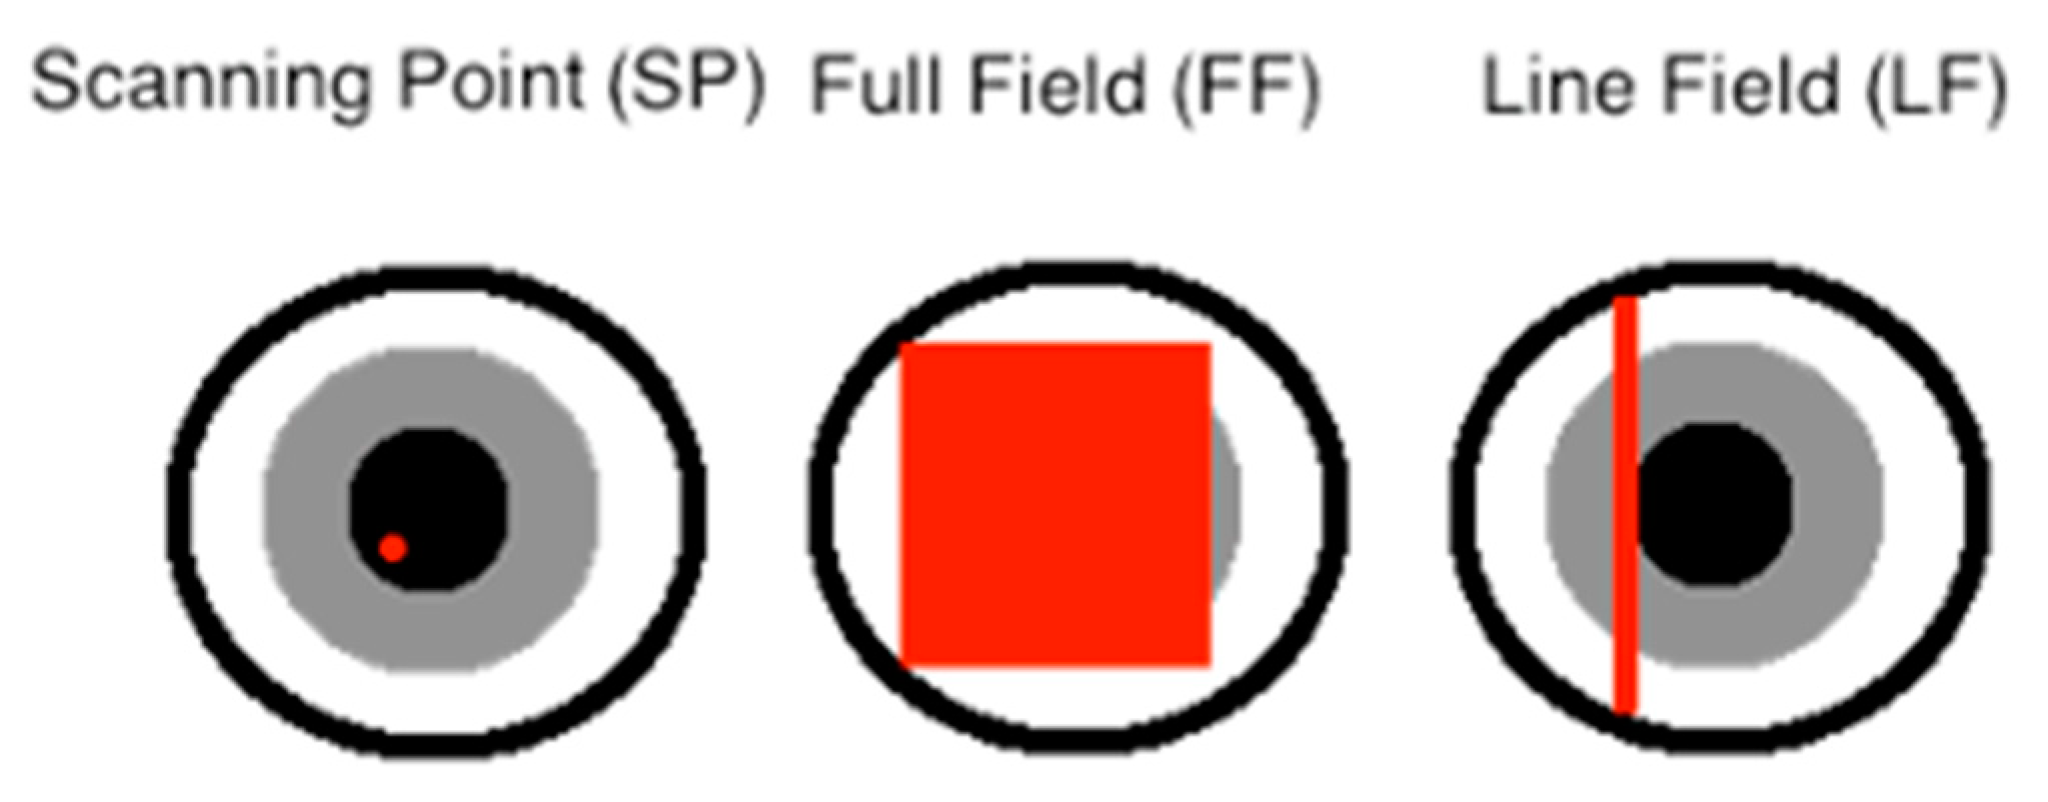
Figure 1. Illustration of lateral area illuminated and imaged for each lateral format.
Photonics 09 00946 g001
Figure 2. The options for the first (independent of imaging optics) (ac) and second (shared with imaging optics) (d,e) halves of the illumination optics. (a) Full field (non-confocal) illumination. (b) Slit image and (c) astigmatic optic generated line field. (d) Negatively (see text for description) and (e) positively (see text for description) generated line field.
Photonics 09 00946 g002
Figure 3. Generic reference recollimation setup. The cylindrical lens acts to recollimate the reference path light coming out of the illumination optics.
Photonics 09 00946 g003
Figure 4. (a,b) Reproduced with permission from Ref. [56], in vivo image of the cornea with high axial resolution and high depth of field LF SD OCT system. (a) Averaged image. (b) Zoom on front of cornea with segmentations to measure Bowman’s and epithelial layers’ thickness. (c,d) Reproduced with permission from Ref. [92], in vivo imaging of the cornea with a high axial and lateral resolution LF SD OCT system. (c) Volume of front of the cornea. (d) En-face image of endothelium cell structure at the back of the cornea.
Photonics 09 00946 g004
Figure 5. Schematic diagram of generic (a) slited and (b) slit-less LF SD OCT systems.
Photonics 09 00946 g005aPhotonics 09 00946 g005b
Figure 6. Generic schematic diagram of layout of LF-AL pseudo-OCT system.
Photonics 09 00946 g006
Figure 7. Reproduced with permission from Ref. [102]. An example B-scan taken from an in vivo image volume of a fingertip, captured with an LF AL pseudo-OCT system.
Photonics 09 00946 g007
Figure 8. (a) Linnik LF-TD-OCT, as optimised for high-resolution confocally gated imaging. (b) Mirau variant, using only a single translational stage. Note that galvo mirrors (not shown) can be included in both variants to allow 3D imaging.
Photonics 09 00946 g008
Figure 9. Reproduced with permission from Ref. [55], an in vivo B-Scan image of human skin, with 1.3 (lateral) × 1.1 (axial) µm resolution, taken with a Mirau LF TD OCT. The features resolvable due to this resolution include (K) epidermal cells, (CF) dermis collagen fibres, (BV) blood vessels and (DEJ) dermoepidermal junction.
Photonics 09 00946 g009
Figure 10. Generic LF-SS-OCT system.
Photonics 09 00946 g010
Figure 11. Reproduced with permission from Ref. [112]. (A) Averaged stitched widefield in vivo B-scan image of the retina, choroid and optical nerve head. (B) High lateral resolution en-face image of cone cells in the retina.
Photonics 09 00946 g011
Table 1. Categorisation of optical coherence tomography systems by combination of lateral and axial resolution methods, with seminal early paper identified and description of prevalence in general clinical practice. The area highlighted in green is the scope of this review.
Axial Resolution Method (Axial Format)Pseudo-OCT
Time domain (TD) (includes sequential, linear and off-axis)Spectral domain (SD)Swept source (SS)Axial–lateral (AL) (also known as grating generated)
Lateral resolution method
(lateral format)
Scanning point (SP)Huang et al., 1991 [1]
Early generation devices only, e.g., Zeiss OCT1
Fercher et al., 1995 [12]
Widespread use, e.g., Heidelberg Spectralis
Chin, Swanson and Fujimoto, 1997 [13]
Widespread use, e.g., Tomey CASIA2
SP basis paper [29] for LF-AL was linear TD
None
Full/wide field (FF)Beaurepaire et al., 1998 [30]
Not widely available, but clinical studies have been carried out [31]
Achievable only via LF to FF mapping [32]
None
Bonin et al., 2010 [33]
Not yet available, but clinical research ongoing
-
Line field (LF)Chen et al., 2007 [34]
Recent dermatology systems, e.g., DAMAE deepLive
Zuluaga and Richards-Kortum, 1999 [35]
Not yet, but under clinical study
Lee and Kim, 2008 [36]
None currently
Zeylikovich, Gilerson and Alfano, 1998 [37]
None
Table 2. Overview of each LF axial format.
Full Sequential TDEn-Face Sequential Phase-Modulated and off-Axis TD (also Known as “Holographic” Misnomer)SDSSAL
Light sources that were usedFemtosecond laser [34]
Supercontinuum [108]
SLD [105]SLD [35]
Thermal [61]
Supercontinuum [60]
Femtosecond laser [71]
LED [45]
Grating cavity [36]
AO modulated [50]
Femtosecond laser [37]
SLD [99]
LED [24]
Detectors used1D CCD [34] or CMOS [55] camera1D CMOS [105]2D CMOS or CCD camera1D CMOS or CCD camera2D CCD or CMOS
Scanning required to capture B-ScanMechanical scan along z-axisB-Scan generally not capturedNo scan necessaryElectrical scan of the light source wavelengthNo scan necessary
Relative merits of axial methodEntire volume can be taken at focus (benefits high lateral resolution setups)
High axial resolution achievable
Optimum efficiency for en-face image at single depth
Ultra-high-speed monitoring of phase displacement information at en-face depth
High axial resolution achievableHigh SNR, large imaging depthNone
Merits and drawbacks in comparison to SP versionLower mechanical requirements for high-speed imaging
Higher total optical power safety limits in some scenarios
Reduced complexity of motion distortion within individual B-Scans
Reduced confocal gating
Not fibre optic
More prone to A-Scan motion artefacts
Lower mechanical requirements for high-speed imaging
Higher total optical power safety limits in some scenarios,
(with a global shutter camera) no axial motion distortion or phase instability along en-face line
Reduced confocal gating
Not fibre optic
Lower mechanical requirements for high-speed imaging
Higher total optical power safety limits in some scenarios,
(with a global shutter camera) no axial motion distortion or phase instability within individual B-Scans
Reduced confocal gating
Not fibre optic
More prone to washout
Lower mechanical requirements for high-speed imaging
Higher total optical power safety limits in some scenarios
Reduced complexity of phase instability within individual B-Scans
Reduced confocal gating
Not fibre optic
More prone to A-Scan motion artefacts
N/A
Merits and drawbacks in comparison to FF versionSome confocal gating
Requires one lateral axis scan to capture 3D volume
Some confocal gating
Requires one lateral axis scan to capture 2D en-face image
Some confocal gating
Requires one lateral axis scan to capture 3D volume
Some confocal gating
Requires one lateral axis scan to capture 3D volume
N/A
Reported applicationsEx vivo tissue [34]
In vivo dermatology [108]
OCE [105]
Angiography [54]
In vivo retinal en face [54]
Ex vivo [120]
In vivo retinal [62]
In vivo corneal [61]
Profilometry [51]
Phase displacements [65]
Retinal [112]In vivo skin demonstration [99]
Challenges and future trends2D lock-in detection camera at affordable price
Expands back out to fields outside dermatology
Ever faster dynamic measurementsFaster data transfer and higher sensitivity 2D camera
In vivo ultra-fast OCM imaging with DAO enhancement
Light sources with larger tuning range at faster speed and more affordable
In vivo ultra-fast imaging with DAO enhancement
Field probably dead
Table 3. Representative values of typical performance achieved with different LF-OCT formats.
A-Scan Speed
(Volume Imaging)
En-Face SpeedHighest Reflection Sensitivity (dB)Best Axial Resolution (µm in Air)Best Lateral Resolution (µm)
LF-SD2 MHz [92]-92 [92], high power extreme 113 [53]2.1 [52]2 to 3 [92]
LF-TD24.6 kHz [55]11.5 MHz [95]86 [108]1.5 [55]1.3 [55]
LS-SS1 MHz [112]-93.5 [112]12 [112]>7 [112]
Publisher’s Note: MDPI stays neutral with regard to jurisdictional claims in published maps and institutional affiliations.