Abstract
(1) Background: We present a fast generative adversarial network (GAN) for generating high-fidelity optical coherence tomography (OCT) images. (2) Methods: We propose a novel Fourier-FastGAN (FOF-GAN) to produce OCT images. To improve the image quality of the synthetic images, a new discriminator with a Fourier attention block (FAB) and a new generator with fast Fourier transform (FFT) processes were redesigned. (3) Results: We synthesized normal, diabetic macular edema (DME), and drusen images from the Kermany dataset. When training with 2800 images with 50,000 epochs, our model used only 5 h on a single RTX 2080Ti GPU. Our synthetic images are realistic to recognize the retinal layers and pathological features. The synthetic images were evaluated by a VGG16 classifier and the Fréchet inception distance (FID). The reliability of our model was also demonstrated in the few-shot learning with only 100 pictures. (4) Conclusions: Using a small computing budget and limited training data, our model exhibited good performance for generating OCT images with a 512 × 512 resolution in a few hours. Fast retinal OCT image synthesis is an aid for data augmentation medical applications of deep learning.
1. Introduction
For computer-aided diagnosis, big data help deep learning algorithms achieve rapid advancements [1]. To train a reliable model, a huge number of medical images are often required [2]. However, medical institutes usually have a responsibility to safeguard patient privacy and the secrecy of computerized medical records [3]. Deep learning studies may be carried out utilizing aggregates of non-identifiable patient data, but such “scrubbed” records are usually insufficient [4].
The generative adversarial network (GAN) is a kind of machine learning technique for generating high-fidelity images from a real training set [5,6]. GANs have demonstrated their benefits not only in computer vision, but also in medical fields since they were first proposed in 2014 [7,8]. GANs help with tasks in medical imaging where the training dataset is limited or unbalanced [9].
At present, GANs have shown good performance in fundus imaging modalities. Hervella et al. investigated the utilization of reconstruction tasks across medical imaging modalities and suggested a more informative method [10]. Costa et al. proposed an adversarial autoencoder for retinal vessel image synthesis [11]. Yu et al. developed a multiple-channel, multiple-landmark pipeline to generate color fundus images using an optic disc, optic cup, and vessel tree [12]. Kamran et al. introduced an attention-based model to produce fluorescein angiography from fundus images while predicting retinal degeneration [13,14].
Optical coherence tomography (OCT) has become the most popular imaging technique in ophthalmology. OCT uses low-coherence light to produce cross-sectional images of ocular biological tissue with a micron resolution [15,16]. Due to its non-invasive imaging collection, OCT is widely preferred for the evaluation of retinal diseases [17,18].
In the field of OCT image synthesis, Kande et al. developed SiameseGAN for denoising low signal-to-noise ratio B-scans of SDOCT [19]. Chen et al. introduced DN-GAN to keep the texture features in OCT images by reducing the speckle noises [20]. Sun et al. used polarization-sensitive information from single-polarization intensity pictures and suggested a GAN model to predict PS-OCT images [21]. Zha et al. proposed an end-to-end network based on conditional GANs (cGANs) for OCT image synthesis. [22]. Zheng et al. adopted progressively grown GANs (PGGANs) to synthesize OCT images with a 256 × 256 resolution [23]. Because more details are usually generated by deeper and more sophisticated networks, the computational cost of GAN models always remains huge for OCT image synthesis. The large consumption of computing resources has been a barrier to applying GAN to OCT images.
To address the shortcoming, we propose a fast model named Fourier-FastGAN (FOF-GAN) to generate high-fidelity OCT images. The rest is organized as follows: In the Section 2, we introduce FOF-GAN with the pivotal blocks, the dataset, and the metrics; in the Section 3, we report and analyze the synthetic results; in the Section 4, we further discuss the results; in the Section 5, we provide the conclusion and the future outlook of our study.
2. Methods
2.1. FOF-GAN
We adopted FastGAN [24] as our baseline because of its efficiency. FastGAN aids in the stabilization of GAN training and the avoidance of mode collapse issues. Especially for OCT image synthesis, we redesigned our discriminator and generator. The discriminator and the generator were trained simultaneously. The discriminator aimed to improve the ability of correctly labeling both genuine and synthetic images. By learning a model distribution, the generator focused on cheating the discriminator and subsequently improved the realistic-looking reconstructions [25].
2.2. Fourier Attention Block in Discriminator
A discriminator returns a scalar indicating the authenticity of the image input. To identify genuine and synthetic images, the GAN discriminator must be adapted to both coarse and fine images; either a kernel with a larger receptive field or a deeper architecture is required. Both of these solutions increase the number of parameters and may lead to over-fitting. Calculating all of these parameters also requires considerable computing power.
To solve this problem, we added a FAB that enabled the network to rescale the feature map in accordance with the frequency contributions [26]. Normally, the OCT spectral interferogram includes three essential factors: DC terms, cross-correlation terms, and auto-correlation terms [27]. In our model, the contributions from each frequency component in the power spectrum of each feature map were actually synthetic by the global pooling operation in FAB. In order to determine the rescaling factors, the spatial channel attention (SCA) mechanism used the average intensities of the feature maps, which were comparable to the DC term in B-scans.
The structure of FAB is shown in Figure 1, and the structure of our discriminator is illustrated in Figure 2. During the training process of the discriminator, only when the label was set to “True”, the learned perceptual image patch similarity (LPIPS) loss function started to be calculated. The loss function of the discriminator D is:

Figure 1.
The structure of FAB. The Fourier attention module is composed of four Fourier channel attention mechanism blocks. The Fourier channel attention mechanism (solid green box) consists of a fast Fourier transform (FFT) layer, a global average pooling layer, convolution layers, and Gaussian error linear unit (GELU) activation layers. ⊕ and ⊗ represent the matrix addition and multiplication, respectively. The black arrows represent the flow of the data.
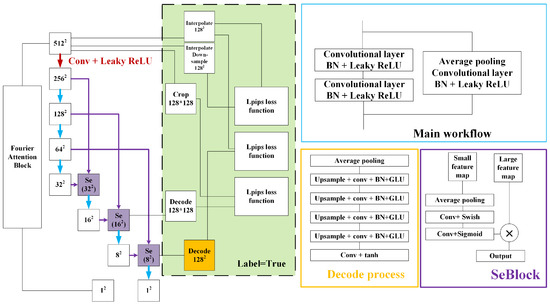
Figure 2.
The structure of the discriminator. The blue box and blue arrows represent the main workflow, which is a residual structure with several layers. The red arrow represents the workflow containing the convolutional layer and the Leaky ReLU activation function. The purple boxes and arrows represent the process of the skip-layer excitation block (SeBlock). Two inputs are combined by each SeBlock module to create one output, which is then passed on. The numbers in the SeBlock represent the size of the processed image. The orange boxes and arrows represent the decoding process. The green solid box represents the extra computation only required for real images during the training process.
Here, is the LPIPS loss and is the loss function related to FAB. f is the intermediate feature map from the discriminator D. expresses the decoding process. The function T contains the processing of sample x from real images . Sample comes from generated images. We also used the label smoothing trick in the loss function, which is not shown in the above equations.
2.3. FFT in Generator
Whether the generator can produce precise layers is a prominent problem in OCT image synthesis. Common generators cause patterns to collapse, and most synthetic images are not sufficient compared to the original dataset. As the traditional discriminators are not strong enough to cheat the discriminators, we propose a new generator based on image post-processing in spectral domain OCT (SD-OCT). In practice, the OCT signal is collected by the detector and then processed to eliminate fixed pattern noise. The corrections for the errors included the Fourier transform, zero padding, and inverse Fourier transform back to the spectral domain [27]. To recover the depth profile, the spectrum is linearly interpolated and Fourier transformed into the z-space [28]. In brief, the SD-OCT signal is collected, denoised, and then, transferred to the time domain.
Similar to the SD-OCT image post-processing, we added the FFT and the inverse FFT (IFFT) in the generator, using transposed convolution to enlarge the pictures and add details. Figure 3 shows the workflow. The loss function of the generator G is:
where N stands for a normal distribution.
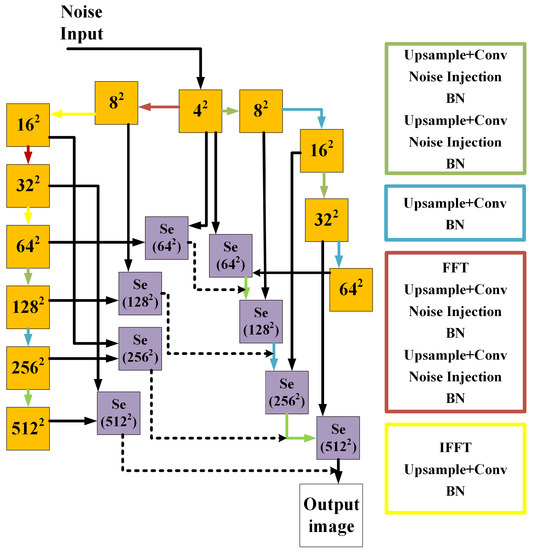
Figure 3.
The structure of the generator. The solid orange boxes represent the feature maps with the spatial size. The blue box and arrows indicate the structure of up-sampling. The green box and arrows depict the similar up-sampling process with additional noise. The red box and arrows indicate the structure containing FFT. The yellow box and arrows represent the structure that contains the IFFT. The solid purple boxes represent the SeBlock, which has the same structure as in the discriminator, only adjusting some parameters. The dotted line represents adding two images with different weights.
2.4. Dataset
We used OCT images from the Kermany dataset [2]. It is a comprehensive dataset including 51,140 normal, 11,349 diabetic macular edema (DME), and 8617 drusen OCT images (Spectralis OCT, Heidelberg Engineering, Germany). There were no age-, gender-, or race-based exclusion criteria. From this dataset, we randomly selected 2800 normal, 2800 DME, and 2800 drusen images with a 512 × 512 resolution to separately train our model. Randomly flipping in the horizontal direction was used to enhance the data and make the model work better.
The model was trained in Pytorch (Ubuntu 16.04 system, Intel Core i7-2700K 4.6 GHz CPU, 64 Gb RAM, 512Gb PCIe flash storage, and a single NVIDIA RTX 2080Ti 11Gb GPU). We used the Adam optimizer both in the discriminator and the generator with a learning rate of and a batch size of 4.
2.5. Metrics
Different approaches have been proposed for assessing synthetic images. Besides discussing the visual quality of the synthetic images with a focus on diversity, realism, sharpness, and artifacts, we also tried to use a VGG16 classifier [29] to distinguish the type of the generated images. We deleted the final classification layer and further retained the VGG16 classifier. Accuracy is used to describe how the images perform in deep learning classification. It is calculated by dividing the total number of predictions by the number of correct statements.
where TP, TN, FN, and FP represent the true positives, true negatives, false negatives, and false positives, respectively.
The Fréchet inception distance (FID) [30] compares the distribution of synthetic images to the distribution of genuine pictures. We calculated the FID between synthetic images and the training dataset. We also computed a normalized color histogram and compared it to the normalized color histogram of the training dataset in terms of the Jensen–Shannon divergence (JS-divergence) [31].
3. Results
3.1. Image Synthesis and Evaluation
We trained our model FOF-GAN on a single RTX 2080Ti. With the current data size, training 50,000 epochs took approximately 5 h. As shown in the first column of Figure 4, the fake images from the baseline are of insufficient quality. These images looked jagged and abnormally twisted with inconsistent clarity and brightness. In comparison, our approach could generate high-fidelity retinal OCT images. Our composite images had proper brightness, making it easy to clearly distinguish all the major retinal layers (Figure 5). The ability of our model to create images of retinal diseases was also proven. Sub- and intra-retinal fluid buildup are the primary identifying characteristics of DME eyes. Drusen bodies can be identified by their mound-like appearance and distinct edges. These medical characteristics of DME and drusen are depicted in our generated images.
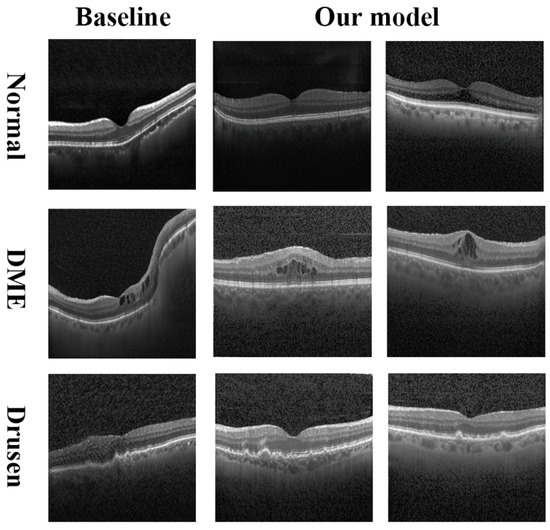
Figure 4.
Synthetic images of normal (first row), DME (second row), and drusen (third row) from the baseline (first column) and our model (second and third columns).
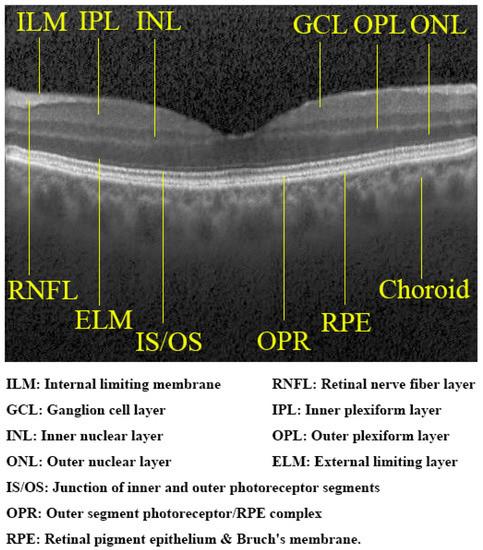
Figure 5.
Retinal layers in a synthetic normal OCT image generated by our model. These layers are clearly distinguished and comparable with genuine images.
We used VGG16 to further assess whether the synthetic OCT images could be correctly identified. Before evaluating our synthetic images, we trained this classifier on the original dataset for 100 epochs. The classification accuracies of normal, DME, and drusen in the original dataset are shown in the first row of Table 1. As the accuracy reached around 99% in the original dataset, the classifier was accurate enough to evaluate if the synthetic images were realistic enough to cheat. The classification accuracies of the baseline and our model are shown in the second and third lines of Table 1. Our model achieved better accuracy than the baseline for normal, DME, and drusen, with normal increasing by 2.26%, DME by 2.81%, and drusen by 2.34%. Table 1 demonstrates that our synthetic OCT images could effectively cheat artificial intelligence.

Table 1.
Classification accuracy of normal, DME, and drusen using VGG16.
We then selected 200 random pictures from normal, DME, and drusen, respectively, and mixed them. The FID of the original dataset, the baseline, and our model was 29.45, 205.15, and 59.55, respectively. Our FID was significantly lower than the baseline, indicating the overall semantic realism of the synthetic images.
A normalized color histogram comparison is shown in Figure 6. The histogram distribution of the images generated by our model is much closer to the original dataset than the baseline. The baseline’s calculated JS-divergence is 0.0638, while our model’s is 0.0186, which is 70% lower.
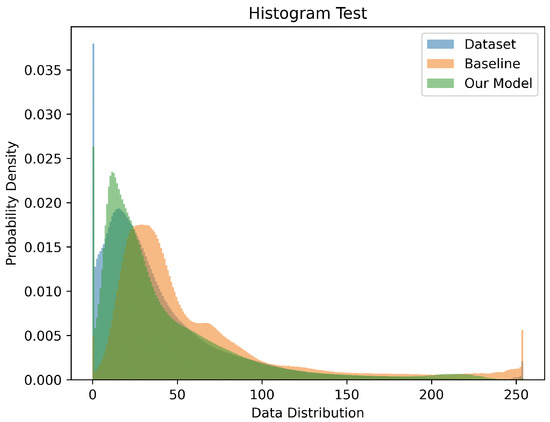
Figure 6.
The normalized color histograms of the original dataset (blue), baseline (orange), and our model (green). Our histogram distribution is closer to the original dataset than the baseline.
We also invited two retinal specialists to evaluate the synthetic images. We randomly selected 50 real images and 50 fake images (both including 20 normal, 15 DME, and 15 drusen) and mixed them. With a precision of 60.4% (95% CI, 57.8–62.9%) for Retinal Specialist 1 and 59.6% (95% CI, 55.4–63.8%) for Retinal Specialist 2, the two human specialists were only partially able to distinguish the real and fake images.
3.2. Ablation Experiments
To verify the efficacy of our discriminator and generator, we designed a three-step ablation experiment: (I) only adding FAB to the discriminator; (II) only adding the FFT to the generator; (III) our integrated model. The ablation experiments were only performed in normal eyes to prevent the impact of lesions.
Figure 7 provides the ablation experiment results. Synthetic images in Experiment I had some artifacts that could not be eliminated. The details of these images in Experiment I were deficient. For example, the RPE layer was a bit blurry and some layers were too rough. Compared to Experiment I, the results from Experiment II are better. The synthetic images in Experiment II were brighter, sharper, and more realistic than those in Experiment I. The retinal layers were more easily accessible. However, Experiment II reflected obvious mode collapse, with an increase in the FID, as shown in Table 2. The accuracy tested by the VGG16 classifier is also mentioned. In this ablation experiment, we demonstrated the ability of our model to alleviate the artifacts and noise in the background. Images generated by our model combined the advantages of Experiment I and Experiment II with a lower FID and better shape. The retinal layers can be distinguished more clearly in Experiment III.
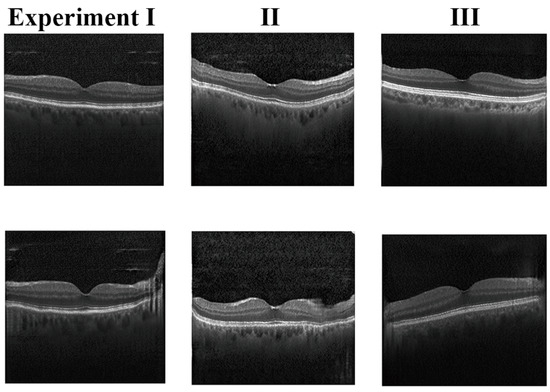
Figure 7.
The three-step ablation experiment results. The images in the first column have some artifacts that could not be eliminated. The details in these images are deficient. The synthetic images in the second column are brighter and sharper, but reflect obvious mode collapse, with an increase in the FID. The images of Experiment III are better than Experiments I and II.

Table 2.
FID and accuracy of the three-step ablation experiments. Experiment I: only adding FAB to the discriminator; Experiment II: only adding the FFT and IFFT to the generator; Experiment III: our integrated model.
3.3. Image Synthesis with Few Shots
To further test our model’s performance in the few-shot learning, we randomly selected 100 normal images from the original dataset and synthesized new images. The training procedure and hyperparameters were the same as above. The generated results are shown in Figure 8 (accuracy: 98.9%, FID: 51.22).

Figure 8.
Few-shot learning results with only 100 normal images used as the training data. Although the sample data size for training is substantially reduced, our model is still able to generate clear and realistic retinal images.
Figure 8 shows our network still works well using only 100 randomly selected pictures for training. Obviously, since the larger sample of the original dataset contained more OCT morphology, both the accuracy and the FID were actually a bit worse than when synthesizing with 2800 pictures, but still acceptable. This experiment demonstrated our network remained robust with a small dataset. For medical images that require more details, we still recommend using a larger dataset where sufficient data are available.
4. Discussion
In this study, we evaluated our baseline and proposed FOF-GAN for generating OCT images. Our model inherits the benefits of the baseline, such as limited computing resources and little mode collapse. To improve the synthesis quality of the OCT images, we employed FAB in the discriminator and incorporated the FFT processes into the generator. The results suggested that synthetic OCT images generated by FOF-GAN had better quality than our baseline. The high fidelity of our synthetic B-scans could also be validated by a VGG16 classifier.
In the feature extraction operation of our discriminator, the Fourier channel attention mechanism in FAB is used to adaptively rescale the feature channels according to their frequency contents [26]. For each feature map, the global pooling operation actually combines the contributions of all frequency components from the spectrum. It enables the networks to learn how to represent high-frequency information in a hierarchical way by using the whole power spectrum of different feature maps. The frequency difference between distinct features can be used to learn exact hierarchical representations of the retinal structural information. According to the ablation experiment results of Figure 7, FAB aids in the removal of background noise and the compensation for missing shape, leading to a significant decrease in FID.
In SD-OCT, image reconstruction is dependent on the FFT of the interference fringes measured by the spectrometer. Then, the data are transformed from the wavenumber to the axial depth domain [28]. Using linear or cubic spline interpolation, a shoulder may degrade the B-scan quality when reflections occur closely in biological tissues. Applying zero padding to the interference spectrum is a typical approach to eliminate this shoulder [32]. In our generator, the first FFT transformed the noise input to a spectral domain signal like the spectrometer data. This strategy introduced additional learnable information to the network. To simulate the post-processing of SD-OCT, we used the FFT and IFFT in the up-sampling structure after noise input. The up-sampling process may be considered somewhat similar to the linear interpolation and the zero filling technique in SD-OCT post-processing to upgrade the image quality. This approach ensured that our synthetic images contained both primary and detailed structures. The increase of the parameters in the generator also enabled our model to synthesize images with better visual fidelity. According to the ablation experiment results of Figure 7, the FFT and IFFT in the generator helped to eliminate invalid noise-like layers and enhance the effective layers.
The computational and time cost of GAN always remain huge for OCT image synthesis. Zheng et al. used more than 40 h to generate 256 × 256 images with PGGAN [23]. Sun et al. synthesized 202 × 202 PS-OCT images with the aid of OCT intensity for 16 h on a Nvidia GTX TITAN [21]. Cheong et al. proposed OCT-GAN to remove shadow and noise from OCT images, and the total training lasted 4 days on five Nvidia GTX 1080Ti cards [33]. Compared with previous studies, our model had fast and robust performance in generating 512 × 512 OCT images for only 5 h with 50,000 epochs. Conventional GANs had difficulty generating high-fidelity OCT images in a short time. The redesigns of the generator and the discriminator were supposed to be the most essential properties for producing high-quality OCT images. Even with fewer samples and a limited computational resource, no mode collapse [34] occurred in our model during the training process, which retained the diversity of the synthetic images.
Our work still has limitations. Firstly, we only focused on normal/DME/drusen image synthesis. The classification accuracies of DME and drusen was still lower than normal in the synthetic images, probably because some generated pathological characteristics were not enough to distinguish. We need to optimize the model for other retinal disorders and improve the diagnostic accuracy. Secondly, although our model generated OCT images with a 512 × 512 resolution, for 2D high-resolution medical images with multiple layers, higher resolutions are still needed. Our next step will focus on further improving the resolution of the synthetic images under restricted conditions.
5. Conclusions
In this study, we suggested a novel fast model FOF-GAN for the challenge of producing high-fidelity OCT images in only a few hours with a constrained computing resource. The proposed model worked effectively in both normal and retinopathy conditions such as DME and drusen. Our synthetic OCT images showed clear retinal layers and pathological features. The generated images also provided better quantitative evaluations. Our model has potential for medical image generation with other complex structures. With the short training time, low resource cost, and reliability in a few shots, we hope FOF-GAN can benefit the downstream tasks of GAN for high-fidelity medical image augmentation.
Author Contributions
Conceptualization, N.G. and M.J.; methodology, N.G. and X.X.; software, N.G.; validation, N.G. and Y.L.; original draft preparation, N.G.; review, editing, and funding acquisition, M.J. and X.Z. All authors have read the manuscript and agreed to the publication.
Funding
This research was funded by the National Natural Science Foundation of China (61905144).
Institutional Review Board Statement
Not applicable.
Informed Consent Statement
Not applicable.
Data Availability Statement
Acknowledgments
This work was also supported by the National Key Research and Development Program of China (2016YFF0101400) and the National Natural Science Foundation of China (51675321).
Conflicts of Interest
The authors declare no conflict of interest.
References
- Shamsolmoali, P.; Zareapoor, M.; Granger, E.; Zhou, H.; Wang, R.; Celebi, M.E.; Yang, J. Image synthesis with adversarial networks: A comprehensive survey and case studies. Inform. Fusion 2021, 72, 126–146. [Google Scholar] [CrossRef]
- Kermany, D.S.; Goldbaum, M.; Cai, W.; Valentim, C.C.; Liang, H.; Baxter, S.L.; McKeown, A.; Yang, G.; Wu, X.; Yan, F.; et al. Identifying medical diagnoses and treatable diseases by image-based deep learning. Cell 2018, 172, 1122–1131. [Google Scholar] [CrossRef] [PubMed]
- McCallister, E. Guide to Protecting the Confidentiality of Personally Identifiable Information; National Institute of Standards & Technology: Gaithersburg, MD, USA, 2010; Volume 800.
- Barrows, R.C., Jr.; Clayton, P.D. Privacy, confidentiality, and electronic medical records. J. Am. Med. Inform. Assoc. 1996, 3, 139–148. [Google Scholar] [CrossRef] [PubMed]
- Wang, K.; Gou, C.; Duan, Y.; Lin, Y.; Zheng, X.; Wang, F.Y. Generative adversarial networks: Introduction and outlook. IEEE/CAA J. Autom. Sin. 2017, 4, 588–598. [Google Scholar] [CrossRef]
- Creswell, A.; White, T.; Dumoulin, V.; Arulkumaran, K.; Sengupta, B.; Bharath, A.A. Generative adversarial networks: An overview. IEEE Signal Process. Mag. 2018, 35, 53–65. [Google Scholar] [CrossRef]
- Goodfellow, I.; Pouget-Abadie, J.; Mirza, M.; Xu, B.; Warde-Farley, D.; Ozair, S.; Courville, A.; Bengio, Y. Generative adversarial networks. Commun. ACM 2020, 63, 139–144. [Google Scholar] [CrossRef]
- Mirza, M.; Osindero, S. Conditional generative adversarial nets. arXiv 2014, arXiv:1411.1784. [Google Scholar]
- Jeong, J.J.; Tariq, A.; Adejumo, T.; Trivedi, H.; Gichoya, J.W.; Banerjee, I. Systematic review of generative adversarial networks (GANs) for medical image classification and segmentation. J. Digit. Imaging 2022, 35, 1–16. [Google Scholar] [CrossRef]
- Hervella, Á.S.; Rouco, J.; Novo, J.; Ortega, M. Retinal image understanding emerges from self-supervised multimodal reconstruction. In Proceedings of the International Conference on Medical Image Computing and Computer-Assisted Intervention, Granada, Spain, 16–20 September 2018; Springer: Cham, Switzerland, 2018; pp. 321–328. [Google Scholar]
- Costa, P.; Galdran, A.; Meyer, M.I.; Niemeijer, M.; Abràmoff, M.; Mendonça, A.M.; Campilho, A. End-to-end adversarial retinal image synthesis. IEEE Trans. Med. Imaging 2017, 37, 781–791. [Google Scholar] [CrossRef]
- Yu, Z.; Xiang, Q.; Meng, J.; Kou, C.; Ren, Q.; Lu, Y. Retinal image synthesis from multiple-landmarks input with generative adversarial networks. Biomed. Eng. Online 2019, 18, 1–15. [Google Scholar] [CrossRef]
- Kamran, S.A.; Hossain, K.F.; Tavakkoli, A.; Zuckerbrod, S.L. Attention2angiogan: Synthesizing fluorescein angiography from retinal fundus images using generative adversarial networks. In Proceedings of the 2020 25th International Conference on Pattern Recognition (ICPR), Milan, Italy, 10–15 January 2021; IEEE: Piscataway Township, NJ, USA, 2021; pp. 9122–9129. [Google Scholar]
- Kamran, S.A.; Hossain, K.F.; Tavakkoli, A.; Zuckerbrod, S.L.; Baker, S.A. Vtgan: Semi-supervised retinal image synthesis and disease prediction using vision transformers. In Proceedings of the IEEE/CVF International Conference on Computer Vision, Montreal, BC, Canada, 11–17 October 2021; pp. 3235–3245. [Google Scholar]
- Petzold, A.; de Boer, J.F.; Schippling, S.; Vermersch, P.; Kardon, R.; Green, A.; Calabresi, P.A.; Polman, C. Optical coherence tomography in multiple sclerosis: A systematic review and meta-analysis. Lancet Neurol. 2010, 9, 921–932. [Google Scholar] [CrossRef] [PubMed]
- Schmitt, J.M. Optical coherence tomography (OCT): A review. IEEE J. Sel. Top. Quantum Electron. 1999, 5, 1205–1215. [Google Scholar] [CrossRef]
- Povazay, B.; Hermann, B.M.; Unterhuber, A.; Hofer, B.; Sattmann, H.; Zeiler, F.; Morgan, J.E.; Falkner-Radler, C.; Glittenberg, C.; Binder, S.; et al. Three-dimensional optical coherence tomography at 1050 nm versus 800 nm in retinal pathologies: Enhanced performance and choroidal penetration in cataract patients. J. Biomed. Opt. 2007, 12, 041211. [Google Scholar] [CrossRef] [PubMed][Green Version]
- Schmidt-Erfurth, U.; Leitgeb, R.A.; Michels, S.; Povazay, B.; Sacu, S.; Hermann, B.; Ahlers, C.; Sattmann, H.; Scholda, C.; Fercher, A.F.; et al. Three-dimensional ultrahigh-resolution optical coherence tomography of macular diseases. Investig. Ophthalmol. Vis. Sci. 2005, 46, 3393–3402. [Google Scholar] [CrossRef][Green Version]
- Kande, N.A.; Dakhane, R.; Dukkipati, A.; Yalavarthy, P.K. SiameseGAN: A generative model for denoising of spectral domain optical coherence tomography images. IEEE Trans. Med. Imaging 2020, 40, 180–192. [Google Scholar] [CrossRef]
- Chen, Z.; Zeng, Z.; Shen, H.; Zheng, X.; Dai, P.; Ouyang, P. DN-GAN: Denoising generative adversarial networks for speckle noise reduction in optical coherence tomography images. Biomed. Signal Process. Control 2020, 55, 101632. [Google Scholar] [CrossRef]
- Sun, Y.; Wang, J.; Shi, J.; Boppart, S.A. Synthetic polarization-sensitive optical coherence tomography by deep learning. NPJ Digit. Med. 2021, 4, 1–7. [Google Scholar] [CrossRef]
- Zha, X.; Shi, F.; Ma, Y.; Zhu, W.; Chen, X. Generation of retinal OCT images with diseases based on cGAN. In Proceedings of the Medical Imaging 2019: Image Processing, SPIE, San Diego, CA, USA, 19–21 February 2019; Volume 10949, pp. 544–549. [Google Scholar]
- Zheng, C.; Xie, X.; Zhou, K.; Chen, B.; Chen, J.; Ye, H.; Li, W.; Qiao, T.; Gao, S.; Yang, J.; et al. Assessment of generative adversarial networks model for synthetic optical coherence tomography images of retinal disorders. Transl. Vis. Sci. Technol. 2020, 9, 29. [Google Scholar] [CrossRef]
- Liu, B.; Zhu, Y.; Song, K.; Elgammal, A. Towards faster and stabilized gan training for high-fidelity few-shot image synthesis. In Proceedings of the International Conference on Learning Representations, Vienna, Austria, 4 May 2021. [Google Scholar]
- Lichtenegger, A.; Salas, M.; Sing, A.; Duelk, M.; Licandro, R.; Gesperger, J.; Baumann, B.; Drexler, W.; Leitgeb, R.A. Reconstruction of visible light optical coherence tomography images retrieved from discontinuous spectral data using a conditional generative adversarial network. Biomed. Opt. Express 2021, 12, 6780–6795. [Google Scholar] [CrossRef]
- Qiao, C.; Li, D.; Guo, Y.; Liu, C.; Jiang, T.; Dai, Q.; Li, D. Evaluation and development of deep neural networks for image super-resolution in optical microscopy. Nat. Methods 2021, 18, 194–202. [Google Scholar] [CrossRef]
- Drexler, W.; Fujimoto, J.G. Optical Coherence Tomography: Technology and Applications; Springer: Berlin/Heidelberg, Germany, 2015; Volume 2. [Google Scholar]
- Nassif, N.; Cense, B.; Park, B.; Pierce, M.; Yun, S.; Bouma, B.; Tearney, G.; Chen, T.; De Boer, J. In vivo high-resolution video-rate spectral-domain optical coherence tomography of the human retina and optic nerve. Opt. Express 2004, 12, 367–376. [Google Scholar] [CrossRef] [PubMed]
- Simonyan, K.; Zisserman, A. Very deep convolutional networks for large-scale image recognition. arXiv 2014, arXiv:1409.1556. [Google Scholar]
- Heusel, M.; Ramsauer, H.; Unterthiner, T.; Nessler, B.; Hochreiter, S. Gans trained by a two time-scale update rule converge to a local nash equilibrium. Adv. Neural Inf. Process. Syst. 2017, 30, 1–12. [Google Scholar]
- Baur, C.; Albarqouni, S.; Navab, N. MelanoGANs: High resolution skin lesion synthesis with GANs. arXiv 2018, arXiv:1804.04338. [Google Scholar]
- Chan, K.K.; Tang, S. High-speed spectral domain optical coherence tomography using non-uniform fast Fourier transform. Biomed. Opt. Express 2010, 1, 1309–1319. [Google Scholar] [CrossRef]
- Cheong, H.; Devalla, S.K.; Chuangsuwanich, T.; Tun, T.A.; Wang, X.; Aung, T.; Schmetterer, L.; Buist, M.L.; Boote, C.; Thiéry, A.H.; et al. OCT-GAN: Single step shadow and noise removal from optical coherence tomography images of the human optic nerve head. Biomed. Opt. Express 2021, 12, 1482–1498. [Google Scholar] [CrossRef]
- Arjovsky, M.; Bottou, L. Towards principled methods for training generative adversarial networks. arXiv 2017, arXiv:1701.04862. [Google Scholar]
Publisher’s Note: MDPI stays neutral with regard to jurisdictional claims in published maps and institutional affiliations. |
© 2022 by the authors. Licensee MDPI, Basel, Switzerland. This article is an open access article distributed under the terms and conditions of the Creative Commons Attribution (CC BY) license (https://creativecommons.org/licenses/by/4.0/).
