Optical Design for Aberration Correction of Ultra-Wide Spectral Range Echelle Spectrometer

Abstract
:1. Introduction
- (1)
- Spherical aberration: the field of view of the echelle spectrometer is generally small, and the influence of spherical aberrations can be reduced through optical design. There are two common solutions: first, according to the Rayleigh criterion, if the system F-number is defined as and the relationship between the system focal length and the F-number satisfies , the spherical aberration has little influence [14]; second is the use of off-axis parabolic mirrors, which can focus collimated light without introducing spherical aberrations [15] at the expense of a worse coma for off-axis beams.
- (2)
- Coma: the most common method for eliminating coma in C–T spectrometers is the combination of collimating and focusing mirrors with the same curvature radius and opposite off-axis angles proposed by inventors Czerny and Turner. Later, the asymmetric structure was developed, which can also eliminate the coma of a specific wavelength when certain conditions are met [16]. However, these methods are limited to a single wavelength and the problem can only be partially offset in the rest of the wavelength range by the collimating and focusing mirrors with the opposite sign of the coma.
- (3)
- Astigmatism: to eliminate the astigmatism of the C–T grating spectrometer, it is necessary to add additional elements such as a lens [17], e.g., an aspherical or free-form cylindrical lens [18], and toroidal mirrors [19]. In addition, Wood and Lawler devised a method of rotating auxiliary dispersive elements [20]. However, the aforementioned methods impose high demands on optical processing and assembly, resulting in high costs and long cycles, which are not conducive to product industrialization.
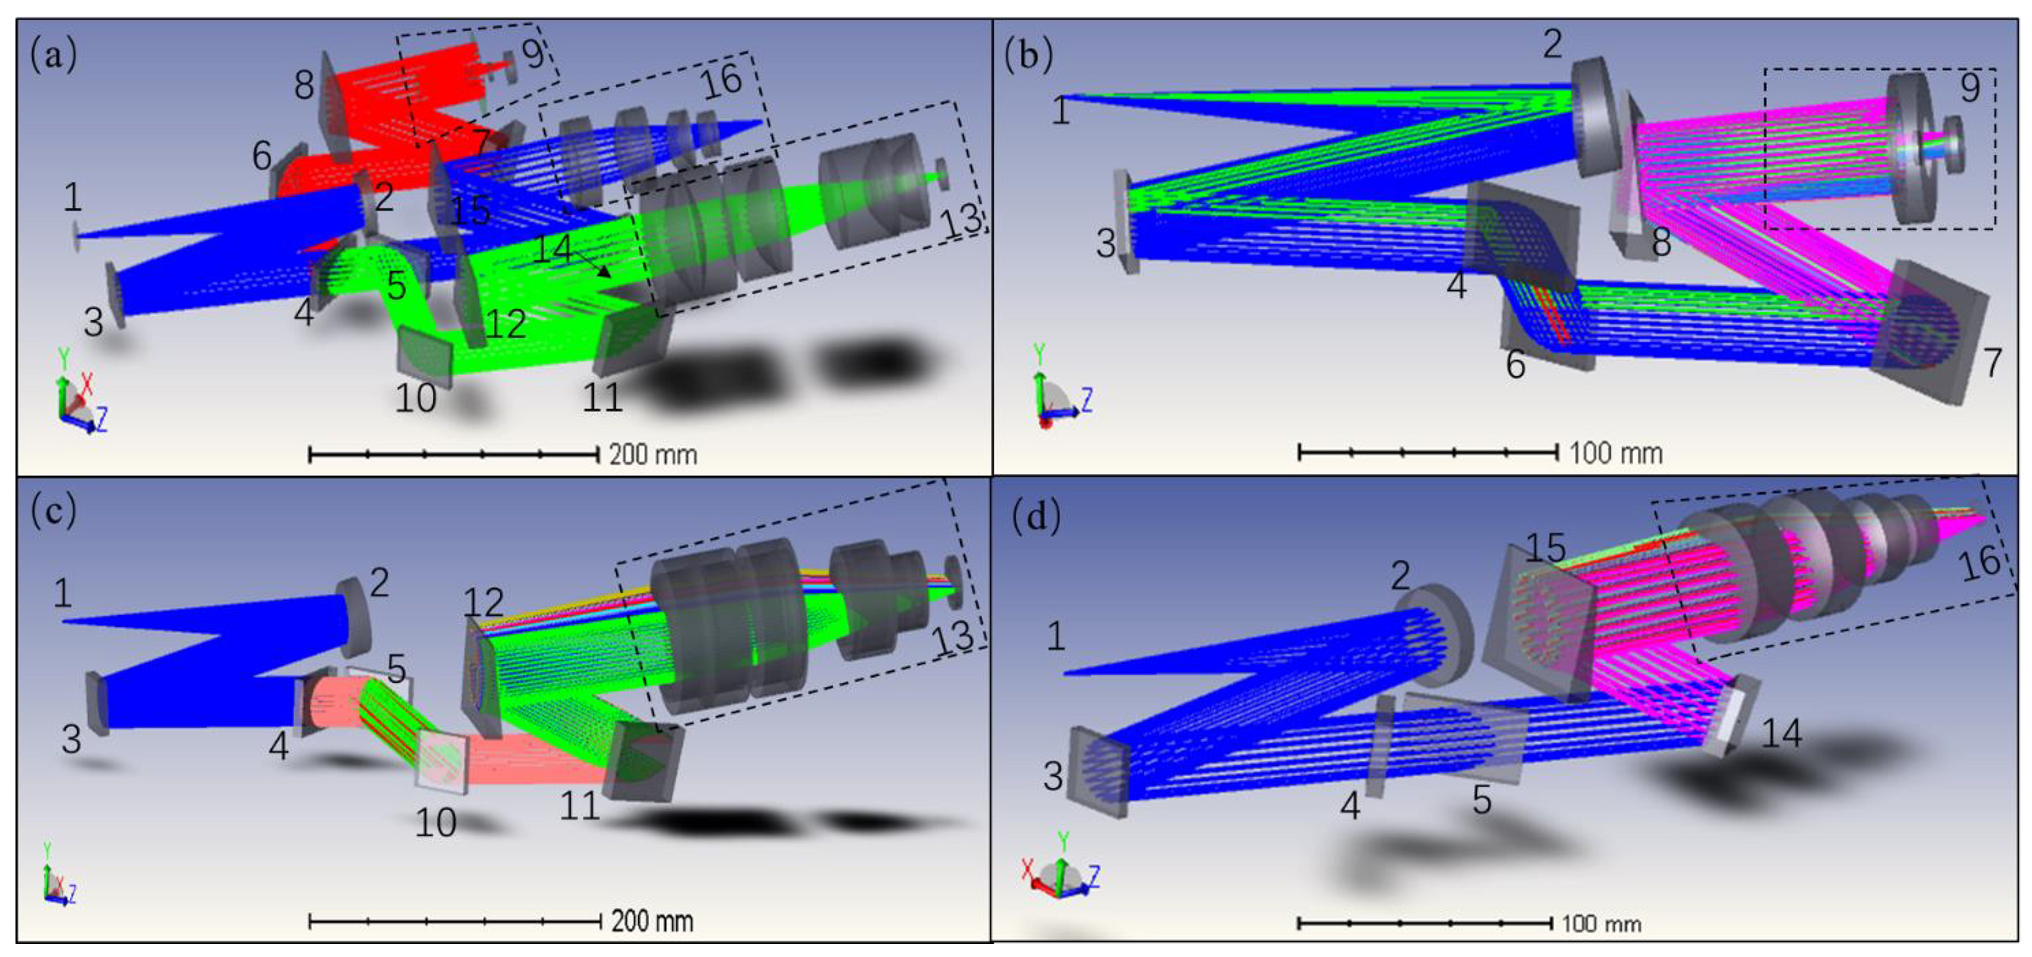
2. Optical Layout of the Echelle Spectrometer
3. Theory and Design Method
3.1. Collimating Mirror
3.2. Detector
3.3. Echelle Grating
3.3.1. Principles of Design or Selection
3.3.2. Matching of Echelle Gratings and Detectors
3.3.3. Comparison of Dispersion Capability of Different Echelle Gratings
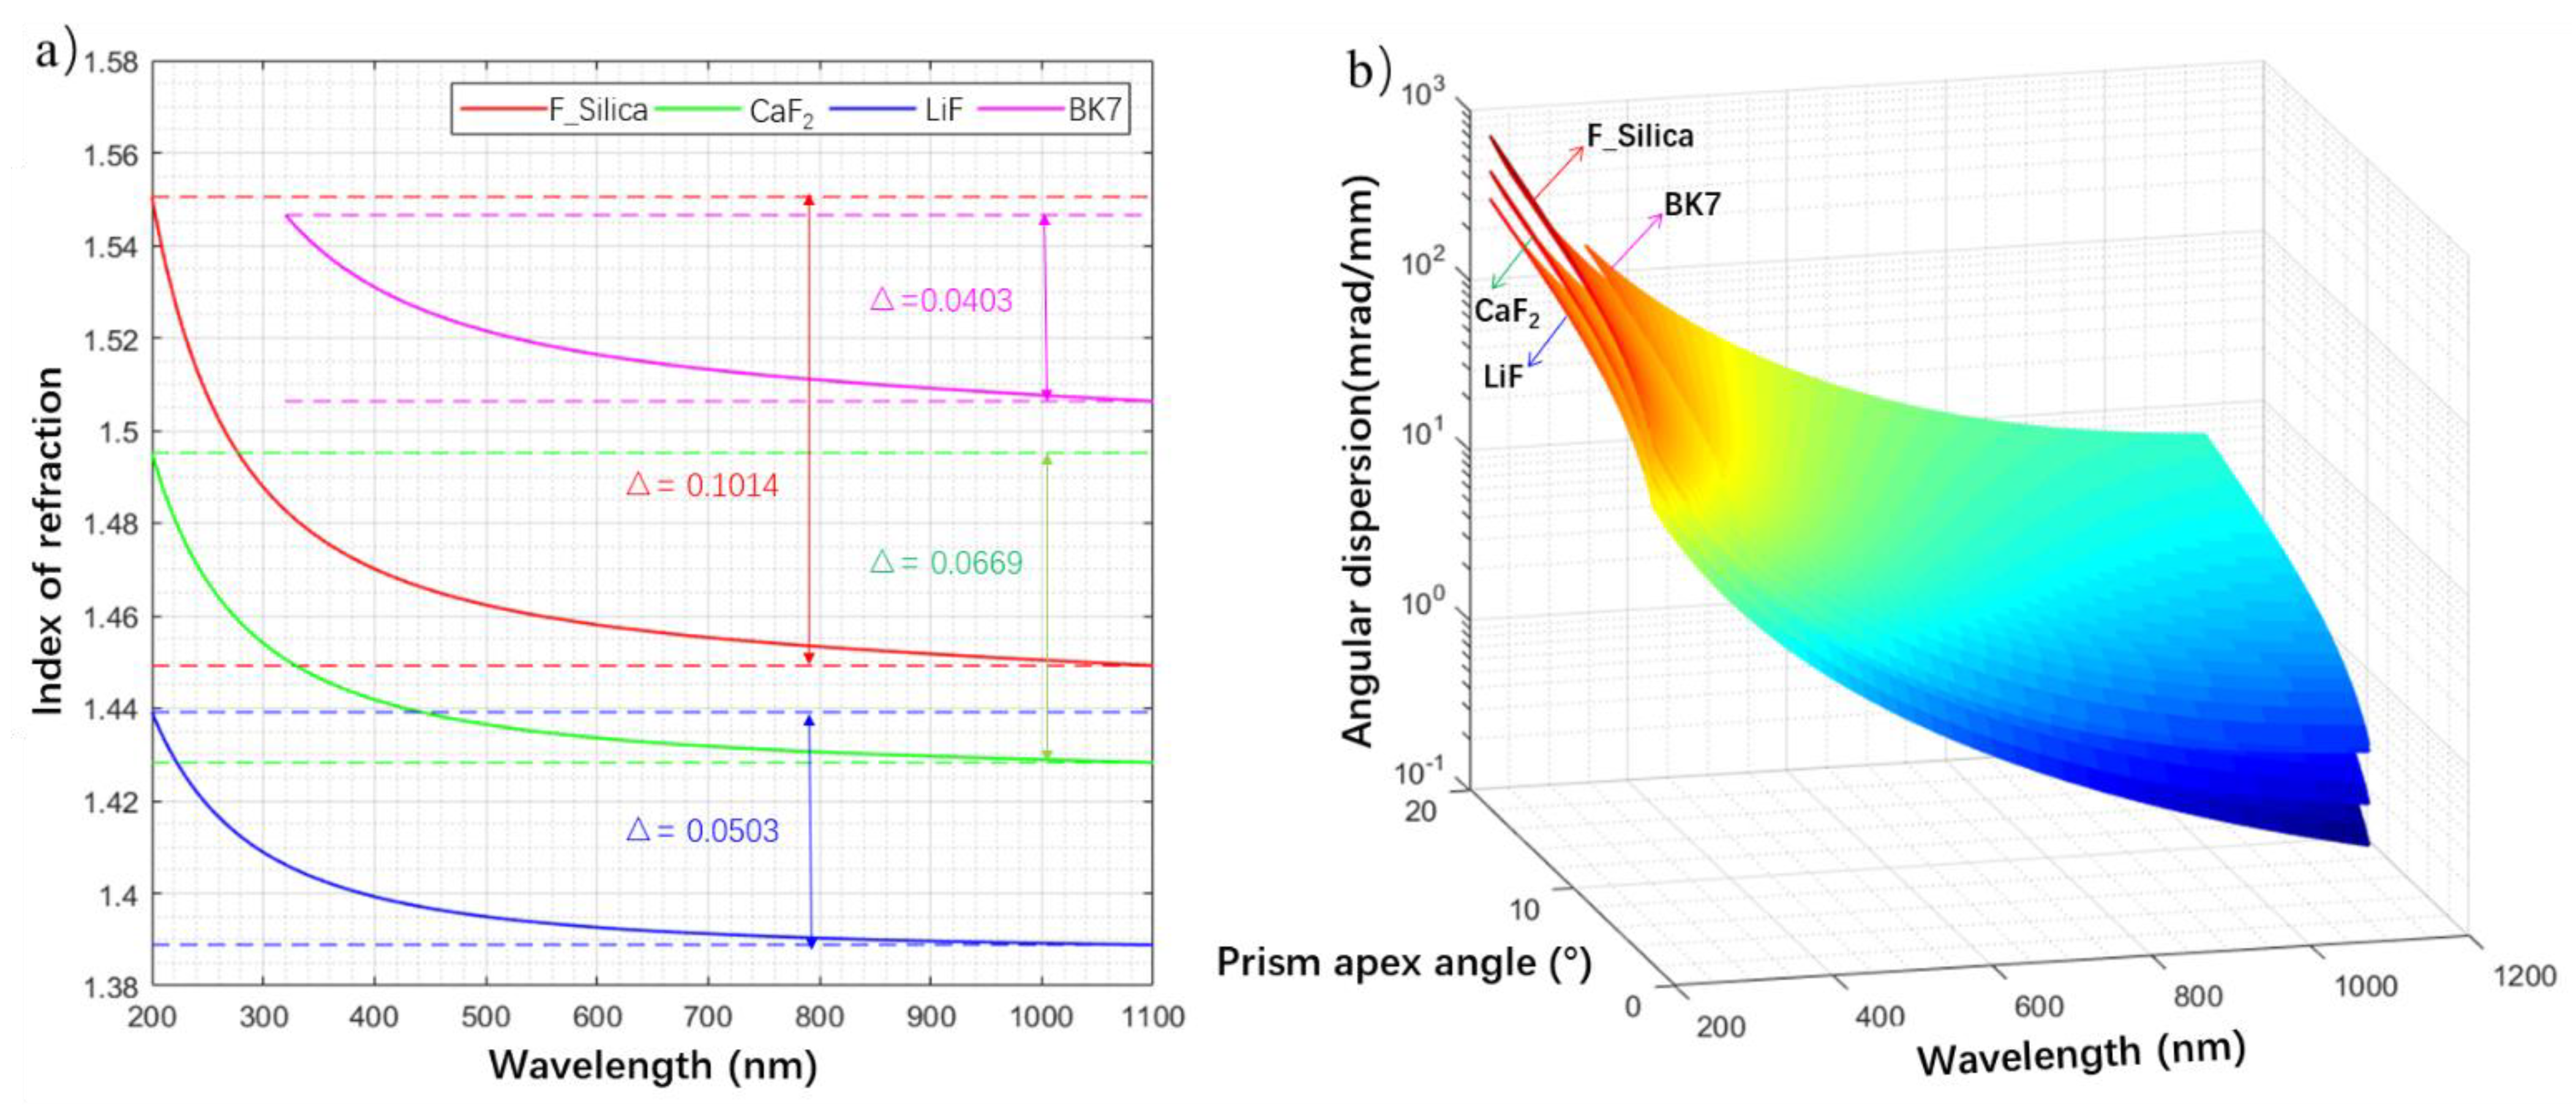
3.4. Dispersive Prism
3.5. Focusing Lens
3.5.1. Determination of Focal Length
3.5.2. Determination of Field of View
3.5.3. Determination of Aperture Size
4. Results and Discussion
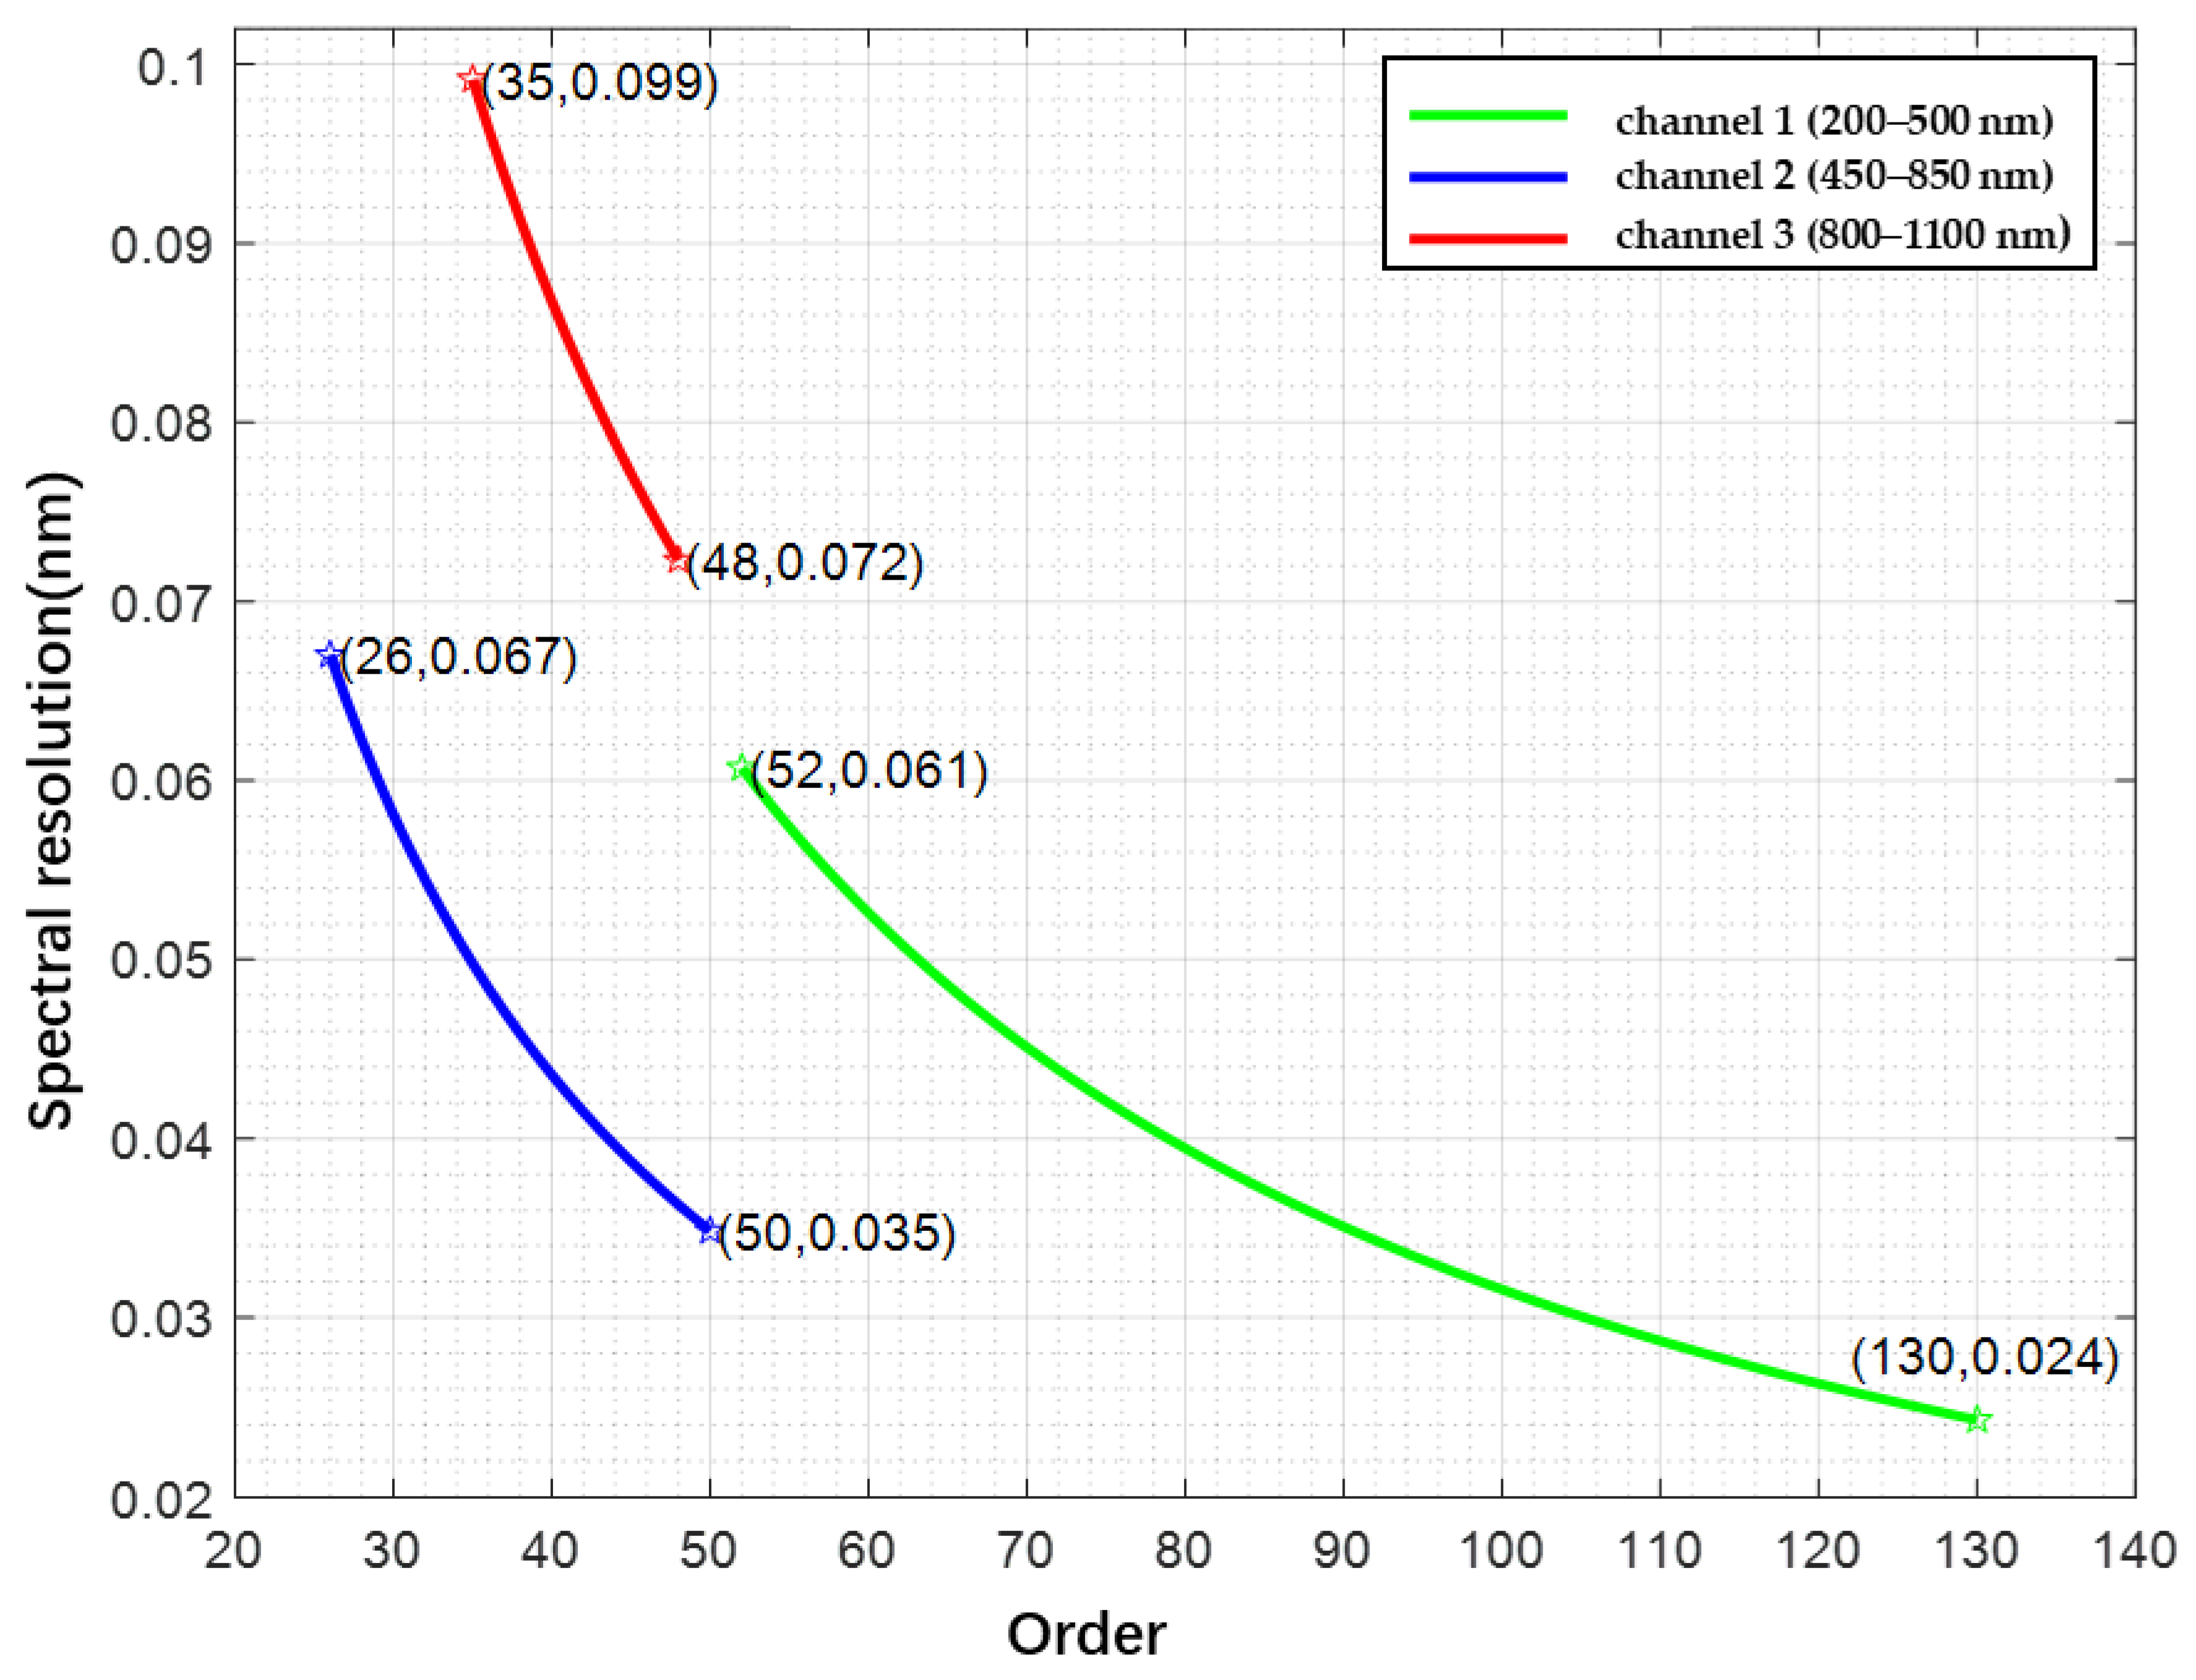
4.1. Verification of Spectral Resolution
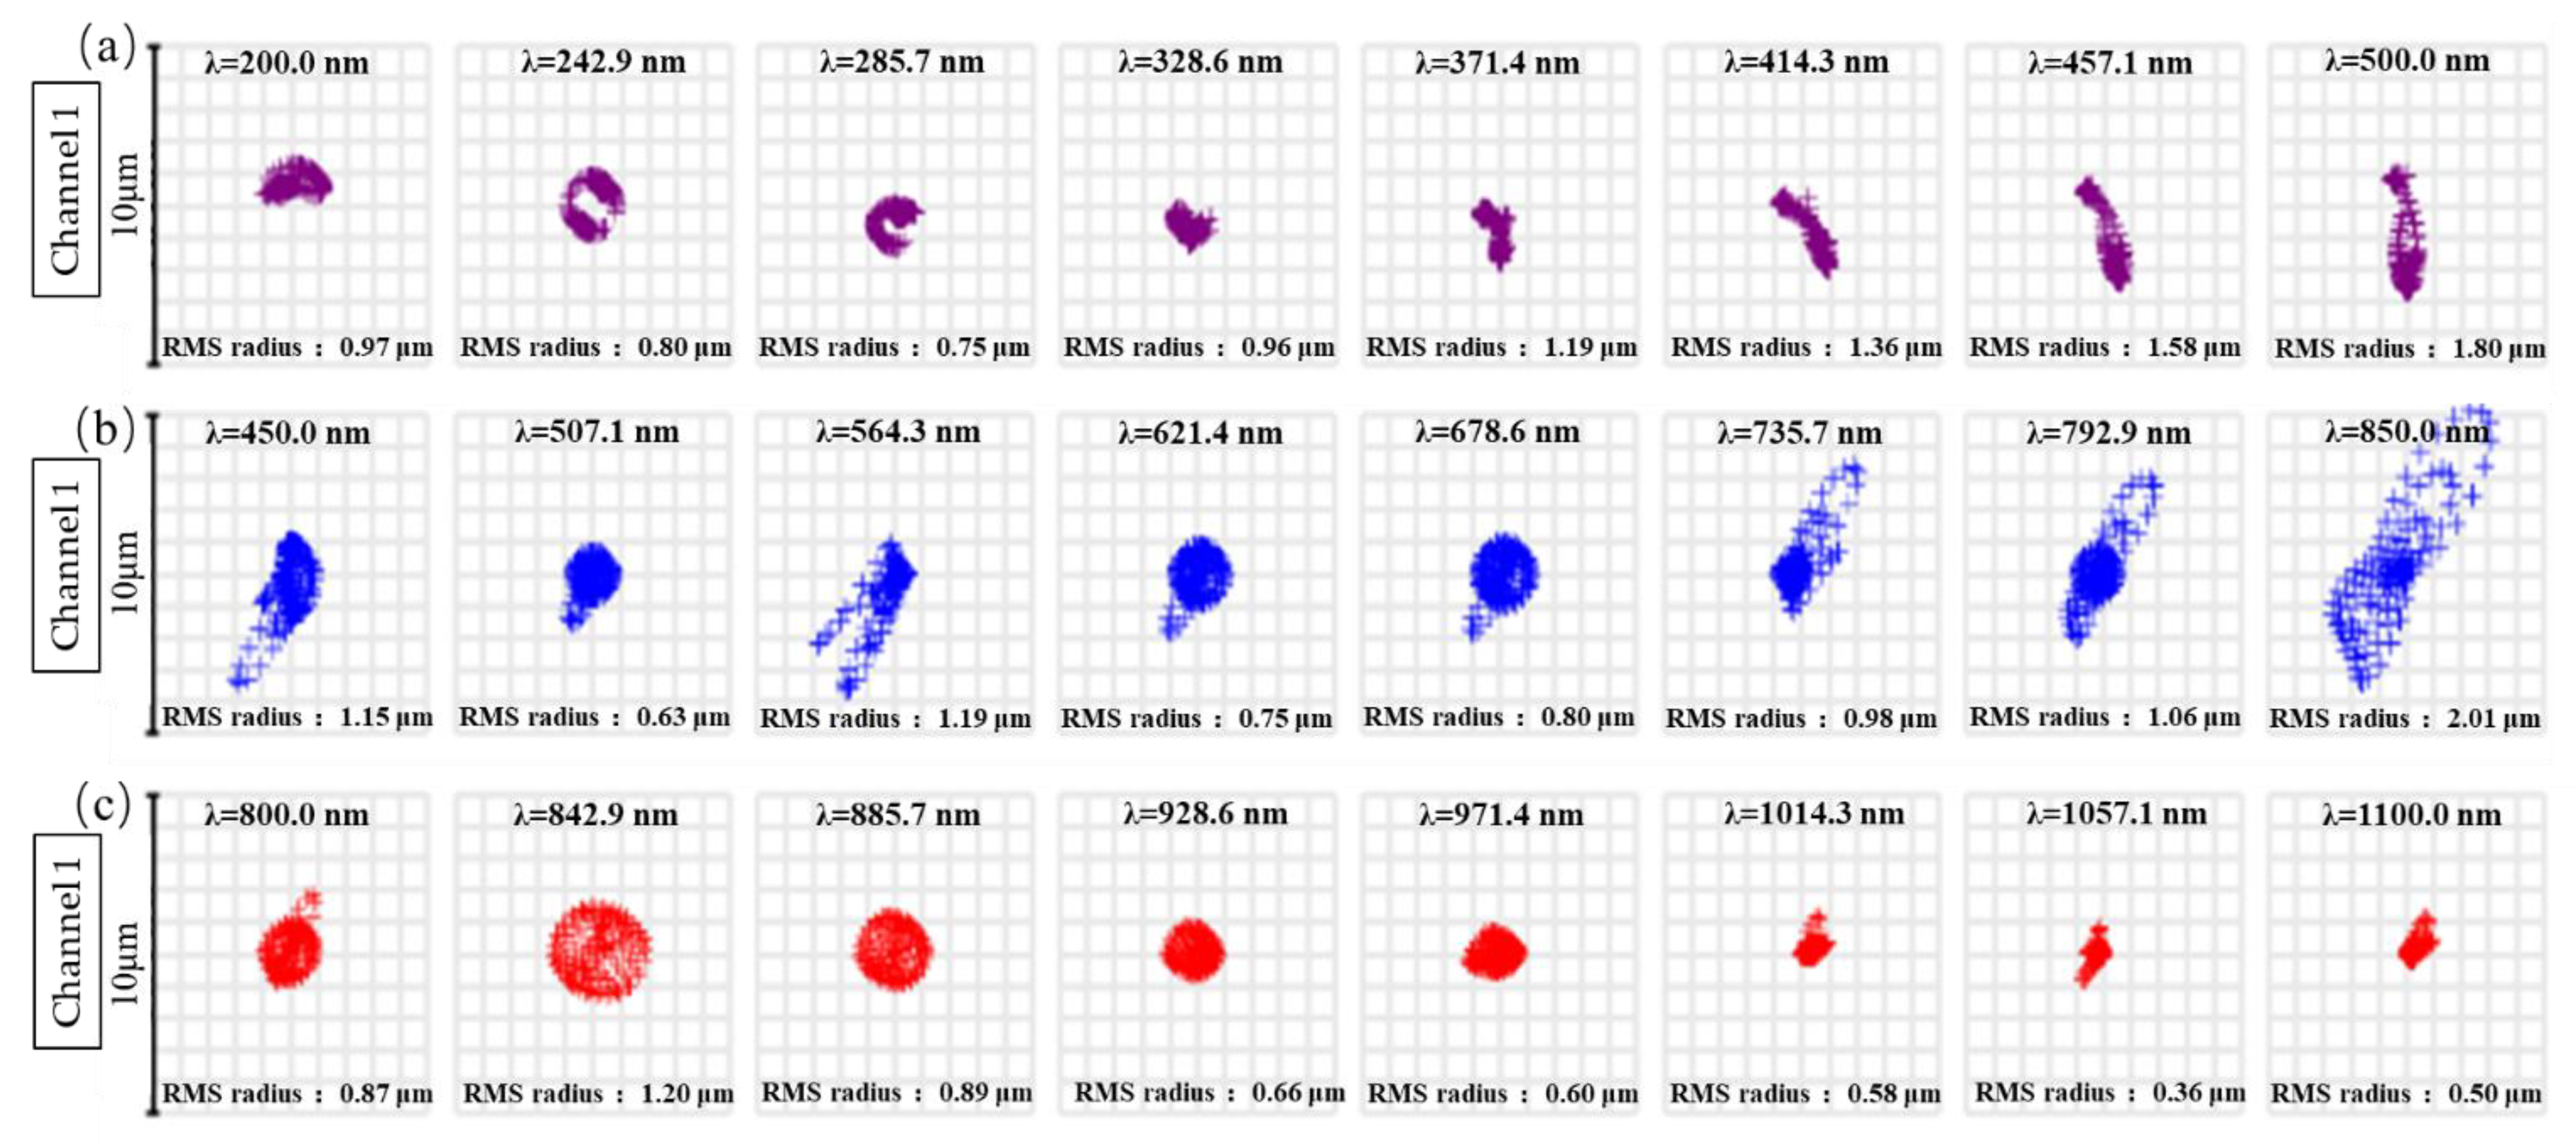
4.2. Evaluation of Image Quality and Spectral Resolution
5. Conclusions
Author Contributions
Funding
Data Availability Statement
Acknowledgments
Conflicts of Interest
References
- Henry, M. Spectral Analysis Techniques Using Prism Signal Processing. Measurement 2021, 169, 108491. [Google Scholar] [CrossRef]
- Ratheesh, K.M.; Seah, L.K.; Murukeshan, V.M. Spectral Phase-Based Automatic Calibration Scheme for Swept Source-Based Optical Coherence Tomography Systems. Phys. Med. Biol. 2016, 61, 7652–7663. [Google Scholar] [CrossRef] [PubMed]
- Meleppat, R.K.; Matham, M.V.; Seah, L.K. An Efficient Phase Analysis-Based Wavenumber Linearization Scheme for Swept Source Optical Coherence Tomography Systems. Laser Phys. Lett. 2015, 12, 055601. [Google Scholar] [CrossRef]
- Harrison, G.R. The Production of Diffraction Gratings: II The Design of Echelle Gratings and Spectrographs1. J. Opt. Soc. Am. 1949, 39, 522. [Google Scholar] [CrossRef]
- Muhammed Shameem, K.M.; Dhanada, V.S.; George, S.D.; Kartha, V.B.; Santhosh, C.; Unnikrishnan, V.K. Assessing the Feasibility of a Low-Throughput Gated Echelle Spectrograph for Laser-Induced Breakdown Spectroscopy (LIBS)-Raman Measurements at Standoff Distances. Opt. Laser Technol. 2022, 153, 108264. [Google Scholar] [CrossRef]
- Gibbs, A. Limits on the Auroral Generation of H3+ in Brown Dwarf and Extrasolar Giant Planet Atmospheres with the Keck Near Infrared Echelle Spectrograph. Astron. J. 2022, 164, 63. [Google Scholar]
- Weber, M.; Woche, M.; Ilyin, I.; Strassmeier, K.G.; Oliva, E. ANDES, the High Resolution Spectrometer for the ELT: The UBV Spectrograph Module. In Proceedings of the Ground-based and Airborne Instrumentation for Astronomy IX, Montréal, QC, Canada, 29 August 2022; Volume 12184, pp. 1070–1076. [Google Scholar]
- Jakobsen, P.; Ferruit, P.; Alves de Oliveira, C.; Arribas, S.; Bagnasco, G.; Barho, R.; Beck, T.L.; Birkmann, S.; Böker, T.; Bunker, A.J.; et al. The Near-Infrared Spectrograph (NIRSpec) on the James Webb Space Telescope: I. Overview of the Instrument and Its Capabilities. Astron. Astrophys. 2022, 661, A80. [Google Scholar] [CrossRef]
- Itoh, S.; Ishihara, D.; Wada, T.; Nakagawa, T.; Oyabu, S.; Kaneda, H.; Hirahara, Y. Simulations of the Spectral Resolving Power of a Compact Space-Borne Immersion-Echelle Spectrometer Using Mid-Infrared Wave Tracing. J. Astron. Telesc. Instrum. Syst. 2022, 8, 025004. [Google Scholar] [CrossRef]
- Feng, L.; He, X.; Li, Y.; Wei, L.; Nie, Y.; Jing, J.; Zhou, J. Compact Shortwave Infrared Imaging Spectrometer Based on a Catadioptric Prism. Sensors 2022, 22, 4611. [Google Scholar] [CrossRef]
- Shafer, A.B.; Megill, L.R.; Droppleman, L. Optimization of the Czerny–Turner Spectrometer. J. Opt. Soc. Am. 1964, 54, 879. [Google Scholar] [CrossRef]
- Green, J.C. Aberration Corrected Designs for High Resolution Echelle Spectroscopy in the Far Ultraviolet. In Proceedings of the Space Telescopes and Instrumentation 2022: Ultraviolet to Gamma Ray, Montréal, QC, Canada, 31 August 2022; den Herder, J.-W.A., Nakazawa, K., Nikzad, S., Eds.; SPIE: Montréal, QC, Canada, 2022; p. 101. [Google Scholar]
- Gil, M.A.; Simon, J.M.; Fantino, A.N. Czerny-Turner Spectrograph with a Wide Spectral Range. Appl. Opt. 1988, 27, 4069. [Google Scholar] [CrossRef]
- Xue, Q.; Wang, S.; Lu, F. Aberration-Corrected Czerny-Turner Imaging Spectrometer with a Wide Spectral Region. Appl. Opt. 2009, 48, 11. [Google Scholar] [CrossRef]
- Zheng, L.; Susa, A.J.; Hanson, R.K. Methodology of Designing Compact Schlieren Systems Using Off-Axis Parabolic Mirrors. Appl. Opt. 2022, 61, 4857. [Google Scholar] [CrossRef]
- Allemand, C.D. Coma Correction in Czerny–Turner Spectrographs. J. Opt. Soc. Am. 1968, 58, 159. [Google Scholar] [CrossRef]
- Foreman, W.T. Lens Correction of Astigmatism in a Czerny-Turner Spectrograph. Appl. Opt. 1968, 7, 1053. [Google Scholar] [CrossRef]
- Li, S.; Zhao, W.; Xu, H.; Qiu, L.; Wang, Y. Optical System Design of Aberration-Corrected Czerny–Turner Imaging Spectrometer with High Resolution. Opt. Commun. 2020, 459, 125015. [Google Scholar] [CrossRef]
- Dong, J.; Chen, H.; Zhang, Y.; Chen, S.; Guo, P. Miniature Anastigmatic Spectrometer Design with a Concave Toroidal Mirror. Appl. Opt. 2016, 55, 1537. [Google Scholar] [CrossRef]
- Dalton, M.L. Astigmatism Compensation in the Czerny–Turner Spectrometer. Appl. Opt. 1966, 5, 1121. [Google Scholar] [CrossRef]
- Fu, X. Optical Design of a Broadband Spectrometer with Compact Structure Based on Echelle and Concave Gratings. Opt. Lasers Eng. 2022, 151, 106926. [Google Scholar] [CrossRef]
- Yuan, B.; Guo, Y.; Liu, Z. The Influence of Light Path Length on the Color of Synthetic Ruby. Sci. Rep. 2022, 12, 5943. [Google Scholar] [CrossRef]
- Xue, Q.; Yang, B.; Tian, Z.; Luan, X.; Mu, B.; Wang, S. Spaceborne Limb Hyperspectral Imager for Ozone Profile Detection. Opt. Express 2019, 27, 31348–31361. [Google Scholar] [PubMed]
- Bingham, R.G. Grating Spectrometers and Spectrographs Re-Examined. Q. J. R. Astron. Soc. 1979, 20, 395–421. [Google Scholar]


| Parameter | Values |
|---|---|
| Detection spectrum | 200–1100 nm |
| Spectral resolution | <0.1 nm (entire spectrum) |
| Slit size | 25 × 25 μm |
| Collimator focal length | 200 mm |
| Collimator aperture | 25 mm |
| Material | K1 | L1 | K2 | L2 | K3 | L3 |
|---|---|---|---|---|---|---|
| F-Silica | 0.6837 | 0.0046 | 0.4203 | 0.0134 | 0.5850 | 64.4933 |
| CaF2 | 0.5676 | 0.00253 | 0.4711 | 0.01008 | 3.848 | 1200.56 |
| LiF | 0.9255 | 0.00544 | 6.9675 | 1075.2 | 0 | 0 |
| BK7 | 1.040 | 0.006 | 0.2318 | 0.02002 | 1.0105 | 103.56 |
| Parameter | Channel 1 | Channel 2 | Channel 3 | |
|---|---|---|---|---|
| Detection spectrum (nm) | 200–500 | 450–850 | 800–1100 | |
| Groove spacing (lines/mm) | 54.5 | 79 | 42 | |
| Blazing angle (°) | 46 | 63.43 | 54.74 | |
| Diffraction order | 52–130 | 26–50 | 35–48 | |
| Off-axis angle (°) | 10 | 10 | 10 | |
| Focusing lens | Focal Length (mm) | |||
| Field of view (°) | 2.3 | 8.9 | 4.6 | |
| Aperture size (mm) | 34.8 | 66.1 | 43.0 | |
| Channel | m | λ (nm) | R | Δλ (nm) | |
|---|---|---|---|---|---|
| Channel 1 | 130 | 200 | 180,299 | 16,319 | 0.012 |
| 74 | 350 | 102,632 | 16,256 | 0.022 | |
| 52 | 500 | 72,120 | 16,319 | 0.031 | |
| Channel 2 | 50 | 450 | 156,110 | 31,791 | 0.014 |
| 34 | 650 | 106,155 | 31,226 | 0.021 | |
| 26 | 850 | 81,177 | 31,226 | 0.027 | |
| Channel 3 | 48 | 800 | 61,734 | 22,350 | 0.036 |
| 41 | 950 | 52,731 | 22,670 | 0.042 | |
| 35 | 1100 | 45,014 | 22,408 | 0.049 |
Publisher’s Note: MDPI stays neutral with regard to jurisdictional claims in published maps and institutional affiliations. |
© 2022 by the authors. Licensee MDPI, Basel, Switzerland. This article is an open access article distributed under the terms and conditions of the Creative Commons Attribution (CC BY) license (https://creativecommons.org/licenses/by/4.0/).
Share and Cite
Wang, Y.; Qu, Y.; Zhao, H.; Fan, X. Optical Design for Aberration Correction of Ultra-Wide Spectral Range Echelle Spectrometer. Photonics 2022, 9, 841. https://doi.org/10.3390/photonics9110841
Wang Y, Qu Y, Zhao H, Fan X. Optical Design for Aberration Correction of Ultra-Wide Spectral Range Echelle Spectrometer. Photonics. 2022; 9(11):841. https://doi.org/10.3390/photonics9110841
Chicago/Turabian StyleWang, Yuming, Youshan Qu, Hui Zhao, and Xuewu Fan. 2022. "Optical Design for Aberration Correction of Ultra-Wide Spectral Range Echelle Spectrometer" Photonics 9, no. 11: 841. https://doi.org/10.3390/photonics9110841
APA StyleWang, Y., Qu, Y., Zhao, H., & Fan, X. (2022). Optical Design for Aberration Correction of Ultra-Wide Spectral Range Echelle Spectrometer. Photonics, 9(11), 841. https://doi.org/10.3390/photonics9110841