Abstract
Photonic-assisted receivers for instantaneous microwave frequency measurement are devices used to measure the instantaneous frequency and amplitude of one or more microwave signals in the optical range, typically used in radar systems. Increasingly higher demands are placed on frequency range, accuracy and resolution during the development of instantaneous microwave frequency measurement applications, and these demands can be satisfied by the creation of new devices and operating principles. To permit further development in this area, it is necessary to generalize the experience gained during the development of devices based on frequency and amplitude discriminators of resonance type, including advanced ones with the best performances. Thus, in this report, we provide an overview of all the basic types of approaches used for the realization of photonic-assisted receivers based on fiber Bragg gratings, integrated Fano and optical ring resonators, Brillouin gain spectrum, and so on. The principles of their operation, as well as their associated advantages, disadvantages, and existing solutions to identified problems, are examined in detail. The presented approaches could be of value and interest to those working in the field of microwave photonics and radar systems, as we propose an original method for choosing photonic-assisted receivers appropriate for the characterization of multiple frequency measurements.
1. Introduction
The development of optical technologies and the corresponding component base has led to significant progress in methods and means for the instantaneous frequency measurement (IFM) of microwave signals based on photonic technology, which was previously carried out using the classical electronic component base [1]. Electronic instantaneous frequency measurement devices are now widely used in both military and civilian areas, for example, in electronic warfare systems, assessment of the electromagnetic environment for device compatibility, etc. However, their use is limited to frequency ranges up to approximately 20 GHz due to the limitations of electronic circuits [2]. The use of photonic systems allowed for significant expansion of the measurement frequency range, accuracy and resolution of the receivers [3]. For example, the use of a parallel link based on stimulated Brillouin scattering (SBS) allows for measurement in a range from 0.5 to 28 GHz with a measurement error of 20 MHz [4].
Instantaneous frequency measurement of single or multiple signals involves measurement of the frequency and amplitude of the laser radiation modulated by the received microwave signal. One of the most commonly used principles for the instantaneous frequency determination of a microwave signal is frequency–amplitude discrimination of the resonance type, which involves passing the measured frequency components of the signal through a dispersion medium [5,6,7,8]. The previously measured frequency components change their amplitude depending on the frequency response of the dispersion medium. Information regarding the frequency response of the dispersion medium allows for evaluation of the change in the amplitude of the measured frequency components, depending on the frequency response in the dispersion medium of the measured component, and makes it possible to build the so-called amplitude comparison function (ACF) [9,10,11].
In recent years, a fairly large number of reviews have been published in which existing methods, means and implementations were observed. However, these reviews considered only general issues related to the application of photonics in microwave measurements [12,13], reviewed implementation methods based on frequency-to-amplitude, frequency-to-time and frequency-to-space conversions, and covered only general issues related to the principles of operation and implementation of certain solutions without conducting a comparative analysis of technical implementation that could indicate the performance requirements of described systems [14,15]. The reviews did not discuss selective amplitude type discriminators, which leads to a need to review systems based on such discriminators and prepare a comparative analysis of their implementation methods and achieved characteristics as well as ways to improve the metrological performance of the considered systems.
Earlier works on photonic IFM, establishing the methods that were applied in the development of methods and means of IFM based on frequency and amplitude discriminators of resonance type, were based on the optical power measurement of a laser carrier signal modulated by a microwave signal [16,17,18,19,20,21]. The idea behind this method is to use two laser sources with different wavelengths from each other and an optical filter with a sinusoidal spectral response (for example, a Sagnac loop filter (SLF)) and apply modulated laser radiation from both laser sources. An MZM (Mach–Zehnder modulator) operating in carrier suppressed double sideband mode (CS-DSB) was used as an electro-optical modulator, and the two two-frequency signals generated at its output were fed to an optical filter in such a way that the carrier frequency of the first laser was tuned to the peak of the spectral response of the sinusoidal filter and the carrier frequency of the second laser to the middle of its base, so that the harmonic amplitudes of the two-frequency signals changed depending on the spectral response of the filter. At the output of the optical filter, the signals were demultiplexed to isolate the desired pair of harmonics of the two-frequency signal and fed to the corresponding photodetector of the demultiplexer channel, at the output of which the beat signal power was measured and an amplitude comparison function was built, where each measured frequency had its own power value.
A block diagram of an IFM method based on optical power monitoring is shown in Figure 1a and the principle of measurement based on an optical filter with a sinusoidal spectral response is shown in Figure 1b.
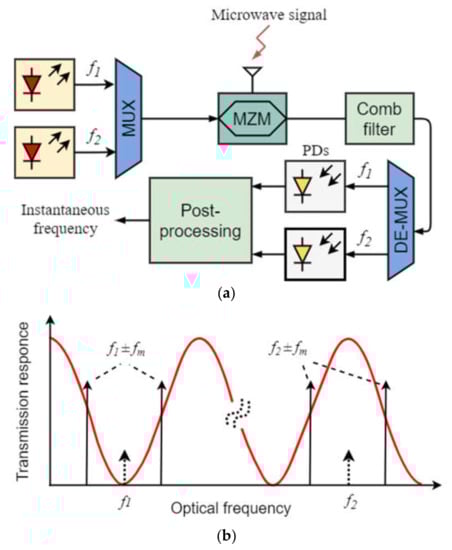
Figure 1.
Schematic IFM method with optical power monitoring on an optical filter: (a) Schematic diagram; (b) operation principle. MUX—Multiplexor; MZM—Mach–Zehnder modulator; DE-MUX—Demultiplexor; PD—Photodiode (Adapted with permission from Ref [16]. Copyright 2008, IEEE).
The use of two photodetectors makes it possible to reduce the influence of power fluctuations and instability in the laser radiation source, although it requires the same characteristics in the photodetectors. In [16], the measured frequency range was 0–25 GHz, and the measurement error was ±0.2 GHz.
Further improvement to this method was made by using a pair of optical filters with a single laser source [17,18]. This implementation made it possible to simplify the structure of the IFM system, reduce the measurement error, and improve the low-frequency measurement accuracy in the range near the top and bottom of the filter’s spectral response. Alternative implementation methods have been demonstrated, for example, based on two cascaded MZMs and a tunable delay line [19], a polarization-domain interferometer [20] or two quadrature optical filters [21].
It should be noted that conducting a complete and comprehensive review of principles of measurement and existing and promising methods and means implemented on their basis, with an analysis of system performance conditions, achieved technical characteristics and ways to improve, is a very difficult task that would require a lot of time for analysis, processing and writing a report, and such a report would require constant supplementation based on new research and publications.
The first work on the development of a fully photonics-based coherent radar system was presented in 2014 with proposals for further development of the described system in terms of measured frequency range expansion and improved resolution [22]. The requirements for photonic IFM transmitters and receivers described in [22] are presented in Table 1.

Table 1.
Performance requirements of a photonics-based radar transceiver (Adapted with permis-sion from Ref [22]. Copyright 2014, Springer Nature).
The key differences between implementation methods lie in the choice of the physical effect and the resonance type discriminator, which are the basis of IFM implementation. According to the measurement method, there are systems based on a fiber Bragg grating (FBG) [23,24,25,26,27], FBG with a phase shift (PS-FBG) [28,29,30,31], an optical microring resonator (MRR) [32,33,34,35,36], stimulated Brillouin scattering (SBS) [4,37,38,39,40] and Fano resonance [41].
Due to the extensive list of methods and means for implementing IFM systems based on frequency–amplitude resonance type discriminators, it became necessary to conduct a comprehensive analysis of all the main approaches used to implement photonic receivers, their measurement methods, their advantages and disadvantages and ways of minimizing or eliminating the latter, as well as the achieved characteristics of current technologies.
2. IFM Based on a Fiber Bragg Grating
An FBG-based IFM as a frequency discriminator was proposed in various publications, and is theoretically capable of obtaining a wide frequency range with an accuracy of tens of MHz. For example, in [25] the achieved accuracy of the simulation model was 80 kHz with a frequency range from 0 to 10 GHz. IFM devices based on FBGs have a fairly wide frequency band [42,43], which is usually limited by the bandwidth of the photodetector and the cutoff frequency of the electro-optical modulator used, which, based on the requirements, should reach approximately 40 GHz for IFM applications. One of the key problems in such systems affecting the measurement accuracy, apart from possible issues associated with the central wavelength of the laser and the FBG shift, the operating point shift in the electro-optical modulators, and incomplete suppression of higher-order harmonics after modulation, is the presence of monotonic areas in the central region of the wavelength of the FBG in the frequency band of ±0.3 GHz from the Bragg wavelength and the presence of non-linear areas at the borders of the FBG, both of which complicate the construction of a linear ACF.
Possible hardware problems in the form of shifts in the central wavelength of the laser and FBG, drift of the operating point of the electro-optical modulators, and incomplete suppression of higher-order harmonics after modulation were not overlooked by researchers; to solve them, several methods were proposed to minimize their influence or completely eliminate them [44,45,46].
2.1. Principles of Operation
The principles of operation for an IFM device based on an FBG are shown in Figure 2 in the form of a generalized block diagram [25].

Figure 2.
Schematic diagram of an IFM system based on a fiber Bragg grating for microwave frequency measurement. LD—Laser diode; MZM—Mach–Zehnder modulator; Circ.—Circulator; FBG—Fiber Bragg grating; PD—Photodiode (Adapted with permission from Ref [25]. Copyright 2010, Elsevier).
Single-frequency laser radiation passes to an electro-optical Mach–Zehnder modulator (MZM), where the laser radiation is modulated by a measured microwave signal that enters the RF port of the modulator. The MZM operates at the zero operating point to suppress the optical carrier; therefore, the output spectrum of the signal consists of two-frequency radiation with the carrier suppressed, the harmonics of which are equidistant from the carrier by a frequency equal to the frequency of the modulating microwave signal. The modulated two-frequency signal passes through the circulator to the FBG, where the signals transmitted and reflected from the FBG are formed (Figure 3a) [25].

Figure 3.
Simulation results of a Gaussian-shaped FBG example: (a) Dependence of the detected optical power and power ratio on the input microwave frequency; (b) Normalized frequency response of the FBG (Adapted with permission from Ref [25]. Copyright 2010, Elsevier).
The wavelength of the laser radiation is adjusted in such a way as to correspond to the Bragg wavelength of the FBG; as a result, the two-frequency signal falls on the slopes of the FBG, where a multiplicative change in the amplitudes of the signal harmonics occurs depending on the frequency response of the FBG (Figure 3b) [25]. The two-frequency signals transmitted and reflected from the FBG pass to the corresponding photodetectors of each channel, where a beat signal is formed, containing the magnitude of the constant component and the frequency of the signal to be measured. The power of the signal from the photodetector outputs will be proportional to the optical power of the transmitted and reflected signals from the FBG. In the processing unit, their power values are digitized and measured, and then the ratio of these values is taken to construct an amplitude comparison function, which makes it possible to unambiguously determine the value of the measured frequency (Figure 4).

Figure 4.
Estimated frequency based on measured power ratio function (Adapted with permission from Ref [25]. Copyright 2010, Elsevier).
In earlier works dedicated to IFM based on FBGs, the ACF was constructed by taking the ratio of the transmission or reflection channel power to the laser radiation power; however, this method of implementation had its drawbacks in the form of a dependence of the measured power on the power of the laser and microwave signals, which led to additional measurement errors, due to fluctuations in their power. In the implementation method described above with the transmission and reflection channels, this disadvantage is eliminated.
2.2. Analysis of the Causes of Measurement Errors and Improvement in Measurement Accuracy
Analysis of publications on IFM based on FBG made it possible to identify and analyze the main causes of measurement errors. These include instability in the laser wavelength, shifts in the modulator operating points leading to a change in the operating mode, a shift in the FBG’s central wavelength, and a difference between the photodetectors in the transmission and reflection channels of the system. Instabilities in the laser wavelength, operating point, and central wavelength of the FBG are related to temperature fluctuations, and the problem of differences in characteristics can be eliminated by switching to solutions using only one photodetector. The spectral characteristics of the laser radiation and FBG have a key influence on measurement accuracy, since shifts in both the laser and the FBG central wavelength lead to a distorted FBG and an incorrect measurement result compared with the ACF. A typical shift in the wavelength of a DFB laser due to the influence of temperature is on the order of 12.5 GHz/°K, or 0.1 nm/°K. Existing methods of temperature stabilization that are commonly used in laser–FBG pairs make it possible to reduce the temperature shift to 0.25 GHz/°K, which, as a rule, is insufficient without the use of additional means of temperature control. For an FBG, temperature stabilization will also require additional solutions, as for example noted in [44,45,46,47]. To solve this problem, the amplitude modulation coefficient can be used as an additional parameter. When using an MZM at the zero operating point with a suppressed carrier, the modulation coefficient of the beat of a two-frequency signal in the absence of temperature shifts in the laser and the FBG is equal to one with equal amplitudes of the components. In the presence of a frequency shift in both the laser and the FBG, the amplitudes of the two-frequency signal components are unequal to each other; therefore, the amplitude modulation coefficient is less than one. Determination of the shifts in the amplitude modulation coefficient and the sign of the frequency, and of the phase difference in the envelopes at photodetectors one and two for both channels, can be performed in the processing unit to compensate for the temperature shift. For an MZM, the temperature shift is on the order of 0.02 V/°K, and leads to a shift in the operating point and the appearance of an additional harmonic at frequency f0 in the output spectrum, due to an incompletely suppressed carrier. That leads to a decrease in the amplitude of the two-frequency radiation at the modulator output and to the appearance of an additional beating in the two-frequency components with an unsuppressed carrier at the output of the photodetector at frequency fRF; this beat is the difference between f0 − fRF and f0 + fRF. This affects the signal-to-noise ratio and the amplitude of the detected signal. This feature is key for radar systems, since, as a rule, the power of the measured signal is small (at the border of the system sensitivity range) and affects the maximum detection distance to the target. The solution to the problem of MZM operating point control lies in monitoring the beat power of the incompletely suppressed carrier and the components of the two-frequency signal at frequency fRF as well as the beat of the measured signal of the two-frequency components at a frequency of 2fRF. The ratio of their power makes it possible to determine the value of the temperature shift and take measures to eliminate it.
As mentioned above, one of the key problems with such systems, which depends on the FBG itself, is the monotonicity area in the region of the FBG’s central wavelength, which affects the accuracy of the frequency-to-power conversion and the construction of the ACF (Figure 3b). To solve this problem, it was proposed to use an FBG with a special concave profile shape, which significantly improves measurement accuracy in the “low” frequency range near the central wavelength due to very steep slopes of the amplitude–frequency characteristic (Figure 5) [23]. The disadvantage of this solution is a decrease in measurement accuracy in the “high” frequency region.
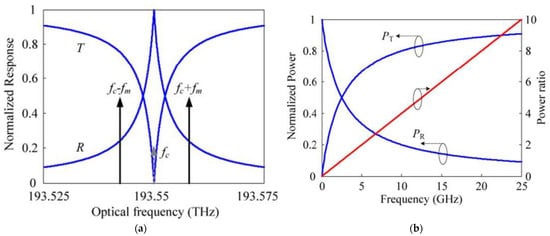
Figure 5.
Calculated results for a concave FBG: (a) Dependence of the detected optical power and the power ratio on the microwave frequency; (b) Frequency response of the special FBG with two slopes that are inversely proportional to the optical frequency (Reprinted with permission from Ref [23]. Copyright 2011, IEEE).
Detection in the “high” frequency region at the border of the FBG frequency range also leads to an increase in measurement error due to the nonlinear change in the frequency-to-power conversion and low signal power in the reflection channel. To solve this problem, it was proposed to detect the beat signal of the two-frequency components of the measured signal at an intermediate frequency by using an additional modulator with a fixed frequency to split each of the two-frequency radiation components to a difference frequency of 100 MHz [26]. Detection in this case is determined by the beat envelope of the two-frequency components relative to the intermediate frequency of 100 MHz (Figure 6).

Figure 6.
IFM method with increased resolution at “high” frequencies: explanation of the operation principle (adapted from [26]).
This solution, in comparison with solutions based on direct photodetection, makes it possible to reduce the effects of photodetection noise, namely, thermal, shot, and flicker noise, which are inherently low-frequency by nature, and in turn can increase the signal-to-noise ratio (Figure 7) [26].

Figure 7.
Explanation of SNR gain using detection at an intermediate frequency, compared with direct detection (adapted from [26]).
As another solution to the measurement accuracy problem in the “low” frequency region, this paper presents the concept of separation of the measured frequencies at the center of the FBG slopes (linear section). This solution is realized by pre-modulating the laser radiation in the MZM at the zero operating point with a signal at a fixed frequency equal to the FBG frequency response at half of its amplitude. A block diagram describing the implementation of the proposed solution and a visual representation of the measured position of the signal harmonics is shown in Figure 8.

Figure 8.
IFM method with additional frequency separation: (a) Explanation of the operation principle; (b) block diagram of the transmitting part. LD—Laser diode; MZM—Mach–Zehnder modulator; PM—Phase modulator; MB—Modulator block (adapted from [26]).
The proposed solution allows for complete elimination of several disadvantages: the monotonic section of the FBG frequency response, the low-frequency measurement limit of 100–200 MHz, and the transfer of measurement of the low-frequency signals to the center of the FBG linear slope. This increases the frequency-to-power conversion accuracy and the measurement accuracy, although similarly to the previous solution, it requires an additional modulator and a band pass filter with a bandwidth equal to half of the FBG bandwidth. As a side effect, for a fixed operating frequency range, the bandwidth of the FBG must be two times higher. For example, if the measurement range is 20 GHz, the FBG must have a total width of 40 GHz. To minimize the filter bandwidth, two detection mechanisms are used depending on the amplitude modulation coefficient, where m ∈ [0; 1] defines a frequency range from 0 to 20 GHz and m = 1 a frequency range from 20 to 30 GHz, which also shows the possibility of measuring frequencies higher than the photodetectors’ bandwidth.
As a way to improve measurement accuracy over the entire frequency range, in [45] it was proposed to use a specially designed triangular FBG as a V-shaped filter instead of the classical Gaussian FBG. The characteristics of the V-shaped filter and the spectral response of the manufactured FBG in the reflection channel are shown in Figure 9a and Figure 9b, respectively.
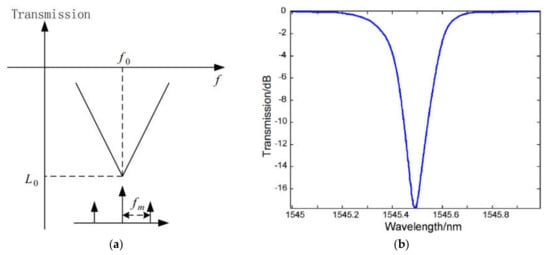
Figure 9.
IFM method using a triangular V–shaped filter: (a) Characteristics of the V–shape filter; (b) Transmission spectrum of the fabricated fiber Bragg grating (Reprinted with permission from Ref [45]. Copyright 2010, IEEE).
This type of grating allows for the building of a linear ACF for both the “low” and “high” frequency ranges. The measured frequency range and measurement accuracy in this case are determined by the slope factor of the V-shaped filter. In the case of [45], the measured frequency range was 2.5–8 GHz with a FBG slope of 1.12 dB/GHz and a measurement accuracy of ±0.25 GHz. As stated by the authors, measurements above 8 GHz were not carried out due to a high dispersion effect experienced by their fabricated FBG under their experimental conditions, and the measurement accuracy was mainly determined by temperature fluctuations, which could be stabilized by using an athermal isolated FBG. Further expansion of the operating frequency range can be achieved by using a wider FBG.
An alternative way to implement a system with improved measurement accuracy, in comparison to systems in which the laser wavelength is tuned to the FBG’s central wavelength, is presented in [27] where measurements were carried out on only one FBG slope, which was used as a tilt filter. In this work, a tunable laser source with phase modulation was used, and a tilt filter was used to set a phase mismatch after modulation to implement phase-modulation-to-intensity-modulation conversion. A tunable laser source was used to obtain two power ratios at different slope areas of the FBG frequency response. The principles of operation for the tilt filter and the spectrum in the transmission channel with dispersion characteristics are shown in Figure 10a and Figure 10b, respectively.

Figure 10.
IFM method using an FBG as a tilt filter: (a) Block diagram of the characteristics of an external tilt filter; (b) transmission spectrum and dispersion characteristics of the chosen fiber Bragg grating (Reprinted with permission from Ref [27]. Copyright 2011, Taylor & Francis).
The main feature of this method is the possibility of measurement at different parts of the slope with different steepness values, which improves measurement accuracy. It is also worth noting that the system works only in the transmission channel, and therefore requires only one photodetector. The use of a phase modulator eliminates the need to maintain a bias voltage compared to the solutions based on MZM. By taking the power ratio from two points of the FBG frequency response, the system becomes insensitive to laser power fluctuations. The range of measured frequencies can be extended and measurement accuracy can be improved by using an FBG with a special form of frequency response.
2.3. Discussion of Analysis Results
The performance of IFM techniques based on FBG and the achieved characteristics are summarized in Table 2.
Table 2.
Performance of IFM techniques based on FBG.
Analysis of publications covering IFM systems based on FBG allows for the conclusion that the shape of the FBG frequency response is the main source of system measurement errors when stable operational conditions are ensured: namely, errors in the “low” frequency range due to the presence of monotonicity conversion and errors in the “high” frequency range due to the non-linear nature of the conversion and low power levels in the reflection channel. These problems can be solved using the methods discussed in the measurement accuracy improvement section. In the considered works, the operating frequency range did not exceed 20 GHz, which does not satisfy the requirements for IFM systems presented in the introduction section. At the output of the MZM at the zero operating point with the carrier suppressed, the difference between the components of the two-frequency signal is twice the modulation frequency, so in order to detect such a signal, we need twice the bandwidth of the FBG and the corresponding photodetectors. According to the requirements given in the introduction section, the required operating range of the measured frequencies should be 40 GHz; hence, the operating frequency range of the MZM should be up to 40 GHz, and the bandwidth of the FBG and photodetector should be at least 80 GHz. It is possible to use MZMs and photodetectors with operating frequency ranges up to 80 GHz; however, expansion of the frequency bandwidth of the FBG up to 80 GHz will increase the monotonicity area in the “low” frequency range and the conversion nonlinearity in the “high” frequency region for both the classical Gaussian FBG and an FBG with a concave profile. Therefore, it is concluded that for this type of system, the optimal solution in terms of frequency-to-power conversion accuracy and ACF construction accuracy would be a solution with a triangular frequency response, which, however, presents some manufacturing difficulties, for example, requiring a special phase mask for its manufacturing process [48,49].
3. IFM Based on Phase-Shifted FBG
IFM based on an FBG with a phase shift is implemented by creating an ultra-narrow-band selective microwave reflection filter [50,51] based on the conversion of phase modulation into amplitude modulation. A phase-shifted FBG is created by recording a conventional FBG with a gap of one period [52,53,54], or by creating two near-Bragg wavelength FBGs, which create a narrow-band frequency response window in the reflection channel that can be used for instantaneous frequency determination of the microwave signal. The frequency band of such an ultra-narrow-band filter is determined by the number of periods in the FBG (for a homogeneous FBG) or the difference in the Bragg frequency (for two FBGs with near identical central wavelengths). The transformation of phase modulation into amplitude modulation occurs when one of the sidebands modulated by the measured microwave signal falls into a filter frequency band where the phase and amplitude relationship between the two sidebands changes. The tuning of this microwave photonic filter is carried out by shifting the frequency of the optical carrier and, as a result, of the sidebands modulated by the measured microwave signal at the output of the modulator. To measure the frequency of an unknown signal and construct the ACF for the frequency range of the phase shift, the power ratios of the beat signals in the transmission and the reflection channels of the PS-FBG are used. Research achieved an operating bandwidth for the IFM of 0.6 nm, which corresponds to 75.65 GHz with a filter bandwidth of 0.026 nm (3.25 GHz) [55], and at 5.5 and 15 GHz with 120 and 60 MHz filter bandwidths, respectively (Figure 11) [56].
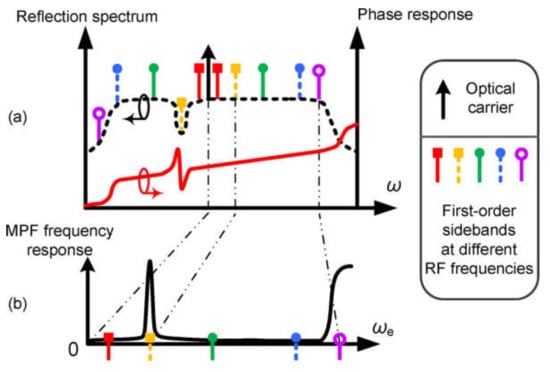
Figure 11.
Illustration of the operation of a microwave photonics filter based on PS-FBG: (a) Reflection spectrum (dashed line) and phase response (solid line) of the PS-FBG; (b) frequency response of the MPF (Adapted with permission from Ref [56]. Copyright 2012, IEEE).
3.1. Principles of Operation
The principles of operation for an IFM device based on PS-FBG are shown in Figure 12 in the form of a generalized block diagram [56].

Figure 12.
Schematic of a microwave photonics filter based on PS-FBG. TLS—Tunable laser source; PC—Polarization controller; OC—Optical circulator; PS-FBG—Phase-shifted FBG; EDFA—Erbium doped fiber amplifier; PD—Photodiode; VNA—Vector network analyzer Adapted with permission from Ref [56]. Copyright 2012, IEEE).
A tunable laser radiation source generates a narrowband signal with a frequency f0, which passes to the phase modulator through a polarization controller to minimize polarization losses. The electrical port of the phase modulator receives a microwave signal to be measured with the frequency fRF, which modulates the laser signal. When the phase-modulated signal is detected by a photodetector, it is a constant component without a beat signal component, because the side components add up out of phase with each other. To detect such a signal, the phase-modulated signal can be converted and modulated in intensity by changing the ratio of the amplitude or phase of the side components, which is performed in an ultra-narrow-band PS-FBG filter created in a homogeneous FBG. The modulated signal from the phase modulator output passes to the PS-FBG, which is used to change the amplitude and phase of one of the side components in the passband of the ultra-narrow-band filter and change the phase synchronization of the two side components that allows for the detection of the beat signal.
3.2. Analysis of the Causes of Measurement Errors and Improvement in Measurement Accuracy
To minimize measurement errors in IFM systems based on PS-FBGs, methods similar to those used for IFM systems based on normal FBGs are used to minimize measurement errors, namely, methods for laser radiation stabilization in terms of wavelength and power and methods for operating modes of modulators and compensating for temperature, since the causes of measurement errors are identical and lead to similar effects. Another way to improve measurement accuracy is to use a PS-FBG bandwidth that is as narrow as possible with a high quality factor. The optimal condition for this is equality of the geometric lengths of the FBG sections on the sides of the phase shift of the PS-FBG, i.e., L1 = L2, which creates an ultra-narrow-band filter with a fast phase shift. Publication [56] presents a mathematical analysis of the mismatch condition for the geometric lengths of FBG sections. As shown in [57], the bandwidth of such a phase shift can be in units of megahertz, which determines the measurement error in the IFM system. Accordingly, during development of a system, it is possible to design an ultra-narrow-band PS-FBG with a flat top and steep slopes to create a uniform FBG frequency response in the PS-FBG frequency range to filter out and determine the harmonics of the measured signals with high accuracy. An ultra-compact waveguide FBG with a phase shift (PS-WBG) based on a silicon photonic chip was implemented as presented in Figure 13, with a splitter for simultaneous transmission and reflection channel monitoring [29].

Figure 13.
Schematic of a silicon WBG (PS-WBG) employed as a linear optic frequency discriminator. TX port, transmission port; RX port, reflection port [29].
Research presented in [29] shows a possibility for integrated implementation and a way to minimize measurement errors, particularly the influence of temperature fluctuations, and allows for reduction of system losses to increase the signal-to-noise ratio. In this work, further integration of the optoelectronic component base on a single chip, including the integration of RF and digital electronics along with active and passive photonic components with ultra-low signal delay and increased performance, was proposed as the next step in development.
3.3. Discussion of Analysis Results
The performance of IFM techniques based on PS-FBG and the achieved characteristics are summarized in Table 3.
Table 3.
Performance of IFM techniques based on PS-FBG.
At the present time, the methods and means for PS-FBG-based IFM are represented by several publications, and most of the works on PS-FBGs describe them as a means of filtering optical signals, but not as amplitude–frequency discriminators.
In [30], the narrow-band nature of the PS-FBG was used to cover the measured frequency range with an array of PS-FBGs, which created a channelized receiver, and in [31] a reconfigurable multifunctional narrow-band filter based on fractional Hilbert transformers (FrHTs) and optical phase adjustment was presented, although there are two works describing a different application of PS-FBG [28,29].
The first work in the Table 3 was based on a classical FBG with a π-phase shift [28], and the second one was based on a waveguide PS-FBG [29]. In the first publication, based on the classical FBG, the phase shift was introduced to eliminate the area of monotonic change in the FBG frequency response (this method can also be used to improve the measurement accuracy for a classical FBG) (Figure 14).
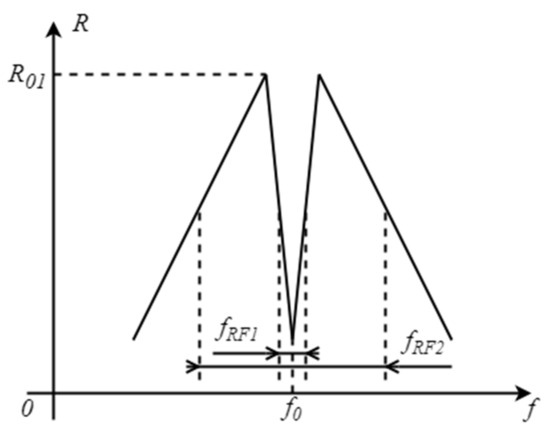
Figure 14.
Estimated frequencies based on measured power ratio function: R01—Reflection index for the first subrange (adapted from [28]).
This method of implementation introduces a V-shaped narrowband window in the FBG central wavelength region. This splits the measured frequency range into two sub-bands, where the “low” frequencies of 0.3–3 GHz are measured in the first sub-band in the FBG transmission channel on the slopes of the phase shift and the “high” frequencies of 3–30 GHz are measured on the slopes of the FBG in the reflection channel. The amplitude comparison function for the two sub-bands is shown in Figure 15.
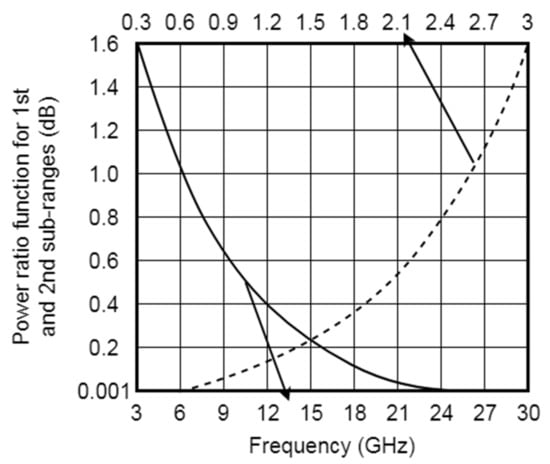
Figure 15.
Dependence of ACF on fRF (adapted from [28]).
The phase shift allows the setting of a narrowband window in the FBG frequency response with a high slope steepness, which significantly improves the frequency-to-power conversion and measurement accuracy and also eliminates the influence of the FBG monotonicity region near the central wavelength. In this case, the upper limit of the measured frequency range is determined by the FBG bandwidth.
In the second publication in Table 3, the phase shift in the waveguide Bragg grating was used to create a window of 100 GHz width in the reflection range of the PS-WBG, a section of which was used for amplitude–frequency discrimination and ACF construction depending on the power levels in the transmission and reflection channels (Figure 16).

Figure 16.
Optical and RF responses. Simulated (dashed line) and measured (solid line) (a) linear optical transmission of the PS-WBG; (b) reflection spectral response of the PS-WBG; (c,d) zoomed view of overlapped optical single sideband with carrier (OSSB + C) spectrum; (e) RF response of TX and RX ports; (f) amplitude comparison function [29].
The achieved measurement accuracy in the second article was ~755 MHz, a rather large measurement error for IFM systems, which in this case was determined by the wide phase shift band of 100 GHz and the small number of FBG periods. In the same work, the possibility of integrated implementation of a PS-WBG based on a silicon chip was shown and the physical performance of the system was demonstrated using a dynamically changing measured frequency of an unknown signal with a low delay of up to 10 ps. The possibility of implementation using complete integration, including a modulator and photodetectors, makes it possible to exclude additional amplifiers from the system, improve performance and reduce the influence of external and internal factors. The influence of these factors described above for the classical FBG is the same, since the nature and influence are similar for methods and means of IFM based on PS-FBG.
4. IFM Based on an Optical Microring Resonator
The next technique for IFM implementation is the use of an optical ring resonator [58,59] as a frequency discriminator. This technique was proposed in a number of papers and, as its main advantage, it has the possibility of frequency reconfiguration by controlling the temperature, coupling and resonance frequency of the ring, which in turn allows for the construction of a fully customizable ACF [60,61,62,63]. Devices based on optical microring resonators can somewhat provide the above-described requirements for the frequency range and measurement accuracy. An example of that was presented in [32] as a practical implementation of an IFM system based on a ring resonator with input–output ports made on a silicon chip, where the measurement system was operated on two rings with high (Q = 25833) and low (Q = 3974) quality factors to cover the frequency ranges of 0.1–5 GHz and 0.5–35 GHz, respectively. The achieved minimum measurement accuracy was 63 MHz for the frequency range of 0.1–5 GHz and 240 MHz for the frequency range of 0.5–35 GHz, respectively. As an advantage of implementing such a system, the ring is created in an integral form, which makes it resistant to the influence of the external environment and improves system performance.
4.1. Principles of Operation
The principles of operation of an IFM device based on an optical microring resonator are shown in Figure 17 in the form of a generalized block diagram [32].

Figure 17.
Schematic diagram of an IFM system based on a silicon microring resonator. TL—Tunable laser; PC—Polarization controller; DSBSC—Double sideband suppressed carrier modulation; DUT—Device under test; PD—Photodiode (Adapted with permission from Ref [32]. Copyright 2017, Elsevier).
The single-frequency narrow-band radiation generated by the laser, with a wavelength equal to the resonant wavelength of the ring resonator, passes to the MZM input, which operates at the zero operating point to suppress the carrier and higher order harmonics, the RF port of which receives an unknown RF signal from, for example, the external antenna. The modulated signal enters the waveguide and is combined with the ring resonator, with the transmission spectrum presented in Figure 18a,c, such that part of the power passes to the resonator and is received by the photodetector from the resonator output port. The other part of the signal power passes through the waveguide to the corresponding photodetector (Figure 18b,d).

Figure 18.
Measured transmission spectra and output power from the through and drop ports of the ring: (a,b) for a 0.5–35 GHz frequency range IFM system; (c,d) for a 0.1–5 GHz frequency range IFM system (Adapted with permission from Ref [32]. Copyright 2017, Elsevier).
The power of the beat signals from the waveguide and MRR is measured afterwards, which makes it possible to construct an amplitude comparison function for two resonators (Figure 19a,b) [32].

Figure 19.
The reference ACF versus the input signal’s frequency: (a) for a 0.5–35 GHz frequency range IFM system; (b) for a 0.1–5 GHz frequency range IFM system respectively (Adapted with permission from Ref [32]. Copyright 2017, Elsevier).
4.2. Analysis of the Causes of Measurement Errors and Improvement in Measurement Accuracy
In addition to the already considered sources of errors such as frequency instability in the laser radiation, instability at the modulator operating point (MZM) and differences in photodetector characteristics, measurement error is mainly affected by asymmetry in the slopes of the resonator frequency response. This results in uneven changes in the amplitude of the harmonics for each slope, as shown, for example, in Figure 20.

Figure 20.
Normalized transmission spectrum of a MRR (Adapted with permission from Ref [36]. Copyright 2011, IEEE).
This problem can be solved by changing the width and diameter of the ring and the length of the coupling region depending on the distance from the waveguide to the ring, which allows for adjustment of the coupling coefficient and positive and negative slope characteristics of the microring resonator. This operation requires physical realignment of the ring via micromanipulation using a microscope. In addition, IFM based on a microring resonator is not without problems, similar to those experienced with FBGs: namely, the presence of areas of monotonic change in the frequency response in the “low”-frequency region. This problem, however, can be solved by the already mentioned use of parallel rings to cover individual sub-bands with high-quality microring resonators.
As a way to improve measurement accuracy, the authors considered ways to reduce the influence of system noise, namely, limiting chip insertion losses. Another proposed method is to use simultaneously several parallel or cascaded ring resonators covering certain parts of the measured frequency range for simultaneous coverage of a wide bandwidth with high measurement accuracy. Two ring resonators with different gaps between the waveguide and the ring were used in [32] to control the coupling coefficient and Q-factor of the resonator and, consequently, the operational frequency range. For example, a ring with a gap of 300 nm had a Q-factor of 3974 and covered the frequency range of 0.5–35 GHz, and a second ring with a gap of 700 nm had a Q-factor of 25833 and covered the frequency range of 0.1–5 GHz. An additional improvement to system performance in terms of measurement accuracy can be achieved by integrating a laser, an electro-optical modulator, a microring resonator, and photodetectors into a single monolithic photonic chip, as demonstrated in Figure 21 [33].
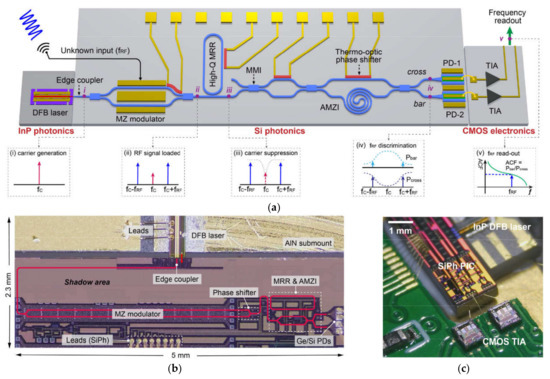
Figure 21.
Photonic–electronic fully chip-integrated IFM system: (a) Illustration and principles of operation of the system; (b) top-view micrograph of the hybrid-integrated InP DFB laser and SiPh PIC; (c) photograph of the implemented fully on-chip MWP IFM system. DFB laser—Distributed feedback laser; MZ modulator—Mach–Zehnder modulator; High-Q MRR—High quality factor microring resonator; MMI—Multi-mode interference splitter; AMZI—Asymmetrical MZ interferometer; PD—Photodiode [33].
4.3. Discussion of Analysis Results
The performance of IFM techniques based on microring resonators and the achieved characteristics are summarized in Table 4.
Table 4.
Performance of IFM techniques based on microring resonators.
The best results in terms of measurement error were shown in [33] with full integration of the photonic–electronic part on the chip. There are also proposals for improving the efficiency of optical connections [64], heterogeneous integration to increase the compactness and scalability of the system [65], and reducing production costs by integrating low-noise transimpedance amplifiers with a photonic part on a monolithic platform [66].
5. IFM Based on Stimulated Brillouin Scattering
IFM methods based on stimulated Brillouin scattering [67,68,69] use the selective amplification and absorption of the side components of an optical carrier modulated by a target microwave signal in the amplification/absorption of selective contours created by stimulated Brillouin scattering, using an additional pump laser source. In this case, the stimulated Brillouin frequency shift and the frequency of the amplification/absorption bands are unique and fixed for each of the condensed dispersion media [70,71]. Since in SBS-based IFM these media are predominantly quartz optical fibers, the frequency of the contours is approximately ~±11 GHz from the pump laser frequency [72]. The width of the SBS amplification/absorption contours is 20–100 MHz, which determines the error in measurement of an unknown microwave signal frequency in such systems. The pump laser’s tunable frequency range determines the measurement frequency range. For example, research presented in [37] demonstrated the implementation of an IFM system based on SBS in the frequency range of 9–38 GHz with a measurement error of 1 MHz, which was the best-achieving result presently available.
5.1. Principles of Operation
The principles of operation for an IFM device based on stimulated Brillouin scattering are shown in Figure 22 in the form of a generalized block diagram [73].

Figure 22.
Basic structure for an IFM based on SBS. LD—Laser diode; SUT—Signal under test; MZM—Mach–Zehnder modulator; ISO—Isolator; HNLF—Highly nonlinear fiber; CIR—Circulator; PD—Photodetector; ADC—Analog-to-digital converter; DSP—Digital signal processor (Adapted with permission from Ref [73]. Copyright 2022, Elsevier).
Narrow-band optical radiation with a frequency f0 generated by a laser source passes to the MZM, which operates at the zero operating point to suppress the carrier, where it is modulated by an RF signal with unknown frequency, which passes to the electrical port of the MZM. The signal at the output of the MZM is a two-frequency signal with a suppressed carrier and two components f0 − fRF and f0 + fRF that pass through the isolator and enter a section of nonlinear fiber. An optical signal from the pump laser with frequency fP arrives at a section of nonlinear fiber from the opposite side and initiates the SBS effect upon reaching the necessary power threshold. Given a fixed pump laser frequency fP, SBS amplification/absorption contours are formed at the frequencies fP + fSBS and fP − fSBS. The pump frequency determines the range of measured frequencies and is chosen in such a way that the measured components f0 − fRF and f0 + fRF pass into the passband of the amplification/absorption contours. By changing the pump frequency, the entire measured range is scanned. Since the width of the Brillouin amplification/absorption contours is 20–100 MHz, to scan the entire measured frequency range, the frequency of the pump laser that initiates the SBS is tuned discretely with a step equal to the frequency range corresponding to half the amplitude of the width of the amplification/absorption contours. This ensures that the harmonics of the measured frequencies pass to the linear section of the amplification/absorption contours and uniformly overlap the measured frequency range. Each subsequent sub-band partially overlaps the previous one to build multiple ACFs for each sub-band. A visual representation of this principle is shown in Figure 23.
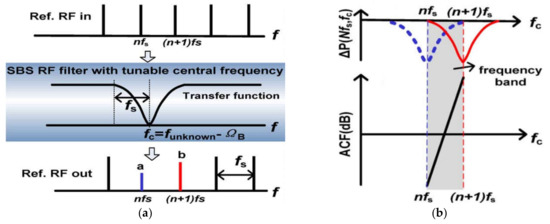
Figure 23.
(a) Conceptual diagram of a SBS-based IFM system; (b) analytical relationship between the unknown RF and the RF power change in each channel and the resulting mapping between the ACF and the unknown RF [37].
As a result, if the sideband positions coincide with the amplification and absorption contour, their power is respectively amplified or attenuated. The change in fP allows for scanning with the gain and loss contours of the harmonics of the measured frequencies positioned between the lowest and highest values of the pump laser tuning frequency, which determines the operational frequency range. After amplification/absorption, the signal power is received at the photodetector and its frequency is determined through the ACF of the corresponding sub-band, though the slope of the ACF curve is roughly the same for each channel [40].
5.2. Analysis of the Causes of Measurement Errors and Improvement in Measurement Accuracy
The main causes of measurement errors in IFM systems based on SBS, in addition to the already-described sources of error such as frequency instability at the laser source or the operating point of the electro-optical modulator, are the temperature and spectral instability of the pump laser and temperature fluctuations in the fiber section, where the SBS amplification/absorption contours are initiated. Instability in the temperature, in terms of laser radiation frequency, leads to a change in the position of the central frequency of the contour in a given sub-band, and fluctuations in the width of the laser spectrum lead to a change in the width of the SBS amplification/absorption contours, which accordingly changes the nature of the overlap order of the sub-bands when the pump laser frequency is tuned, since the width of the Stokes components of the SBS is less than 104 times narrower than the laser radiation bandwidth [74]. Additional errors can occur due to spontaneous emissions as a result of random perturbations in the amplitude and phase of the pump laser, which leads to spontaneous perturbations in the backpropagating acoustic wave, similar to the phase of the pump laser. A change in the temperature of the system results in tension/compression of the fiber, which in turn results in a shift in Brillouin frequency. It is possible to directly increase measurement accuracy by narrowing the linewidth of the pump laser, which narrows the width of the amplification/absorption contours. That allows for increasing the slope steepness of the contour frequency response and the slope of the ACF; however, the side effect of such a decision is a larger number of laser tuning steps necessary to scan the operational frequency range, causing an increase in scan time.
5.3. Discussion of Analysis Results
The performance of IFM techniques based on SBS and the achieved characteristics are summarized in Table 5.
Table 5.
Performance of IFM techniques based on SBS.
Compared to similar methods of amplitude–frequency discrimination, methods based on SBS show among the best characteristics in terms of measurement accuracy. The frequency range of the tuning pump laser, frequency band of the EO modulator, and bandwidth of the photodetector determine the operational frequency range in this case, as well as the speed of the ADC, which digitizes the signal received from the photodetector. As stated by the authors in [37], a system based on SBS on a chip showed a 75-fold increase in performance compared to previously proposed systems. Further improvement could be achieved by hybrid integration of electronics and photonics on a single chip to minimize losses, improve the signal-to-noise ratio, increase dynamic range and improve the overall stability of the operating modes of the components on the chip. The possibility of tuning the width of the SBS amplification/absorption contours allows for tuning according to the required measurement accuracy, resolution and sub-band frequency width during systematic scanning. Unlike other solutions based on a single amplitude–frequency discriminator, the accuracy and resolution of which are determined by the bandwidth of the discriminator, the accuracy of systems based on SBS is determined by the slope steepness of the contour frequency response. The disadvantage of such an implementation is the need to scan the entire measured range, and the tuning time of the pump laser must be less than the lifetime of phonons in the material (~20 ns) [15].
6. IFM Based on Fano Resonance
IFM methods based on Fano resonance [75,76] are usually implemented using a microring resonator through the interference of two resonant waves in the resonator, which leads to the appearance of a Fano resonance—an ultra-narrow asymmetric profile gain circuit around the center frequency (compared to a Gaussian or Lorentzian profile). Such an effect can be used for selective amplification of the harmonics of the measured signal on the slope of the resonance curve for construction of an amplitude comparison function by measuring the signal power from the output ports of the resonator and the waveguide, which allows for determination of the unknown signal frequency [77,78]. The contour shape of this resonance can be tuned by precise phase control of the two interfering waves propagating in the microring resonator and the waveguide, for example, by heating the ring. The width of the Fano resonance frequency profile is up to 1–5 MHz [76], which makes it possible to carry out ultra-precise measurements (Figure 24).
Figure 24.
Fano resonance phenomenon in photonics (Adapted with permission from Ref [76]. Copyright 2017, Springer Nature).
Recent works experimentally showed the possibility of instantaneous frequency measurement of a microwave signal in the 15 GHz band with a measurement accuracy of ±0.5 GHz [33].
6.1. Principles of Operation
The principles of operation for an IFM device based on Fano resonance are shown in Figure 25 in the form of a generalized block diagram [41].

Figure 25.
Schematic diagram of a Fano-based IFM system. TLS—Tunable laser source; PC—Polarization controller; MZM—Mach–Zehnder modulator; EDFA—Erbium doped fiber amplifier; OBPF—Optical bandpass filter; OC—Optical circulator (Adapted with permission from Ref [41]. Copyright 2019, IEEE).
The principles of operation are essentially similar to those of IFM based on a ring resonator. The tunable laser source generates narrow-band radiation at a frequency of f0, which pass to an electro-optical Mach–Zehnder modulator operating at the zero operating point of the modulation characteristic for carrier suppression, where it is modulated by an RF signal with an unknown frequency incoming from the RF port of the modulator. The output radiation is a two-frequency signal with a suppressed carrier, which is then amplified in an erbium-doped fiber amplifier before passing through an optical bandpass filter, where the left sideband is extracted and fed into the microring resonator chip. Since the Fano resonance changes its spectral response as the temperature changes, the temperature must remain stable, which requires external temperature control with high accuracy. The ring resonator itself consists of a transmission waveguide with a built-in Fabry–Perot waveguide resonator, a ring and a waveguide with input–output ports. The passing waveguide, in addition to the Fabry–Perot resonator, contains side Bragg gratings on both sides of it that serve as reflectors. The choice of grating period and the length of the resonator cavity determine the resonant modes of the microring resonator, and by selecting the phase, the shape of the asymmetric Fano resonance profile is determined. The frequency response section of the profile is used to measure the signal power in the passing and output ports to construct the amplitude comparison function.
6.2. Analysis of the Causes of Measurement Errors and Improvement in Measurement Accuracy
Fano resonance, according to the work described in the principles of operation section, is created by the interference of two waves propagating in a grating waveguide with a Fabry–Perot interferometer and in a microring resonator with input/output ports, where the resonant mode of the Fabry–Perot interferometer interferes with the resonant mode of the microring resonator [41]. This implies the conclusion that any external influence or change in the operating mode of the components included in the measurement system leads to a change in the parameters and conditions for the generation and propagation of resonant modes, and therefore a change in the spectral parameters of the Fano resonance and a distortion of the measurement results. The main external influence that can affect the measurement system is a change in the operational temperature, which leads to changes in the operating modes of the laser and EO modulator, the geometric dimensions of the grating waveguide with the Fabry–Perot interferometer (the distance between the walls of the interferometer and the period of the grating waveguide) and the microring resonator (diameter and width of the ring), and the distance between the waveguide and the microring resonator, which in turn lead to changes in the coupling coefficient. An analysis of the influence of temperature on the parameters of the laser and the modulator is described in Section 2.2. In [41], the experiments required temperature control in the range of less than 0.01 °C, which determined a need for strict temperature control using stabilization mechanisms or additional equipment. Regarding internal influences, the main one is the power of the laser radiation and the amplifier coefficient; an increase in these values leads to an increase in the signal-to-noise ratio and a decrease in measurement error. Since the measurement accuracy is determined by the operational bandwidth, which depends on the slope steepness of the envelope of the Fano resonance spectral characteristics, it is affected by the coupling coefficient between the waveguide with the Fabry–Perot interferometer and the microring resonator [79].
6.3. Discussion of Analysis Results
The performance of IFM techniques based on Fano resonance and the achieved characteristics are summarized in Table 6.
Table 6.
Performance of IFM techniques based on Fano resonance.
So far, IFM methods based on the Fano resonance are represented by only one publication, where one of the slopes of the asymmetric Fano resonance shape was used as an inclined filter with a linear frequency response covering a measured frequency range of 15 GHz. This was realized by the generation of a two-frequency component at the MZM output with a suppressed carrier operating at the zero operating point of the modulation characteristic, followed by the modulation of the optical carrier with an unknown RF signal, filtration of the left side band passing into the Fano resonance amplification band and detection of the optical power in the transmission and reflection channels (Figure 26) [41].

Figure 26.
(a) Transmission spectral response of the device; (b) reflection spectral response of the device; (c,d) zoomed-in views of the region around the Fano resonance; (e) amplitude comparison function; (f) zoomed-in view of the linear region of the ACF with linear fitting (Adapted with per-mission from Ref [41]. Copyright 2019, IEEE).
In this work, the achieved measurement error, as shown in the table, was ±0.5 GHz, which was almost three times higher than the required measurement accuracy for IFM systems and suggests that the method must be improved. An alternative way to implement an IFM based on Fano resonance is to create an ultra-narrow-band resonance with a high quality factor and high out-of-band suppression with symmetrical slopes, which would work as a selective frequency filter and make it possible to scan the operational frequency range. As mentioned above, implementation and maintenance of the Fano resonance frequency response shape imposes strict requirements for temperature control, which could present some design difficulties for implementations based on discrete photonics components. However, as shown in [41], integrated implementation greatly simplifies the maintenance of the required temperature range and increases the overall performance of the system due to easier control of the component base operating modes and low power loss.
7. Conclusions
Within the framework of this article, a review of existing and promising methods and means for creating photonic systems for the instantaneous frequency measurement of microwave signals based on frequency and amplitude discriminators of resonance type was carried out, namely, fiber Bragg gratings, phase shifted fiber Bragg gratings, optical microring resonators, stimulated Brillouin scattering and integrated Fano resonators, the comparative characteristics of which are given in Table 2, Table 3, Table 4, Table 5 and Table 6. For simplicity of comparison, the best IFM techniques for each of the considered methods and their metrological characteristics, such as operational frequency range and measurement accuracy, are summarized in Table 7.
Table 7.
Performance of techniques with the best characteristics presented in the considered IFM papers.
As shown in Table 7, none of the considered works satisfies the requirements presented in Table 1 either in terms of operational frequency range or in terms of measurement accuracy, except for the method based on SBS, which establishes the need for further research in each of the considered IFM techniques.
For IFM based on an FBG, the review showed that simultaneous expansion of the frequency range and increase in the measurement accuracy could be achieved by using an FBG with a triangular frequency response and/or channelization of the receiver, which, however, complicates design due to the many reception channels and requires the channel components to possess the same characteristics or to undergo calibration. This decision also raises issues such as tradeoffs between the number of channels, measured bandwidth, and measurement accuracy; the need for methods of measuring signals that fall into the interchannel frequency range; etc.
For PS-FBG, which has a narrow-band frequency response, measurement accuracy can be achieved by tuning the bandwidth and the operational frequency range can be provided both by receiver channelization, as proposed in [30], and by adjusting the temperature [31]. An alternative to adjusting the temperature could be mechanical stretching/compression of the FBG with a phase shift; however, this would require precise control of the applied mechanical force.
IFM based on a microring resonator significantly exceeded the accuracy requirements, and the measured frequency range, as indicated in [33], could be extended by optimization of the EO bandwidth of silicon modulator (potentially >50 GHz). The required measurement accuracy could be ensured by the use of stabilization methods for operational conditions and temperature stabilization of the component base.
IFM based on SBS showed significant measurement accuracy superiority compared with other measurement methods, due to the ultra-narrow-band nature of the SBS amplification/absorption contours, and provided the required frequency range, which is determined by the tuning frequency range of the pump laser and the OE modulator’s frequency range. The principle of IFM implementation based on SBS is that the scanning time of the receiver is determined by the tuning time of the pump laser.
IFM based on Fano resonance makes it possible to set completely controllable and tunable parameters of both narrowband [76] and broadband resonance [41], with the frequency response of such resonance depending on the parameters of the interfering signals. With this method of IFM implementation, strict requirements on the operating modes for the sources of interfering signals are imposed, since a change in the signal parameters leads to a change in the bandwidth or the resonance frequency response shape.
This review makes it possible to single out the following areas of applicability and directions for further development:
- (1)
- The review of works on each type of frequency and amplitude discriminator of resonance type made it possible to analyze the principles of their operation, the main causes of measurement errors and the ways to minimize and/or eliminate these errors. Based on the analysis, a comparative table of metrological characteristics such as frequency range and measurement accuracy was compiled, and further prospects for their development were discussed. That allows the developer to choose ways to solve specific problems during the development of an IFM system.
- (2)
- The analysis shows the possibilities and prospects for wider application of integrated technologies. This is confirmed by the materials presented in this review and was determined by a large amount of recent publications devoted to integrated implementations of photonic systems [80,81,82,83].
- (3)
- An overview of existing works on IFM systems shows that they also cover the issues of the instantaneous frequency measurement of multiple microwave signals simultaneously [4,37,39,49,84,85], linear frequency-modulated signals [86,87,88], pulse signals [89,90] and other special types of signals [87,88,90] that use frequency and amplitude discriminators of resonance type. Such issues are among the most important areas for research into the construction of a fully functional photonic radar.
- (4)
- Further development of the reviewed methods would make it possible to comprehensively solve the problems in the design and development of an all-photonic radar, which, together with angle of arrival estimation [91,92,93], Doppler frequency shift measurement [94,95], and optical filter design [96,97,98,99] based on the reviewed methods and means, would make it possible to create a prototype of a multifunctional information processing block for an IFM device on a single component base.
The interest of the authors was mainly related to works based on fiber Bragg gratings and phase shifted fiber Bragg gratings; therefore, these sections were presented in a more detailed manner than sections related to innovative technologies based on integrated technologies.
Author Contributions
A.I. and O.M. drafted the manuscript; O.M. supervised the work; A.I., O.M., A.S., A.K. and I.N. commented, edited, and reviewed the manuscript. All authors have read and agreed to the published version of the manuscript.
Funding
The work was supported by the RF Ministry of Science and Higher Education under the “Priority 2030” program and R&D reg. number AAAA-A20- 120122490071-1 (Agreement No. 075-03-2020-051, Topic No. fzsu-2020-0020).
Conflicts of Interest
The authors declare no conflict of interest.
References
- East, P. Fifty years of instantaneous frequency measurement. IET Radar Sonar Navig. 2012, 6, 112–122. [Google Scholar] [CrossRef]
- Tsui, J.B.Y. Electronic Warfare Microwave Receiver; Artech House: New York, NY, USA, 1993. [Google Scholar]
- Pan, S.; Yao, J. Photonics-Based Broadband Microwave Measurement. J. Light. Technol. 2016, 35, 3498–3513. [Google Scholar] [CrossRef]
- Long, X.; Zou, W.; Chen, J. Broadband instantaneous frequency measurement based on stimulated Brillouin scattering. Opt. Express 2017, 25, 2206–2214. [Google Scholar] [CrossRef]
- Nguyen, L.V.; Hunter, D.B.; Borg, D.J. Photonic Technique for Radio Frequency Measurement. In Proceedings of the 2005 International Topical Meeting on Microwave Photonics, Seoul, Korea, 14 October 2005; pp. 197–200. [Google Scholar]
- Attygalle, M.; Hunter, D.B. Improved Photonic Technique for Broadband Radio-Frequency Measurement. IEEE Photon Technol. Lett. 2008, 21, 206–208. [Google Scholar] [CrossRef]
- Zou, X.; Pan, S.; Yao, J. Instantaneous Microwave Frequency Measurement With Improved Measurement Range and Resolution Based on Simultaneous Phase Modulation and Intensity Modulation. J. Light. Technol. 2009, 27, 5314–5320. [Google Scholar]
- Li, W.; Zhu, N.H.; Wang, L.X. Reconfigurable Instantaneous Frequency Measurement System Based on Dual-Parallel Mach–Zehnder Modulator. IEEE Photon J. 2012, 4, 427–436. [Google Scholar] [CrossRef]
- Liu, L.; Xue, W. Instantaneous Microwave Frequency Measurement Based on Two Cascaded Photonic Crystal Nanocavities. IEEE Photon J. 2020, 12, 1–9. [Google Scholar] [CrossRef]
- Li, Y.; Pei, L.; Li, J.; Zheng, J.; Wang, Y.; Yuan, J.; Tang, Y. Instantaneous microwave frequency measurement with improved resolution. Opt. Commun. 2015, 354, 140–147. [Google Scholar] [CrossRef]
- Morozov, O.G.; Talipov, A.A.; Nurgazizov, M.R.; Sadeev, T.S.; Fedorov, A.G. Instantaneous frequency measurement using double-frequency probing. Proc. SPIE 2013, 8787, 878708. [Google Scholar] [CrossRef]
- Zou, X.; Lu, B.; Pan, W.; Yan, L.; Stöhr, A.; Yao, J. Photonics for microwave measurements. Laser Photon Rev. 2016, 10, 711–734. [Google Scholar] [CrossRef]
- Vostrikov, E.V.; Litvinov, E.V.; Volkovskii, S.A.; Aleinik, A.S.; Polte, G.A. Application of microwave photonics in fiber optical sensors. Sci. Tech. J. Inf. Technol. Mech. Opt. 2020, 20, 1–23. (In Russian) [Google Scholar] [CrossRef]
- Bui, L.A. Recent advances in microwave photonics instantaneous frequency measurements. Prog. Quantum Electron. 2020, 69, 100237. [Google Scholar] [CrossRef]
- Zhou, J.; Aditya, S.; Lee, K.E.K.; Shum, P.P. Instantaneous microwave frequency measurement using photonic techniques. In Proceedings of the 10th International Conference on Optical Communications and Networks (ICOCN 2011), Guangzhou, China, 5 November–7 December 2011; pp. 1–2. [Google Scholar] [CrossRef]
- Chi, H.; Zou, X.; Yao, J. An Approach to the Measurement of Microwave Frequency Based on Optical Power Monitoring. IEEE Photon Technol. Lett. 2008, 20, 1249–1251. [Google Scholar] [CrossRef]
- Zou, X.; Chi, H.; Yao, J. Microwave Frequency Measurement Based on Optical Power Monitoring Using a Complementary Optical Filter Pair. IEEE Trans. Microw. Theory Tech. 2009, 57, 505–511. [Google Scholar] [CrossRef]
- Lu, B.; Pan, W.; Zou, X.; Luo, B.; Yan, L.; Liu, X.; Xiang, S. Photonic Frequency Measurement and Signal Separation for Pulsed/CW Microwave Signals. IEEE Photon Technol. Lett. 2013, 25, 500–503. [Google Scholar] [CrossRef]
- Fu, S.; Tang, M.; Shum, P. Photonic instantaneous frequency measurement using optical carrier suppression based DC power monitoring. In Proceedings of the IEEE Photonic Society 24th Annual Meeting, Arlington, VA, USA, 9–13 October 2011; pp. 85–86. [Google Scholar] [CrossRef]
- Drummond, M.V.; Monteiro, P.; Nogueira, R.N. Photonic RF instantaneous frequency measurement system by means of a polarization-domain interferometer. Opt. Express 2009, 17, 5433–5438. [Google Scholar] [CrossRef]
- Zou, X.; Pan, W.; Luo, B.; Yan, L. Photonic Instantaneous Frequency Measurement Using a Single Laser Source and Two Quadrature Optical Filters. IEEE Photon Technol. Lett. 2010, 23, 39–41. [Google Scholar] [CrossRef]
- Ghelfi, P.; Laghezza, F.; Scotti, F.; Serafino, G.; Capria, A.; Pinna, S.; Onori, D.; Porzi, C.; Scaffardi, M.; Malacarne, A.; et al. A fully photonics-based coherent radar system. Nature 2014, 507, 341–345. [Google Scholar] [CrossRef]
- Li, Z.; Wang, C.; Li, M.; Chi, H.; Zhang, X.; Yao, J. Instantaneous Microwave Frequency Measurement Using a Special Fiber Bragg Grating. IEEE Microw. Wirel. Compon. Lett. 2010, 21, 52–54. [Google Scholar] [CrossRef]
- Li, Y.; Pei, L.; Li, J.; Wang, Y.; Yuan, J.; Ning, T. Photonic instantaneous frequency measurement of wideband microwave signals. PLoS ONE 2017, 12, e0182231. [Google Scholar] [CrossRef]
- Li, Z.; Yang, B.; Chi, H.; Zhang, X.; Zheng, S.; Jin, X. Photonic instantaneous measurement of microwave frequency using fiber Bragg grating. Opt. Commun. 2010, 283, 396–399. [Google Scholar] [CrossRef]
- Ivanov, A.A.; Morozov, O.G.; Andreev, V.A.; Morozov, G.A.; Kuznetsov, A.A.; Faskhutdinov, L.M. Microwave photonic system for instantaneous frequency measurement based on principles of “frequency-amplitude” conversion in fiber Bragg grating and additional frequency separation. Proc. SPIE 2016, 10342, 103421A. [Google Scholar] [CrossRef]
- Ni, J.; Zhang, X.M.; Zheng, S.L.; Jin, X.F.; Chi, H.; Zhang, X.M. Microwave Frequency Measurement Based on Phase Modulation to Intensity Modulation Conversion using Fiber Bragg Grating. J. Electromagn. Waves Appl. 2011, 25, 755–764. [Google Scholar] [CrossRef]
- Morozov, O.; Talipov, A.A.; Nurgazizov, M.R.; Denisenko, P.E.; Vasilets, A. Instantaneous frequency measurement of microwave signals in optical range using “frequency-amplitude” conversion in the π-phase-shifted fiber-Bragg grating. Proc. SPIE 2014, 9136, 91361B. [Google Scholar] [CrossRef]
- Burla, M.; Wang, X.; Li, M.; Chrostowski, L.; Azaña, J. Wideband dynamic microwave frequency identification system using a low-power ultracompact silicon photonic chip. Nat. Commun. 2016, 7, 13004. [Google Scholar] [CrossRef] [PubMed]
- Hunter, D.B.; Edvell, L.G.; Englund, M.A. Wideband Microwave Photonic Channelised Receiver. In Proceedings of the 2005 International Topical Meeting on Microwave Photonics, Seoul, Korea, 14 October 2005; pp. 249–252. [Google Scholar]
- Sima, C.; Cai, B.; Liu, B.; Gao, Y.; Yu, Y.; Gates, J.C.; Zervas, M.N.; Smith, P.G.R.; Liu, D. Integrated reconfigurable photonic filters based on interferometric fractional Hilbert transforms. Appl. Opt. 2017, 56, 7978–7984. [Google Scholar] [CrossRef]
- Jiang, J.; Shao, H.; Li, X.; Li, Y.; Dai, T.; Wang, G.; Yang, J.; Jiang, X.; Yu, H. Photonic-assisted microwave frequency measurement system based on a silicon ORR. Opt. Commun. 2017, 382, 366–370. [Google Scholar] [CrossRef]
- Tao, Y.; Yang, F.; Tao, Z.; Chang, L.; Shu, H.; Jin, M.; Zhou, Y.; Ge, Z.; Wang, X. Fully on-Chip Microwave Photonics System. 2022. Available online: https://arxiv.org/ftp/arxiv/papers/2202/2202.11495.pdf (accessed on 12 August 2022).
- Zhang, J.; Zhu, C.; Yang, X.; Li, Y.; Zhao, Z.; Li, C. Approach for Microwave Frequency Measurement Based on a Single Photonic Chip Combined with a Phase Modulator and Microring Resonator. Curr. Opt. Photon. 2018, 2, 576–581. [Google Scholar]
- Marpaung, D. On-Chip Photonic-Assisted Instantaneous Microwave Frequency Measurement System. IEEE Photon Technol. Lett. 2013, 25, 837–840. [Google Scholar] [CrossRef]
- Niu, J.; Fu, S.; Xu, K.; Sun, X.; Wu, J.; Lin, J.; Shum, P.P. Instantaneous microwave frequency measurement using a microfiber ring resonator (MRR) based photonic differentiator. In Proceedings of the 2011 International Topical Meeting on Microwave Photonics jointly held with the 2011 Asia-Pacific Microwave Photonics Conference, Singapore, 18–21 October 2011; pp. 226–229. [Google Scholar]
- Jiang, H.; Marpaung, D.; Pagani, M.; Vu, K.; Choi, D.; Madden, S.J.; Yan, L.; Eggleton, B.J. Wide-range, high-precision multiple microwave frequency measurement using a chip-based photonic Brillouin filter. Optica 2016, 3, 30–34. [Google Scholar] [CrossRef]
- Wang, D.; Pan, L.; Wang, Y.; Zhang, Q.; Du, C.; Wang, K.; Dong, W.; Zhang, X. Instantaneous microwave frequency measurement with high-resolution based on stimulated Brillouin scattering. Opt. Laser Technol. 2018, 113, 171–176. [Google Scholar] [CrossRef]
- Zheng, S.; Ge, S.; Zhang, X.; Chi, H.; Jin, X. High-Resolution Multiple Microwave Frequency Measurement Based on Stimulated Brillouin Scattering. IEEE Photonics Technol. Lett. 2012, 24, 1115–1117. [Google Scholar] [CrossRef]
- Li, J.; Xu, P.; Song, K.; Du, K.; Lu, M.; Yu, X.; Yao, Y. A Scheme of Instantaneous Frequency Measurement with High Precision Assisted by Photonics. Int. J. Opt. Photonic Eng. 2021, 6, 38. [Google Scholar]
- Zhu, B.; Zhang, W.; Pan, S.; Yao, J. High-Sensitivity Instantaneous Microwave Frequency Measurement Based on a Silicon Photonic Integrated Fano Resonator. J. Light. Technol. 2018, 37, 2527–2533. [Google Scholar] [CrossRef]
- Shu, X.; Turitsyna, E.; Bennion, I. Broadband fiber Bragg grating with channelized dispersion. Opt. Express 2007, 15, 10733–10738. [Google Scholar] [CrossRef] [PubMed]
- Isa, N.; Altuncu, A. Design of a chirped fiber Bragg grating for use in wideband dispersion compensation. Advances in Computer Science and Engineering: Reports and Monographs. New Trends Comput. Netw. 2005, 114–123. [Google Scholar] [CrossRef]
- Vidal, B. Photonic-based instantaneous microwave frequency measurement with extended range. Opt. Commun. 2011, 284, 3996–3999. [Google Scholar] [CrossRef]
- Zhang, X.; Ni, J.; Cheng, P.; Li, Z. Microwave Frequency Measurement Using Fiber Bragg Grating as V-shape Filter. In Proceedings of the 2010 International Conference on Digital Manufacturing & Automation, Changcha, China, 18–20 December 2010; pp. 921–924. [Google Scholar] [CrossRef]
- Morozov, O.G.; Stepuschenko, O.A.; Sadykov, I.R. Modulation measuring methods in optical refractometric biosensors based on the phase-shift fiber Bragg grating. Vestn. MarSTU 2010, 3, 3–13. [Google Scholar]
- Morozov, O.G.; Talipov, A.A.; Nurgazizov, M.R.; Vasilets, A.A. Instantaneous microwave frequency measurement with monitoring of system temperature. Proc. SPIE 2014, 9156, 91560N. [Google Scholar] [CrossRef]
- Yongkang, G.; Xueming, L.; Leiran, W. Optimized synthesis of fiber Bragg gratings with triangular spectrum for wave-length-interrogation application. Opt. Eng. 2011, 50, 024401. [Google Scholar]
- Ming, L.; Junya, H.; Hongpu, L. Advanced design of a complex fiber Bragg grating for a multichannel asymmetrical triangular filter. J. Opt. Soc. Am. B 2009, 26, 228–234. [Google Scholar]
- Liu, Y.; Lee, S.B.; Choi, S.S. Phase-Shifted Fiber Bragg Grating Transmission Filters Based on the Fabry-Perot Effect. J. Opt. Soc. Korea 1998, 2, 30–33. [Google Scholar] [CrossRef]
- Das, B.; Srivastava, D.; Tiwari, U.K.; Choudhary, B.C. Dynamic strain response of a π-phase-shifted FBG sensor with phase-sensitive detection. OSA Contin. 2018, 1, 1172–1184. [Google Scholar] [CrossRef]
- Falah, A.A.S.; Mokhtar, M.R.; Yusoff, Z.; Ibsen, M. Reconfigurable Phase Shifted Fiber Bragg Grating Using Localized Micro-Strain. IEEE Photon Technol. Lett. 2016, 28, 951–954. [Google Scholar] [CrossRef]
- Loh, W.H.; Cole, M.J.; Zervas, M.N.; Barcelos, S.; Laming, R.I. Complex grating structures with uniform phase masks based on the moving fiber–scanning beam technique. Opt. Lett. 1995, 20, 2051–2053. [Google Scholar] [CrossRef]
- Du, Y.; Chen, T.; Zhang, Y.; Wang, R.; Cao, H.; Li, K. Fabrication of Phase-Shifted Fiber Bragg Grating by Femtosecond Laser Shield Method. IEEE Photon Technol. Lett. 2017, 29, 2143–2146. [Google Scholar] [CrossRef]
- Li, M.; Li, H.; Painchaud, Y. Multi-channel notch filter based on a phase-shift phase-only-sampled fiber Bragg grating. Opt. Express 2008, 16, 19388–19394. [Google Scholar] [CrossRef]
- Li, W.; Li, M.; Yao, J. A Narrow-Passband and Frequency-Tunable Microwave Photonic Filter Based on Phase-Modulation to Intensity-Modulation Conversion Using a Phase-Shifted Fiber Bragg Grating. IEEE Trans. Microw. Theory Tech. 2012, 60, 1287–1296. [Google Scholar] [CrossRef]
- Painchaud, Y.; Aubé, M.; Brochu, G.; Picard, M.-J. Ultra-narrowband notch filtering with highly resonant fiber Bragg gratings. In Proceedings of the Advanced Photonics & Renewable Energy, Karlsruhe, Germany, 21–24 June 2010; p. BTuC3. [Google Scholar] [CrossRef]
- Donzella, V.; Sherwali, A.; Flueckiger, J.; Grist, S.M.; Fard, S.T.; Chrostowski, L. Design and fabrication of SOI micro-ring resonators based on sub-wavelength grating waveguides. Opt. Express 2015, 23, 4791–4803. [Google Scholar] [CrossRef]
- Cheng, X.; Hong, J.; Spring, A.M.; Yokoyama, S. Fabrication of a high-Q factor ring resonator using LSCVD deposited Si_3N_4 film. Opt. Mater. Express 2017, 7, 2182. [Google Scholar] [CrossRef]
- Wang, Z.; Paez, D.; El-Rahman, A.I.A.; Wang, P.; Dow, L.; Cartledge, J.C.; Knights, A.P. Resonance control of a silicon mi-cro-ring resonator modulator under high-speed operation using the intrinsic defect-mediated photocurrent. Opt. Express 2017, 25, 24827–24836. [Google Scholar] [CrossRef] [PubMed]
- Fegadolli, W.S.; Almeida, V.R.; Oliveira, J.E.B. Reconfigurable silicon thermo-optical device based on spectral tuning of ring resonators. Opt. Express 2011, 19, 12727–12739. [Google Scholar] [CrossRef] [PubMed]
- Yariv, A. Critical coupling and its control in optical waveguide-ring resonator systems. IEEE Photon Technol. Lett. 2002, 14, 483–485. [Google Scholar] [CrossRef]
- Geuzebroek, D.H.; Driessen, A. Ring-Resonator-Based Wavelength Filters. In Wavelength Filters in Fibre Optics; Venghaus, H., Ed.; Springer Series in Optical Sciences; Springer: Berlin/Heidelberg, Germany, 2006; Volume 123, pp. 341–379. [Google Scholar]
- Billah, M.R.; Blaicher, M.; Hoose, T.; Dietrich, P.-I.; Marin-Palomo, P.; Lindenmann, N.; Nesic, A.; Hofmann, A.; Troppenz, U.; Moehrle, M.; et al. Hybrid integration of silicon photonics circuits and InP lasers by photonic wire bonding. Optica 2018, 5, 876–883. [Google Scholar] [CrossRef]
- Xiang, C.; Liu, J.; Guo, J.; Chang, L.; Wang, R.N.; Weng, W.; Peters, J.; Xie, W.; Zhang, Z.; Riemensberger, J.; et al. Laser soliton microcombs heterogeneously integrated on silicon. Science 2021, 373, 99–103. [Google Scholar] [CrossRef] [PubMed]
- Thomson, D.; Zilkie, A.; Bowers, J.E.; Komljenovic, T.; Reed, G.T.; Vivien, L.; Marris-Morini, D.; Cassan, E.; Virot, L.; Fédéli, J.-M.; et al. Roadmap on silicon photonics. J. Opt. 2016, 18, 073003. [Google Scholar] [CrossRef]
- Zeng, X.; He, W.; Frosz, M.H.; Geilen, A.; Roth, P.; Wong, G.K.L.; Russell, P.S.; Stiller, B. Stimulated Brillouin scattering in chiral photonic crystal fiber. Photon Res. 2022, 10, 711. [Google Scholar] [CrossRef]
- Gyger, F.; Liu, J.; Yang, F.; He, J.; Raja, A.S.; Wang, R.N.; Bhave, S.A.; Kippenberg, T.J.; Thévenaz, L. Observation of Stimulated Brillouin Scattering in Silicon Nitride Integrated Waveguides. Phys. Rev. Lett. 2020, 124, 013902. [Google Scholar] [CrossRef]
- Merklein, M.; Casas-Bedoya, A.; Marpaung, D.; Buttner, T.F.S.; Pagani, M.; Morrison, B.; Kabakova, I.V.; Eggleton, B.J. Stimulated Brillouin Scattering in Photonic Integrated Circuits: Novel Applications and Devices. IEEE J. Sel. Top. Quantum Electron. 2016, 22, 336–346. [Google Scholar] [CrossRef]
- Reintjes, J.F. Nonlinear Optical Processes. In Encyclopedia of Physical Science and Technology, 3rd ed.; Robert, A., Meyers, R.A., Eds.; Academic Press: Cambridge, MA, USA, 2003; pp. 537–581. [Google Scholar]
- Bashkansky, M.; Reintjes, J. SCATTERING | Stimulated Scattering. In Encyclopedia of Modern Optics; Robert, D., Guenther, R.D., Eds.; Elsevier: Amsterdam, The Netherlands, 2005; pp. 330–340. [Google Scholar]
- Kobyakov, A.; Sauer, M.; Chowdhury, D. Stimulated Brillouin scattering in optical fibers. Adv. Opt. Photon. 2010, 2, 1–59. [Google Scholar] [CrossRef]
- Ma, D.; Zuo, P.; Chen, Y. Time–frequency analysis of microwave signals based on stimulated Brillouin scattering. Opt. Commun. 2022, 516, 128228. [Google Scholar] [CrossRef]
- Debut, A.; Randoux, S.; Zemmouri, J. Linewidth narrowing in Brillouin lasers: Theoretical analysis. Phys. Rev. A 2000, 62, 023803. [Google Scholar] [CrossRef]
- Zhou, W.; Zhao, D.; Shuai, Y.-C.; Yang, H.; Chuwongin, S.; Chadha, A.; Seo, J.-H.; Wang, K.X.; Liu, V.; Ma, Z.; et al. Progress in 2D photonic crystal Fano resonance photonics. Prog. Quantum Electron. 2014, 38, 1–74. [Google Scholar] [CrossRef]
- Limonov, M.F.; Rybin, M.; Poddubny, A.; Kivshar, Y.S. Fano resonances in photonics. Nat. Photon. 2017, 11, 543–554. [Google Scholar] [CrossRef]
- Yu, Y.; Heuck, M.; Hu, H.; Xue, W.; Peucheret, C.; Chen, Y.; Oxenløwe, L.K.; Yvind, K.; Mørk, J. Fano resonance control in a photonic crystal structure and its application to ultrafast switching. Appl. Phys. Lett. 2014, 105, 061117. [Google Scholar] [CrossRef]
- Limonov, M.F. Fano resonance for applications. Adv. Opt. Photon. 2021, 13, 703–771. [Google Scholar] [CrossRef]
- Zhang, W.; Li, W.; Yao, J. Optically tunable Fano resonance in a grating-based Fabry–Perot cavity-coupled microring resonator on a silicon chip. Opt. Lett. 2016, 41, 2474–2477. [Google Scholar] [CrossRef]
- Guo, H.; Xiao, G.; Mrad, N.; Yao, J. Measurement of microwave frequency using a monolithically integrated scannable echelle diffractive grating. IEEE Photon. Tech. Lett. 2009, 34, 45–47. [Google Scholar]
- Fandiño, J.S.; Muñoz, P. Photonics-based microwave frequency measurement using a double-sideband suppressed-carrier modulation and an InP integrated ring-assisted Mach–Zehnder interferometer filter. Opt. Lett. 2013, 38, 4316–4319. [Google Scholar] [CrossRef]
- Marpaung, D.; Yao, J.; Capmany, J. Integrated microwave photonics. Nat. Photonics 2019, 13, 80–90. [Google Scholar] [CrossRef]
- Zhang, W.; Yao, J. Silicon-Based Integrated Microwave Photonics. IEEE J. Quantum Electron. 2015, 52, 1–12. [Google Scholar] [CrossRef]
- Sakhabutdinov, A.J.; Morozov, O.G.; Ivanov, A.A.; Misbakhov, R.S. Multiple frequencies analysis in FBG based instantaneous frequency measurements. In Proceedings of the 2018 Systems of Signals Generating and Processing in the Field of on Board Communications, Moscow, Russia, 14–15 March 2018; pp. 1–5. [Google Scholar]
- Shen, Z.; Jin, C.; He, Q.; Zhang, Z.; Zhao, Y. Photonics-Assisted Non-Scanning High-Accuracy Frequency Measurement Using Low-Speed Components. IEEE Photon J. 2019, 11, 1–8. [Google Scholar] [CrossRef]
- Zhang, B.; Wang, X.; Pan, S. Photonics-Based Instantaneous Multi-Parameter Measurement of a Linear Frequency Modulation Microwave Signal. J. Light. Technol. 2018, 36, 2589–2596. [Google Scholar] [CrossRef]
- Wang, X.; Yang, Y.-L.; Xu, Y.-Q.; Cao, Y.; Zou, W.-W. Power-Independent Microwave Instantaneous Frequency Measurement Based on Combination of Brillouin Gain and Loss Spectra. IEEE Photon J. 2022, 14, 1–7. [Google Scholar] [CrossRef]
- Lu, B.; Pan, W.; Zou, X.; Jiang, H.; Yan, X.; Li, P.; Zou, F.; Yan, L.; Luo, B. Photonic-Assisted Intrapulse Parameters Measurement of Complex Microwave Signals. J. Light. Technol. 2018, 36, 3633–3644. [Google Scholar] [CrossRef]
- Fu, S.; Zhou, J.; Shum, P.P.; Lee, K. Instantaneous Microwave Frequency Measurement Using Programmable Differential Group Delay (DGD) Modules. IEEE Photon J. 2010, 2, 967–973. [Google Scholar] [CrossRef]
- Yao, Y.; Zhao, Y.; Wei, Y.; Zhou, F.; Chen, D.; Zhang, Y.; Xiao, X.; Dong, J.; Yu, S.; Zhang, X. Fully integrated multipurpose microwave frequency identification system on a single chip. In Proceedings of the Conference on Lasers and Electro-Optics, San Jose, CA, USA, 15–20 May 2022; p. SM3N.5. [Google Scholar] [CrossRef]
- Morozov, O.G.; Denisenko, E.P.; Denisenko, P.E.; Lustina, A.A.; Andreev, V.D. Radiophotonic Method for Angle of Arrival Estimation of a Reflected Radar Signal Based on Tandem Amplitude-Phase Modulation. In Proceedings of the 2022 Systems of Signals Generating and Processing in the Field of on Board Communications, Moscow, Russia, 15–17 March 2022; pp. 1–5. [Google Scholar] [CrossRef]
- Lin, T.; Zhang, Z.; Wang, Y.; Zhu, Z.; Zhao, S.; Liu, J.; Jiang, W.; Wu, G. Photonic 2-D angle-of-arrival estimation based on an L-shaped antenna array for an early radar warning receiver. Opt. Express 2020, 28, 38960–38972. [Google Scholar] [CrossRef]
- Tu, Z.; Wen, A.; Xiu, Z.; Zhang, W.; Chen, M. Angle-of-Arrival Estimation of Broadband Microwave Signals Based on Microwave Photonic Filtering. IEEE Photonics J. 2017, 9, 1–8. [Google Scholar] [CrossRef]
- Morozov, O.G.; Ivanov, A.A.; Sakhabutdinov, A.Z.; Denisenko, P.E.; Morozov, G.A.; Denisenko, E.P.; Lustina, A.A.; Andreev, V.D. Radiophotonic module for Doppler frequency shift measurement of a reflected signal for radar type problems solving. Proc. SPIE 2022, 12295, 122950A. [Google Scholar] [CrossRef]
- Zhuo, H.; Wen, A.; Tu, Z. Photonic Doppler frequency shift measurement without ambiguity based on cascade modulation. Opt. Commun. 2020, 470, 125798. [Google Scholar] [CrossRef]
- Fallahi, V.; Seifouri, M. Design of a High-Quality Optical Filter Based on 2D Photonic Crystal Ring Resonator for WDM Systems. J. Opt. Commun. 2018, 41, 355–361. [Google Scholar] [CrossRef]
- Arianfard, H.; Wu, J.; Juodkazis, S.; Moss, D.J. Advanced Multi-Functional Integrated Photonic Filters Based on Coupled Sagnac Loop Reflectors. J. Light. Technol. 2021, 39, 1400–1408. [Google Scholar] [CrossRef]
- Foroughifar, A.; Saghaei, H.; Veisi, E. Design and analysis of a novel four-channel optical filter using ring resonators and line defects in photonic crystal microstructure. Opt. Quantum Electron. 2021, 53, 101. [Google Scholar] [CrossRef]
- Daulay, O.; Botter, R.; Marpaung, D. On-chip programmable microwave photonic filter with an integrated optical carrier processor. OSA Contin. 2020, 3, 2166. [Google Scholar] [CrossRef]
Publisher’s Note: MDPI stays neutral with regard to jurisdictional claims in published maps and institutional affiliations. |
© 2022 by the authors. Licensee MDPI, Basel, Switzerland. This article is an open access article distributed under the terms and conditions of the Creative Commons Attribution (CC BY) license (https://creativecommons.org/licenses/by/4.0/).