Article

SHG in Micron-Scale Layers of Glasses: Electron Beam Irradiation vs. Thermal Poling

1
Laboratory of Optics of Heterogeneous Structure and Optical Materials, Alferov University, St. Petersburg 194021, Russia
2
Institute of Physics and Mechanics, Peter the Great St. Petersburg Polytechnic University, St. Petersburg 195251, Russia
3
Institute of Electronics and Telecommunications, Peter the Great St. Petersburg Polytechnic University, St. Petersburg 195251, Russia
*
Author to whom correspondence should be addressed.
Photonics 2022, 9(10), 733; https://doi.org/10.3390/photonics9100733
Submission received: 27 September 2022 / Revised: 2 October 2022 / Accepted: 5 October 2022 / Published: 7 October 2022
(This article belongs to the Special Issue Micro-Nano Optics and High-End Measurement Instruments)

Abstract

:
In this work, we studied the introduction of second-order optical nonlinearity (SON) into subsurface layer soda-lime and alkali-free flint glasses using two different techniques: electron beam irradiation and thermal poling in an open anode configuration. The experiments showed that thermally poled soda-lime glass and e-beam poled flint glass demonstrated noticeable second-harmonic generation (SHG) with their second-harmonic (SH) signals being close in magnitude. The performed estimates showed that the coincidence in the SH signal intensity in these two glasses cannot be explained in the frames of the model that relates the second-order nonlinear susceptibility with the third-order susceptibility and the “frozen” electric field in glasses (EFISH model). This supposes another mechanism of SON in thermally poled soda-lime glass. We believe that this mechanism is the dipole orientation of entities injected into the soda-lime glass during thermal poling in an open anode configuration.

Graphical Abstract

1. Introduction

Silicate glasses are a very attractive material for optics due to their low cost, transparency, low optical loss, and ease of fabrication of optical elements based on them. That is why the use of glasses in at least a small part of those applications in which optically nonlinear crystals are currently used is of interest. Glasses are optically isotropic, that is, nonlinear optical and electro-optical effects of the second order, like second-harmonic generation (SHG) and the electro-optical Pockels effect, are forbidden in them. However, in the early 1990s, pioneering research by Okada [1] and Russel and Kazansky [2,3] showed that both thermal poling and electron irradiation (e-beam poling) of glasses make it possible to break their central symmetry. Numerous studies performed during the following three decades were mainly concentrated on the physics of SHG in poled glasses and the applications of thermal poling [4,5,6,7], and much less attention was paid to SHG in glasses irradiated with an electron beam. After the first studies of silicate glasses [3,8], researchers concentrated on the initiation of SHG via electron irradiation of chalcogenide glasses [9,10] and composites [11,12]. In both the thermal and e-beam poling of glasses, a “frozen” electric charge formed in the glasses governed the second-order optical nonlinearity (SON) due to the static electric field generated by the charge. Despite the long period of studies of thermally poled glasses, the physics of their SON and second harmonic (SH) signal appearance, respectively, are still under discussion. The dominating explanation of the SON relates poling-induced second-order nonlinear susceptibility χ(2) with the third-order nonlinear susceptibility χ(3) (non-zero for isotropic media) in the presence of the electric field “frozen” in the glass, χ(2)~χ(3)E—also called the electric-field-induced second harmonic (EFISH) model [13]. An alternative interpretation supposes that SON is partly or even mainly associated with the electric-field-induced orientation of dipole structures formed in glasses under poling [14,15,16]. Recently, an indication of dipolar orientation and related SON in a soda-lime glass subjected to thermal poling has been reported [17].
In thermal poling of multicomponent glasses containing mobile metal ions, the formation of the negative charge responsible for the generation of the static electric field occurs in parallel with a significant change in the composition and, in many cases, the structure of the subsurface glass region [18,19,20]. These are due to a drift of positive metal ions from that region and, in the case of poling in an open anode configuration, an inflow of hydrogenated species and nitrogen from the atmosphere [18,20]. During electron beam irradiation, glass modification due to the influx of atmospheric particles is excluded, since electron beam irradiation must be carried out in a vacuum; however, some compositional and structural modifications are possible because of the drift of positive ions under the action of the electric field of trapped electrons [21] (damage of glasses by high-energy electrons [22] is out of the present consideration). It is worth noting that such reported modifications were relatively high, up to tens of mQ/cm2 irradiation charge surface density (ICSD) [21,23,24] at energies below 50 keV. Interestingly, these modifications are similar to the modifications of glasses under thermal poling, as depletion of the subsurface layer of glasses with alkalis and an increase in glass network connectivity take place in both cases [18,19,25]. We believe that the comparison of thermal and e-beam poling of glasses should allow a better understanding of the origin of the SON formation. In this study, we compared the SHG in e-beam (µQ scale ICSD) and thermally poled soda-lime and flint (containing lead and barium) glass and performed modeling to evaluate the SHG signal generated by the “frozen” charge distribution. This helped us to reveal an essential difference in the origin of SON in these glasses.

2. Materials and Methods

For experiments and modeling, we used commercially available Menzel soda-lime glass [26] and Russian lead- and barium-containing flint glass BF16, the atomic compositions of which are presented in Table 1. In e-beam experiments, we irradiated 1 mm thick slides of the glasses with deposited 80 nm thick aluminum film using a JEBD-2 (JEOL, Tokyo, Japan) scanning electron microscope. Using a raster electron beam with a diameter of 1 mm, we irradiated areas of about 2.5 × 3 mm2 in size. The energy and the total electron charge varied from 4 to 32 keV and from 0.2 to 40 µC/cm2, respectively. In all experiments, the electron irradiation time was in the range of minutes. In the second set of experiments, we performed thermal poling of Menzel and BF16 glasses at 300 °C in air atmosphere under 800 V DC using pressed stainless electrodes and a standard setup [17]. Pressed electrodes provide an open anode poling configuration, which allows the atmosphere to access the glass and, if the glass contains alkali ions, results in the replacement of these ions by hydrogen/hydronium ions in the subsurface glass region. Thus, the thickness of the poled layer corresponds to the thickness of the subsurface glass region depleted with sodium. The sodium concentration profile was measured along the cleaved edge of the glass slide using a TESCAN LYRA3 scanning electron microscope (SEM) with an Oxford Instruments Aztec Live Automated energy-dispersive system (United Kingdom). Additionally, the position of the “frozen” negative electric charge, which corresponds to the end of the region depleted of sodium, was defined as the position of maximum scattering of electrons during SEM measurements [27]. Both the measured sodium concentration profile (Figure 1a) and the position of the “frozen” electric charge (white line in Figure 1b) indicated the thickness of the poled layer at ~2 µm.
We used the atomic composition of the glasses presented in Table 1 to simulate the electron distribution after the irradiation with the CASINO package based on the Monte Carlo method [28].
We compared the SHG efficiency in prepared glasses that were thermally poled and irradiated with an electron beam (electron energy 20 keV at the ICSD 1.8 µQ/cm2) using the standard Maker-fringes technique [29]. For the SHG excitation, we used a Nd:YAG laser (Litron, Rugby, United Kingdom) with p-polarized 6 ns pulses at 1064 nm wavelength; the details of the experiment are described elsewhere [17]. To check the uniformity of the prepared samples, we also performed a 2D scan of the e-beam-irradiated and thermally poled areas using a two-coordinate motorized platform (Standa, Vilnius, Lithuania). In this experiment, the samples were tilted by 63° relative to the laser beam, since this angle of incidence corresponds to the maximum SHG efficiency [30].

3. Results

3.1. Measurements

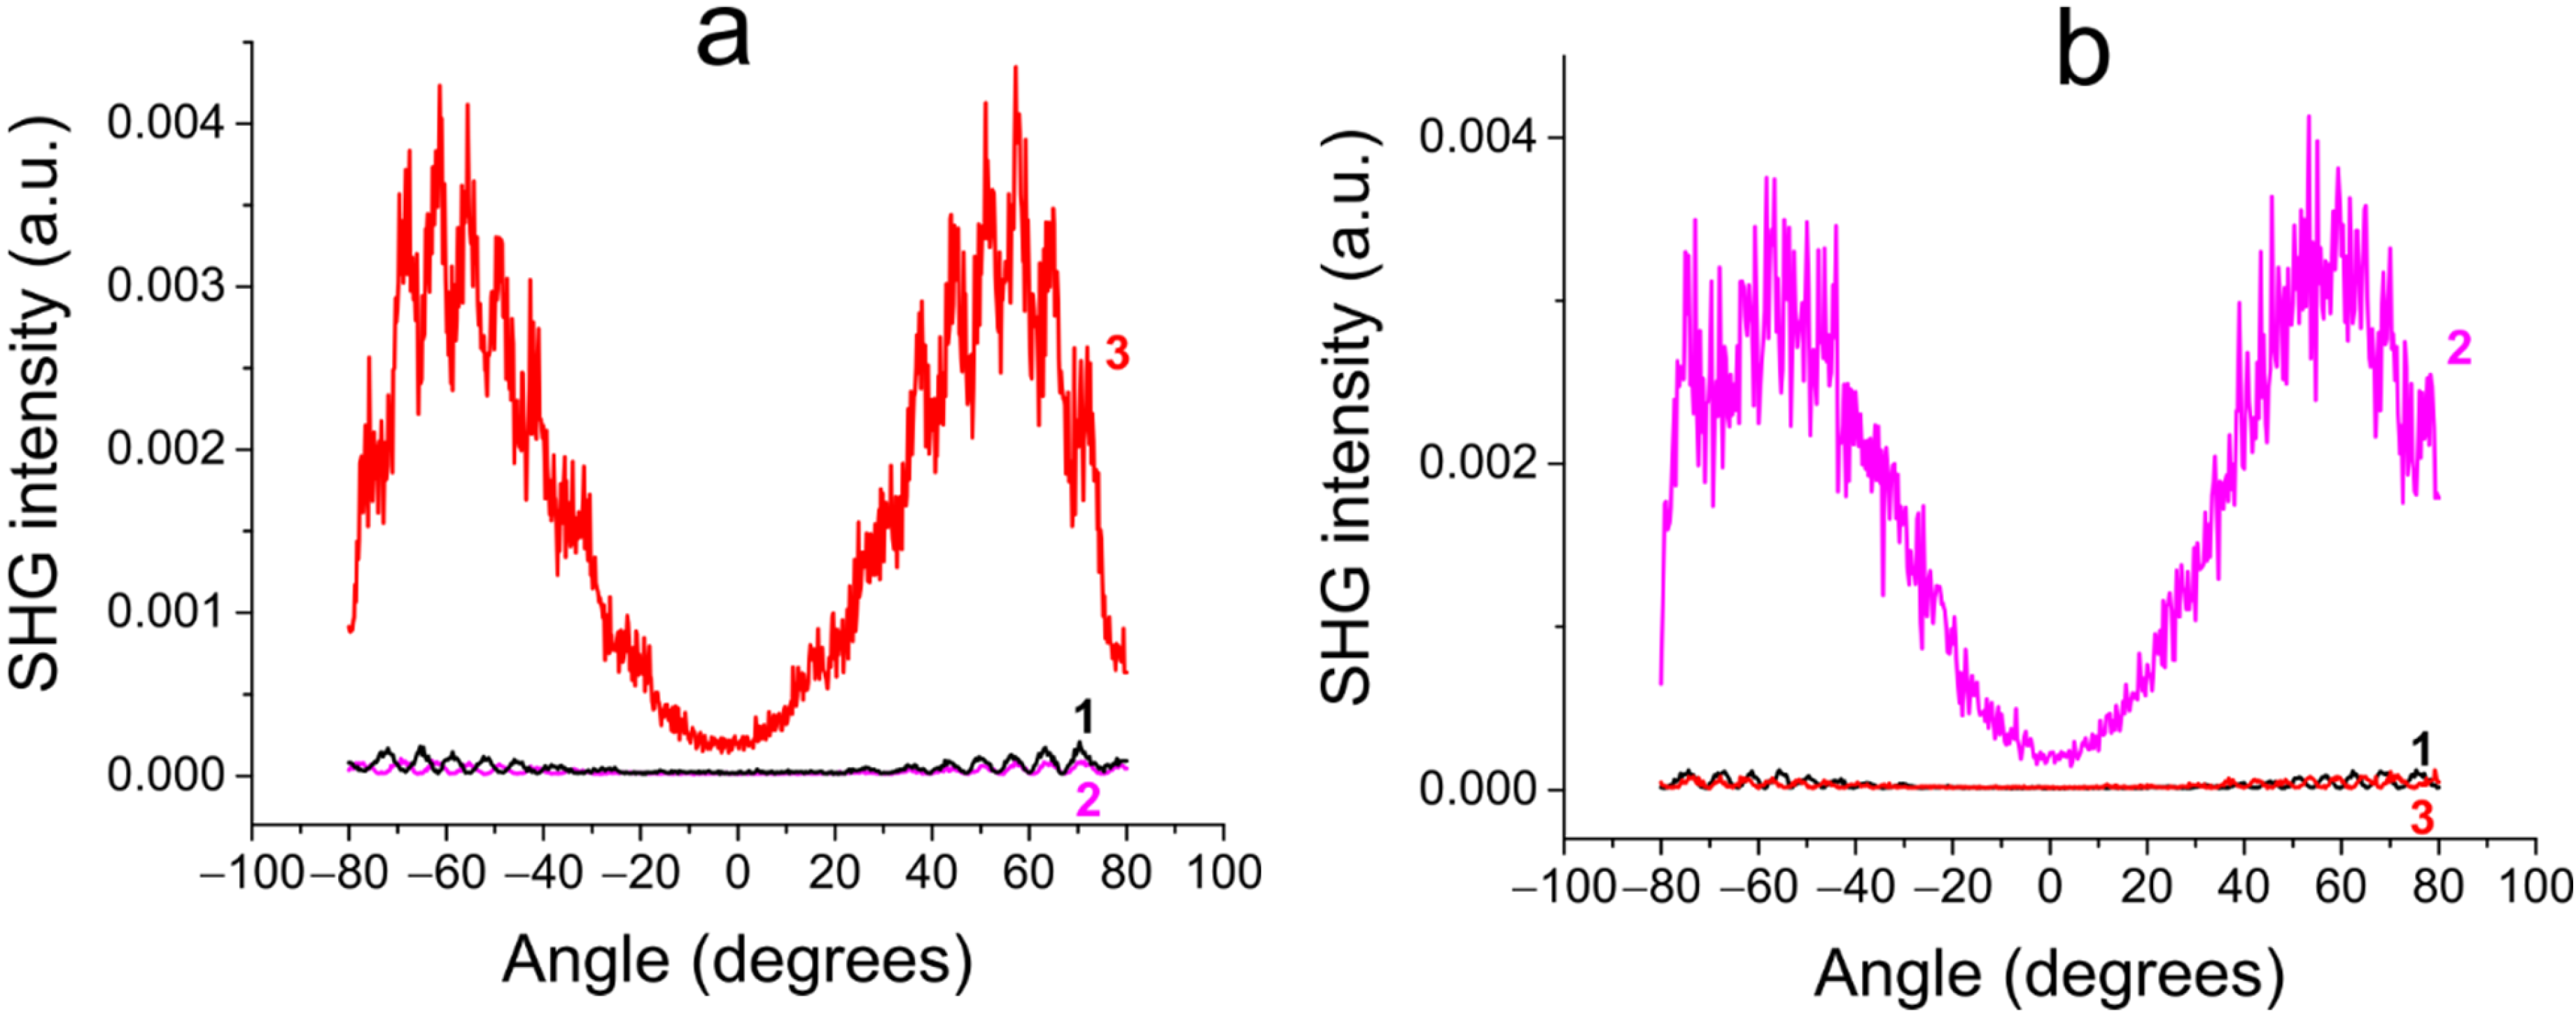
In the SHG measurements of electron-irradiated soda-lime (Menzel) glass (VWR International, Radnor, PA, USA), we did not observe the SHG signal differing from the signal from the surface of a virgin glass sample. A similar result was reported by Kazansky and coauthors [3]. In contrast, for thermally poled Menzel glass, we obtained the SHG signal, essentially exceeding the one generated by the glass surface. The opposite behavior was demonstrated by BF16 glass. The SHG signal from the thermally poled BF16 glass slide within the measurements’ accuracy coincided with the signal from the virgin slide. However, e-beam poling of this glass resulted in noticeable SHG generation. A summary of these results is shown in Table 2.
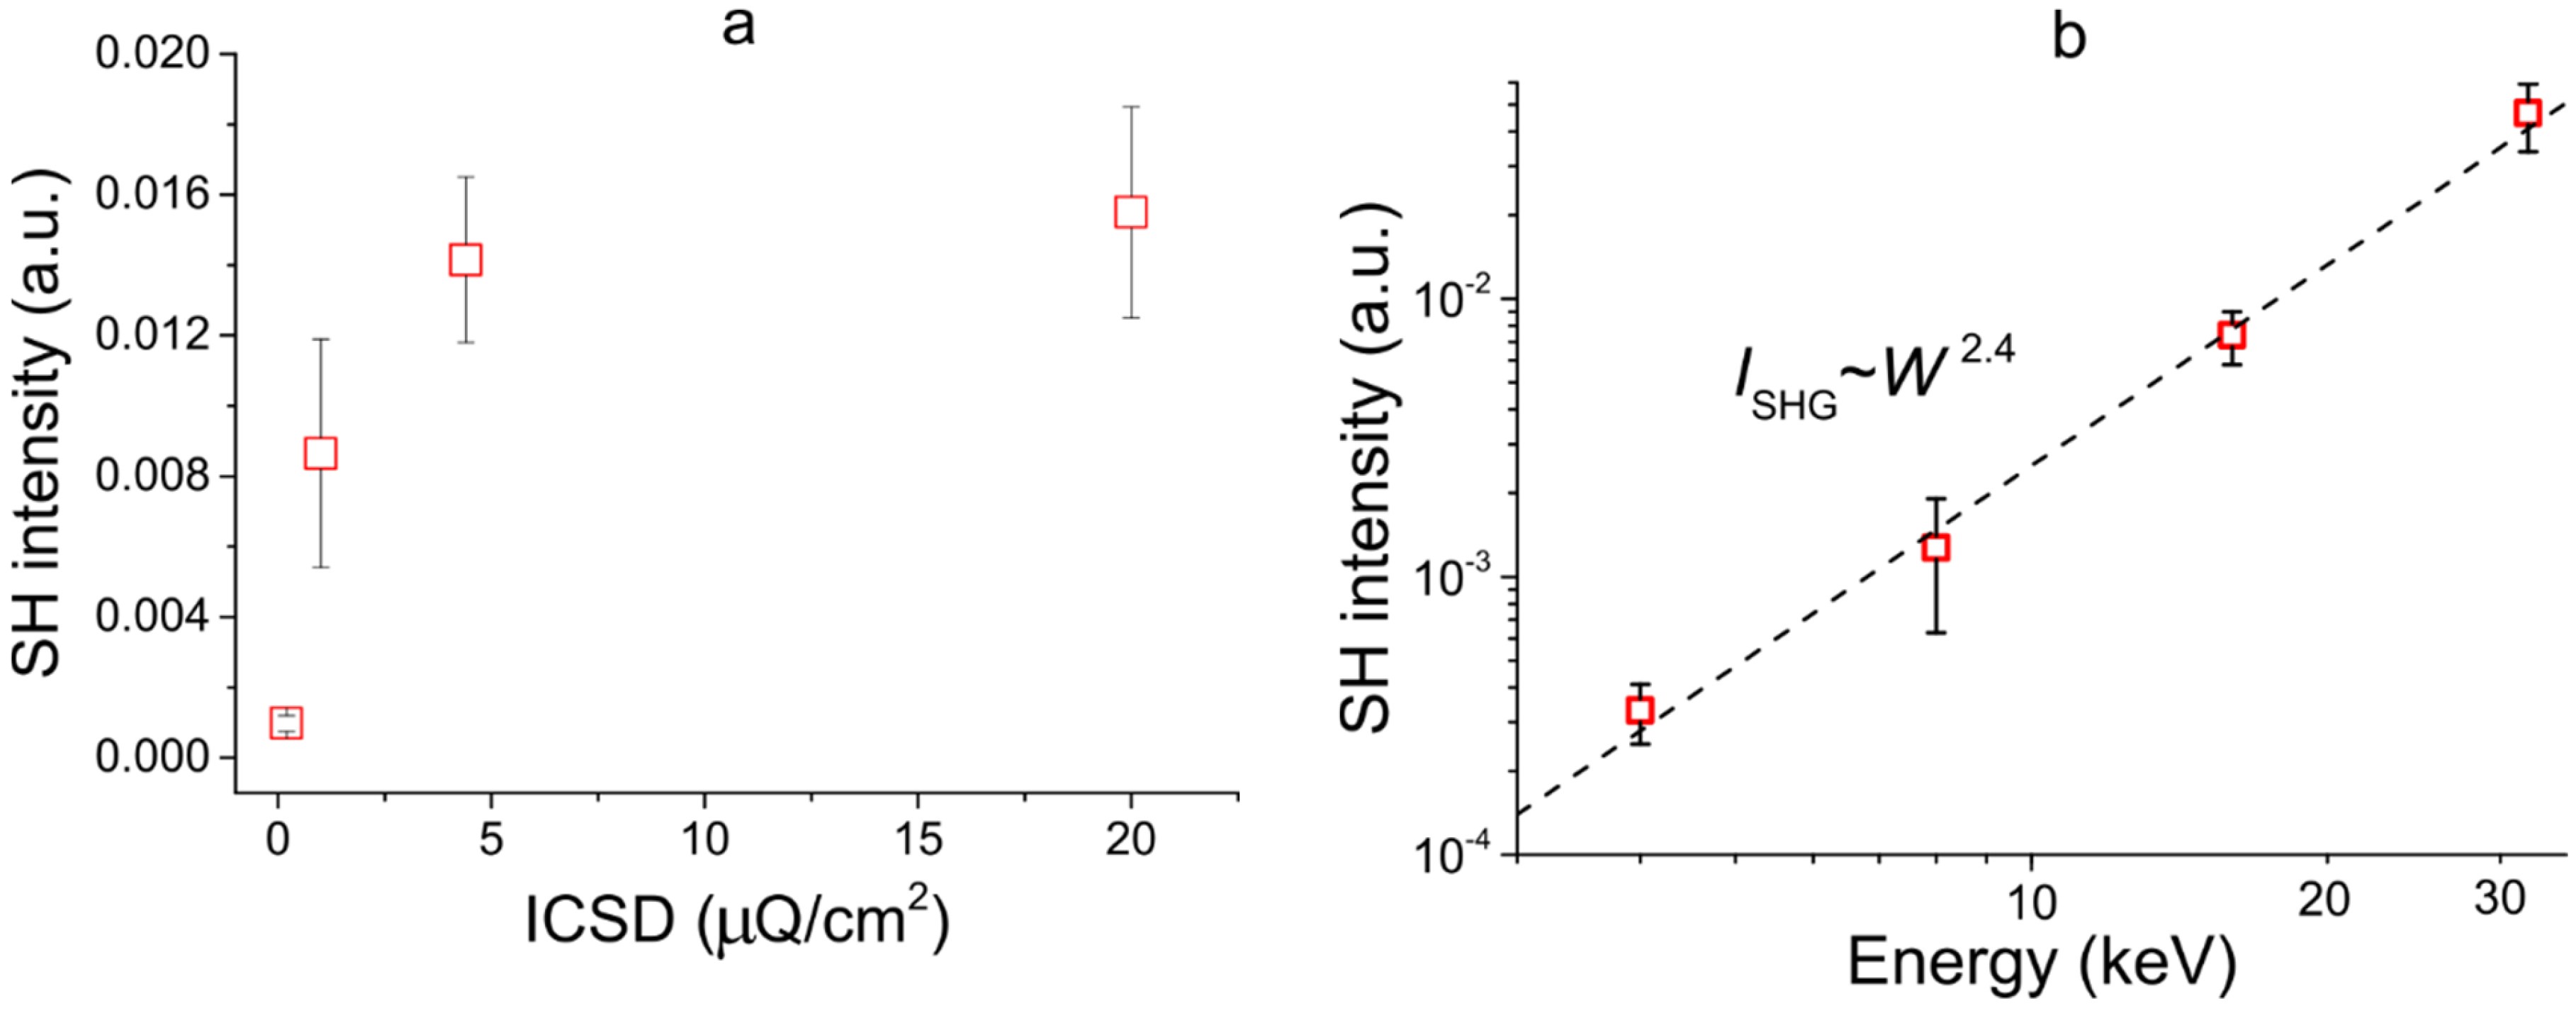
Interestingly, under the selected poling conditions, the magnitudes of the SHG signal from the thermally poled Menzel glass and the e-beam poled BF16 glass coincided. The measured SHG Maker-fringes patterns are presented in Figure 2. The maps of the SHG signal from thermally poled Menzel glass and e-beam-poled BF16 glass are presented in Figure 3. It is seen that the irradiated area of the glasses shows a reasonably uniform SHG signal, while in the non-irradiated area, the signal is negligible. To characterize the e-beam poling of BF16 glass, we measured the dependence of the SHG signal from BF16 glass on e-beam energy and ICSD. For each e-beam poling regime, we averaged the SHG signal over the irradiated area, and this value was taken as the magnitude of the SHG signal for a certain beam energy and electron charge. The dependence of the SHG signal on the irradiation regimes is presented in Figure 4.
It is seen from Figure 4a that the intensity of the SHG signal demonstrates fast saturation with the increase of ICSD. The dependence of the intensity of the second harmonic on the beam energy W has the form of a power function, ISHGW2.4 (Figure 4b).

3.2. Modeling

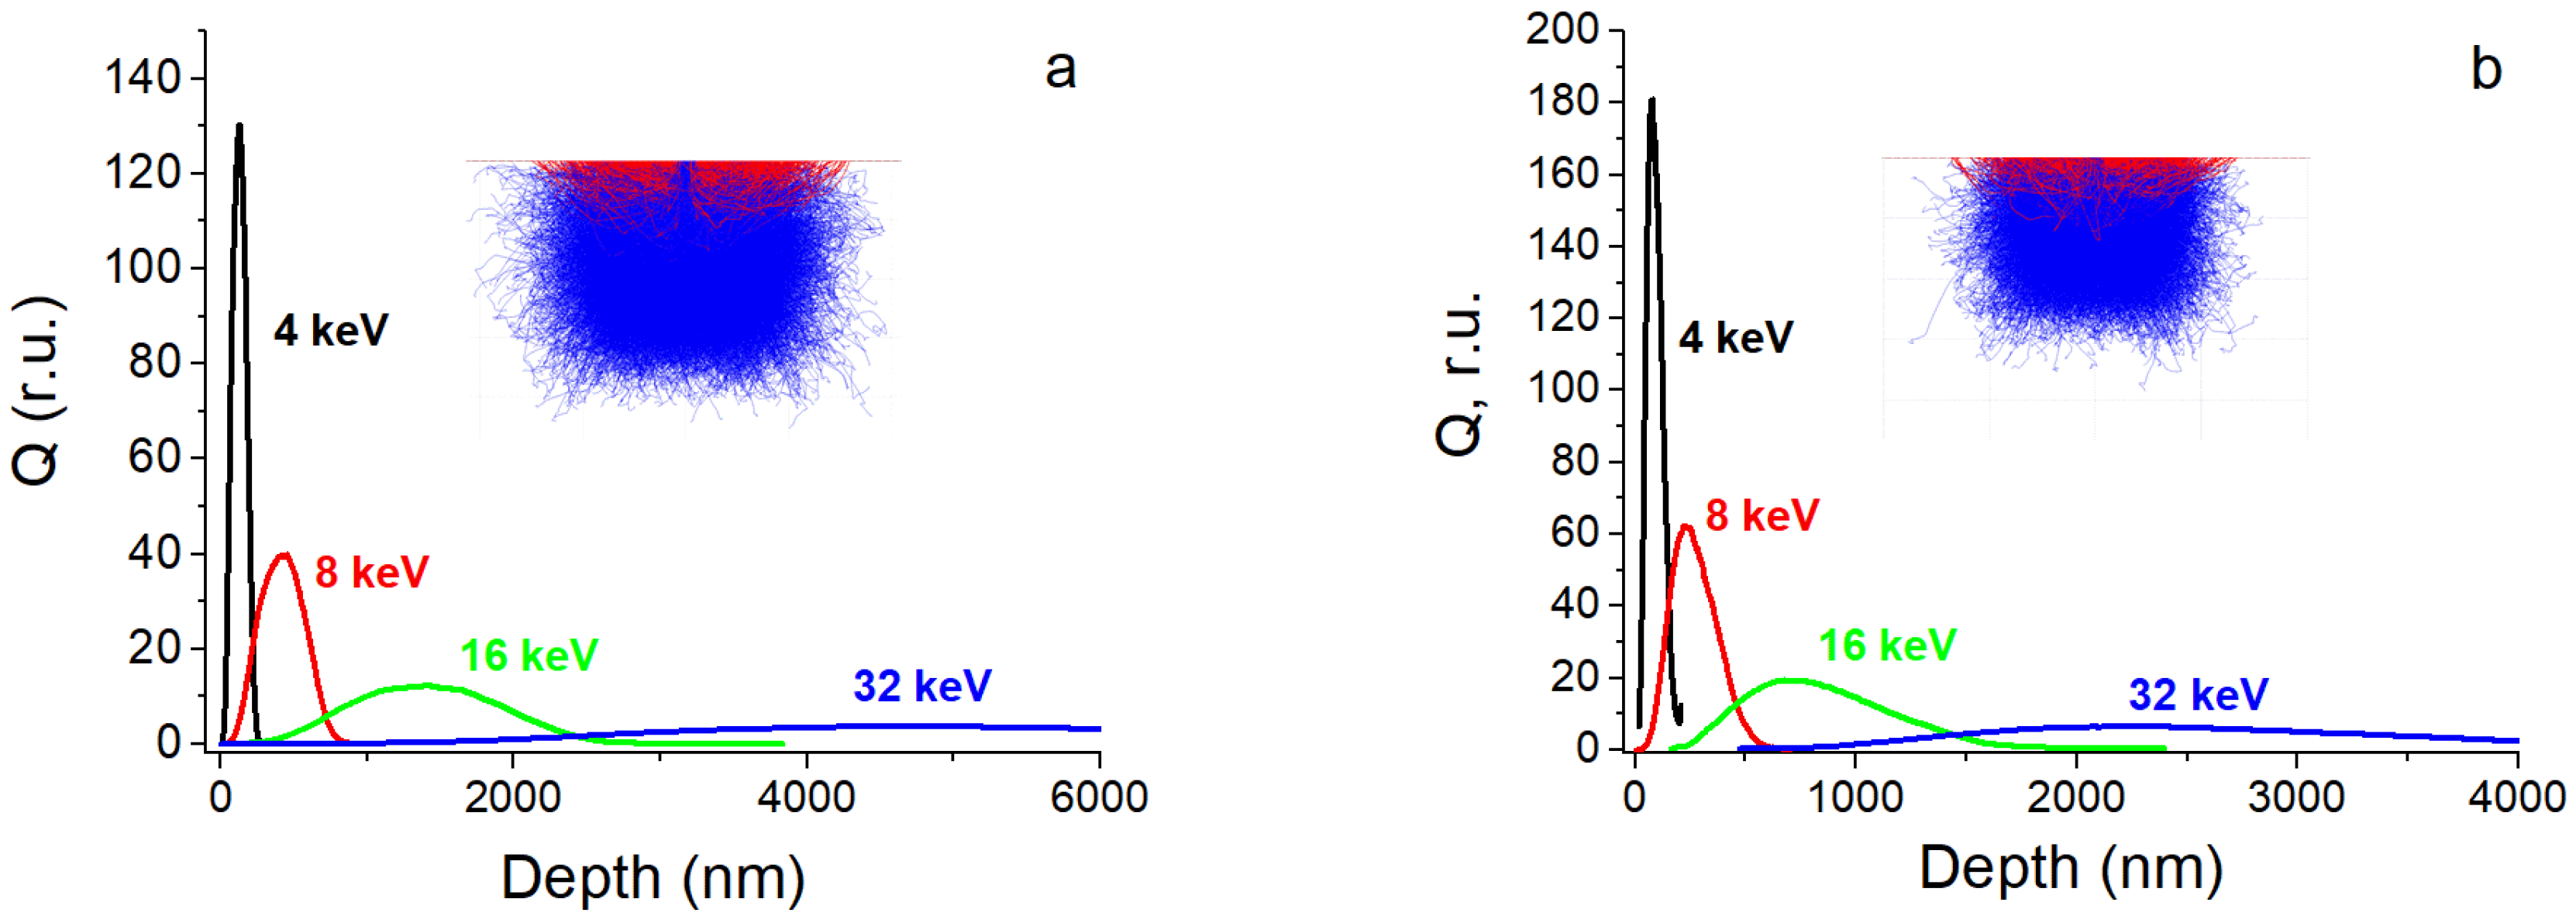
Using Monte Carlo simulations, we obtained the spatial distribution of electrons captured by the glasses, and estimated the maximum penetration depth of electrons into Menzel and BF16 glasses by varying the electron beam energy and setting the number of electrons to 16,000 (i.e., keeping the ICSD fixed). The results of the modeling are presented in Figure 5. One can see that the penetration of electrons in soda-lime (Menzel) glass is deeper than in BF16 glass. This is because of the absence of heavy Pb and Ba in the soda-lime glass.
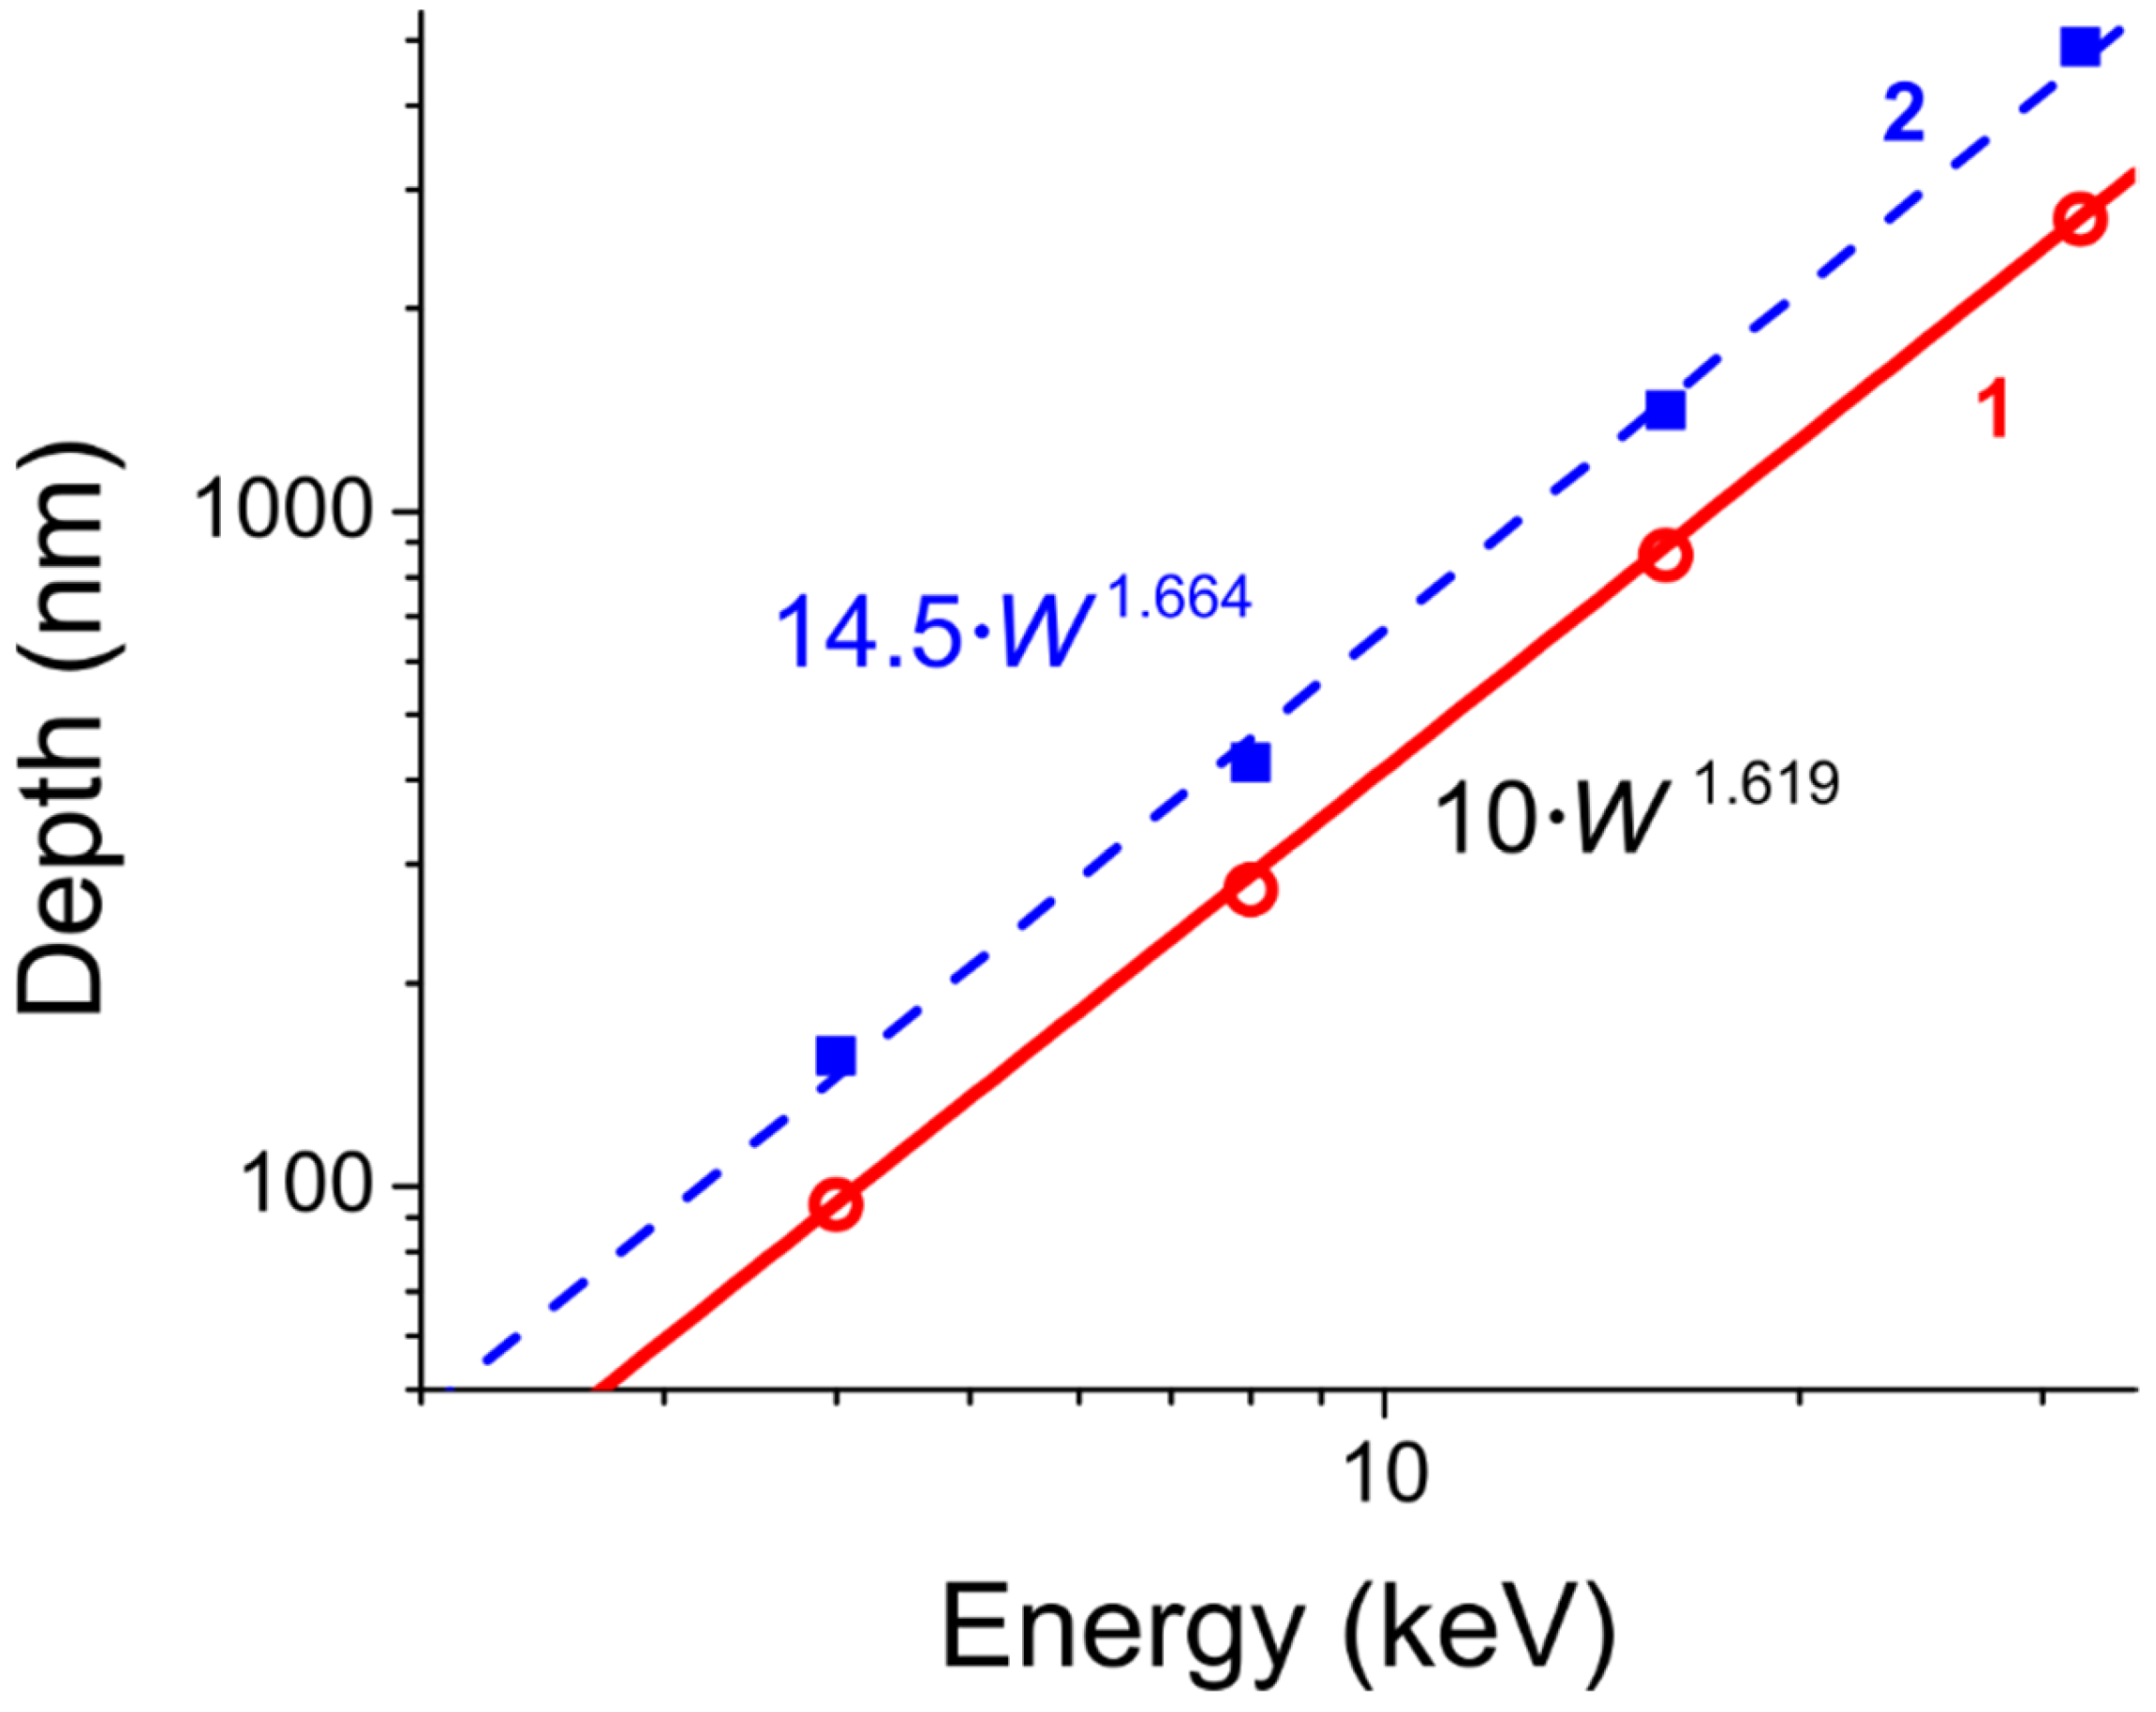
For a fast, rough estimation of the electric field “frozen” in the e-beam-poled slides, we also used the field of a charged plane with the position of the plane at the mean depth D = x = 0 x Q ( x ) d x / 0 Q ( x ) d x , where Q(x) is the charge distribution function presented in Figure 5. The modeled dependence of the mean depth D on electron energy for Menzel and BF16 glasses is presented in Figure 6 together with its approximation. One can see that the dependencies are a power function with about the same slope ~1.6, which is very close to the value of 5/3 according to the Bethe formula [31], and the main difference is in the pre-exponential factor. Additionally, the calculated ~2 µm depth (see Figure 6) of the layer modified by the 20 keV electron irradiation practically coincides with one reported for SF2 glass with a close content of heavy elements, which was revealed using chemical etching [8].
The non-uniform charge distribution in e-beam-poled glasses (see Figure 5) results in a non-uniform distribution of the electric field. The magnitude and distribution of the electric field E determines the second-harmonic (SH) wave intensity generated in the glass by the “frozen” electric charge. This requires electrostatic modeling of the problem to compare SHG efficiency in glasses irradiated with electrons of different energies. We performed such modeling assuming that the nonlinear interaction is weak, and the nonlinear interaction length d (the length of interaction of the laser beam with the region of nonlinearity) does not exceed a half of so-called SHG coherence length L c = λ 4 ( n 2 ω n ω ) , where n and nω are indices of the nonlinear medium for harmonic and fundamental radiation, respectively [32]. This assumption is valid for glasses under study because, for these samples, Lc lay in the range of tens of microns due to their relatively low dispersion, while an estimated value for d falls in the range of several microns. We used the results of the modeling (details are in Supplementary Material) for electron energies 4, 8, 16, and 32 keV to estimate the character of the SHG signal dependence on the electron beam energy using the approach proposed in [33]. The results of the modeled dependence of SHG intensity for BF16 glass on electron beam energy are presented in Figure 7.
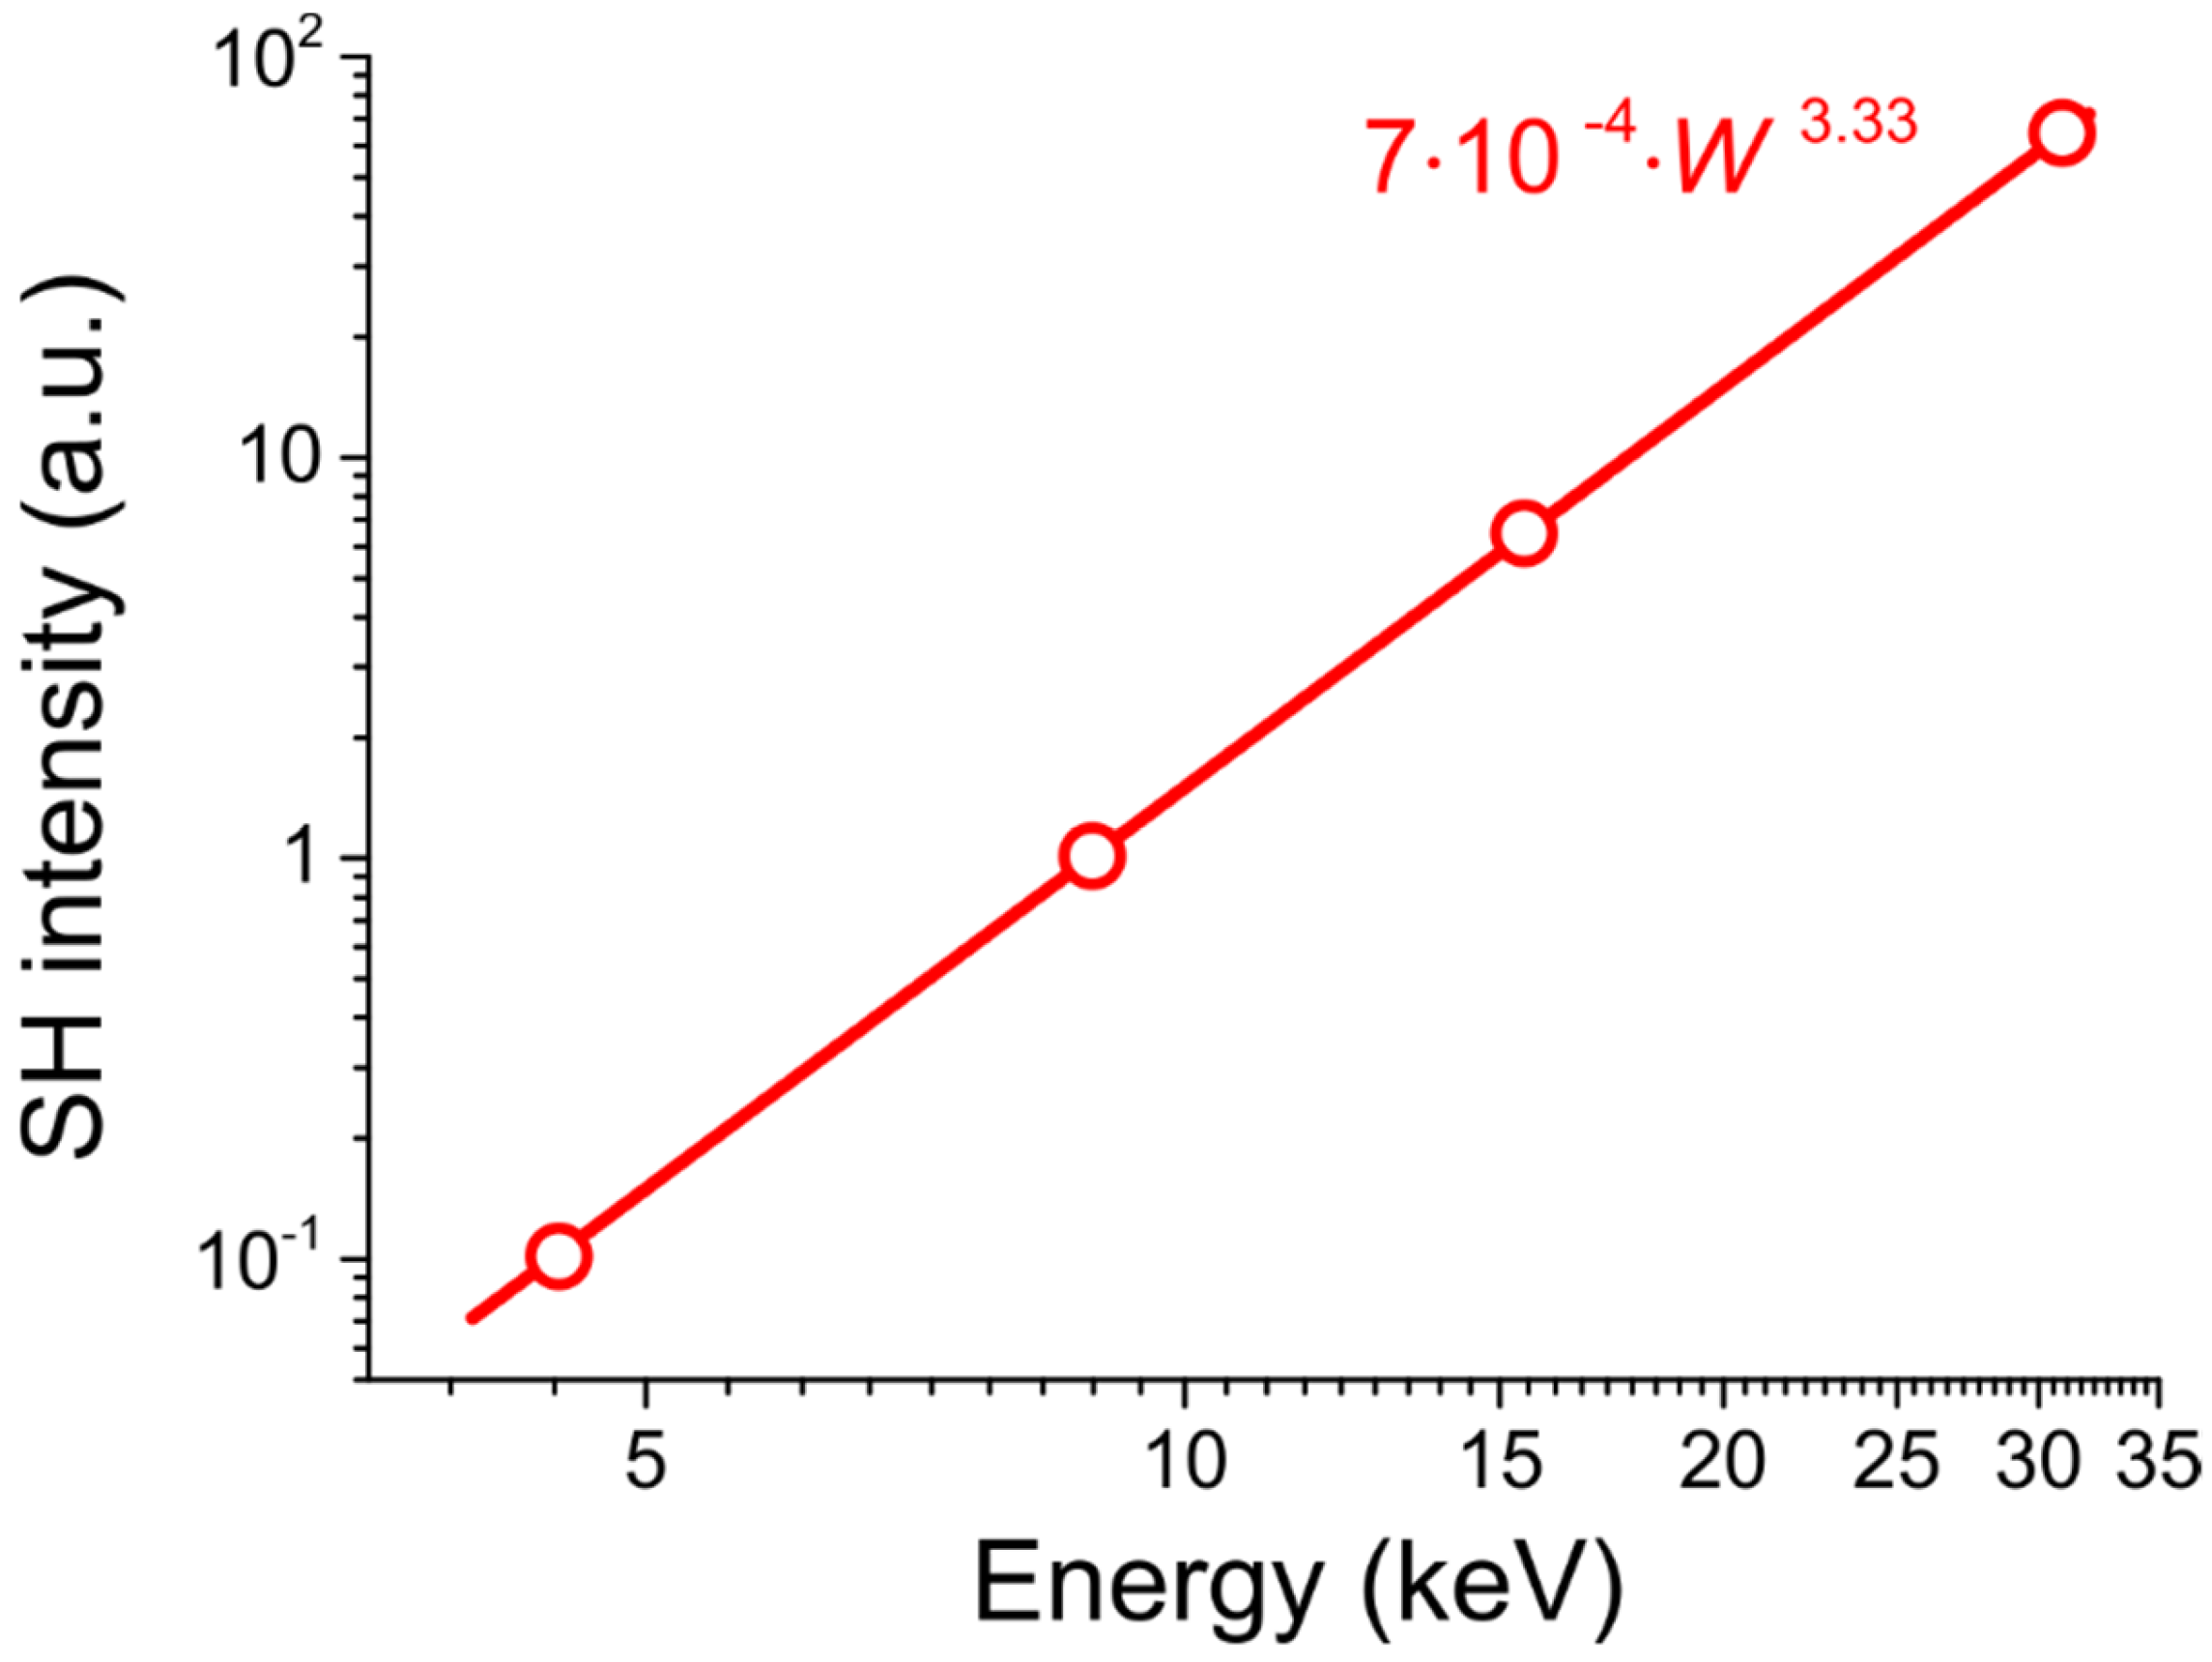
Approximation of the results by a power function gave the SHG intensity in the form ISGH~d2~W3.33, and the exponent is 30% higher than the experimental one, ISHG~W2.4 (see Figure 4b).

4. Discussion

4.1. Origin of the Difference of Experimental and Modeled Dependence of SHG Efficiency on Electron Energy

Saturation of the SHG signal (Figure 4a) with an increase in the total charge passed is presumably due to the formation of a positively charged layer under the glass surface, which prevents the penetration of electrons [17]. The formation of a positively charged layer is due to the release of secondary electrons, and this effect can be described in terms of a dynamic two-layer model (DDLM) [34]. The positively charged layer, in spite of an existing positive sign for the total surface charge, can lead to a negative surface potential [34], which prevents penetration of electrons into the glass. The formation of a negative surface potential in dielectrics under the electron beam irradiation, as well as the saturation of surface potential with the increase in the total charge, was experimentally observed in many works [35,36] and explained theoretically in the frames of DDLM [34]. In [34], the authors also mention that the final surface potential depends on both the electron beam energy W and the total charge passed (or illumination time): with increasing W or illumination time, the surface potential saturates at higher values.
Since there exist two regimes, before and after saturation of the surface potential, one can expect that the formation of the electric field inside the sample will be different for these two modes. After saturation, when the surface potential reaches its maximum, the electrons lose the maximum of their energy entering the sample, and the penetration depth is smaller. This leads to the drop in the SHG signal. Before saturation, the penetration depth is larger, and thus, the generated second-harmonic signal will be higher. We suppose that this explains the discrepancy between our numerical estimation of the SHG dependence on the electron energy and the experimental results. The Monte Carlo simulation with the CASINO package does not take into account the charging effect. This means that our calculations correspond to the “before saturation” regime, while in the experiment, the electron current value of 40 μC/cm2 corresponds to the “after saturation” regime (see Figure 4a). That is why our numerically obtained dependence, ISHG~W3.6, has a higher exponent than the experimental one, ISHG~W2.4. A higher power of W reported by Kazansky [3] is supposedly due to lower injected charge corresponding to the linear part of the dependence of SH intensity on ICSD.

4.2. Nature of SON in BF16 and Menzel Glasses

Let us estimate the SHG signal from thermally and e-beam-poled glass. The SHG signal depends on the square of the “frozen” electric field magnitude, E, the nonlinear interaction length d, which is linearly related with the thickness of the modified glass layer, and the corresponding nonlinear constant [13]. In both experimental cases a “frozen” electric field forms inside the glass near the surface within ~2000 nm of the thick poled region.

4.2.1. Electric Field Magnitude

For thermally poled glasses, we have a thin poled layer and strong depth localization of the charge, as shown in Figure 1b. Thus, the resulting field is uniform in the poled subsurface region, and the “frozen” electric field can be taken as the field formed by the end of the poling procedure. Roughly, in our thermally poled glass, the electric field is distributed between a 2000 nm layer where sodium is replaced by hydronium, and the rest on 0.998 mm of the virgin glass. According to Doremus [37], the mobility of hydronium ions is ~2000 times less than that of sodium ions. Thus, the distribution of voltage in the glass results in the application of voltage U to the poled layer, the voltage being equal to U 2   [ μ m ] · 2000 2   [ μ m ] · 2000 + 998   [ μ m ] · 1 800   [ V ] = 640   [ V ] . This voltage provides the magnitude of the “frozen” electric field E 640   [ V ] 2   [ μ m ] = 0.32   [ V / nm ] in our Menzel glass sample. This value is close to the magnitudes presented in papers [38,39,40,41].
As for e-beam poling, the “frozen” electric field can be calculated directly considering the surface charge density of an equivalent charged plane equal to the ICSD. This is valid if the backscattered electrons coefficient is low and almost all electrons stay inside the glass. According to the performed CASINO calculations, backscattered electrons make up only a small fraction of the total number of electrons, at least for a low ICSD that corresponds to the linear part of the dependence shown in Figure 4a (particularly, for ISCD = 1.8 µQ/cm2). Thus, for ICSD = 1.8 µQ/cm2, we evaluated the electric field as E = ICSD/2εε0, where ε0 is vacuum permittivity, and ε is dielectric permittivity of the glass (~10 for BF16 glass [42]). Such evaluation gives the “frozen” electric field E = 1.8   [ μ Q / cm 2 ] 2 10 8.85 10 12   [ F / m ] 10 9   [ V / m ] . However, one should account that the real size of the e-beam-poled region is ~3 × 2.5 mm2, and the real electric field differs from that of an infinite plate. A numerical calculation of the electric field of a 3 × 2.5 mm2 charged plate using the Comsol Multiphysics® software package (COMSOL Inc., Stockholm, Sweden) gives E~0.5 [V/nm]. This value of the static electric field was obtained as a result of solving the electrostatic problem for a charged plate of finite dimensions placed inside the glass. The solution gives the dependence of the field strength on the coordinates, and we took the field at the distance of 1 μm from the charged plate, which corresponds to half the thickness of the modified layer, and near its center. The value of 0.5 [V/nm] is of the same order as the “frozen” field for thermally poled glasses [39,40,41]. Particularly, this field is not less than the field generated by our thermal poling in Menzel glass (~0.32 [V/nm]).

4.2.2. Nonlinear Interaction Length

We calculated the nonlinear propagation length for both glasses, taking the indexes of the modified glass layer in Menzel (n ~ 1.51) and BF16 glasses (n ~ 1.67) [26,43] and the thickness of the modified layer of ~2000 nm (see Experimental and Modeling sections), and found that in these glasses, the difference in propagation lengths within the modified (nonlinear) layer for rays incident angle of 63° is 0.13 mm, which is ~5%. This difference is not essential for further consideration.

4.2.3. Nonlinear Constants

Since the nonlinear propagation lengths in BF16 and Menzel glasses are about the same, the relation R of the second-harmonic intensities generated in these glasses is defined by the relation of their poling-induced second-order susceptibilities, namely R = I S H B F 16 I S H M e n z e l ( χ e f f ( 2 ) B F 16 χ e f f ( 2 ) M e n z e l ) 2 . Here, χ e f f ( 2 ) is an effective second-order susceptibility, which governs the SHG in isotropic media in the presence of an electrostatic field. Importantly, it is proportional to E · χ 1111 ( 3 ) , where χ 1111 ( 3 ) is the component of the third-order nonlinear susceptibility tensor [41], and axis 1 is considered normal to the glass surface. According to the evaluation above, the magnitude of E in e-beam-poled BF16 glass about twice exceeds one in thermally poled Menzel glass, that gives R = ( 0.5 0.32 ) 2 ( χ 1111 ( 3 ) B F 16 χ 1111 ( 3 ) M e n z e l ) 2 2.4 ( χ 1111 ( 3 ) B F 16 χ 1111 ( 3 ) M e n z e l ) 2 , and the difference in the SHG intensity is governed by the difference in the χ 1111 ( 3 ) component of third-order susceptibilities of the glasses under discussion. By now, the majority of data on the third-order nonlinearity of glasses relates to their nonlinear refractive index n2: n = n0 + n2I, where n0 is the linear refractive index of a medium, and I is the light intensity. For linear polarization of light used in the Maker-fringes experiments, n 2   ~   χ 1111 ( 3 ) n 0 [44]. Taking the values of n0 equal to 1.51 and 1.67 for Menzel and BF16 glasses, respectively [43], we obtain R 2.4 ( 1.67 · n 2 B F 16 1.51 · n 2 M e n z e l ) 2 2.9 ( n 2 B F 16 n 2 M e n z e l ) 2 . We did not find reliable data on n2 for Menzel soda-lime glasses and, thus, used data for BK7 glass, whose composition does not essentially differ from Menzel glass. Similarly, we took data on n2 for SF6 glass, which contains heavy metals like BF16 glass, but at a lower concentration. It should be noted here that with the increase in heavy metal concentration, the nonlinear refractive index grows [45,46]. Compositions of these glasses in oxides wt.% are presented in Table 3. We use n2 data for BK7 and SF6 glass taken from reference [47], because there are some discrepancies in the data from different studies, and using the same measurements is more reliable.
According to [47], n 2 B K 7 = ( 1.2 1.3 ) · 10 13 esu and n 2 S F 6 = ( 8 10 ) · 10 13 esu. It is worth noting that for BF6, this is a lower estimate because it contains more heavy oxides than SF6 glass (51.95 versus 40.4%). At the same time, the n2 of Menzel glass is very close that of BK7 glass due to a small difference in their composition. As a consequence, the lower estimate of R is R = I S H B F 16 I S H M e n z e l 2.9 ( 8 1.3 ) 2 110 .
Thus, according to the estimation above, the difference of the SH intensity generated by e-beam-poled BF16 glass should be two orders of magnitude higher than that in thermally poled Menzel glass. However, performed experiments demonstrated R ~ 1 (see Figure 2), that is, thermally poled Menzel glass demonstrates a much higher SHG than expected. This can be explained by different mechanisms of SHG in thermally poled Menzel glass and e-beam-poled BF16 glass. We suppose that in thermally poled Menzel glass, in addition to the third-order susceptibility, which is rather low, the dipole orientation works. The dipole orientation as a source of the SHG was discussed in [17], where it was also found that vacuum thermal poling of Menzel glass at a voltage of 1500 V does not result in the SHG. We relate this to the absence of inflow of any impurities from the atmosphere during vacuum thermal poling. Presumably, for the same reason, the poling of the Menzel glass by the electron beam did not induce SHG in this study. At the same time, thermal poling of BF16 glass also did not lead to the SHG. We suppose this is because this glass does not contain alkalis, and introducing SON in alkali-free glasses by thermal poling requires much higher voltage [47,48].

5. Conclusions

To sum up, we studied the SHG in soda-lime and flint glasses poled using electron beam irradiation and thermal treatment under applied voltage in an open anode configuration. We performed thermal poling of the glasses, irradiated glasses with electron beams of different energies and currents, modeled the electron distributions in glass, and finally, performed experiments on the SHG. The behavior of these two glasses differs: thermally poled soda-lime glass demonstrated noticeable SHG, while e-beam poling of this glass gave a very low SH signal; contrarily, the e-beam-poled flint glass demonstrated the SH signal coinciding in magnitude with that of thermally poled soda-lime glass, but demonstrated no SHG after thermal poling. This difference in behavior of alkali-free flint and soda-lime glass cannot be explained in the frames of the model that relates the second-order nonlinear susceptibility with the third-order susceptibility and the “frozen” electric field in glasses. This indicates another mechanism of SON in thermally poled soda-lime glass that is the dipole orientation of entities injected into the glass in the course of thermal poling in an open anode configuration.

Supplementary Materials

The following supporting information can be downloaded at: https://www.mdpi.com/article/10.3390/photonics9100733/s1, Figure S1: Normalized distribution of electric charge (solid, left axes) and the distribution of electric field (dashed, right axes) in e-beam poled BF16 glass irradiated with electrons of different energy. Electron energy is marked below corresponding graphs.

Author Contributions

Conceptualization: A.L.; methodology: V.K.; software: G.K.; formal analysis: S.S. (Sergey Scherbak); investigation: I.R. and S.S. (Sergey Shestakov); writing—original draft preparation: A.L.; writing—review and editing: V.Z.; visualization: V.Z. All authors have read and agreed to the published version of the manuscript.

Funding

This research was funded by the Ministry of Science and Higher Education of Russian Federation, project FSRM-2020-0001.

Institutional Review Board Statement

Not applicable.

Informed Consent Statement

Not applicable.

Acknowledgments

The authors would like to thank Oleg Podsvirov for his significant assistance in conducting experiments related to electron beam irradiation and for his helpful discussion.

Conflicts of Interest

The authors declare no conflict of interest.

References

  1. Okada, A.; Ishii, K.; Mito, K.; Sasaki, K. Phase-matched Second-harmonic Generation in Novel Corona Poled Glass Waveguides. Appl. Phys. Lett. 1992, 60, 2853–2855. [Google Scholar] [CrossRef]
  2. Russell, P.S.; Kazansky, P.G.; Kamal, A. Electron Implantation: A New Technique for Creation and Modification of Second-Order Susceptibility in Glasses. SPIE Proc. 1993, 2044, 192–201. [Google Scholar] [CrossRef]
  3. Kazansky, P.G.; Kamal, A.; Russell, P.S.J. High Second-Order Nonlinearities Induced in Lead Silicate Glass by Electron-Beam Irradiation. Opt. Lett. 1993, 18, 693–695. [Google Scholar] [CrossRef]
  4. Corbari, C.; Ajitdoss, L.C.; Carvalho, I.C.S.; Deparis, O.; Mezzapesa, F.P.; Kazansky, P.G.; Sakaguchi, K. The Problem of Achieving High Second-Order Nonlinearities in Glasses: The Role of Electronic Conductivity in Poling of High Index Glasses. J. Non-Cryst. Solids 2010, 356, 2742–2749. [Google Scholar] [CrossRef] [Green Version]
  5. Smith, N.J.; Pantano, C.G. Structural and Compositional Modification of a Barium Boroaluminosilicate Glass Surface by Thermal Poling. Appl. Phys. A 2014, 116, 529–543. [Google Scholar] [CrossRef]
  6. Lepicard, A.; Bondu, F.; Kang, M.; Sisken, L.; Yadav, A.; Adamietz, F.; Rodriguez, V.; Richardson, K.; Dussauze, M. Long-Lived Monolithic Micro-Optics for Multispectral GRIN Applications. Sci. Rep. 2018, 8, 7388. [Google Scholar] [CrossRef] [PubMed] [Green Version]
  7. Chervinskii, S.; Sevriuk, V.; Reduto, I.; Lipovskii, A. Formation and 2D-Patterning of Silver Nanoisland Film Using Thermal Poling and out-Diffusion from Glass. J. Appl. Phys. 2013, 114, 224301. [Google Scholar] [CrossRef]
  8. Qiu, M.; Pi, F.; Orriols, G. The Role of Lead Component in Second-Harmonic Generation in Lead Silica by Electron-Beam Irradiation. Appl. Phys. Lett. 1998, 73, 3040–3042. [Google Scholar] [CrossRef] [Green Version]
  9. Liu, Q.; Zhao, X.; Tanaka, K.; Narazaki, A.; Hirao, K.; Gan, F. Second-Harmonic Generation in Ge-As-S Glasses by Electron Beam Irradiation and Analysis of the Poling Mechanism. Opt. Commun. 2001, 198, 187–192. [Google Scholar] [CrossRef]
  10. Liu, Q.; Gao, C.; Li, H.; Zhao, X. The Generation and Stability of Second-Harmonic in Electron-Beam Irradiated GeS2—In2S3—CdS Chalcogenide Glasses. Solid State Commun. 2009, 149, 266–268. [Google Scholar] [CrossRef]
  11. Kassab, L.R.P.; Miedzinski, R.; Kityk, I.V.; Ebothe, J.; da Silva, D.M.; Reshak, A.H. Electron Beam Induced Second-Harmonic Generation in Er 3+ Doped PbO-GeO 2 Glasses Containing Silver Nanoparticles. J. Mater. Sci. Mater. Electron. 2009, 20, 87–91. [Google Scholar] [CrossRef]
  12. Xiao, X.; Liu, Q.; Dong, G.; Zhao, X. Second-Order Optical Nonlinearity in Sb2S3 Microcrystal Doped Glasses by Electron Beam Irradiation. Opt. Commun. 2007, 274, 456–460. [Google Scholar] [CrossRef]
  13. Guillet de Chatellus, H.; Freysz, E. Measurement of the Third-Order Susceptibility of Glasses by EFISH of Femtosecond Pulses. Opt. Express 2001, 9, 586–591. [Google Scholar] [CrossRef] [PubMed]
  14. Chen, H.-Y.; Lin, H.-Y. Thermal Poling Induced Second-Order Optical Nonlinearity in Phosphosilicate Glass Thin Films. J. Mod. Opt. 2019, 66, 2053–2062. [Google Scholar] [CrossRef]
  15. Le Calvez, A.; Freysz, E.; Ducasse, A. A Model for Second Harmonic Generation in Poled Glasses. Eur. Phys. J. D 1998, 1, 223–226. [Google Scholar] [CrossRef]
  16. Kazansky, P.G.; Russel, P.S.J. Thermally Poled Glass: Frozen-in Electric Field or Oriented Dipoles? Opt. Commun. 1994, 110, 611–614. [Google Scholar] [CrossRef]
  17. Reshetov, I.; Scherbak, S.; Tagantsev, D.; Zhurikhina, V.; Lipovskii, A. Giant Enhancement of Optical Second Harmonic in Poled Glasses by Cold Repoling. J. Phys. Chem. Lett. 2022, 13, 5932–5937. [Google Scholar] [CrossRef] [PubMed]
  18. Luo, J.; He, H.; Podraza, N.J.; Qian, L.; Pantano, C.G.; Kim, S.H. Thermal Poling of Soda-Lime Silica Glass with Nonblocking Electrodes—Part 1: Effects of Sodium Ion Migration and Water Ingress on Glass Surface Structure. J. Am. Ceram. Soc. 2016, 99, 1221–1230. [Google Scholar] [CrossRef]
  19. Dussauze, M.; Rodriguez, V.; Lipovskii, A.; Petrov, M.; Smith, C.; Richardson, K.; Cardinal, T.; Fargin, E.; Kamitsos, E.I. How Does Thermal Poling Affect the Structure of Soda-Lime Glass? J. Phys. Chem. C 2010, 114, 12754–12759. [Google Scholar] [CrossRef]
  20. Cremoux, T.; Dussauze, M.; Fargin, E.; Cardinal, T.; Talaga, D.; Adamietz, F.; Rodriguez, V. Trapped Molecular and Ionic Species in Poled Borosilicate Glasses: Toward a Rationalized Description of Thermal Poling in Glasses. J. Phys. Chem. C 2014, 118, 3716–3723. [Google Scholar] [CrossRef]
  21. Jbara, O.; Cazaux, J.; Trebbia, P. Sodium Diffusion in Glasses during Electron Irradiation. J. Appl. Phys. 1995, 78, 868–875. [Google Scholar] [CrossRef]
  22. Jiang, N. Electron Beam Damage in Oxides: A Review. Rep. Prog. Phys. 2015, 79, 016501. [Google Scholar] [CrossRef]
  23. Sidorov, A.I.; Kirpichenko, D.A.; Yurina, U.V.; Podsvirov, O.A. Structural Changes in Silica Glass under the Action of Electron Beam Irradiation: The Effect of Irradiation Dose. Glass Phys. Chem. 2021, 47, 118–125. [Google Scholar] [CrossRef]
  24. Gedeon, O.; Zemek, J.; Jurek, K. Changes in Alkali-Silicate Glasses Induced with Electron Irradiation. J. Non-Cryst. Solids 2008, 354, 1169–1171. [Google Scholar] [CrossRef]
  25. Dudko, Y.V.; Kravchenko, A.A.; Cherednichenko, D.I. Electron-Beam Modification of Silicate Glass Surfaces. J. Non-Cryst. Solids 1995, 188, 87–92. [Google Scholar] [CrossRef]
  26. Thermo Scientific™ Microscope Slides, 45°. Available online: https://www.fishersci.pt/shop/products/microscope-slides-45/12164682 (accessed on 6 October 2022).
  27. Scherbak, S.A.; Kaasik, V.P.; Zhurikhina, V.V.; Lipovskii, A.A. SEM-Visualization of a Spatial Charge and a Giant Potassium Peak in a Corona-Poled Glass. J. Phys. Condens. Matter 2021, 33, 235702. [Google Scholar] [CrossRef]
  28. Hovington, P.; Drouin, D.; Gauvin, R. CASINO: A New Monte Carlo Code in C Language for Electron Beam Interaction-Part I: Description of the Program. Scanning 2006, 19, 1–14. [Google Scholar] [CrossRef]
  29. Jerphagnon, J.; Kurtz, S.K. Maker Fringes: A Detailed Comparison of Theory and Experiment for Isotropic and Uniaxial Crystals. J. Appl. Phys. 1970, 41, 1667–1681. [Google Scholar] [CrossRef]
  30. Tong, A.S.K.; Bondu, F.; Senthil Murugan, G.; Wilkinson, J.S.; Dussauze, M. Effect of sodium addition and thermal annealing on second-order optical nonlinearity in thermally poled amorphous Ta2O5 thin films. J. Appl. Phys. 2019, 125, 015104. [Google Scholar] [CrossRef] [Green Version]
  31. Bethe, H.; Ashkin, J. Experimental Nuclear Physics; Segré, E., Ed.; John Wiley: New York, NY, USA, 1953; p. 253. [Google Scholar]
  32. Yariv, A.; Yeh, P. Optical Waves in Crystals: Propagation and Control of Laser Radiation; John Wiley & Sons, Inc.: New York, NY, USA; Chichester, UK; Brisbane, Australia; Toronto, ON, Canada; Singapore, 2002; ISBN 978-0-471-43081-0. [Google Scholar]
  33. Quiquempois, Y.; Martinelli, G.; Duthérage, P.; Bernage, P.; Niay, P.; Douay, M. Localization of the Induced Second-Order Non-Linearity within Infrasil and Suprasil Thermally Poled Glasses. Opt. Commun. 2000, 176, 479–487. [Google Scholar] [CrossRef]
  34. Melchinger, A.; Hofmann, S. Dynamic Double Layer Model: Description of Time Dependent Charging Phenomena in Insulators under Electron Beam Irradiation. J. Appl. Phys. 1995, 78, 6224–6232. [Google Scholar] [CrossRef]
  35. Rau, É.I.; Evstaf’eva, E.N.; Andrianov, M.V. Mechanisms of Charging of Insulators under Irradiation with Medium-Energy Electron Beams. Phys. Solid State 2008, 50, 621–630. [Google Scholar] [CrossRef]
  36. Liu, W. Resist Charging in Electron Beam Lithography. J. Vac. Sci. Technol. B Microelectron. Nanometer Struct. 1995, 13, 1979–1983. [Google Scholar] [CrossRef]
  37. Doremus, R.H. Mechanism of Electrical Polarization of Silica Glass. Appl. Phys. Lett. 2005, 87, 232904. [Google Scholar] [CrossRef]
  38. Liu, X.; Zhang, H. Mechanism Analysis of Thermal/Electric Field Poling in Fused Silica. Jpn. J. Appl. Phys. 2002, 41, 2958–2961. [Google Scholar] [CrossRef]
  39. Lipovskii, A.A.; Melehin, V.G.; Petrov, M.I.; Svirko, Y.P.; Zhurikhina, V.V. Bleaching versus Poling: Comparison of Electric Field Induced Phenomena in Glasses and Glass-Metal Nanocomposites. J. Appl. Phys. 2011, 109, 011101. [Google Scholar] [CrossRef]
  40. Redkov, A.V.; Melehin, V.G.; Lipovskii, A.A. How Does Thermal Poling Produce Interstitial Molecular Oxygen in Silicate Glasses? J. Phys. Chem. C 2015, 119, 17298–17307. [Google Scholar] [CrossRef]
  41. Dussauze, M.; Cremoux, T.; Adamietz, F.; Rodriguez, V.; Fargin, E.; Yang, G.; Cardinal, T. Thermal Poling of Optical Glasses: Mechanisms and Second-Order Optical Properties. Int. J. Appl. Glass Sci. 2012, 3, 309–320. [Google Scholar] [CrossRef]
  42. Zverev, V.A.; Krivopustova, E.V.; Tochilina, T.V. Optical Materials. Part 1; ITMO University: St. Petersburg, Russia, 2009. (In Russian) [Google Scholar]
  43. RefractiveIndex. INFO Refractive Index Database. Available online: https://refractiveindex.info/?shelf=glass&book=LZOS-BF&page=BF16 (accessed on 6 October 2022).
  44. Adair, R.; Chase, L.L.; Payne, S.A. Nonlinear Refractive-Index Measurements of Glasses Using Three-Wave Frequency Mixing. J. Opt. Soc. Am. B 1987, 4, 875–881. [Google Scholar] [CrossRef]
  45. Aber, J.E.; Newstein, M.C.; Garetz, B.A. Femtosecond Optical Kerr Effect Measurements in Silicate Glasses. J. Opt. Soc. Am. B 2000, 17, 120–127. [Google Scholar] [CrossRef]
  46. Thomazeau, I.; Etchepare, J.; Grillon, G.; Migus, A. Electronic Nonlinear Optical Susceptibilities of Silicate Glasses. Opt. Lett. 1985, 10, 223–225. [Google Scholar] [CrossRef] [PubMed]
  47. Smith, N.J.; Lanagan, M.T.; Pantano, C.G. Thermal Poling of Alkaline Earth Boroaluminosilicate Glasses with Intrinsically High Dielectric Breakdown Strength. J. Appl. Phys. 2012, 111, 083519. [Google Scholar] [CrossRef]
  48. Pruneri, V.; Samoggia, F.; Bonfrate, G.; Kazansky, P.G.; Yang, G.M. Thermal Poling of Silica in Air and under Vacuum: The Influence of Charge Transport on Second Harmonic Generation. Appl. Phys. Lett. 1999, 74, 2423–2425. [Google Scholar] [CrossRef]
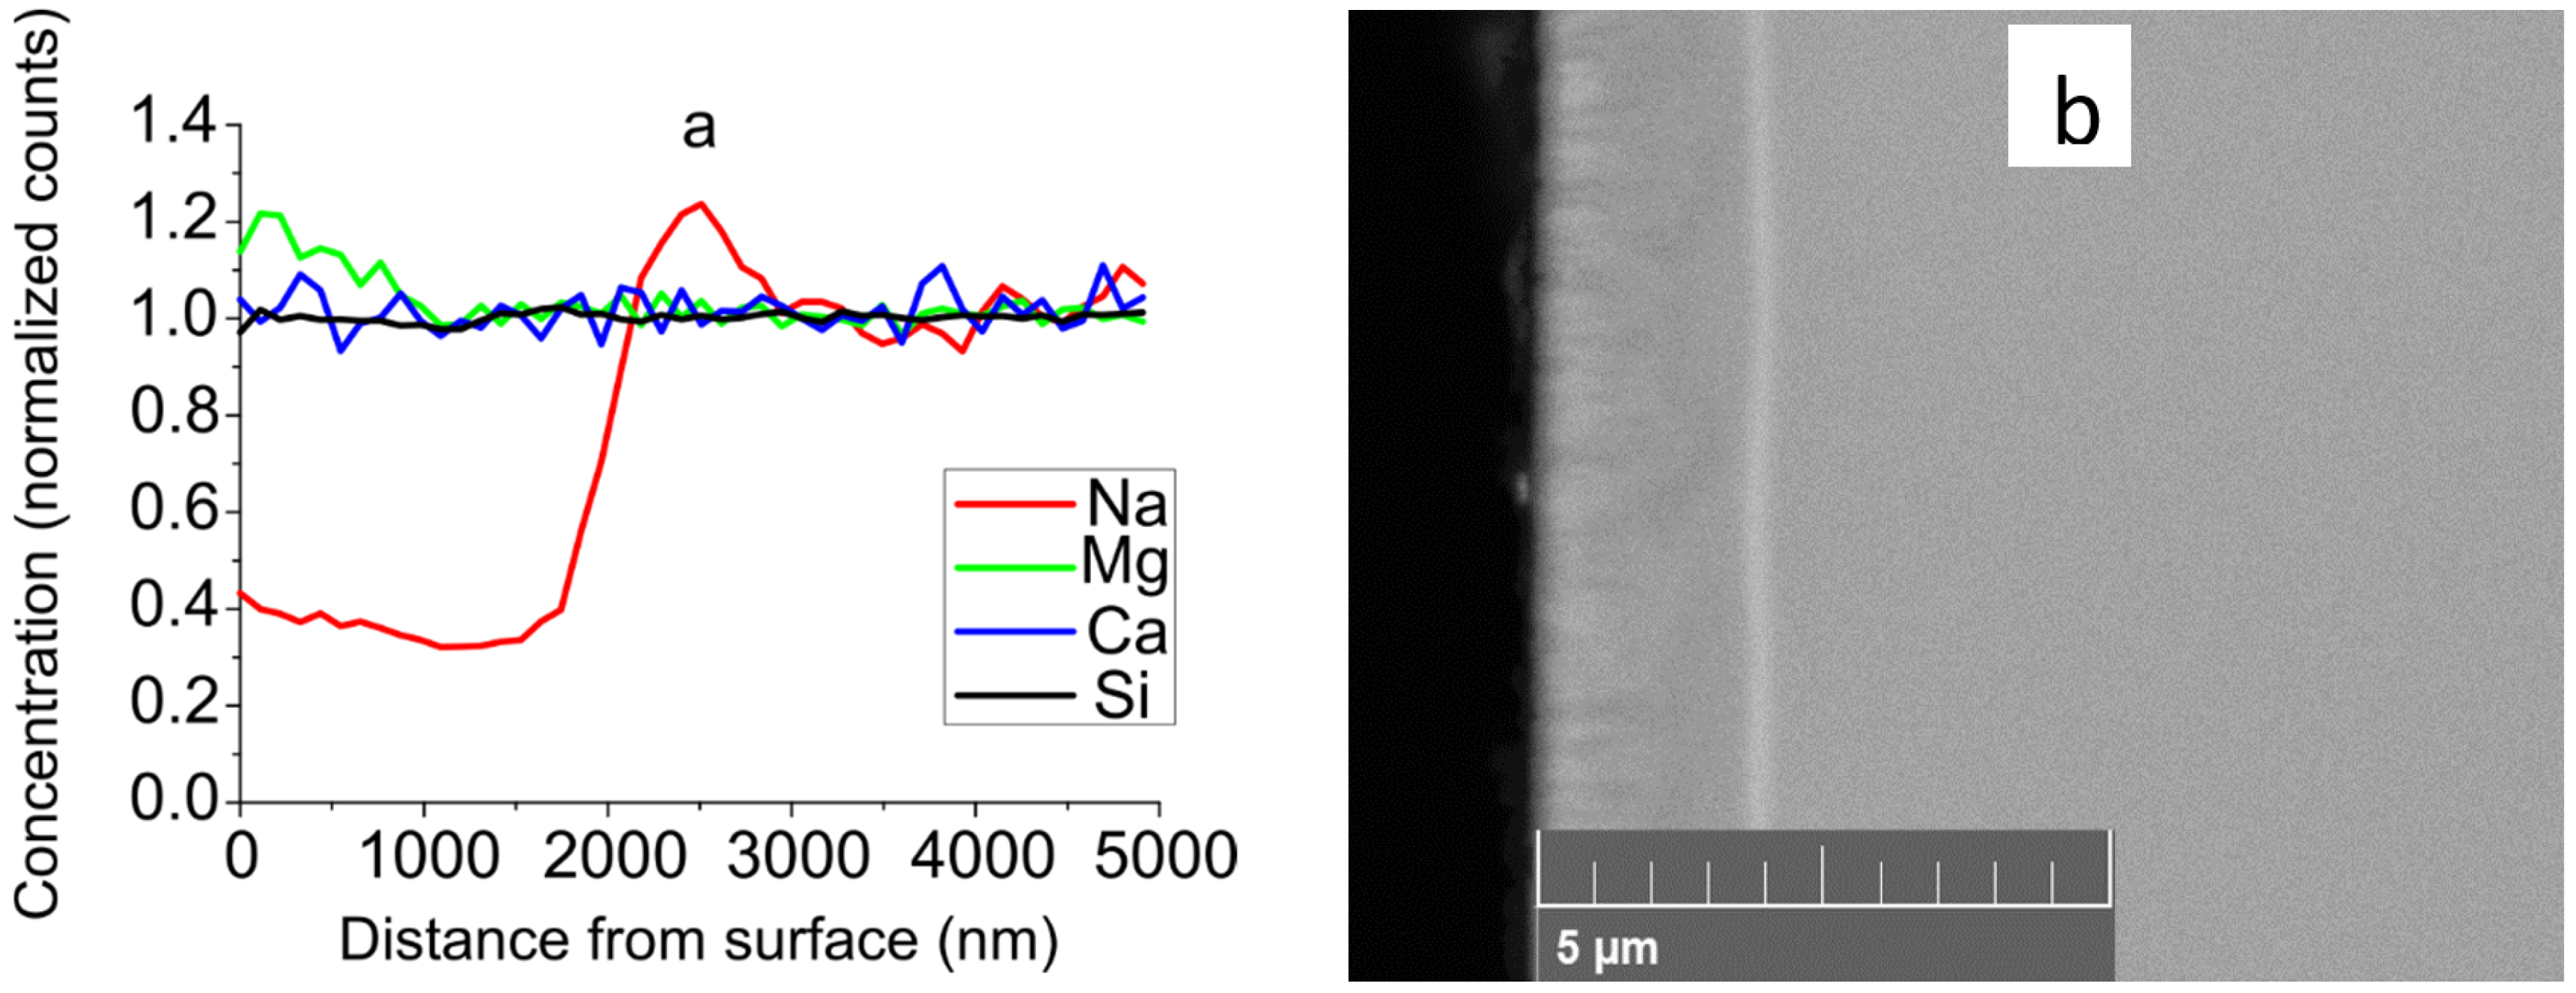
Figure 1. Sodium concentration profile (a) and localization of “frozen” electric charge (b) in thermally poled Menzel glass slide (white line on light gray background, glass surface corresponds to black–light grey interface).
Photonics 09 00733 g001
Figure 2. Maker-fringes SHG patterns of Menzel (a) and BF16 (b) glass slides: 1—virgin slides, 2—e-beam poling at electron energy 20 keV and ICSD 1.8 µQ/cm2, 3—thermal poling at 300 °C in air atmosphere under 800 V DC.
Photonics 09 00733 g002
Figure 3. Maps of the SHG signal from thermally poled slides of Menzel glass (a) and e-beam-poled BF16 glass (b), obtained at the laser beam incidence angle of 63°. The color bars are in arbitrary units.
Photonics 09 00733 g003
Figure 4. The SHG intensity from the irradiated BF16 glass in dependence on the ICSD for the electron beam energy 20 keV (a) and on the electron beam energy for ICSD of 40 µC/cm2 (log-log scale). Squares—experiment, dashed line—approximation by a power function (b).
Photonics 09 00733 g004
Figure 5. Results of CASINO of depth charge distribution for Menzel (a) and BF16 (b) glasses. Insets: CASINO modeling of electron distribution for electron energy 4 keV, blue color corresponds to captured electrons and red to backscattered electrons.
Photonics 09 00733 g005
Figure 6. Based on CASINO modeling, calculated energy dependences (points) and their approximation (lines) of mean electron penetration depth for BF16 (1) and Menzel (2) glasses.
Photonics 09 00733 g006
Figure 7. Based on CASINO modeling, calculated energy dependence (points) of the SH intensity in BF16 glass and its approximation (lines).
Photonics 09 00733 g007
Table 1. Atomic composition of studied glasses.
SiOAlBKNaPbBaZnCaMgOther 1
Menzel24.7760.080.49-0.539.51---2.352.200.07
BF1615.3259.861.666.63--1.529.312.373.07-0.36
1 Impurities and purifiers: oxides of As, S, Sb, and Fe.
Table 2. SHG signal from Menzel and BF16 glass slides poled under selected conditions.
Thermal Polinge-Beam Poling
Menzelhigh SHG signalweak SHG signal
BF16weak SHG signalhigh SHG signal
Table 3. Compositions of glasses in oxides (weight %).
SiO2Al2O3B2O3PbOBaOK2ONa2OZnOCaOMgOOther 1
Menzel72.21.2---1.214.3-6.44.30.33
BK769.13-10.75-3.076.2910.4---0.36
BF1627.042.496.799.9542--5.685.05-1.03
SF657.6--40.4-2-----
1 Impurities and purifiers.
Publisher’s Note: MDPI stays neutral with regard to jurisdictional claims in published maps and institutional affiliations.