Abstract
All-dielectric superlens made from micro and nano particles has emerged as a simple yet effective solution to label-free, super-resolution imaging. High-index BaTiO3 Glass (BTG) microspheres are among the most widely used dielectric superlenses today but could potentially be replaced by a new class of TiO2 metamaterial (meta-TiO2) superlens made of TiO2 nanoparticles. In this work, we designed and fabricated TiO2 metamaterial superlens in full-sphere shape for the first time, which resembles BTG microsphere in terms of the physical shape, size, and effective refractive index. Super-resolution imaging performances were compared using the same sample, lighting, and imaging settings. The results show that TiO2 meta-superlens performs consistently better over BTG superlens in terms of imaging contrast, clarity, field of view, and resolution, which was further supported by theoretical simulation. This opens new possibilities in developing more powerful, robust, and reliable super-resolution lens and imaging systems.
1. Introduction
The optical microscope is the most common imaging tool known for its simple design, low cost, and great flexibility. However, the imaging resolution of a classical optical microscope is limited to almost half of its incident wavelength. The resolution limit in optics was discovered by the German physicist Ernst Abbe in 1873 by giving the expression, d = λ/(2NA) where d is the minimum distance between two structural elements as two objects instead of one, λ is the illuminating wavelength and NA is the numerical aperture of the used objective lens [1]. Such resolution limit is also known as Abbe’s diffraction limit, which predicts the smallest objects that one can see through the objective lens of an optical microscope. The physical origin of diffraction limit arises due to the loss of exponentially decaying evanescent waves, which carry high spatial frequency subwavelength information from an object and are not able to propagate in the far-field [2]. This limits the resolution of subwavelength structures and results in an imperfect image. In this regard, several methods have been implemented to circumvent this resolution limit by converting these evanescent waves to propagating waves reaching the far-field. Near-field scanning optical microscope (NSOM) invented by D.W. Pohl is known as the first high-resolution imaging technique, which exploits nanoscale-sized tiny tip positioned close to specimen to collect the evanescent waves from the near-field and to transfer these lost subwavelength details into the far-field [3]. Such near-field imaging techniques require a longer time to acquire the image and cannot study the dynamic behavior of biological samples in real-time. Furthermore, experimental realization of Negative Index Medium (NIM) opened new opportunities towards super-resolution research when British scientist John Pendry theoretically showed how a slab of NIM can work as a perfect lens thanks to the enhancement of evanescent waves through the slab, instead of decaying [4,5,6]. Following this idea, several different types of plasmonic metamaterials lenses, such as super-lenses and hyper-lenses, have broken the diffraction limit [7,8,9,10]. However, these metal-based lenses have some serious limitations: (i) Exhibit high optical losses [11], (ii) involve complex and expensive nanofabrication process, (iii) involve the intense excitation of single visible wavelength laser and do not work under broadband white light sources. Besides, the development of super-resolution fluorescence optical microscope, which also won the 2014 Nobel prize in Chemistry, is another breakthrough to image biological cells and viruses beyond the diffraction limit [12]. This technique has also not been perfect due to its inability to resolve nonfluorescent samples, such as viruses and intracellular components, which cannot be labeled by fluorophores. In such a scenario, super-resolution through dielectric microspheres has emerged as a simple yet effective solution to all limitations mentioned above in other techniques. By clearly resolving sub-diffraction features in a plasmonic hexagonal nano array sample (50 nm holes separated 50 nm apart, with period 100 nm) through silica microspheres, we have reported microsphere nanoscopy working in real-time for the first time, which is label-free, usable under white light sources, and loss-free [13]. The technique was validated and resolution level of ~λ/6–λ/8 was confirmed by other groups [14,15]. New microspheres, including Polystyrene and BaTiO3 glass (BTG) microspheres (immersed in liquid or solid encapsulated), were soon introduced and widely used in the field [16,17]. The field has undergone rapid developments, including the development of scanning superlens, higher resolution metamaterial superlens [18,19], biological superlens [20], and integrated biochips, as well as new applications in interferometry, endoscopy, and others [21]. The underlying super-resolution mechanism is pretty complex and is still under investigation, which seems to be a mixing of photonic nanojet, optical super-resonances [22,23], illumination condition, and substrate effect, which were all summarized in our recent reviews [21,24,25]. Among these, it remains unclear which superlens will perform better, BTG or metamaterial superlens, which is a hemispherical all-dielectric lens made by 3D stacking of 15–20 nm titanium dioxide (TiO2) nanoparticles (n = 2.50–2.55) following a bottom-up synthesis approach, with super-resolution of at least 45 nm have been reported under a white light microscope [18]. This paper will address it.
What we are interested in is designing the experiments to directly compare the super-resolution imaging performance between BTG superlens and TiO2 superlens. Since many factors could influence the imaging process (e.g., substrate, illumination, particle size, shape, refractive index, etc.), we aim to design TiO2 superlens to have the same effective refractive index as BTG particle, and perform comparative experiments under the same experimental conditions, including substrate, illumination, microscope, and imaging settings. This will allow a direct and reliable comparison of the imaging performance by both superlenses. Figure 1 shows the schematics of two microsphere superlens models, where BTG with refractive index of 1.92 was chosen, TiO2 metamaterial (meta-TiO2) superlens was designed and made from 20-nm sized TiO2 (n = 2.50) via the modified bottom-up synthesis method described below, producing the same effective refractive index of 1.92 (corresponding to 61.3% TiO2 volume ratio) as BTG sphere.
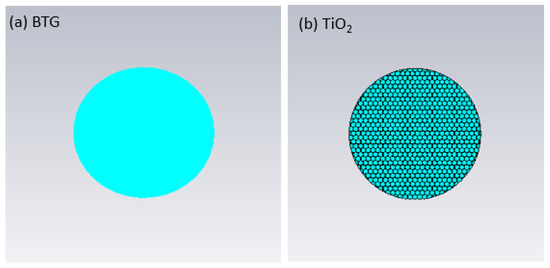
Figure 1.
Schematic of BTG and TiO2 microsphere models. (a) BTG microsphere with n = 1.92, and (b) meta-TiO2: TiO2 metamaterial microsphere, made from densely packed 20-nm, n = 2.50, TiO2 nanoparticles, having the same effective refractive index of 1.92, as BTG particle.
In this work, a novel, simpler, and repeatable method has been developed to fabricate proposed full-sphere meta-TiO2 superlens as in Figure 1b. The sphere sizes can be controlled as the function of used air gun pressure during the fabrication procedure. These meta-TiO2 microspheres exhibit good mechanical strength required for solid encapsulation with Polydimethylsiloxane (PDMS), which was applied to both BTG and TiO2 superlens in our experiments before imaging. After PDMS encapsulation, a thin sheet with embedded superlenses was formed, which can be easily handled and moved at any desired location to image subwavelength nanofeatures.
2. Materials and Methods
In a previous study, we have shown that 15–20 nm TiO2 nanoparticles should be used as the building block of the meta-superlens for best performance. Larger nanoparticles reduce the superlens performance [18]. Our metamaterial superlens fabrication method is based on the bottom-up approach of TiO2 nanoparticles (20 nm, refractive index n = 2.50) to assemble into densely packed structures. The step-by-step procedure of fabricating these microspheres has been illustrated in Figure 2a, which is as follows. First, an aqueous solution of 20 nm anatase TiO2 nanoparticles (from XuanChengJingRui New Material Co. Ltd., Anhui, China) is centrifuged at 17,500 rpm for 20 min at 10 °C to remove present aggregates and uneven size of nanoparticles. The unprecipitated solution containing a similar size of nanoparticles is centrifuged for the second time at 24,500 rpm for 60 min at 10 °C to obtain a densely packed precipitate. Then, the resulting supernatant is immediately removed from the precipitate to prevent the closed packed nature of nanoparticles. Then, this TiO2 precipitate is diluted with deionized water by the weight ratio of 2:1 and left for 3 h to form TiO2 gel. Meanwhile, a water-immiscible organic solvent mixture consisting of hexane and tetrachloroethylene with a volume ratio of 1:2 is used to cover the surface of a glass petri dish. Lastly, the TiO2 gel is loaded into the container of an air gun and sprayed with an angle of 45° on the organic mixture layer spread on the petri dish surface. The organic mixture layer enables the densely packed nanoparticles to float on the oil/water interface, which undergoes a phase transition resulting in spherical structures after evaporation [18,26]. Figure 2b–d demonstrates how the increase in applied pressure (0.5 bar, 1 bar, and 1.5 bar) of air gun results in smaller-sized microspheres.
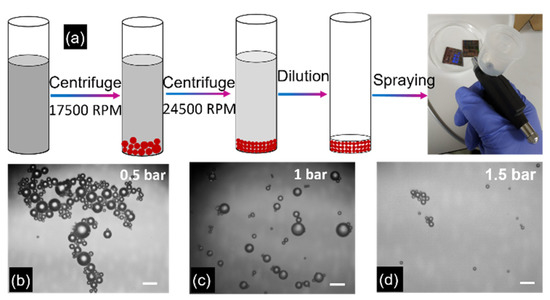
Figure 2.
(a) Schematic illustration of fabrication procedure of TiO2 microspheres, starting from two separate centrifuges, followed by dilution and spraying using an air gun. (b–d) Fabricated TiO2 microspheres as the function of applied air gun pressure using 0.5, 1, and 1.5 bar, respectively. Scale bar: 20 µm.
The fabricated meta-TiO2 microspheres are sprayed on a silicon chip and left to evaporate the water for 1 h. Later, BTG microspheres are spread on the same chip and 10 nm thick gold layer is coated on nanochip sample containing TiO2 and BTG microspheres together. A scanning electron microscope (SEM, Hitachi TM4000) is employed to confirm the spherical shapes of TiO2 microspheres and to compare with BTG ones.
For super-resolution imaging, both BTG and meta-TiO2 microsphere are immersed in a transparent host material to create a proper super-resolution imaging condition, which generates magnified virtual images of underlying nano-objects [21,27,28]. In this study, the PDMS host was used. To do this, Sylgard silicone elastomer and its curing agent was mixed in the weight ratio of 10:1 and stirred for 10 min. Next, this solution was placed in a vacuum chamber to remove bubbles. Meanwhile, meta-TiO2 particles were fabricated on a petri dish using 1 bar air gun pressure as described above and 15–20 μm sized BTG microsphere was spread on another dish. Then, the same weight of PDMS solution was poured on both dishes and left out overnight (without heating to avoid potential influence on optical properties) to solidify this polymeric solution, which resulted in the formation of two 400 µm thick PDMS films containing meta-TiO2 and BTG microspheres. The fabricated film with embedded BTG and meta-TiO2 microspheres was then placed on top of a semiconductor wafer containing different sizes and spacings of nanopatterns. Such samples were examined in reflection mode under a low-cost white light microscope (ICM100) using a 50× objective lens (NA = 0.6). In this regard, two nanopatterns of the semiconductor wafer and the comparison in their super-resolution capability through BTG and meta-TiO2 microspheres as described below.
3. Results
3.1. SEM Images of Meta-TiO2 and BTG Microsphere Superlens
Figure 3 shows SEM image of fabricated meta-TiO2 particles versus BTG particles on the same sample. The spheres can be easily distinguished based on the two simple observations as in Figure 3a: (1) Self-assembled TiO2 microspheres have large variation in their sizes with respect to BTG spheres and (2) BTG microspheres appear brighter due to the larger scattering of secondary electrons towards detector in comparison to TiO2 spheres. Furthermore, another nanochip sample of TiO2 microspheres has been mounted on a 60° tilted holder to see the side view of the fabricated microspheres. In this context, the combined image Figure 3b confirms the full spherical shapes of TiO2 microspheres sprayed on different nanofeatures of nanochip, this is the first report of such full-sphere TiO2 particle superlens made by the fabrication approach described above, different from previously reported hemisphere TiO2 superlens [18].
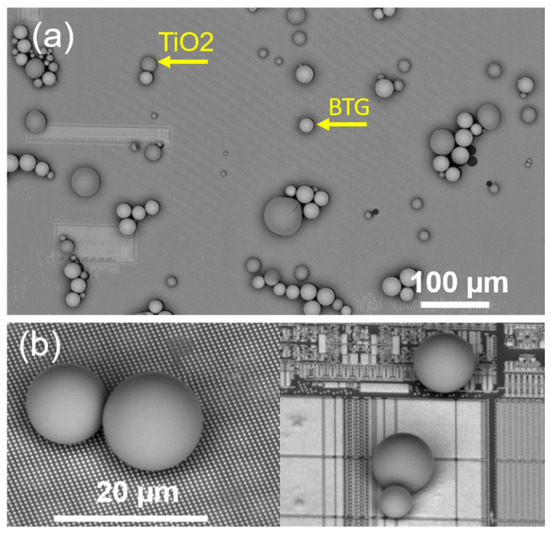
Figure 3.
(a) SEM image of meta-TiO2 (grey color) and BTG microspheres (bright) as indicated by arrows, separately. (b) A combined image of meta-TiO2 microspheres located on different nanofeatures to demonstrate their full-sphere shapes.
3.2. Super-Resolution Imaging Comparison
We now proceed to super-resolution imaging comparative results. Figure 4a shows the SEM image of meta-TiO2 lens located on wafer pattern of 400 nm-sized nano-discs with a lattice spacing of 225 nm, which is more clearly shown in the inset of the figure. This pattern can be resolved by both BTG and meta-TiO2 lens (size ~20–25 µm) as shown in Figure 4b,c, respectively, which demonstrates that meta-TiO2 microspheres resolve the pattern with sharp contrast in comparison to BTG microspheres (for maximized imaging contrast, light illumination was tilted by 15-deg from a normal incident in Figure 4b,c,e,f). Furthermore, the same experiment has been performed on another pattern with the smaller features of 109 nm, as shown in Figure 4d. Comparing Figure 4e,f, we can clearly see that meta-TiO2 lens surpasses BTG lens in imaging contrast, clarity, and field of view.
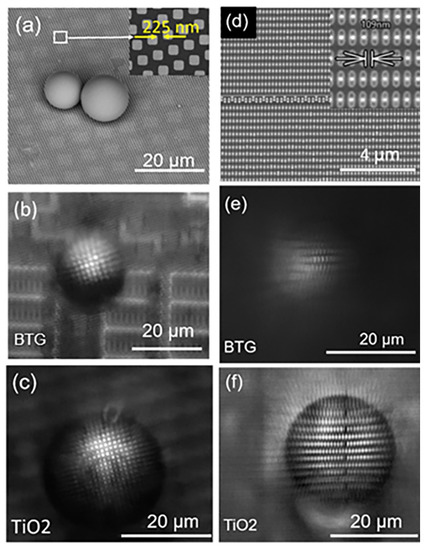
Figure 4.
(a) SEM image of Meta-TiO2 microspheres located on a wafer pattern of 400 nm features with a lattice spacing of 225 nm (Inset: Magnified image of the marked region). (b,c) Optical microscopic images of wafer pattern shown in (a) through BTG and TiO2 microspheres, respectively. (d) SEM image of wafer pattern with 109 nm spacings, while the inset shows the magnified image of the same nanopattern. (e,f) Optical microscopic images of wafer pattern shown in (d) through BTG and TiO2 microspheres, respectively.
For better comparison on imaging resolution, we have further carried out our imaging experiments using 90 nm line features on a wafer with a lattice spacing of 90 nm, which lies well below diffraction limit (~458 nm grating resolution, 229 nm feature resolution, for NA = 0.6 at 550 nm white-light peak wavelength), as shown in Figure 5a and its inset. Such 90 nm line features can hardly be resolved through the BTG microsphere, as presented in Figure 5b, while the super-resolved images of these 90-nm spaced line nanopatterns can be obtained through meta-TiO2 microspheres, as shown in Figure 5c.
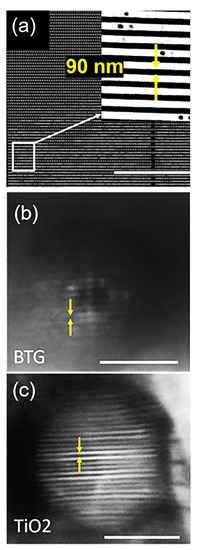
Figure 5.
(a) SEM image of wafer pattern with 90 nm spacings, while the inset shows the magnified image of marked region. (b,c) Optical microscopic images of wafer pattern shown in (a) through BTG and TiO2 microspheres, respectively. Scale bar: 10 µm.
4. Theory and Discussion
At nanoscale, the synthesized meta-TiO2 lens surface is not smooth and non-homogenous, consisting of nanoparticles and air voids between them (Figure 1b). Our previous research has shown such composite lens has a particle volume fraction of 61.3% (close to theoretical close-packing limit of ~64%), with an effective refractive index of 1.92 (for n = 2.50)–1.95 (for n = 2.55) [18]. In comparison, the BTG lens is formed by smooth and homogenous material, with refractive index 1.92 chosen to match the index of the fabricated TiO2 lens. As a result, for similar-sized TiO2 and BTG lenses, their magnification factors will be close to each other. This was confirmed in experiments, as shown in Figure 4. The better imaging performance of TiO2 lens over BTG lens thus cannot be satisfactorily explained by the classical effective medium theory (EMT), as both have the same effective index of 1.92. Instead, the fundamentals must be related to the non-homogeneous nature in nanoscale of the TiO2 composite medium. It is virtually impossible to build an exact 3D model for the TiO2 lens, which consists of millions of nanoparticles. The model needs to be simplified to a level our computer can handle. We simply 3D meta-sphere as a 2D cylinder model, with the top of the cylinder further simplified as a homogenous medium using EMT theory, while the bottom part of cylinder remains as nanoparticle stack. This simplification was illustrated in Figure 6b. The model was then built and simulated by full-wave software CST Microwave Studio. By placing an electric dipole source (z-polarized, perpendicular to the plane) close to the bottom of the particle lenses, we can analyze how the particle superlenses (for both BTG and TiO2) collect dipole radiation energy (including evanescent and propagating wave components) and direct them into the far-field. To ensure a direct comparison is possible, all modeling settings were kept the same for both particle lens cases. The E-field distribution in Figure 6c,d shows both particles work similarly in directing the radiation energy into the far-field, which is also evidenced from far-field pattern in Figure 6i. However, we can see TiO2 lens collects a bit more energy than BTG lens, as evidenced by the longer main lobe in far-field pattern in Figure 6i. This difference comes from the root of near-field interaction between dipole source and particle lens. From Figure 6e,f, we can see the root of the difference in near-field scattering, the TiO2 nanoparticles in composite medium generate photonic nanojets array with jet dimension similar to a particle size of 20 nm (see Figure 6f,g), such high-frequency modulation provides a channel for evanescent wave components to be carried on top of propagating wave components into the far-field, which is more clearly seen in extracted data in Figure 6h. When the dipole source is x-polarized, the far-fields (Figure 6i) tend to be reduced while near-field jet strength tends to be increased (Figure 6g). However, for a 3D sphere model, both z-polarized and x-polarized dipoles will produce the same near-field and far-field results due to symmetry in a spherical object. In theory, the ultimate resolution (defined as feature resolution) of TiO2 meta-lens will be 20 nm, equal to its composition particle size of 20 nm in the current case, but in reality, manufacturing imperfection and other factors, such as non-ideal contact between imaging objects and lens, will reduce the practical resolution, in our current case, with a full-sphere TiO2 lens, the feature resolution is about 90 nm (grating resolution 180 nm). Better feature resolution of 45 nm has previously been achieved for hemisphere TiO2 lens owing to much better contact between lens and imaging objects [18]. Overall, it is reasonable to conclude that nanocomposite medium design is beneficial for super-resolution development and represents a promising solution to the future development of more powerful, robust, and reliable dielectric superlens. The disadvantage is that it will be limited to surface near-field imaging and difficult to expand as 3D super-resolution imaging. In the next step, we are looking to incorporate upconversion nanoparticles (UCNPs) into the synthesis process of meta-TiO2 superlens for biomedical super-resolution imaging applications.
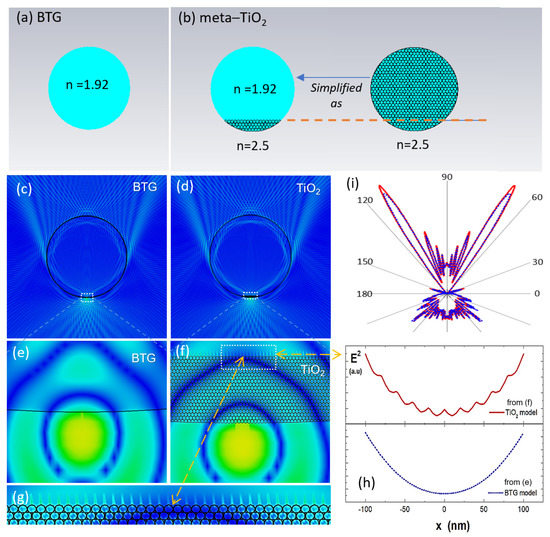
Figure 6.
Modeling and comparison of electric field distribution of 20-µm-diameter (a) BTG and (b) meta-TiO2 micro lenses under electric dipole source excitation. Field distribution for dipole source scattered by (c) BTG particle, and (d) TiO2 particle. (e) Magnified view of near-field distribution in (c) marked zone. (f) Magnified view of near field around dipole source in (d) marked area. Noting the formation of tiny photonic jet array in (f), and (g) corresponding magnified view. (h) 1D plots of near-field intensity along indicated location in (f), and the same location in (e) (not shown). (i) Far-field scattering diagram for BTG (blue dash) and TiO2 (red solid), showing the same radiation pattern for both lenses but with large intensity at the main lobe for TiO2.
5. Conclusions
In summary, this work has confirmed the superiority of using TiO2 metamaterial lens in super-resolution imaging development over BTG microsphere lens, with enhanced imaging contrast, clarity, and resolution under similar experimental conditions. It provides a solid foundation to the development of next-generation, more powerful, robust, and reliable optical nano-imaging platforms based on dielectric super lenses.
Author Contributions
Conceptualization, Z.W. and C.P.; methodology, R.D., B.Y. and Z.W.; simulation, B.Y. and Z.W.; experimental investigation, R.D.; writing—original draft preparation, R.D.; writing—review and editing, Z.W. and C.P.; supervision, Z.W. and C.P. All authors contributed to the general discussions and have read and agreed to the published version of the manuscript.
Funding
This research was funded by European Union’s Horizon 2020 research and innovation program, grant number 737164 (SUMCASTEC).
Data Availability Statement
The data are available from the corresponding author upon reasonable request.
Conflicts of Interest
The authors declare no conflict of interest.
References
- Abbe, E. Beiträge zur Theorie des Mikroskops und der mikroskopischen Wahrnehmung. Archiv. Mikrosk. Anat. 1873, 9, 413–418. [Google Scholar] [CrossRef]
- Novotny, L.; Hecht, B. Principles of Nano-Optics; Cambridge University Press: Cambridge, UK, 2012. [Google Scholar]
- Pohl, D.W.; Denk, W.; Lanz, W. Optical stethoscopy: Image recording with resolution λ/20. Appl. Phys. Lett. 1984, 44, 651. [Google Scholar] [CrossRef]
- Pendry, J.B. Negative Refraction Makes a Perfect Lens. Phys. Rev. Lett. 2000, 85, 3966. [Google Scholar] [CrossRef] [PubMed]
- Shelby, R.A.; Smith, D.R.; Schultz, S. Experimental verification of a negative index of refraction. Science 2001, 292, 77–79. [Google Scholar] [CrossRef]
- Smith, D.R.; Padilla, W.J.; Vier, D.C.; Nemat-Nasser, S.C.; Schultz, S. Composite medium with simultaneously negative permeability and permittivity. Phys. Rev. Lett. 2000, 84, 4184–4187. [Google Scholar] [CrossRef] [PubMed]
- Fang, N.; Lee, H.; Sun, C.; Zhang, X. Sub-diffraction-limited optical imaging with a silver superlens. Science 2005, 308, 534–537. [Google Scholar] [CrossRef] [PubMed]
- Jacob, Z.; Alekseyev, L.V.; Narimanov, E. Optical hyperlens: Far-field imaging beyond the diffraction limit. Opt. Express 2006, 14, 8247–8256. [Google Scholar] [CrossRef]
- Liu, Z.; Lee, H.; Xiong, Y.; Sun, C.; Zhang, X. Far-field optical hyperlens magnifying sub-diffraction-limited objects. Science 2007, 315, 1686. [Google Scholar] [CrossRef]
- Xiong, Y.; Liu, Z.; Sun, C.; Zhang, X. Two-dimensional Imaging by far-field superlens at visible wavelengths. Nano Lett. 2007, 7, 3360–3365. [Google Scholar] [CrossRef]
- Dhama, R.; Rashed, A.R.; Caligiuri, V.; El Kabbash, M.; Strangi, G.; De Luca, A. Broadband optical transparency in plasmonic nanocomposite polymer films via exciton-plasmon energy transfer. Opt. Express 2016, 24, 14632–14641. [Google Scholar] [CrossRef] [PubMed]
- Betzig, E.; Patterson, G.H.; Sougrat, R.; Lindwasser, O.W.; Olenych, S.; Bonifacino, J.S.; Davidson, M.W.; Lippincott-Schwartz, J.; Hess, H.F. Imaging intracellular fluorescent proteins at nanometer resolution. Science 2006, 313, 1642–1645. [Google Scholar] [CrossRef]
- Wang, Z.; Guo, W.; Li, L.; Lukyanchuk, B.; Khan, A.; Liu, Z.; Chen, Z.; Hong, M. Optical virtual imaging at 50 nm lateral resolution with a white-light nanoscope. Nat. Commun. 2011, 2, 218. [Google Scholar] [CrossRef]
- Darafsheh, A.; Limberopoulos, N.I.; Derov, J.S.; Walker, D.E., Jr.; Astratov, V.N. Advantages of microsphere-assisted super-resolution imaging technique over solid immersion lens and confocal microscopies. Appl. Phys. Lett. 2014, 104, 061117. [Google Scholar] [CrossRef]
- Wang, F.F.; Liu, L.Q.; Yu, H.B.; Wen, Y.D.; Yu, P.; Liu, Z.; Wang, Y.C.; Li, W.J. Scanning superlens microscopy for non-invasive large field-of-view visible light nanoscale imaging. Nat. Commun. 2016, 7. [Google Scholar] [CrossRef]
- Darafsheh, A.; Walsh, G.F.; Dal Negro, L.; Astratov, V.N. Optical super-resolution by high-index liquid-immersed microspheres. Appl. Phys. Lett. 2012, 101. [Google Scholar] [CrossRef]
- Lee, S.; Li, L.; Wang, Z.; Guo, W.; Yan, Y.; Wang, T. Immersed transparent microsphere magnifying sub-diffraction-limited objects. Appl. Opt. 2013, 52, 7265–7270. [Google Scholar] [CrossRef]
- Fan, W.; Yan, B.; Wang, Z.; Wu, L. Three-dimensional all-dielectric metamaterial solid immersion lens for subwavelength imaging at visible frequencies. Sci. Adv. 2016, 2, e1600901. [Google Scholar] [CrossRef]
- Yue, L.Y.; Yan, B.; Wang, Z.B. Photonic nanojet of cylindrical metalens assembled by hexagonally arranged nanofibers for breaking the diffraction limit. Opt. Lett. 2016, 41, 1336–1339. [Google Scholar] [CrossRef] [PubMed][Green Version]
- Monks, J.N.; Yan, B.; Hawkins, N.; Vollrath, F.; Wang, Z.B. Spider Silk: Mother Nature’s Bio-Superlens. Nano Lett. 2016, 16, 5842–5845. [Google Scholar] [CrossRef]
- Wang, Z.; Lukyanchuk, B. Super-resolution imaging and microscopy by dielectric particle-lenses. In Label-Free Super-Resolution Microscopy; Astratov, V., Ed.; Springer: Berlin/Heidelberg, Germany, 2019. [Google Scholar]
- Wang, Z.B.; Lukyanchuk, B.; Yue, L.Y.; Yan, B.; Monks, J.; Dhama, R.; Minin, O.V.; Minin, I.V.; Huang, S.M.; Fedyanin, A.A. High order Fano resonances and giant magnetic fields in dielectric microspheres. Sci. Rep. 2019, 9. [Google Scholar] [CrossRef]
- Yue, L.Y.; Yan, B.; Monks, J.N.; Dhama, R.; Jiang, C.L.; Minin, O.V.; Minin, I.V.; Wang, Z.B. Full three-dimensional Poynting vector flow analysis of great field-intensity enhancement in specifically sized spherical-particles. Sci. Rep. 2019, 9. [Google Scholar] [CrossRef]
- Wang, Z.B. Microsphere super-resolution imaging. In Nanoscience; Paual O Brien, J.T., Ed.; Royal Society of Chemistry: London, UK, 2016; Volume 3, pp. 193–210. [Google Scholar]
- Luk’yanchuk, B.S.; Paniagua-Dominguez, R.; Minin, I.; Minin, O.; Wang, Z.B. Refractive index less than two: Photonic nanojets yesterday, today and tomorrow [Invited]. Opt. Mater. Express 2017, 7, 1820–1847. [Google Scholar] [CrossRef]
- Kang, D.; Pang, C.; Kim, S.M.; Cho, H.S.; Um, H.S.; Choi, Y.W.; Suh, K.Y. Shape-Controllable Microlens Arrays via Direct Transfer of Photocurable Polymer Droplets. Adv. Mater. 2012, 24, 1709–1715. [Google Scholar] [CrossRef]
- Darafsheh, A.; Guardiola, C.; Palovcak, A.; Finlay, J.C.; Cárabe, A. Optical super-resolution imaging by high-index microspheres embedded in elastomers. Opt. Lett. 2015, 40, 5–8. [Google Scholar] [CrossRef] [PubMed]
- Yan, B.; Wang, Z.B.; Parker, A.L.; Lai, Y.K.; Thomas, P.J.; Yue, L.Y.; Monks, J.N. Superlensing microscope objective lens. Appl. Opt. 2017, 56, 3142–3147. [Google Scholar] [CrossRef] [PubMed]
Publisher’s Note: MDPI stays neutral with regard to jurisdictional claims in published maps and institutional affiliations. |
© 2021 by the authors. Licensee MDPI, Basel, Switzerland. This article is an open access article distributed under the terms and conditions of the Creative Commons Attribution (CC BY) license (https://creativecommons.org/licenses/by/4.0/).