Article

Multi-Wavelength Optical Patterning for Multiscale Materials Design

by
Biagio Audia
1,
Pasquale Pagliusi
1,2,
Alfredo Mazzulla
2 and
Gabriella Cipparrone
1,*
1
Department of Physics, University of Calabria, Ponte P. Bucci 31B, 87036 Rende, Italy
2
CNR Nanotec—Institute of Nanotechnology, S.S. Cosenza, 87036 Rende, Italy
*
Author to whom correspondence should be addressed.
Photonics 2021, 8(11), 481; https://doi.org/10.3390/photonics8110481
Submission received: 30 September 2021 / Revised: 20 October 2021 / Accepted: 25 October 2021 / Published: 28 October 2021
(This article belongs to the Special Issue Materials, Methods and Models for Holographic Optical Elements)

Abstract

:
Laser interferometry is a consolidated technique for materials structuring, enabling single step and large area patterning. Here we report the investigation of the morphological modification encoded on a thin film of a photosensitive material by the light interference pattern obtained from a laser operating in multiline mode. Four lines with equal intensity are retained, with the same p linear polarization. An azopolymer is exploited as medium for the holographic recording. Optical microscopy and profilometer measurements analyze the modification induced in the bulk and on the surface of the irradiated area. We show that the intensity profile of the interference patterns of two laser beams is the one obtained assuming each line of the laser as an independent oscillator of given intensity and wavelength, and how these light structures are faithfully replicated in the material bulk and on the topography of the free surface. Patterns at different length scales are achievable in a single step, that can be traced back to both interference fringes and wave envelopes. The proposed multi-wavelength holographic patterning provides a simple tool to generate complex light structures, able to perform multiscale modifications of photoresponsive materials

1. Introduction

Photoresponsive materials, which undergo significant structural transformations in response to an external light stimulus, have been widely investigated in the last decades, mainly to perform remote control of surface and bulk materials properties, aimed at applications in the field of surface structuring [1,2], for the development of multifunctional platforms for biomedical applications [3,4], tissue engineering and drug delivery [5,6], anti-counterfeiting solutions [7,8] and light actuators [9,10].
The capability to design complex light architectures attracts strong interest based on the increased level of complexity that can be encoded in the materials. Of course, this concept can be useful in anti-counterfeiting by improving the level of security through physical unclonable functions [11,12], or to design morphological gradients on the surfaces suitable to investigate how they affect the response of living systems (motion, migration, differentiation, etc.) [13].
For the abovementioned applications, materials sensitive also to the light polarization offer many possibilities by introducing additional control parameters beyond the light energy. Azobenzene-based systems have emerged as appealing candidates for these applications because of their capability to efficiently convert optical energy into mechanical deformations [14], that give rise to tunable bulk and surface modifications [15]. When a thin film of these materials, like azopolymers, is illuminated with an interference light pattern, surface relief gratings (SRGs) arise, due to the opto-mechanical stresses generated in the material bulk as consequence of the photoinduced isomerization processes [16,17]. The internal stresses are generated by consecutive cycles of cis-trans photoinduced isomerization and by the consequent reorientation that involves azobenzene moieties [18]. This process is guided by the light polarization since reorientation of the chromophores occurs perpendicularly to it. The bulk birefringence modulation originates optical gratings and, depending on the material, this modulation results in an optical force that produces a SRGs [19]. These gratings show great promise as diffractive photonic elements [20,21], biosensing substrates [22,23], or as nano-/microfabrication templates [24,25].
An interesting peculiarity offered by the azobenzene-based materials lies in the reversibility of the involved photochemical processes that allow dynamical control over the inscribed structures. It is well known that SRGs recorded in thin polymer films can be thermally and/or optically erased, by heating the sample above the glass transition temperature (Tg) [26,27], by homogenous irradiation [2,28] or spatially shifting the recording interference pattern [29].
Starting from the simplest approach, based on two interfering laser beams, in several interferometric geometries like Mach-Zehnder or Lloyd configurations [30,31], modulation of the light intensity or polarization with a sinusoidal profile have been exploited as the straightforward method to perform large area patterning in a single step. Alternative approaches including spatial light modulator assisted techniques [32,33], direct laser writing [34,35], computer generated holograms [36,37] have been then developed to design physical and/or morphological complex structures on azobenzene-based systems and other photoresponsive materials, but they often do not allow large area patterning in a single step.
Herein, we show the feasibility to simultaneously generate multiscale holographic patterning, in a single step, exploiting the simplest interference geometry and a multiline laser source. We found inspiration in a series of papers where holographic color interferometry was used as a measurement routine in the fluid/aerodynamic fields [38,39,40]. In this work, instead, the concept of using different wavelength has been applied as recording technique to encode complex morphological modification on a photoresponsive azopolymer thin film.
The material is exposed to an interference pattern produced by the superposition of two beams composed by four laser lines (namely 476.5, 488, 496.5 and 514.5 nm), linearly polarized and with same intensity, generated by an argon ion source. Optical microscopy and profilometry investigations have been performed to characterize the bulk and surface features of the sample after the exposure. The proposed technique provides a new simple tool to generate complex fringe patterns able to perform multiscale modification of the materials morphology.

2. Materials and Methods

2.1. Preparation of Azopolymer Thin Films

Polydisperse red 1 methacrylate (PDR1Ma, Sigma Aldrich, St. Louis, MO, USA) has been selected as azobenzene based-material for the present study. A small amount of solution, prepared dissolving the polymer in chloroform (7% w/v) and then filtered through a nylon filter (Corning Incorporated, Corning, NY, USA) with 0.45 μm pore size was dispensed on conventional microscope glass-slides by spin coating at 2000 rpm for 60 s, yielding uniform, high-quality thin films, 470 ± 10 nm thick as measured by a Veeco Dektak-8 profilometer (Plainview, NY, USA). The microscope slides were previously washed with distilled water and isopropanol and then ultrasonicated in acetone for 10 min.

2.2. Multi-Wavelength Interferometry

The laser chosen to produce multiwavelength pattern is an argon ion (Ar+) laser operating in multiline configuration (Innova 90C, Coherent, Santa Clara, CA, USA). It produces a light beam with up to eight visible lines, ranging from 457.9 nm to 514.5 nm, and a maximum total power of about 4.5 W in TEM00 mode. The diameter of the Gaussian beam is about 3 mm (full width at half maximum or FWHM), and the polarization state is linear. By properly setting the current operation value, we retain four wavelengths, namely 476.5 nm (λ1), 488 nm (λ2), 496.5 nm (λ3), 514.5 nm (λ4),as checked by measuring the spectrum of the laser beam (see Figure 1a) with a fiber-coupled spectrometer (AvaSpec-ULS2048, Avantes, NS Apeldoorn, The Netherlands). Based on the absorption spectrum of the chosen azopolymer, its photo-response is expected to be almost constant for the four selected wavelengths (Figure 1b).
A top view scheme of the experimental setup used to generate the light pattern is shown in Figure 2. Since λ1 and λ4 are initially much more intense compared to the other two wavelengths, the Ar+ laser beam is directed through a filter (composed of a half wave plate and a polarizer, P1, with the optical axis oriented in the vertical y-direction) with the aim to equalize the intensity values of the four lines. To ensure efficient SRG formation, the outcome polarization is then rotated along the horizontal x-direction [19], p-polarization, combing a broadband quarter wave plate and a second polarizer, P2.
After the above manipulation, the beam is split into two equal intensity beams by a non-polarizing cube beam splitter and directed towards the sample. The two multiline beams cross at a small angle (θ~4.5°) with the z-axis (propagation direction) and generate the light pattern in the xy plane at the overlapping position. The sample is exposed to the resulting interference figure for 15 min setting each beam power at 10 mW.
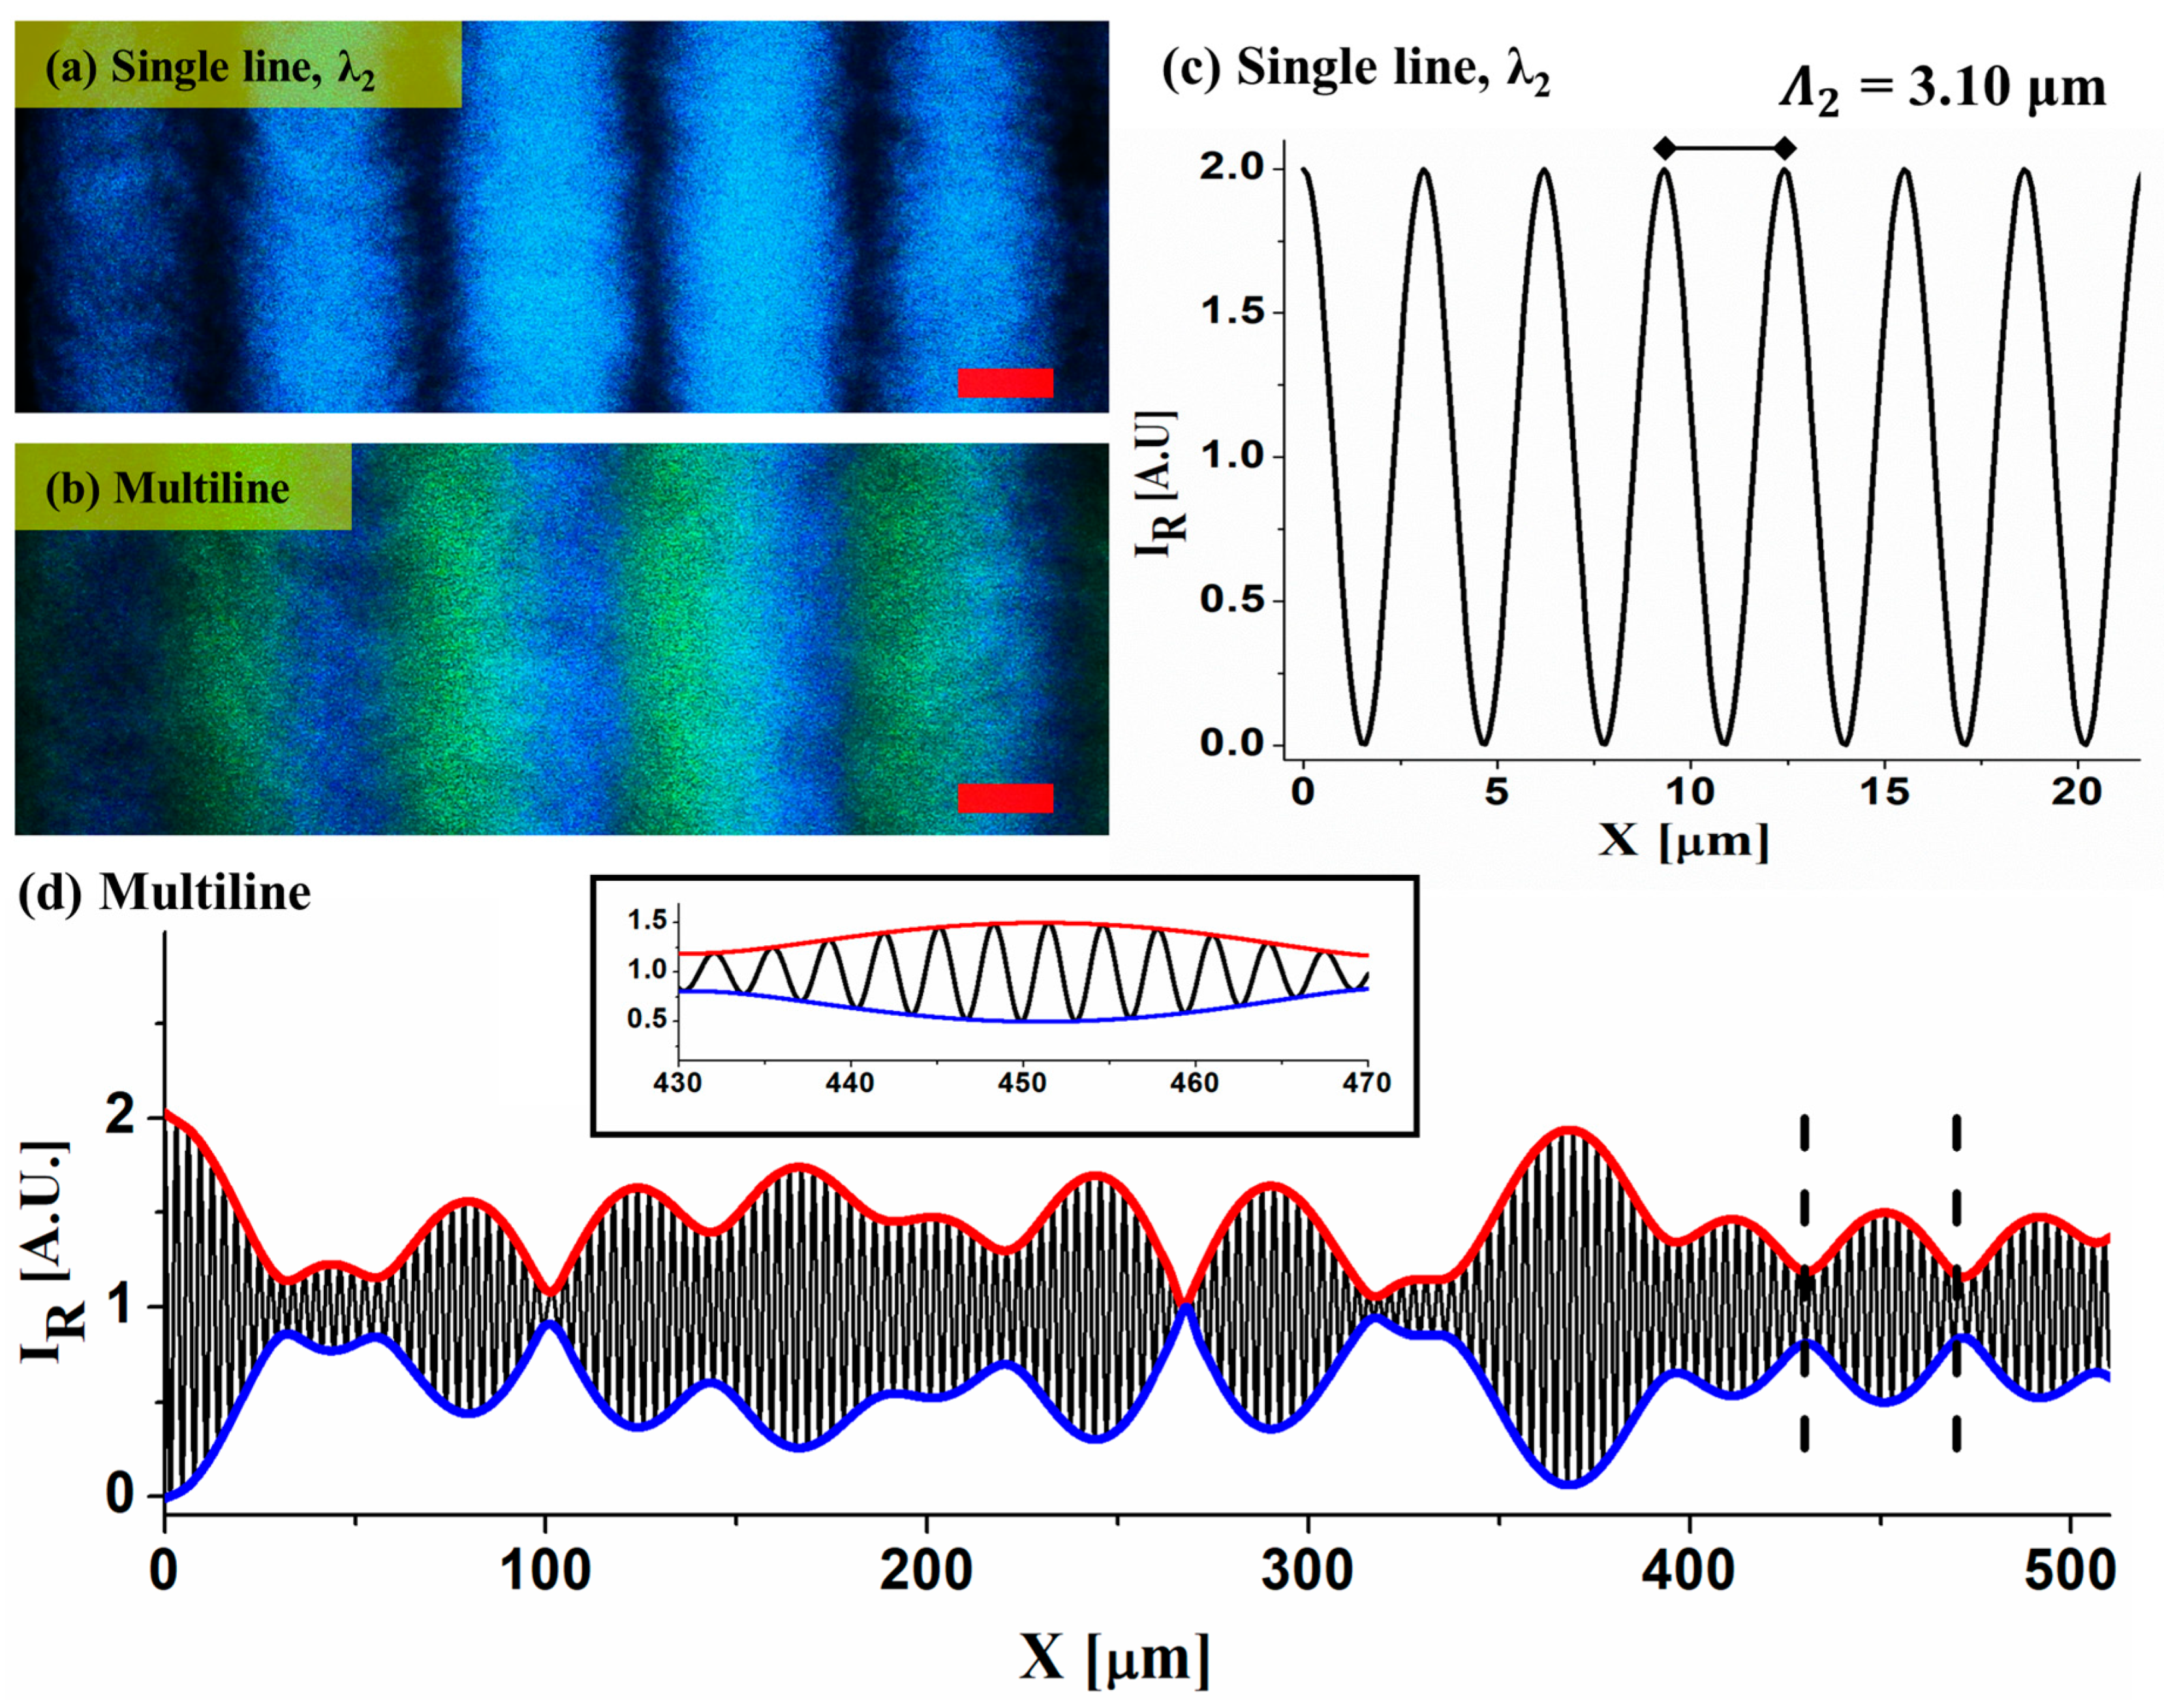
As well known, when a single laser line is operating, the interference pattern of two plane waves with the same polarization state consists of an alternation of equidistant bright and dark fringes as reported in Figure 3a for the λ2. When instead the multiline configuration is used and the four lines are selected the fringes produced in the superposition region form a not uniform pattern, shown in Figure 3b, where different colors appear.
By assuming each individual laser line as a fully independent oscillator of given wavelength and intensity, a simple calculus enables to reconstruct the expected pattern. By applying the superposition principle, the resulting intensity profile of the interference figure, can be combined to yield the following light spatial distribution (with uniform polarization) along the x-axis [41]:
I R = i I i 1 + cos 4 π x s i n θ λ i
As shown in Figure 3c, in the case of a single line the Equation (1) returns the renowned sinusoidal modulation (λ2 has been used for the calculation). The spatial periodicity Λ2 of the resulting intensity pattern is easily ascribable to the geometric parameters of the recording set-up, since Λi = λi/2sin(θ). On the other hand, if Equation (1) is evaluated using the four selected wavelengths, the resulting intensity is no longer symmetrical but produces a complex beat-like pattern (Figure 3d). This kind of interference pattern evidently depends on the number of lasing lines and on their instantaneous power output. The resulting intensity is characterized by a modulation over two different length scales. As highlighted by the upper (red line) and lower (blue line) envelope in Figure 3d, which has been superimposed on the interference pattern, the beat introduces a non-periodic modulation over a large length scale. While the amplitude of this modulation follows the envelopes with width in the range 50–80 μm, the individual fringes that constitute the beat (see the inset in Figure 3d) are generated on a shorter length scale attributable to the recording parameters (lines wavelength and crossing angle). However, these fringes, unlike the figure generated by a single line, present a not-constant modulation. Along the pattern is verified that the distance between two relative maxima (or minima) varies in a range that includes the spatial periodicities, Λi, of the individual laser wavelengths (Λ1 = 3.03 μm–Λ4= 3.25 μm).
Because of the great flexibility of the method, by changing the crossing angle, the number of lines and/or their relative intensities, different light patterns suitable for the present scope can be generated (see Figure S1).

3. Results and Discussion

As expected for an azobenzene-based polymer, due to the light irradiation it undergoes cyclic molecular shape change (i.e., cis-trans isomerization). The photoinduced isomerization of the azobenzene units provides cooperative processes able to induce supramolecular orientation effects in the materials bulk and even matter motion generating topographical modifications [14,15,16,17,18,19].
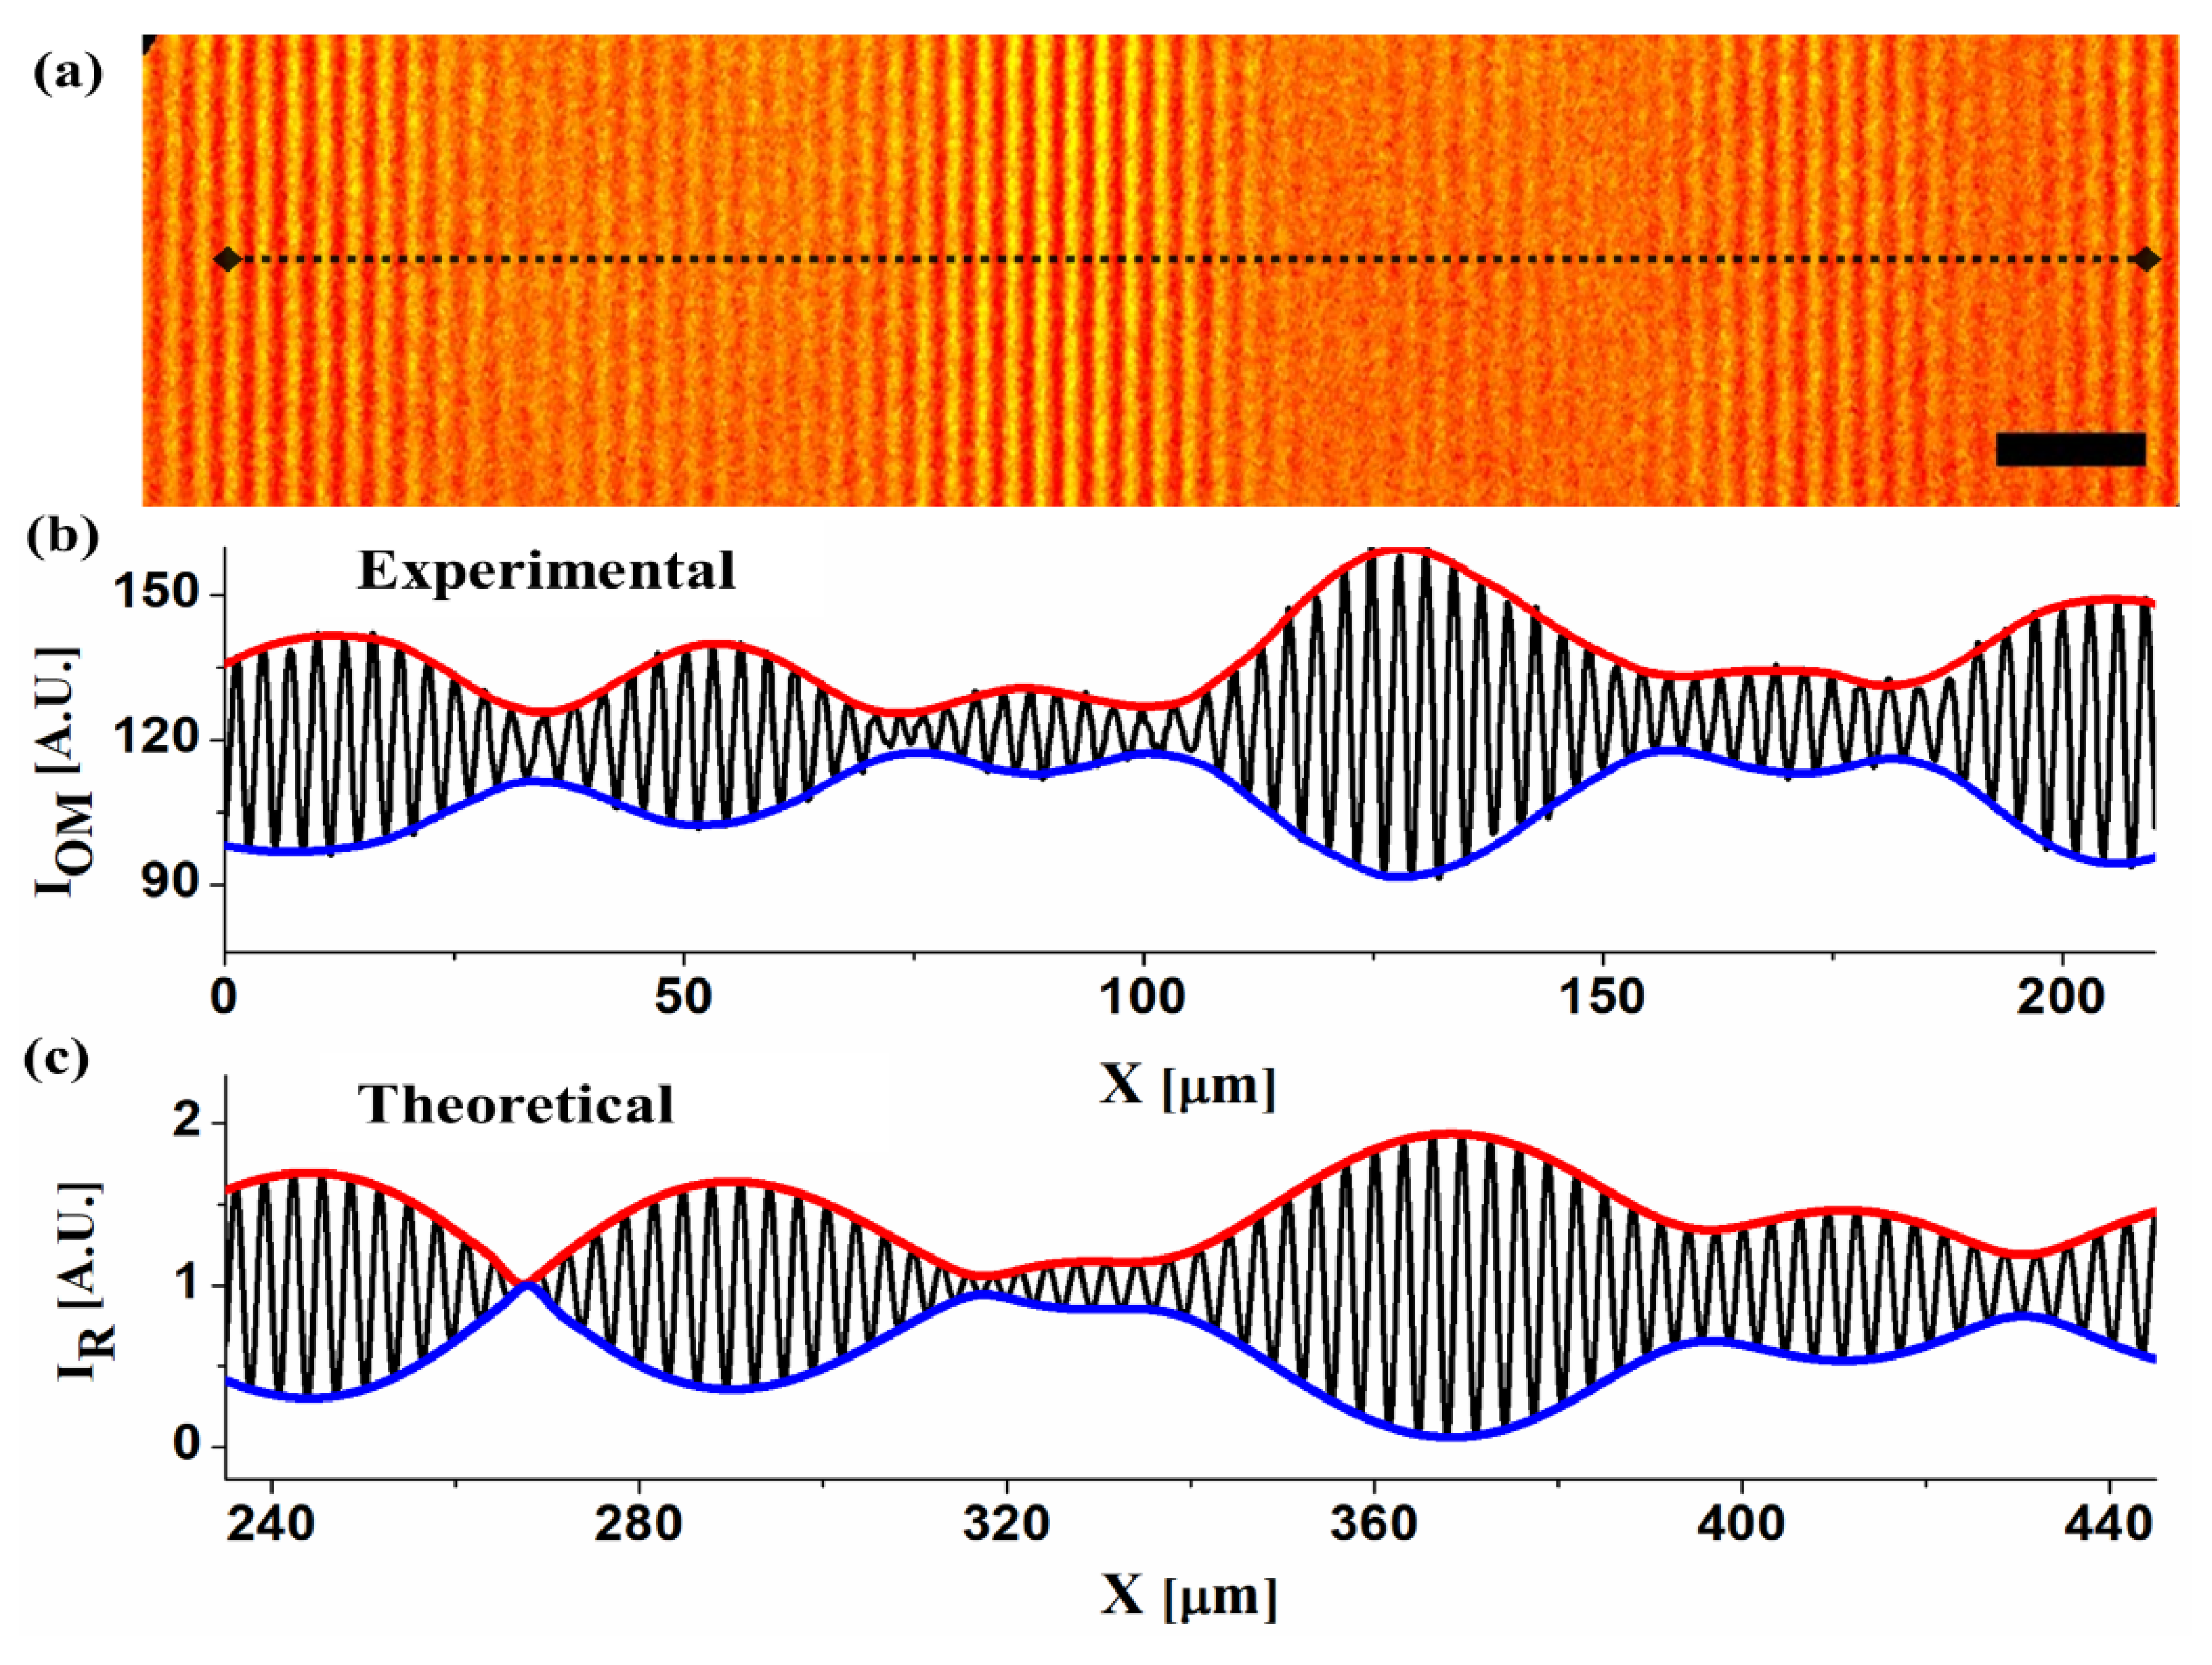
When a film of azo based materials is exposed to spatially modulated light intensity or polarization, local anisotropies within the polymer film (due to local variations of polarization, density, molecular ordering of the azo-groups) are induced and, accordingly, modulated, yielding to grating formation in the bulk and on the surface (SRG) [16,17,18,19]. Figure 4a shows the optical microscope image (Leica DMRX, Leica, Wetzlar, Germany) of a zone of the irradiated area after exposure to the multiline interference pattern. The image is acquired in bright field transmission mode by illuminating the sample with white light polarized parallel to the grating wave vector. In Figure 4b the intensity profile, acquired along the black dotted line in Figure 4a (perpendicular to the fringes), is reported. It highlights and confirms as a not uniform beat-like optical structuration is encoded in the materials bulk.
Looking at the graph in Figure 4c, which reports a segment of the evaluated intensity modulation (see Figure 3d), it is clear that the polymer faithfully replicates the interference figure, both on the large length scale, where the envelope acts modulating the light fringes contrast, and on a shorter scale by replicating the individual fringes. The results reported in the Figure 4c,d confirm the assumption of the constant response of the polymer in the spectral range where the laser lines lay, indeed, the two patterns can be superimposed. Moreover, based on this feature it is possible to faithful replicate the multiwavelength light pattern in the material bulk, and easily and directly retrieves it by optical reading.
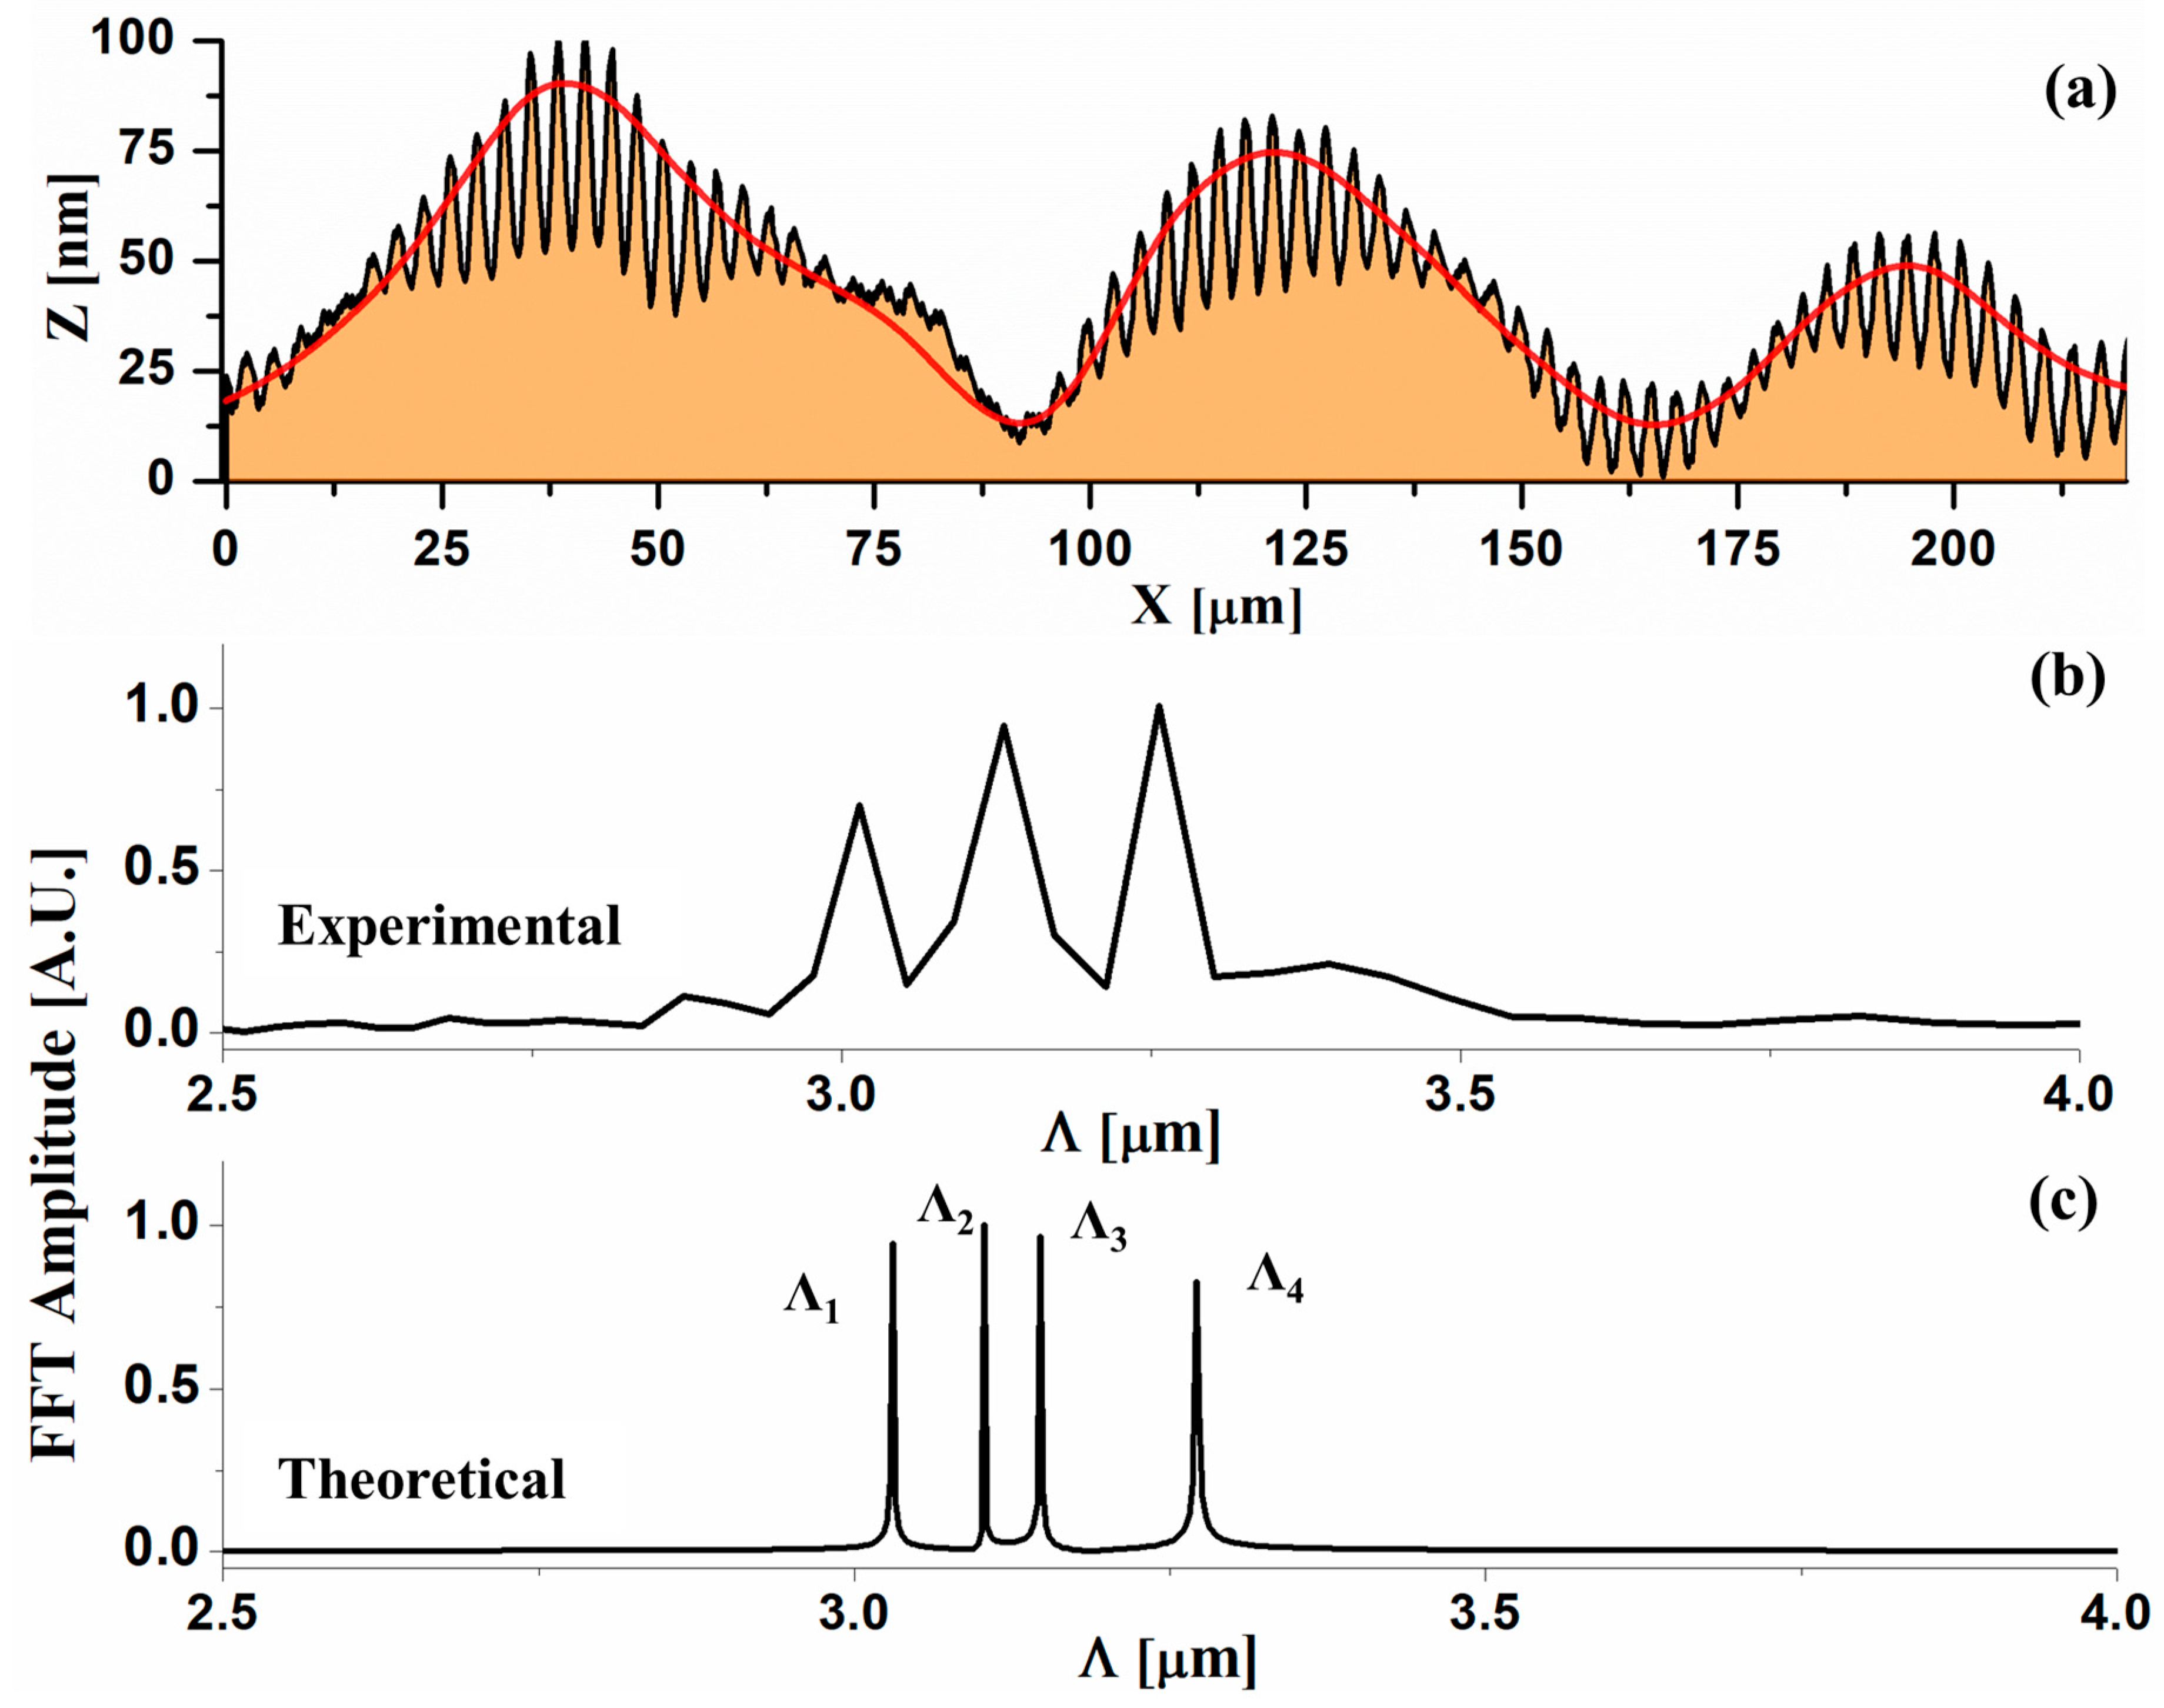
We next study the response of the materials surface to the light pattern. In Figure 5a is show a 200 μm-length portion of the film topography acquired by scanning the surface with a profilometer, along the direction of the grating wavevector. The material’s surface, as well as the optical anisotropies in the bulk, also displays a multi-scale modulation. The response to the interference pattern generates large-scale reliefs (tens of microns width and 100 nm height) composed of individual ridges of variable depth, from few nanometers up to 60 nm, which develop along a length scale of the order of a few microns.
Contrarily to the bulk optical modulation that originates from a local effect (the orientation of the azobenzene moieties perpendicular to the optical field), the surface deformations are not local since they are caused by mechanical stresses originating, in the case of light intensity patterns, from thermal gradients, permittivity gradients or electric force gradients due to the photoinduced anisotropy of the material [16,17,18,19]. Based on this feature and on the complex structure of the light patterns produced by multilines recording, the intensity profile cannot be easily recognized in the topography of the irradiated area, preventing a direct comparison with the surface profile. Nevertheless, the Fourier analysis gives good results in this regard.
In Figure 5b is reported the Fourier analysis of the acquired surface profile (see Figure 5a) with the aim to compare it with the one showed in Figure 5c obtained from the theoretical intensity profile evaluated for the four wavelengths (see Figure 3d). The Fourier peaks derived from the experimental profile are approximately at (3.0 ± 0.1) μm, (3.1 ± 0.1) μm, (3.3 ± 0.1) μm and displays the same Fourier amplitude. They match well the peaks of the intensity profile, as predicted by the theory, both in terms of the spatial periodicities and relative amplitudes. It should be noted that in the theoretical analysis shows four peaks at 3.03 μm (Λ1), 3.10 μm (Λ2), 3.15 μm (Λ3) and 3.27 μm (Λ4). Due to the low spatial resolution of the topography measurements, the two closest peaks (Λ2 and Λ3) cannot be resolved.
The experimental observation of a surface modulation over a larger scale (tens of microns, see Figure 5a) suggest that, according to the selected wavelengths and the designed interference pattern, also wave envelope profiles are recorded. Since envelope configuration corresponds to a fringes contrast modulation, a change in the ridges’ depth along the larger modulation of the surface is observed that does not necessarily coincide with its minimum.
The Fourier analysis of the grating profile acquired in a different irradiated region of the sample (see Figure S2), displays the same peaks with comparable amplitude in the range 3.0–3.3 μm and the peaks related to the wide envelope modulation, in the range 30–70 μm. Obviously, by changing the crossing angle, it is possible to modify both the small- and large-scale structures (the bulk and surface ones), according to Figure S1.
The reported investigations are of particular interest because of the great potential of the technique for multiscale patterning in materials structuring. Indeed, the capability to select the laser lines and tune their intensity offer the possibility to design a wide range of light pattern configurations with a high degree of complexity.

4. Conclusions

Laser interferometry with a source operating in multiline mode is used to produce optical and morphological modifications in an azopolymer thin film. The intensity profile of the patterns resulting from the two beams superposition depends on the number of wavelengths in the laser beam and their relative intensity. By considering the case of four lines with equal intensity, the optical structures recorded on the sample replicate both small scale modulations related to the wavelengths and beat envelope at large scale. The Fourier analysis of the surface relief profile, whose shape is mediated by the photomechanical response of the material, matches the Fourier components of the evaluated intensity profile of the pattern. A superimposed large-scale structure of the relief is observed, that can be ascribed to the light beat envelop. The reported results show that the proposed method enables single step recording of multiscale structures with a wide range of pitches on photoresponsive materials. Moreover, the possibility to manage the number of wavelengths retained in the laser beam and their relative intensity suggest the large flexibility offered by this method to create multifunctional platform for biology and medicine, tissue engineering and anti-counterfeiting methods.

Supplementary Materials

The following are available online at https://www.mdpi.com/article/10.3390/photonics8110481/s1, Interference light patterns (Figure S1) and Surface patterning(Figure S2).

Author Contributions

B.A.: Formal analysis, Investigation, Methodology, Visualization, Writing—original draft, Writing—review & editing. P.P.: Formal analysis, Methodology, Visualization, Writing—review & editing. A.M.: Formal analysis, Methodology, Visualization, Writing—review & editing. G.C.: Conceptualization, Formal analysis, Methodology, Supervision, Visualization, Writing—original draft, Writing—review & editing. All authors have read and agreed to the published version of the manuscript.

Funding

This research received no external funding.

Acknowledgments

Biagio Audia acknowledges POR Calabria FSE/FESR 2014–2020 for financial support. The authors acknowledge the support of the project ARS01_00401 “DEMETRA—Sviluppo di tecnologie di materiali e di tracciabilità per la sicurezza e la qualità dei cibi” of the Italian Ministry of University and Research.

Conflicts of Interest

The authors declare no conflict of interest.

References

  1. Salvatore, M.; Oscurato, S.L.; Maddalena, P.; Ambrosio, A. Light-Induced Complex Surface Structuring of Azobenzene-Containing Materials; Elsevier Inc.: Amsterdam, The Netherlands, 2020; ISBN 9780128168653. [Google Scholar]
  2. Jelken, J.; Santer, S. Light induced reversible structuring of photosensitive polymer films. RSC Adv. 2019, 9, 20295–20305. [Google Scholar] [CrossRef] [Green Version]
  3. Gao, S.; Tang, G.; Hua, D.; Xiong, R.; Han, J.; Jiang, S.; Zhang, Q.; Huang, C. Stimuli-responsive bio-based polymeric systems and their applications. J. Mater. Chem. B 2019, 7, 709–729. [Google Scholar] [CrossRef] [PubMed]
  4. Katz, J.S.; Burdick, J.A. Light-Responsive Biomaterials: Development and Applications. Macromol. Biosci. 2010, 10, 339–348. [Google Scholar] [CrossRef] [PubMed]
  5. Knipe, J.M.; Peppas, N.A. Multi-responsive hydrogels for drug delivery and tissue engineering applications. Regen. Biomater. 2014, 1, 57–65. [Google Scholar] [CrossRef] [PubMed] [Green Version]
  6. Municoy, S.; Álvarez Echazú, M.I.; Antezana, P.E.; Galdopórpora, J.M.; Olivetti, C.; Mebert, A.M.; Foglia, M.L.; Tuttolomondo, M.V.; Alvarez, G.S.; Hardy, J.G.; et al. Stimuli-Responsive Materials for Tissue Engineering and Drug Delivery. Int. J. Mol. Sci. 2020, 21, 4724. [Google Scholar] [CrossRef]
  7. Gao, Z.; Han, Y.; Wang, F. Cooperative supramolecular polymers with anthracene‒endoperoxide photo-switching for fluorescent anti-counterfeiting. Nat. Commun. 2018, 9, 3977. [Google Scholar] [CrossRef]
  8. Yang, T.; Zuo, Y.; Feng, S. Rational design of photo-chromic molecule for constructing polysiloxane-based fluorescent films and anti-counterfeiting. Mater. Des. 2021, 207, 109867. [Google Scholar] [CrossRef]
  9. Zeng, H.; Wani, O.M.; Wasylczyk, P.; Priimagi, A. Light--Driven, Caterpillar--Inspired Miniature Inching Robot. Macromol. Rapid Commun. 2018, 39, 1700224. [Google Scholar] [CrossRef]
  10. Zhou, P.; Chen, L.; Yao, L.; Weng, M.; Zhang, W. Humidity- and light-driven actuators based on carbon nanotube-coated paper and polymer composite. Nanoscale 2018, 10, 8422–8427. [Google Scholar] [CrossRef]
  11. Mesaritakis, C.; Akriotou, M.; Kapsalis, A.; Grivas, E.; Chaintoutis, C.; Nikas, T.; Syvridis, D. Physical Unclonable Function based on a Multi-Mode Optical Waveguide. Sci. Rep. 2018, 8, 9653. [Google Scholar] [CrossRef]
  12. Chaintoutis, C.; Akriotou, M.; Mesaritakis, C.; Komnios, I.; Karamitros, D.; Fragkos, A.; Syvridis, D. Optical PUFs as physical root of trust for blockchain--driven applications. IET Softw. 2019, 13, 182–186. [Google Scholar] [CrossRef]
  13. Perera-Costa, D.; Bruque, J.M.; González-Martín, M.L.; Gómez-García, A.C.; Vadillo-Rodríguez, V. Studying the Influence of Surface Topography on Bacterial Adhesion using Spatially Organized Microtopographic Surface Patterns. Langmuir 2014, 30, 4633–4641. [Google Scholar] [CrossRef] [PubMed]
  14. Oscurato, S.L.; Salvatore, M.; Maddalena, P.; Ambrosio, A. From nanoscopic to macroscopic photo-driven motion in azobenzene-containing materials. Nanophotonics 2018, 7, 1387–1422. [Google Scholar] [CrossRef]
  15. Zhao, Y.; Ikeda, T. (Eds.) Smart Light-Responsive Materials; John Wiley & Sons, Inc.: Hoboken, NJ, USA, 2009; ISBN 9780470439098. [Google Scholar]
  16. Pagliusi, P.; Audia, B.; Provenzano, C.; Piñol, M.; Oriol, L.; Cipparrone, G. Tunable Surface Patterning of Azopolymer by Vectorial Holography: The Role of Photoanisotropies in the Driving Force. ACS Appl. Mater. Interfaces 2019, 11, 34471–34477. [Google Scholar] [CrossRef]
  17. Yadavalli, N.S.; Korolkov, D.; Moulin, J.-F.; Krutyeva, M.; Santer, S. Probing Opto-Mechanical Stresses within Azobenzene-Containing Photosensitive Polymer Films by a Thin Metal Film Placed Above. ACS Appl. Mater. Interfaces 2014, 6, 11333–11340. [Google Scholar] [CrossRef] [PubMed]
  18. Bandara, H.M.D.; Burdette, S.C. Photoisomerization in different classes of azobenzene. Chem. Soc. Rev. 2012, 41, 1809–1825. [Google Scholar] [CrossRef] [PubMed]
  19. Audia, B.; Pagliusi, P.; Provenzano, C.; Roche, A.; Oriol, L.; Cipparrone, G. Influence of Photoanisotropies on Light-Controllable Structuration of Azopolymer Surface. ACS Appl. Polym. Mater. 2020, 2, 1597–1604. [Google Scholar] [CrossRef]
  20. Nedelchev, L.; Ivanov, D.; Berberova, N.; Strijkova, V.; Nazarova, D. Polarization holographic gratings with high diffraction efficiency recorded in azopolymer PAZO. Opt. Quantum Electron. 2018, 50, 212. [Google Scholar] [CrossRef]
  21. Park, K.J.; Park, J.H.; Huh, J.-H.; Kim, C.H.; Ho, D.H.; Choi, G.H.; Yoo, P.J.; Cho, S.M.; Cho, J.H.; Lee, S. Petal-Inspired Diffractive Grating on a Wavy Surface: Deterministic Fabrications and Applications to Colorizations and LED Devices. ACS Appl. Mater. Interfaces 2017, 9, 9935–9944. [Google Scholar] [CrossRef]
  22. Nair, S.; Escobedo, C.; Sabat, R.G. Crossed Surface Relief Gratings as Nanoplasmonic Biosensors. ACS Sens. 2017, 2, 379–385. [Google Scholar] [CrossRef]
  23. Fedele, C.; Mäntylä, E.; Belardi, B.; Hamkins-Indik, T.; Cavalli, S.; Netti, P.A.; Fletcher, D.A.; Nymark, S.; Priimagi, A.; Ihalainen, T.O. Azobenzene-based sinusoidal surface topography drives focal adhesion confinement and guides collective migration of epithelial cells. Sci. Rep. 2020, 10, 15329. [Google Scholar] [CrossRef]
  24. Schedl, A.E.; Probst, P.T.; Meichner, C.; Neuber, C.; Kador, L.; Fery, A.; Schmidt, H.-W. Confinement templates for hierarchical nanoparticle alignment prepared by azobenzene-based surface relief gratings. Soft Matter 2019, 15, 3872–3878. [Google Scholar] [CrossRef] [PubMed]
  25. Probst, C.; Meichner, C.; Kreger, K.; Kador, L.; Neuber, C.; Schmidt, H.-W. Athermal Azobenzene-Based Nanoimprint Lithography. Adv. Mater. 2016, 28, 2624–2628. [Google Scholar] [CrossRef]
  26. Bian, S.; Williams, J.M.; Kim, D.Y.; Li, L.; Balasubramanian, S.; Kumar, J.; Tripathy, S. Photoinduced surface deformations on azobenzene polymer films. J. Appl. Phys. 1999, 86, 4498–4508. [Google Scholar] [CrossRef]
  27. Tofini, A.; Levesque, L.; Lebel, O.; Sabat, R.G. Erasure of surface relief gratings in azobenzene molecular glasses by localized heating using a CO2 laser. J. Mater. Chem. C 2018, 6, 1083–1091. [Google Scholar] [CrossRef]
  28. Ubukata, T.; Isoshima, T.; Hara, M. Wavelength-Programmable Organic Distributed-Feedback Laser Based on a Photoassisted Polymer-Migration System. Adv. Mater. 2005, 17, 1630–1633. [Google Scholar] [CrossRef]
  29. Krüger, J.; Bolle, N.; Calvelo, T.; Bergmann, S.; Abourahma, H.; McGee, D.J. Optical reconfiguration of surface relief gratings on supramolecular polymer films using grating translation and superposition. J. Appl. Phys. 2019, 125, 243108. [Google Scholar] [CrossRef]
  30. Yadavalli, N.S.; Saphiannikova, M.; Santer, S. Photosensitive response of azobenzene containing films towards pure intensity or polarization interference patterns. Appl. Phys. Lett. 2014, 105, 051601. [Google Scholar] [CrossRef]
  31. Leibold, J.; Sabat, R.G. Fabrication of micrometer-scale surface relief gratings in azobenzene molecular glass films using a modified Lloyd’s mirror interferometer. Opt. Mater. 2019, 96, 109315. [Google Scholar] [CrossRef]
  32. Ogiwara, A.; Hirokari, T. Formation of anisotropic diffraction gratings in a polymer-dispersed liquid crystal by polarization modulation using a spatial light modulator. Appl. Opt. 2008, 47, 3015. [Google Scholar] [CrossRef] [PubMed]
  33. Ruiz, U.; Pagliusi, P.; Provenzano, C.; Lepera, E.; Cipparrone, G. Liquid crystal microlens arrays recorded by polarization holography. Appl. Opt. 2015, 54, 3303. [Google Scholar] [CrossRef] [PubMed]
  34. Do, D.B.; Lin, J.H.; Lai, N.D.; Kan, H.-C.; Hsu, C.C. Fabrication of three-dimensional polymer quadratic nonlinear grating structures by layer-by-layer direct laser writing technique. Appl. Opt. 2011, 50, 4664. [Google Scholar] [CrossRef] [PubMed]
  35. Jiang, S.-A.; Wang, C.-H.; Zhang, Y.-S.; Mo, T.-S.; Huang, S.-Y.; Hsieh, X.-L.; Wong, Y.-J.; Lin, J.-D.; Lee, C.-R. Control of Large-Area Orderliness of a 2D Supramolecular Chiral Microstructure by a 1D Interference Field. ACS Appl. Mater. Interfaces 2021, 13, 44916–44924. [Google Scholar] [CrossRef]
  36. Oscurato, S.L.; Salvatore, M.; Borbone, F.; Maddalena, P.; Ambrosio, A. Computer-generated holograms for complex surface reliefs on azopolymer films. Sci. Rep. 2019, 9, 6775. [Google Scholar] [CrossRef] [Green Version]
  37. Ruffato, G.; Rossi, R.; Massari, M.; Mafakheri, E.; Capaldo, P.; Romanato, F. Design, fabrication and characterization of Computer Generated Holograms for anti-counterfeiting applications using OAM beams as light decoders. Sci. Rep. 2017, 7, 18011. [Google Scholar] [CrossRef] [Green Version]
  38. Jean-Michel, D. Three coloured differential interferometry. Appl. Opt. 1997, 13. [Google Scholar] [CrossRef]
  39. Desse, J.-M.; Albe, F.; Tribillon, J.-L. Real-time color holographic interferometry. Appl. Opt. 2002, 41, 5326. [Google Scholar] [CrossRef]
  40. Van der Veen, R.C.A.; Tran, T.; Lohse, D.; Sun, C. Direct measurements of air layer profiles under impacting droplets using high-speed color interferometry. Phys. Rev. E 2012, 85, 026315. [Google Scholar] [CrossRef] [PubMed] [Green Version]
  41. Born, M.; Wolf, E.; Bhatia, A.B.; Clemmow, P.C.; Gabor, D.; Stokes, A.R.; Taylor, A.M.; Wayman, P.A.; Wilcock, W.L. Principles of Optics; Cambridge University Press: Cambridge, MA, USA, 1999; ISBN 9780521642224. [Google Scholar]
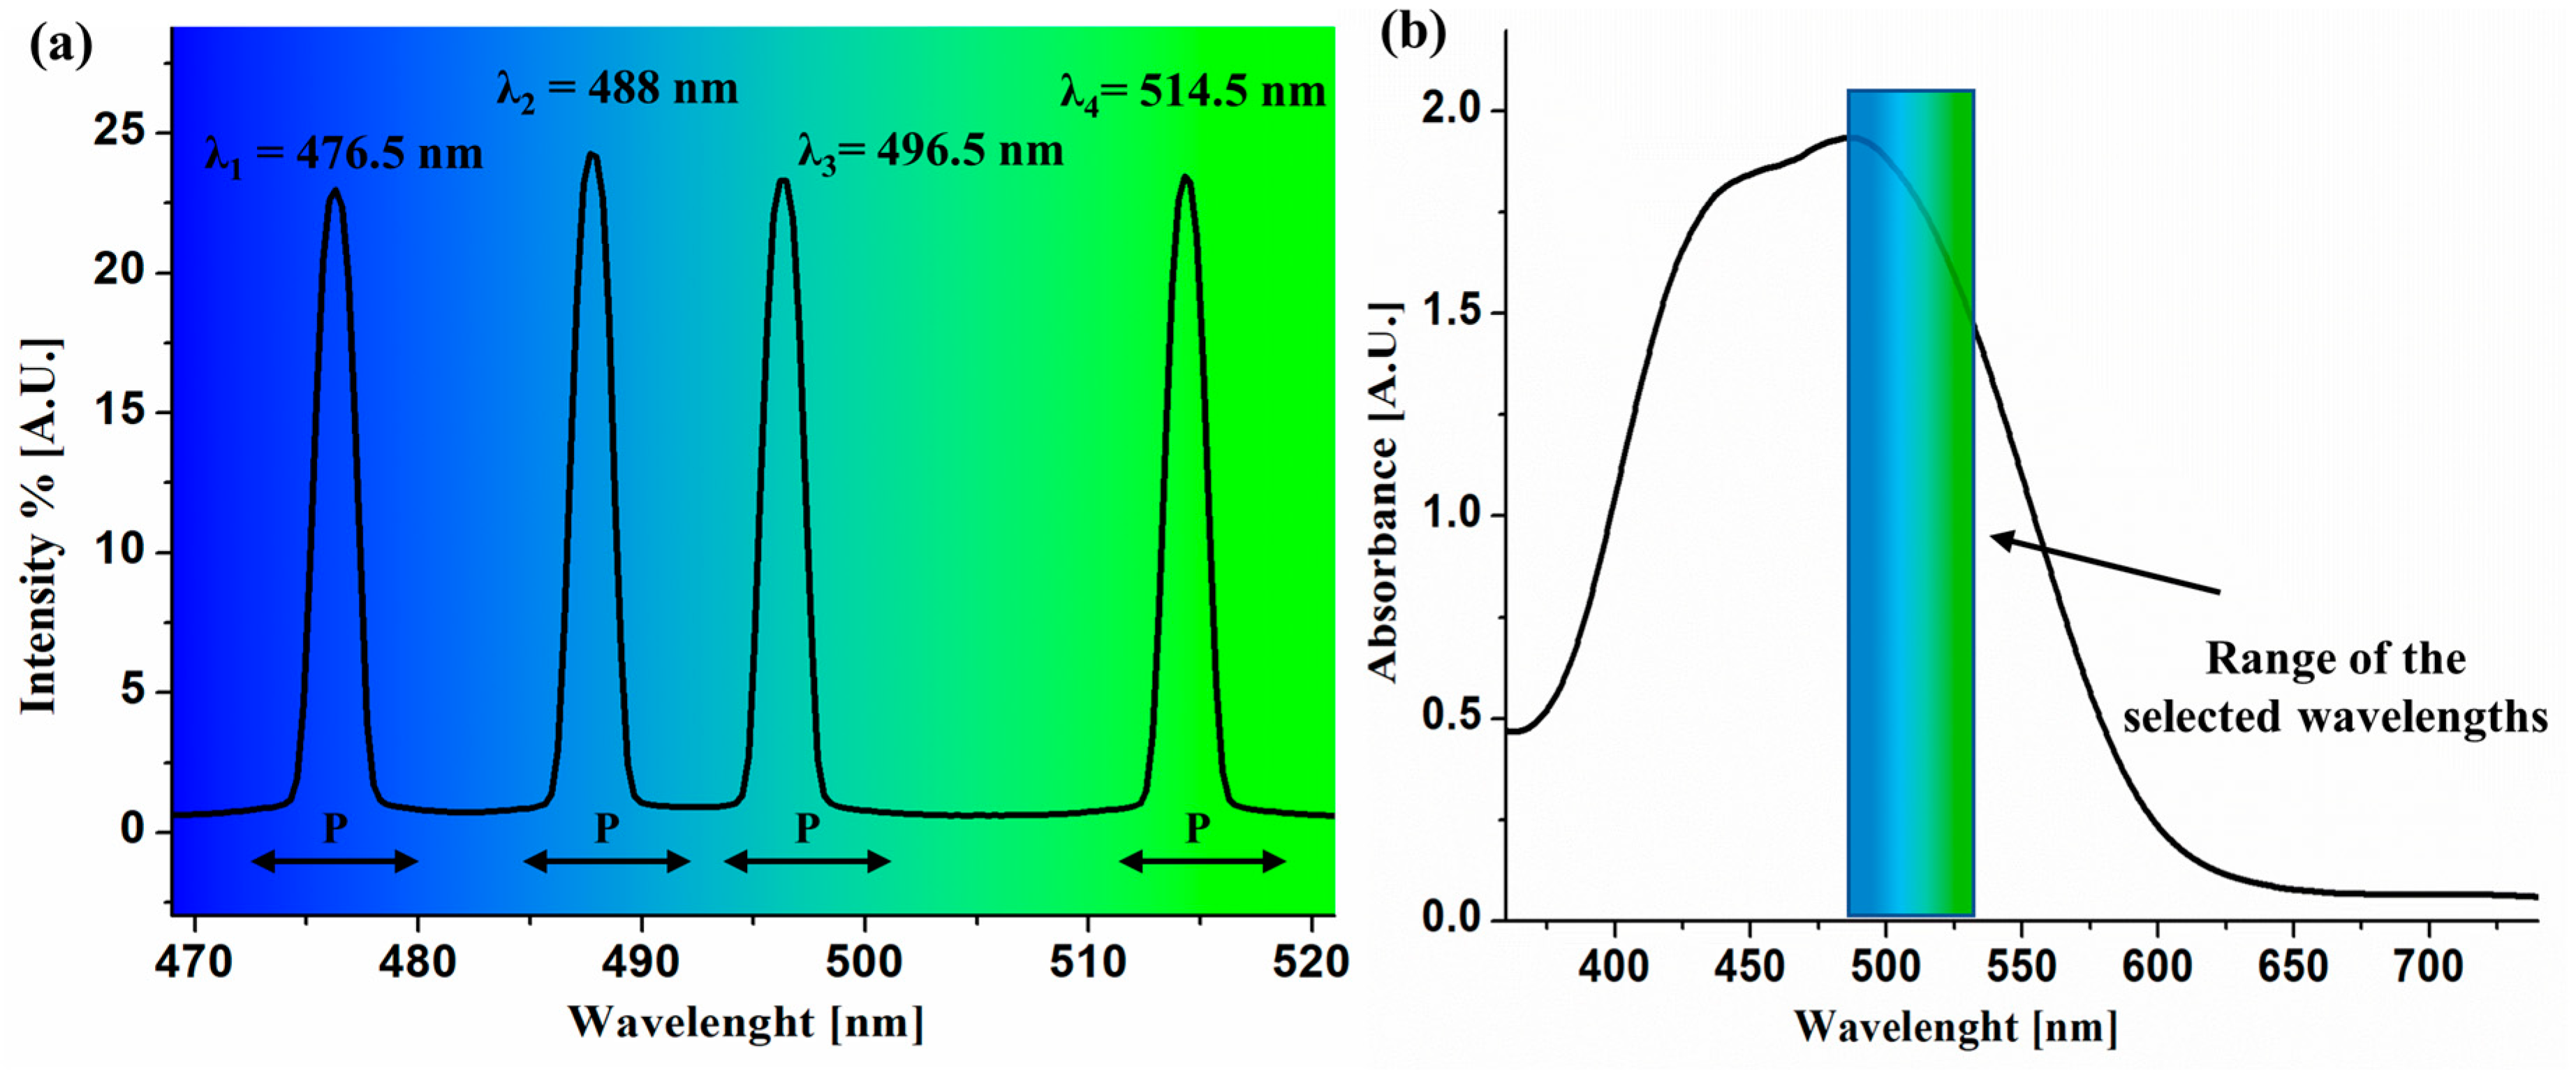
Figure 1. (a) Spectral composition (intensity and polarization state) of the multi-wavelength recording beams. (b) Absorption spectrum of the PDR1Ma thin film overlaid with the used wavelength range.
Photonics 08 00481 g001
Figure 2. Top view (xz plane) scheme of the experimental setup in the xyz laboratory frame.
Photonics 08 00481 g002
Figure 3. Interference fringes produced by the superposition of two, single line (a) or multiline (b), laser beams using a Michelson interferometer (the scale bar is 1 μm). Spatial distribution of the resulting intensities, evaluated through Equation (1), in the case of single line (c) and multiline (d) interference. The black dashed lines in (d) delimit the interference pattern reported in the inset; The red and blue lines represent the upper and lower envelope of the curve, respectively.
Photonics 08 00481 g003
Figure 4. (a) Optical microscopy image of the PDR1Ma thin film after the exposure to the multiline interference pattern. The scale bar is 15 μm. (b) Light intensity profile (IOM, gray value) along the black dotted line (200 μm) in (a). (c) 200μm-portion of the resulting intensity profile evaluated by Equation (1). The red and blue lines showed in (b,c) represent respectively the upper and lower envelope of the curves.
Photonics 08 00481 g004
Figure 5. (a) Surface profile of the PDR1Ma thin film after the exposure to the multiline interference pattern. The profile, acquired by profilometer, is superimposed with its envelope (red line) to better highlight the large-scale modulation. Experimental (b) and theoretical (c) Fast Fourier transform derived from the surface profile in (a) and the intensity profile in Figure 3d, respectively.
Photonics 08 00481 g005
Publisher’s Note: MDPI stays neutral with regard to jurisdictional claims in published maps and institutional affiliations.