Article

Research on X-ray Fluorescence Enhanced Fluoroscopy Imaging Technology

Department of Engineering Physics, Tsinghua University, Beijing 100084, China
*
Author to whom correspondence should be addressed.
Photonics 2021, 8(10), 441; https://doi.org/10.3390/photonics8100441
Submission received: 4 September 2021 / Revised: 30 September 2021 / Accepted: 9 October 2021 / Published: 14 October 2021
(This article belongs to the Special Issue X-ray Luminescence and Fluorescence)

Abstract

:
Chest X-ray fluoroscopy is a commonly used medical imaging method, which has a wide range of applications in the diagnosis of lung diseases and other fields. However, due to low contrast and relatively close linear attenuation coefficients, some early small lesions are difficult to detect in time. Using the X-ray fluorescent effect of high atomic number metal elements and metal atom-containing agents that can be enriched in the lesion, the fluoroscopy signal and the fluorescent signal emitted by the metal atoms can be detected at the same time during the fluoroscopy, and the images of the two can be integrated, which can theoretically enhance the contrast between the lesion and the surrounding tissue. Based on GEANT4, this paper conducts Monte Carlo simulations to explore the feasibility and enhancement effects of three enhancement schemes: the pencil beam spot scanning method, cone-beam collimation method, and slit scanning method, and discusses the specific geometric structure and material selection.

1. Introduction

1.1. Principles and Limitations of Fluoroscopy Imaging

X-ray fluoroscopy imaging technology is a commonly used and important medical imaging diagnostic method in daily life. X-rays emitted by the X-ray tube pass through the human body in a cone beam and hit the detector behind the person. Considering the dominance of the photoelectric effect at low energies (i.e., diagnostic imaging, including fluoroscopy) and the dependence of its cross section with Z3.6~4.6 [1], tissues with different element compositions and densities have different blocking abilities (i.e., the linear attenuation coefficient) to X-rays. Using the difference in X-ray penetration abilities, a two-dimensional image of the human body is obtained. The value of each pixel on the obtained two-dimensional image represents the sum of the linear attenuation coefficients of all points on the X-ray path from the source to that point.
Therefore, the resolution of X-ray fluoroscopy imaging is not high. When showing the difference between soft tissues with similar density, the effect of X-ray imaging is limited [2]. For early carcinogenesis, when there is no structural change in organs, it is difficult to obtain information that is helpful for diagnosis in traditional X-ray images. Nuclear medicine imaging was developed to address the issue, such as single photon emission computed tomography (SPECT) and positron emission computed tomography (PET).
Different from structural imaging, these nuclear imaging techniques are functional imaging techniques and show the highest detection sensitivities of all imaging modalities. By ingesting radiopharmaceuticals that can decay and emit photons of specific energy, SPECT and PET offer information beyond anatomical information. However, because the radiopharmaceuticals used in these technologies continue to decay and produce radiation, it will cause the patient itself and the surrounding environment to accumulate a dose. X-ray fluorescence computed tomography (XFCT), another imaging method, can effectively obtain the distribution of high-Z elements (such as Au and Gd) inside the imaged object and can be effective with related tracer agents in diagnosing the location of the lesion, attracting the attention of many researchers in the world [3].

1.2. Introduction to X-ray Fluorescence and Its Imaging

The fluorescence phenomenon is a general term for the atomic fluorescence phenomenon and the molecular fluorescence phenomenon. This article only focuses on the atomic fluorescence phenomenon and application of atoms of high-Z elements (such as gold, gadolinium, bismuth, etc.).
Fluorescence is produced during the de-excitation of atoms and is essentially a characteristic X-ray. When the incident X-ray hits the atom, the inner electron is excited and emitted as a photoelectron, leaving a hole in the original electron layer. In the process of atomic de-excitation, the electrons in the outer layer fall into the holes in the inner layer, and the excess energy is emitted in the form of X-ray photons, which are fluorescence photons [3].
Since the energy difference between the inner and outer electrons of the atom is fixed, the fluorescence phenomenon will produce a large number of single-energy X-ray photons. Photons of this energy cannot come from other materials, so there will be a high contrast for the high-Z atoms that can produce the fluorescence photons in the background material. Therefore, many investigators have begun to try to use X-ray fluorescence effect for imaging, which is the so-called XFCT.

1.3. Literature Research on Enhanced Imaging

A number of investigators use specific injectable substances called contrast agents to improve the image contrast.
The most common contrast agent is iodine, which uses the high blocking ability of iodine to X-rays to enhance the imaging effect. Generally, the contrast agent is injected intravenously, and the patient is scanned immediately after the injection. The vessel enhancement effect is obvious, but it disappears quickly.
Recent studies have discovered many inorganic nanoparticle CT contrast agents with distinct advantages. Nanoparticles not only have the ability to enhance imaging, but they can also prolong blood circulation time in the body so as to overcome the shortcomings of traditional iodine contrast agents. In addition, nanoparticles can easily interact with various functional biomolecules to achieve tissue targeting or multimodality for better enhancement [4].
Today, metal-based nanomaterials are widely used in the research of CT contrast agents, based on their unique physical, chemical, and biological properties. Gold and Bi2S3 nanoparticles are the most-studied X-ray contrast agents [5]. Gold nanoparticles have high electron density, which can obtain strong X-ray absorption capacity and good biocompatibility, making them a good CT contrast agent. Popovtzer et al. used the seed template method to prepare 45 nm long gold nanorods, and then modified them with polymers and antibodies to obtain CT contrast materials with targeting functions [6]. This material is further used for the imaging of oral cancer cells and laryngeal cancer cells.

1.4. The Idea of Using Fluorescence to Enhance Fluoroscopy Imaging

The existing X-ray fluoroscopy technology is faced with insufficient contrast and sharpness, leading to the problem of missed diagnosis, and the X-ray fluorescence can provide imaging results with high contrast. X-ray fluoroscopy technology requires X-rays to penetrate the human body for imaging, and the X-ray fluorescence requires high-Z element atoms and X-rays whose energy are above the threshold. Therefore, can fluorescence effect and fluoroscopy be combined to improve the contrast of imaging? As is stated in Section 1.1, the photoelectric effect dominates in low energies and depends on Z with Z3.6~4.6, so it is reasonable to utilize the fluorescent effect of the high Z element to improve fluoroscopy imaging.
Inspired by the principle of XFCT and X-ray fluorescence effect, our group proposed a new kind of fluoroscopy imaging enhanced by the X-ray fluorescent effect. Two detectors with a specific energy window are placed on both sides of the human body. Agents with gold or gadolinium or bismuth atoms, which can be enriched in lung tumors, are injected or orally taken by the patient before the fluoroscopy imaging. As the X-ray passes through the human body, the metal atoms are excited and emit photons of specific energy, which are collected by the detectors on sides. Using this signal, we can reconstruct the regions where metal atoms are enriched in the human body. By doing so, we hope to enhance partial imaging, allowing some previously neglected lesions to be discovered, thereby increasing the diagnostic rate of fluoroscopy imaging for specific diseases.
Our technique is an improvement on existing fluoroscopy imaging to increase the detection rate of early lesions (usually less than 2 cm in size) by fluoroscopy. Compared with XFCT, our technology is for two-dimensional imaging, to improve the ability to diagnose early lesions, using only two photonic detector crystals, which takes less time, costs less, and brings a lower dose, despite sharing the same imaging principles.

1.5. Technical Feasibility Analysis

According to the scientific literature, no articles have been reported so far on the combined X-ray fluoroscopy and fluorescence used for medical imaging. However, the current XFCT technology is relatively mature and continues to make progress in the frontier field, which has given us an inspiration and reference. At present, polychromatic benchtop XFCT has been used for gold nanoparticles (GNPs) detection in a tumor-bearing mouse and shows drastically enhanced sensitivity and quantification, up to two orders of magnitude better than conventional X-ray CT [7]. X-ray fluorescence imaging of GNPs on mice has been able to achieve sub-mm spatial resolution [8], and the minimum detectable nanoparticle mass has reached 5 pg in simulations [9]. These developments are all based on GNPs [10], which also verifies our conjecture of using high-Z elements to enhance fluoroscopy imaging.
The structure of X-ray fluorescence photon imaging using chest X-ray excitation is similar to cone beam XFCT imaging, so we can learn from the XFCT de-scattering algorithm [9,11]. Investigators have also tried full-field fan-beam X-ray fluorescence computed tomography with a conventional X-ray tube and photon-counting detectors for fast nanoparticle bioimaging [12]. As for the combination of fluorescence imaging and traditional CT imaging, related research has also been performed [13].
There are many high-Z elements that can be used in tracer agents, such as gold and gadolinium nanoparticles. Sokolov et al. used gold nanoparticles to attach to tracking cell marker molecules for optical imaging [14]; Cho and Jones et al. used Monte Carlo simulations to prove that gold nanoparticles can enhance the radiation dose of a specific site exposed to radiation [15,16]; it can be seen that gold nanoparticles have a very large application space in the quantitative imaging of specific elements and radiotherapy, which can effectively improve the efficiency of cancer diagnosis and radiotherapy.
Moreover, in the fields related to lung fluoroscopy and lung cancer treatment, gadolinium-containing and gold-containing agents are quite common. Feifei Li, Zihou Li, and others used gadolinium oxide (GON) nanoparticles in their studies on the radiation sensitization effect of gadolinium oxide nanoparticles on A549 lung cancer cells, which have a certain enrichment effect on lung cancer cells. The content of gadolinium in the aqueous solution used as the culture medium is 10 μg/mL, and the intake of cancer cells can reach 0.73 pg/cell, which means the concentration in the cell reaches 728.5 μg/mL [17].
It seems that the idea of using fluorescence to enhance fluoroscopy imaging technology has a solid theoretical and practical background. However, in fact, it is complicated and difficult to perform experiments to verify this design, and repeated fluoroscopy to debug the system will also cause harm to the human body. Therefore, this article aims to design a Monte Carlo simulation system based on GEANT4 to verify the feasibility and practicability of X-ray fluorescence-enhanced fluoroscopy imaging technology, optimize the parameters and construction of the model, and strive to obtain the system with the best effect, lowest cost, and simplest structure. The GEANT4 software was developed by RD44, a world-wide collaboration of national institutes, laboratories, and large High-Energy Physics experiments. GEANT4 is a public software package composed of tools that can be used to accurately simulate the passage of particles through matter [18].

2. Methods

We propose three different methods to enhance the contrast of small lesions containing high-Z elements in fluoroscopy imaging.

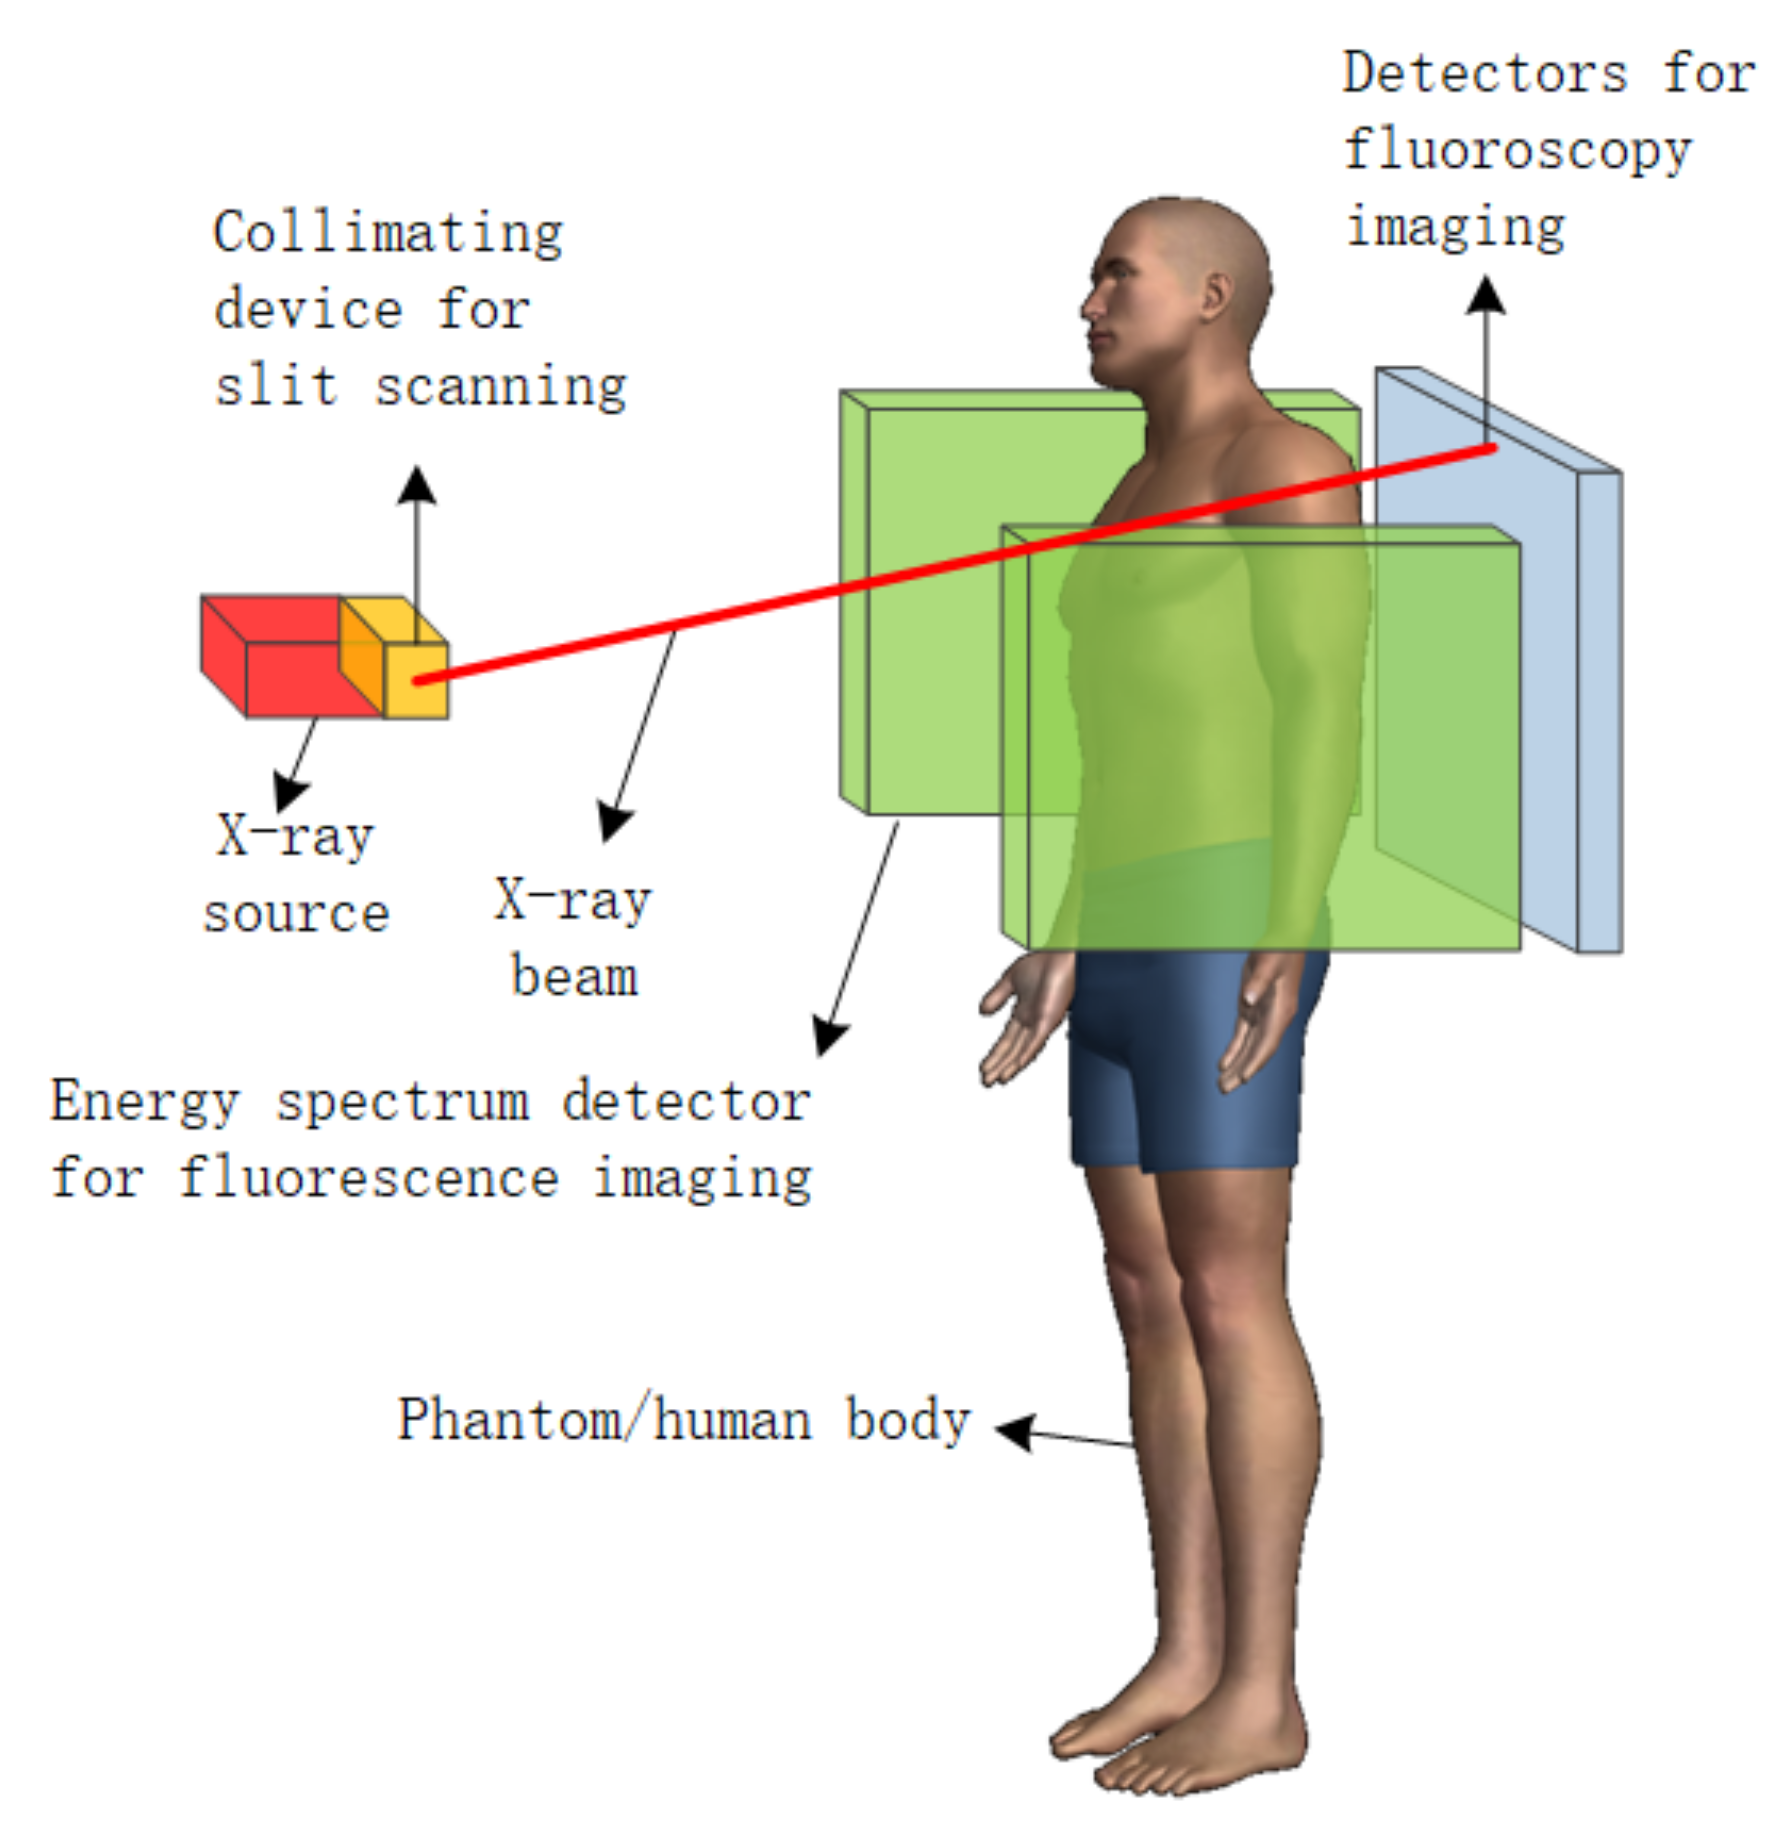
2.1. Pencil Beam Spot Scanning Method

This method is to collimate the X-ray source with a square-hole collimator, scan the human body point by point, and collect the signal received by the detector behind the human body and the detectors on both sides. Since the X-ray scans the human body uniformly, the sum of the detector signals behind the human body is a traditional fluoroscopy image. The detectors on sides collect different signal intensities at different moments when X-rays sweep across different positions of the human body. Photons collected by detectors on sides at any given moment are made up of scattered photons and possible fluorescence photons at the location scanned by the pencil beam at that moment. Therefore, the two-dimensional spatial distribution of metal atoms in the human body can be obtained, which can determine the location of the potential tumor combined with the fluoroscopy image. The schematic diagram of the device for pencil beam spot scanning method is shown in Figure 1.

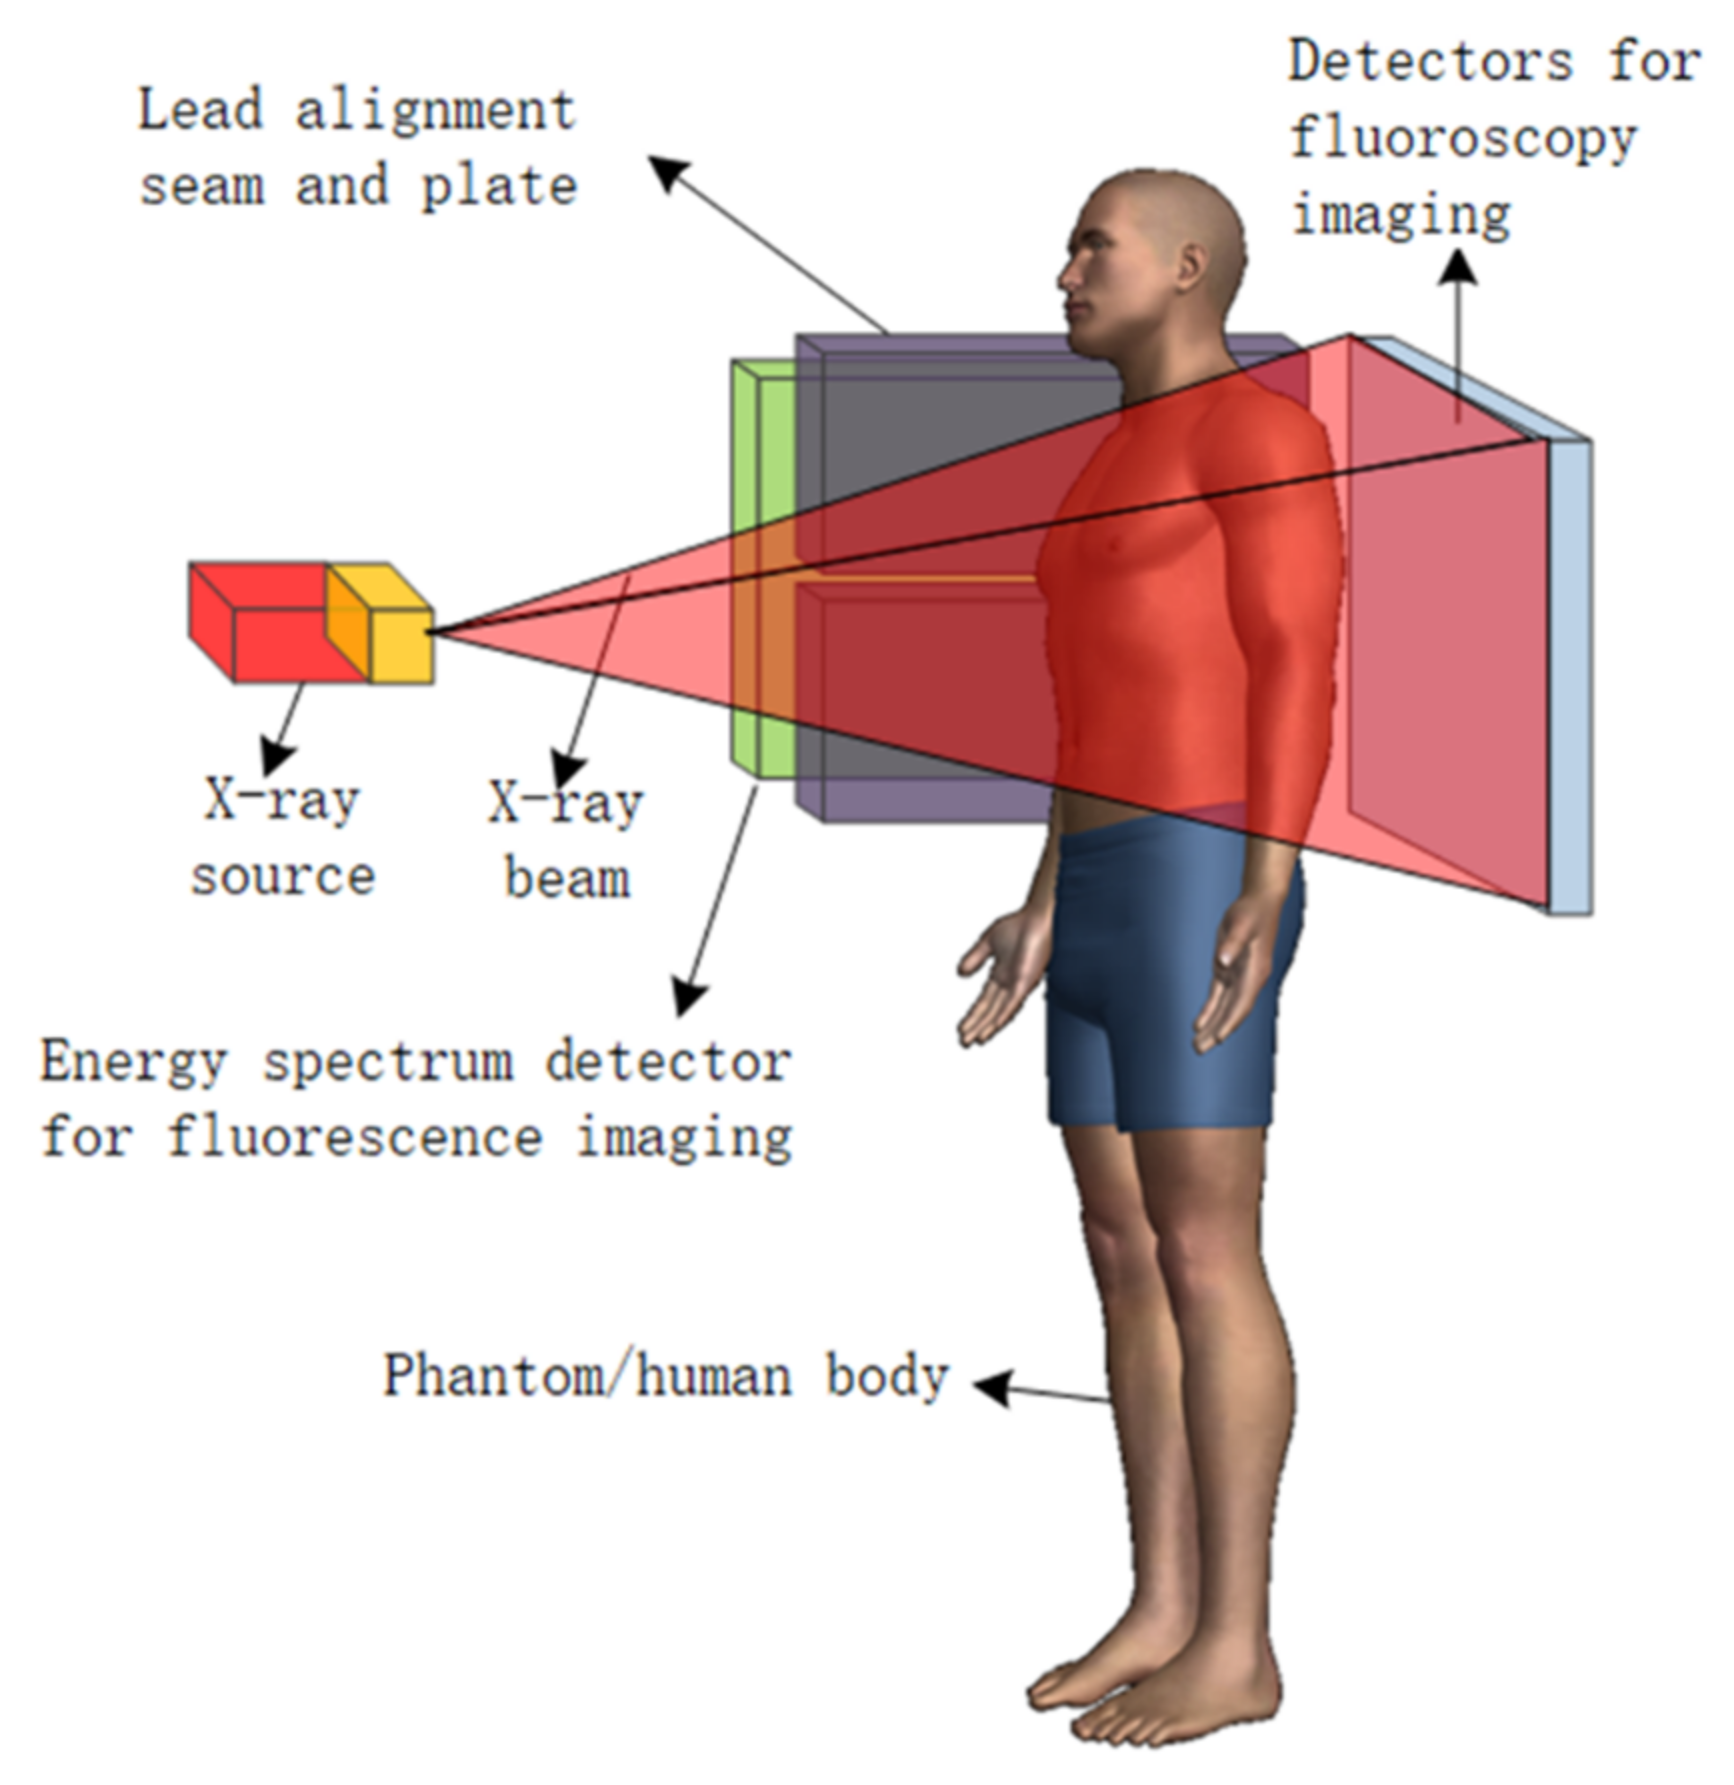
2.2. Cone-Beam Collimation Method

This method enables X-rays to pass through the human body directly in a cone beam, and the method of fluoroscopy imaging is the same as that of ordinary fluoroscopy. Some slit collimators are placed between the detectors on sides and the human body. The width of the slits is determined by the size of the detector arrays on the sides and the distance between the detector array and the collimator so that the whole lungs can be detected. The position of the fluorescent signal source is calculated and judged according to the spatial distribution of the signals received by the detector arrays on both sides of the human body. The schematic diagram of cone-beam collimation method is shown in Figure 2.

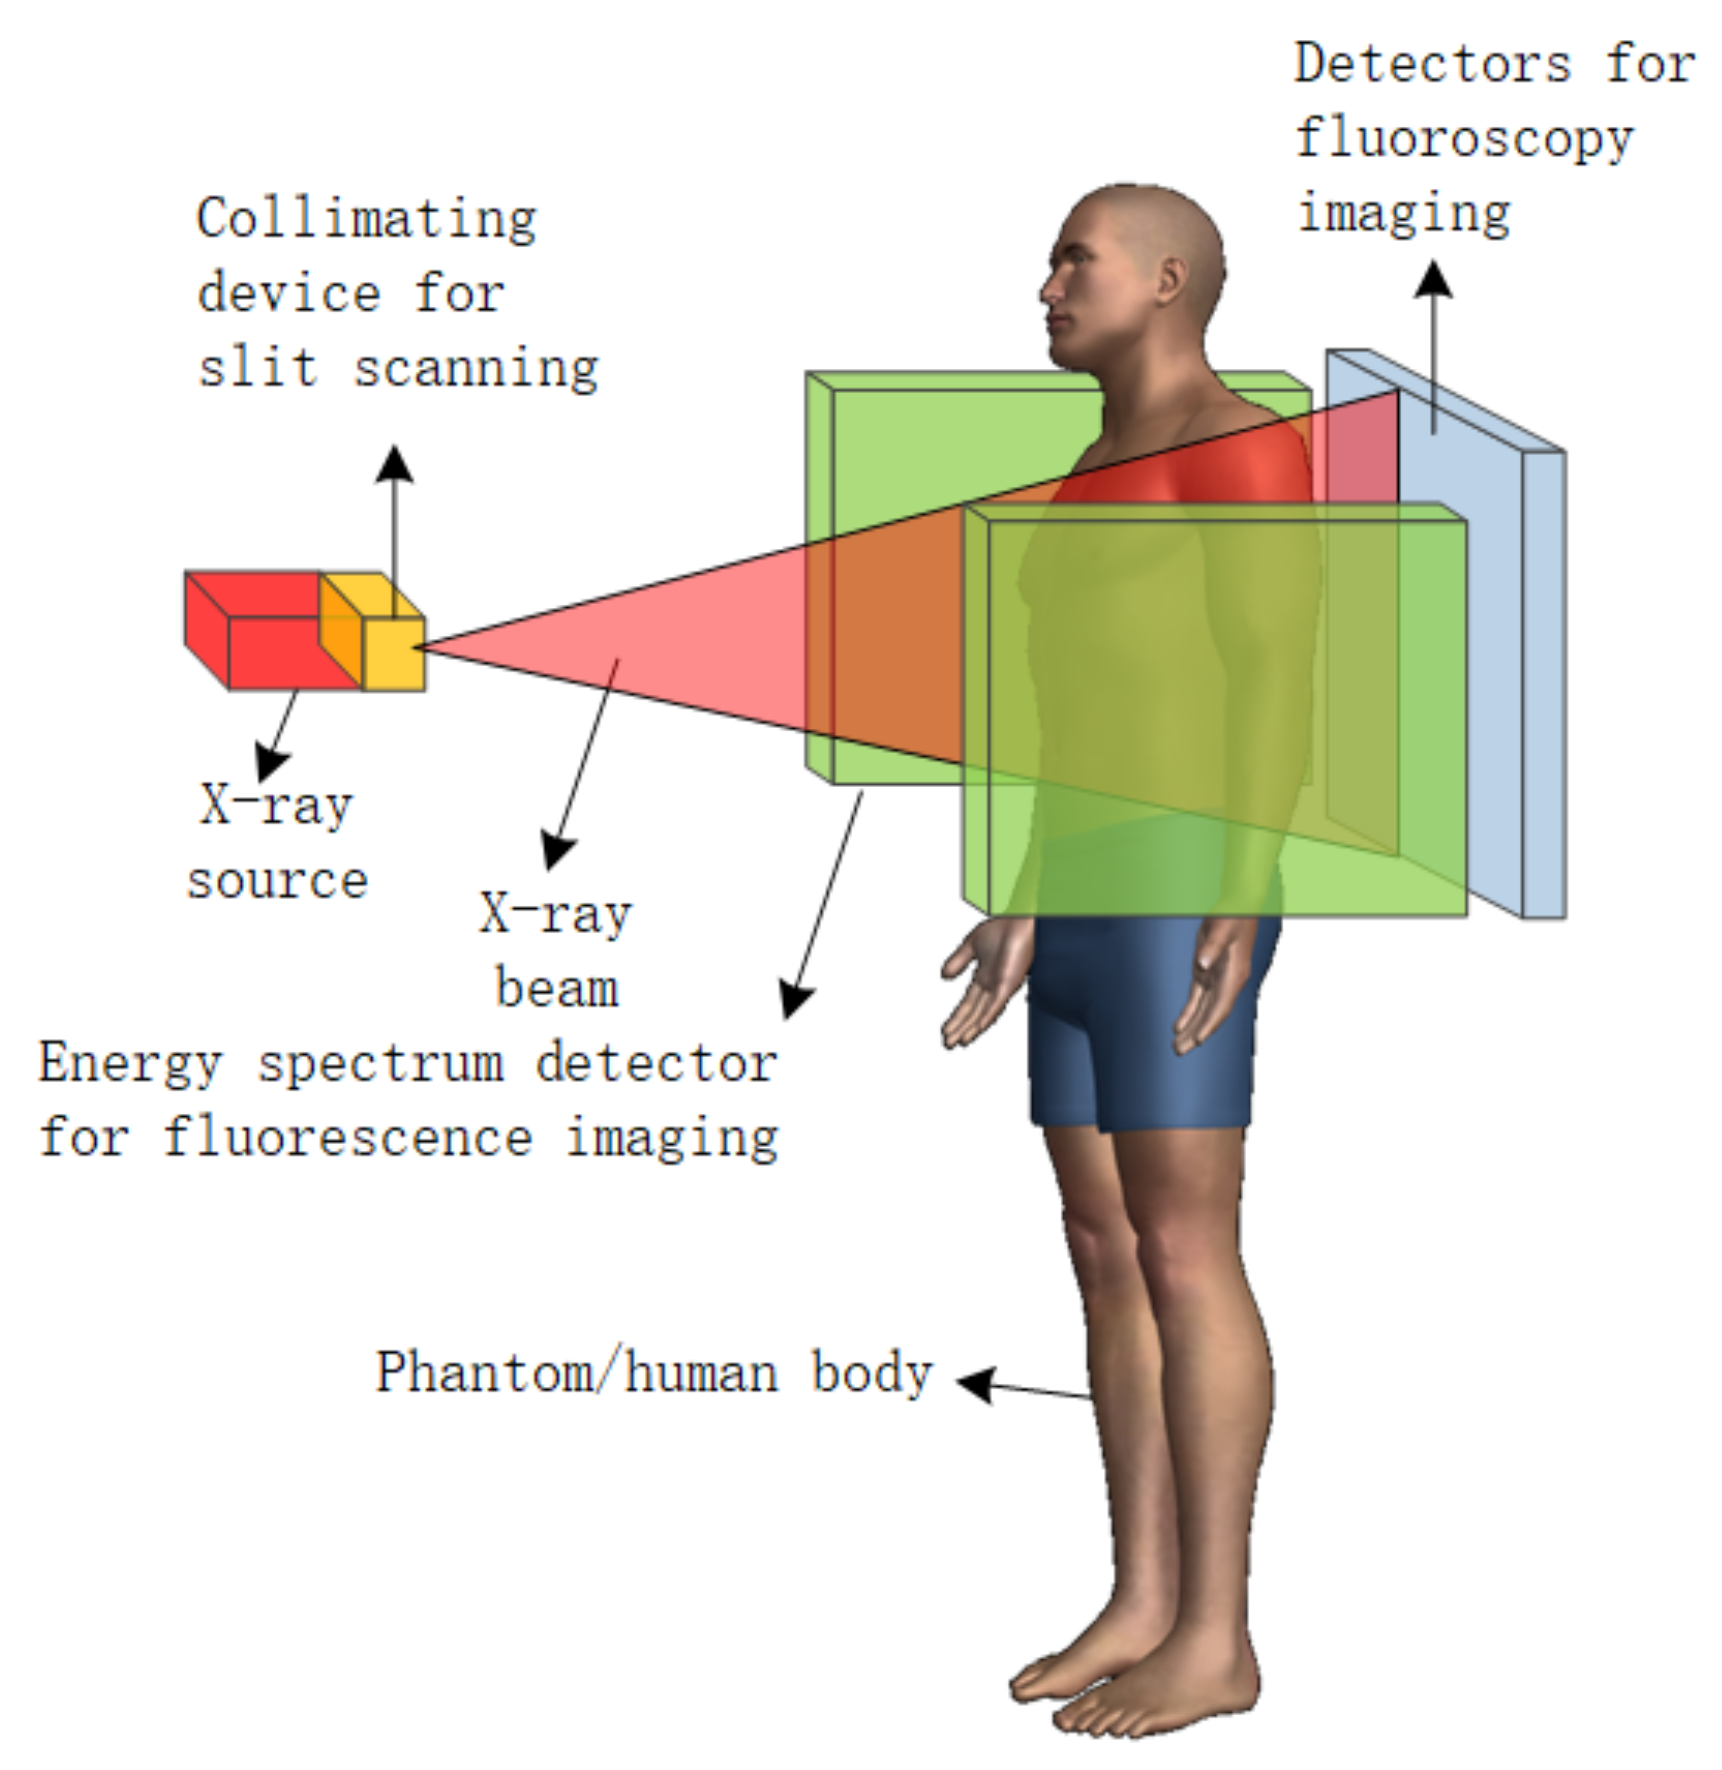
2.3. Slit Scanning Method

This method combines the above two methods. We use a slit collimator to collimate the X-ray source so that the ray sweeps across the human body twice in a plane, horizontally and vertically, and the detectors on sides thus obtain two sequences. We can use these two sets of signals to search the metal atoms enriched position in the human body.
It is worth noting that in this method, different signal strengths obtained by the two detectors on sides can be used to participate in data processing, rather than simply adding them together. The schematic diagram of slit scanning method is shown in Figure 3.

3. Settings and Parameters

In this part, we select the basic simulation environment parameters according to realistic fluoroscopy and simulation effects.

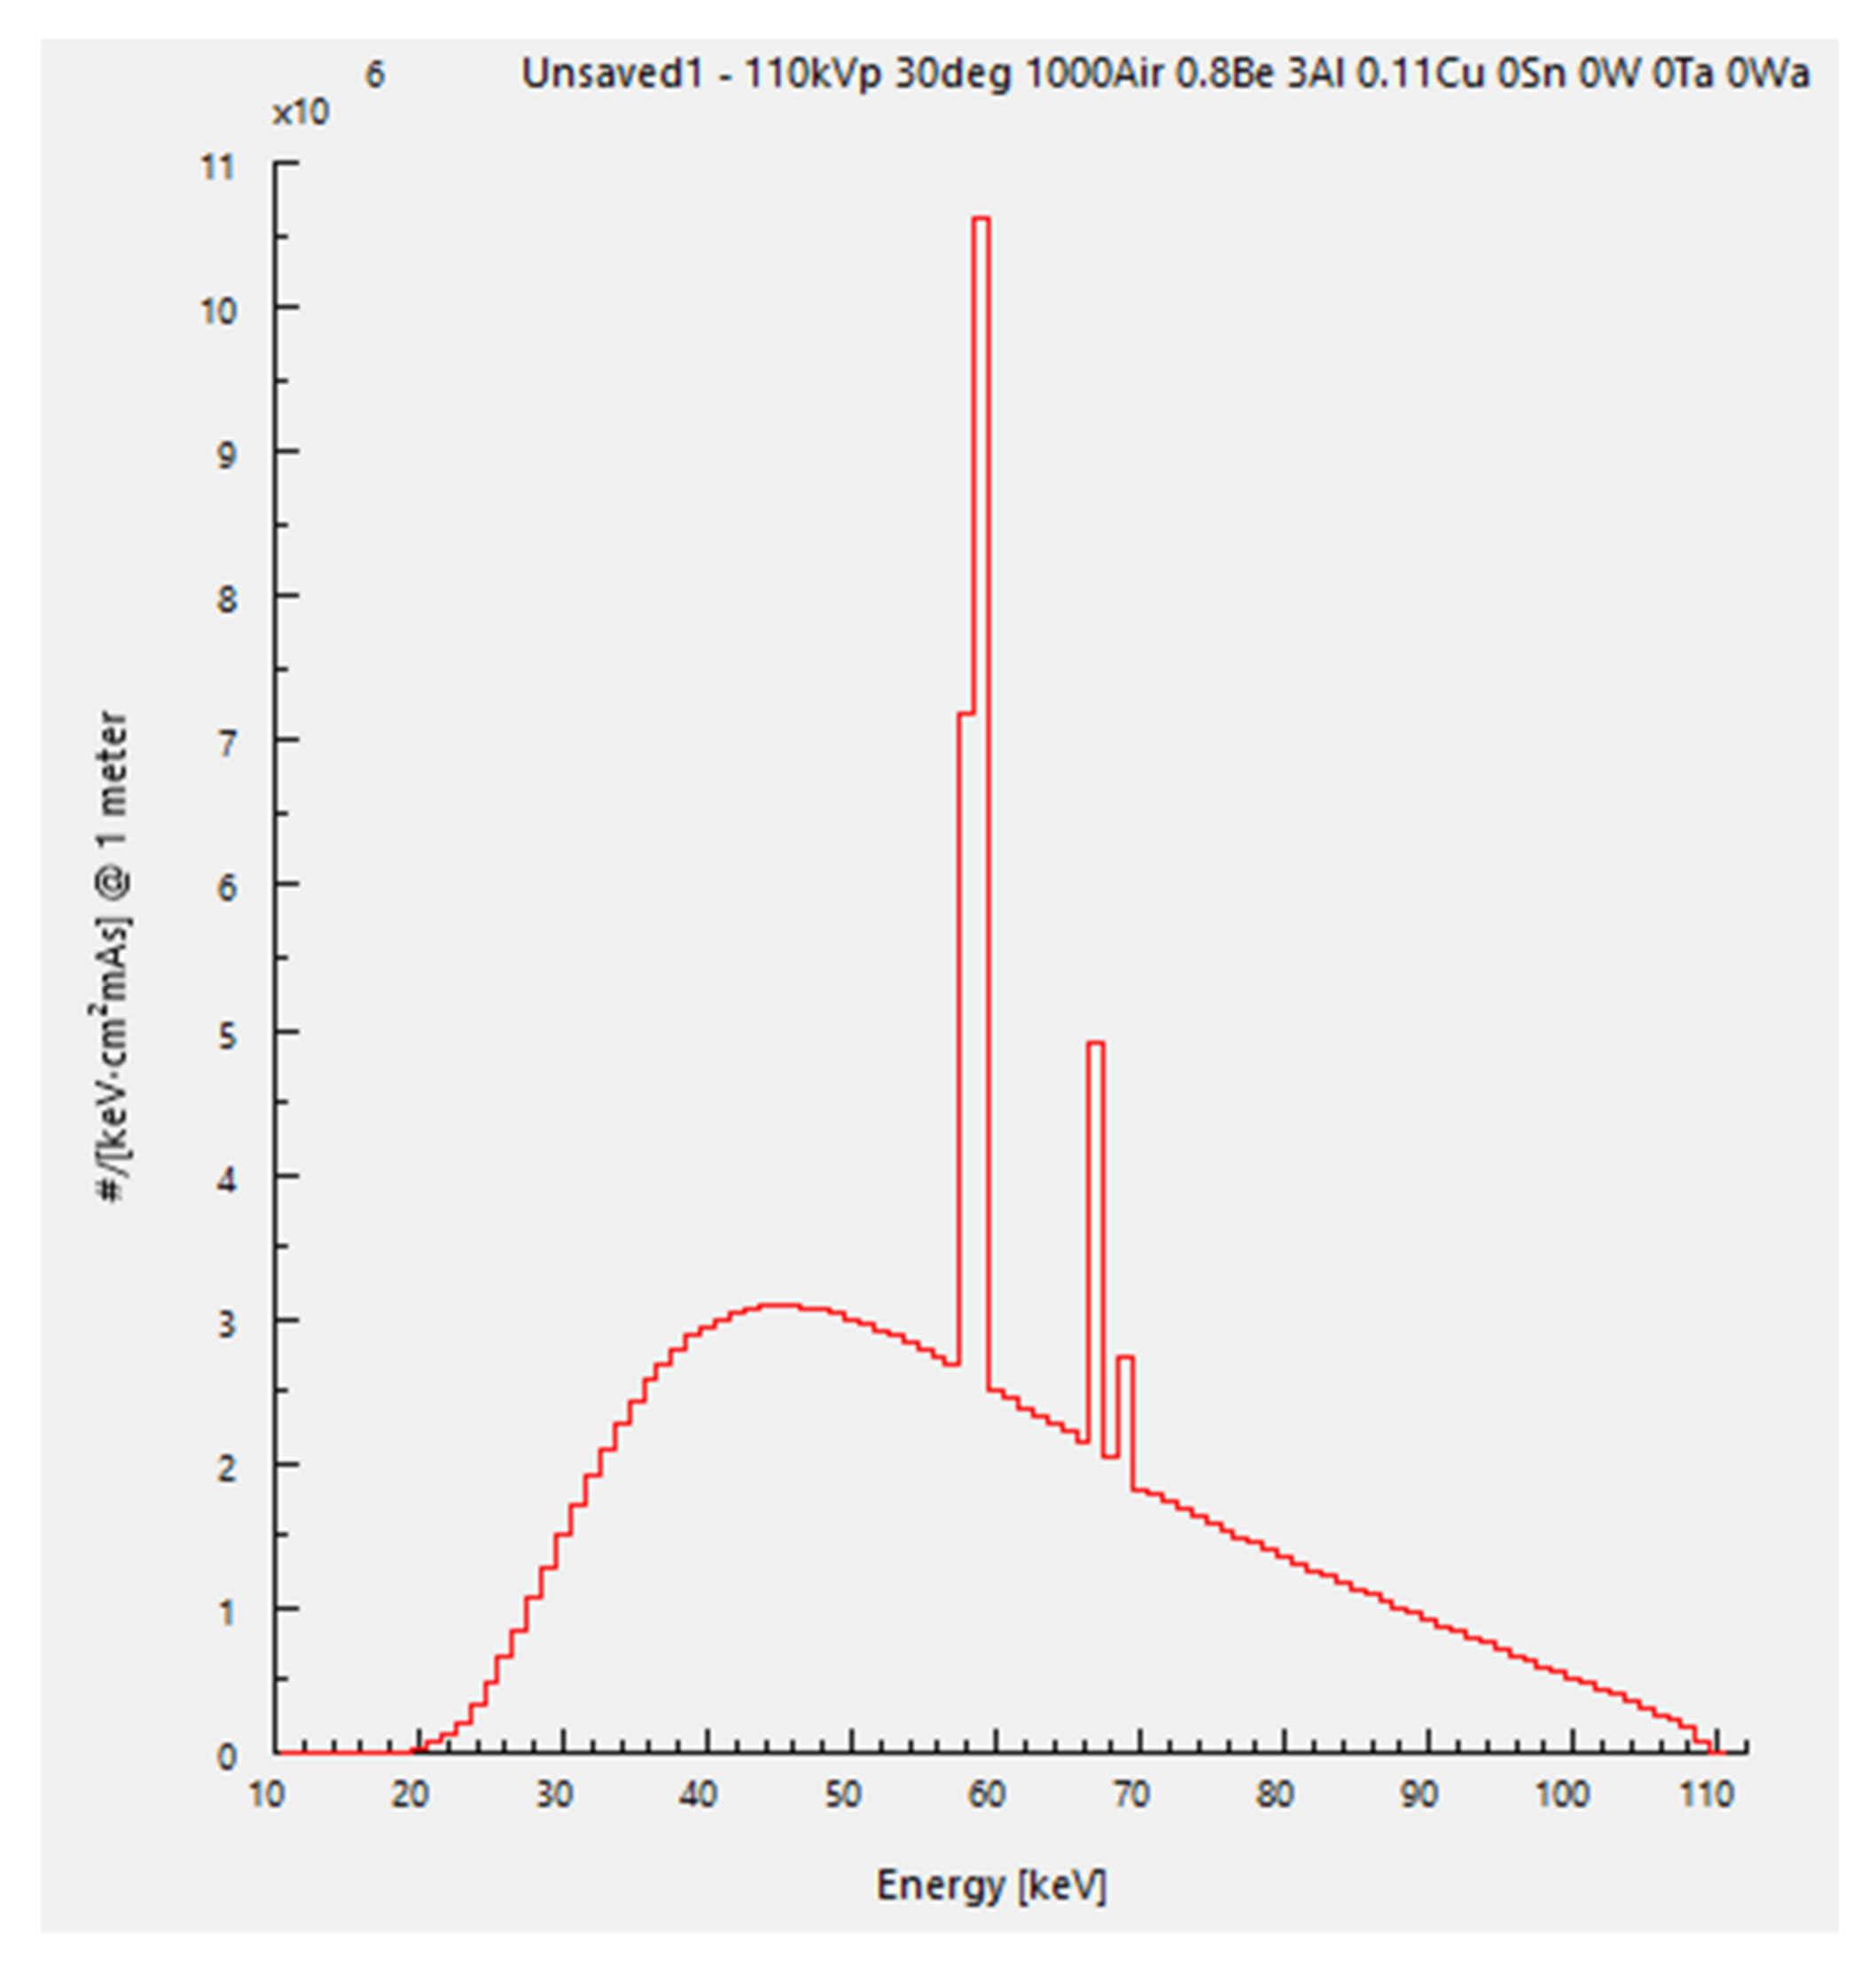
3.1. X-ray Source Tube Voltage and Energy Spectrum

Because our enhancement is based on the improvement of the existing fluoroscopy technology, the voltage of our X-ray tube is 110 kV, the same as that of the common fluoroscopy X-ray source tube.
The energy spectrum of the X-ray source for simulation is generated by SpekCalc [19]. The parameters producing the energy spectrum are shown in Table 1.
Peak energy is the max energy among the photons, decided by the tube voltage. The energy bin of the spectrum is 1 keV, so the energy spectrum generated is discrete, and we need to make it distribute continuously. Theta is the takeoff angle of the photons from the anode. Air, Al, and Cu are the filters in front of the tube, which means after passing through these three layers of the above three materials, the spectrum of the photons emitted by the tube is detected. By running SpekCalc, we can obtain the spectrum shown in Figure 4.

3.2. Phantom and Simulaition Structure

3.2.1. Phantom

The phantom used in this simulation comes from the Radiation Protection Laboratory of the Department of Engineering Physics, Tsinghua University [20,21]. The prototype of the phantom is a 500 × 500 × 1200 three-dimensional matrix in MATLAB, and the number in each position of the matrix corresponds to the material that needs to be filled in that position. Each element of the matrix corresponds to a cube of 1.741 × 1.741 × 1.741 mm in reality. The correspondence between numbers and materials, as well as the density and atomic composition of the materials, can be found in a corresponding Excel table.
The focus of this article is on the inside of the chest cavity and will not involve other parts of the human body. For the sake of simplifying model design and saving calculations, the phantom used in this simulation only cuts out a 160 × 160 × 140 part. The range of the corresponding human body is from the lower edge of the neck to the upper edge of the liver. The left and right sides end at both ends of the collarbone, excluding the arms.
We transfer it into GEANT4 for later simulation and visualize two organs to verify the correctness of the construction as shown in Figure 5.
It is obvious that the model is detailed. After all, the size of the voxels is small enough to meet our needs for human body simulation.

3.2.2. Detectors

There are two types of detectors used in simulations: the fluoroscopy detector and the fluorescence detector. The former is placed closely behind the human body and is used to receive X-ray photons passing through the phantom from the source; the latter is placed on both sides of the human body to receive fluorescence photons emitted by high-Z elements in human body.
After selection, the XRD 4343RF detector from Varex Imaging is finally chosen as the fluoroscopy detector. The detector crystal material is the Cesium Iodide scintillator, the detector array is 2880 × 2880, and the size of a single crystal element is 150 × 150 μm. The wafer thickness of this type of detector is not found in the published documents and instructions, so the thickness is set as 0.5 mm. Considering that if 2880 × 2880 independent crystal logic volumes are used to form a detector, the difficulty of geometrical construction, program calculation, and result processing will increase sharply. Thus, the construction of the detector is reasonably simplified, and a whole piece of 432 × 432 × 0.5 mm cesium iodide crystal is used as the detector, the GEANT4 built-in function is used to directly read the event location in the detector, and the corresponding detector crystal is obtained by algorithm processing.
As to the fluorescence detectors, we will discuss them in Section 3.2.4.

3.2.3. Structure of Simulation Design

In real life, the X-ray source we use when doing chest radiographs is a point source, and the X-rays penetrate the human body as a cone beam. In order to make it as close to reality as possible, we adopt cone-beam X-rays in this simulation. The X-ray point source is set at 1.5 m away from the fluoroscopy detector.
Considering that if the X-ray is uniformly distributed within the cone angle, the X-ray distribution on the flat-panel detector will no longer be uniform, and additional normalization correction is required, so this article makes the photons distribute uniformly on the plane of the detector. Considering that the size of the detector (432 × 432 mm) is much smaller than the distance from the source to the detector (1.5 m), this simplification does not affect final conclusions.
In simulations, all particles are not ejected from one point, but from a plane close to the human body, and the reverse extension line of the initial velocity direction is the point 1.5 m away from the fluoroscopy detector. This setting greatly saves the time of simulation. The size of the X-ray pencil beam used in the pencil beam scanning method is a square with the side length of 0.6 mm on the detector plane. Using such a fine ray beam to scan is for subsequent simulation results to be processed in diverse ways.

3.2.4. Energy Resolution

Energy spectrum detectors made of different crystal materials have different energy resolutions. In addition, the maximum sizes of crystal that can be produced are also different.
In the two scanning methods, since the fluorescence detectors on the sides only need to detect the energy of the photons and do not need to obtain the position distribution of the fluorescence photons, there is no need to use a detector array but a single crystal. From the perspective of cost saving, the sodium iodide detector is preferred, the energy resolution is 6 keV, and the area is 10 × 10 cm. The energy resolution of cadmium telluride is 1 keV, better than sodium iodide, but because of the problem of manufacturing process, the size is relatively small; take the area of 1 × 1 cm [22]. High-purity germanium is more expensive and needs to be used in conjunction with refrigeration, but its energy resolution can be 0.1 keV, and the size of crystal is 7 × 7 cm. The detectors are as close to the human body as possible without affecting the fluoroscopy imaging to ensure the detection efficiency.
The fluorescence detector selected for the cone beam method is a 5.12 × 5.12 cm cadmium telluride detector, a 32 × 32 crystal array. The collimator material is tungsten. The distance between the detector and the collimation seam and the human body needs to be calculated by the magnification.
We will first carry out the simulations, and then discuss the influence of energy resolutions on the output.

3.3. Number of Photons

The total number of photons to be used in our simulation, which is the total number of events to simulate in GEANT4, needs to match the actual dose in fluoroscopy imaging. The number of incident photons is determined by the product of the working current and working time of the X-ray tube, if the voltage is fixed.
Since the number of photons used in the simulation only considers the photons that can enter the human body, it is estimated based on the tube voltage (110 kV), tube current (200 mA), and working time (0.1 s) commonly used in fluoroscopy imaging, the average energy of the photon energy spectrum, the area of the fluoroscopy detector (43.2 cm × 43.2 cm), its distance (1.5 m) from the source, and energy conversion efficiency (1%).
According to these parameters of some common tubes, we can obtain that the number of photons that hit the human body in a fluoroscopy imaging is around 1012~1013, and we can think that the effective full-body dose under this technology is close to the dose of a fluoroscopy imaging. Considering the limitations of our computing power, we use 1012 photons in our simulation.

3.4. Selection of Contrast Agents

As mentioned above, we choose among gold, gadolinium, and bismuth for simulation. Different elements have different energy thresholds for fluorescent effect and different characteristic photon energy. The higher the threshold is, the fewer useful incident photons there are. The characteristic photon energy is positively correlated with the threshold. The higher the characteristic photon energy is, the more possible it is to get out of the phantom. For Au and Bi, it is hard for the applied X-ray source to excite these heavy elements. However, their cross sections for fluorescence are larger, and their fluorescence photons with higher energies will come out of the phantom more easily. We need to strike a balance between the two, so we use simulations to choose the best element.
We take a cube with a size of 1 × 1 × 1 cm in the middle of the right lung of the phantom as the tumor and add 5 mg/mL of gold or gadolinium or bismuth into it. The position of the cube in the phantom is shown in Figure 6.
Since the simulation of the entire technology takes a long time, and the difference between the three different elements can be seen as long as fewer photons are used, we use 1010 photons in the simulation and compare the contrast to noise ratio (CNR) of the range of interest (ROI) of the results for different elements. CNR is an important index to measure the contrast between a specific imaging area and the background area, and it is defined by the following formula:
CNR = μ ROI μ bkg σ bkg ,
μ ROI and μ bkg represent the mean value of the ROI and the background area, respectively, and σ bkg is the standard deviation of the background area. The red cube is the ROI, and other parts of lungs are the background.
The simulation shows that the CNR of Au is largest, so it is the best element for enhancement.

3.5. Concentration of Agents

According to the previous description, we select 5 and 0.5 mg/mL as the concentrations for the simulation. At present, the contrast agent concentration used by XFCT is generally between 0.5 and 10 mg/mL, so we believe that selecting these two concentrations for simulation is reasonable and representative.
In conclusion, the settings and parameters chosen in this part are shown in Table 2.

4. Results

Due to the limited width of the energy window of the detectors on sides, the detectors on both sides detect not only fluorescence photons but also a number of scattered photons. Similarly, due to various factors, many characteristic photons cannot reach the detector.
In response to the previous problem, we use a cubic function to fit the Compton scattering energy spectrum [23], imitating the three-energy window method [24] to remove scattered photons to improve the fluorescence images obtained by the detectors on sides.
The information collected by the flat panel detector in simulation is read. Because the structure of the collimator is too complicated, we did not build it in simulation but, directly based on the direction of the photons hitting on the flat-panel detector, exclude those whose directions are too different from the direction of the incident photons.
The result of the fluoroscopy imaging is shown as Figure 7. We can see every detail of the phantom clearly.
By outputting the results of fluoroscopy imaging, we also verified the correctness of the placement of the phantom and detector. It should be noted that the phantom at this time does not contain additional metal elements.

4.1. Results of Pencil Beam Spot Scanning Method

This method works best and is the most complicated. When processing the results of this method, some intermediate results and processing methods used will also be used later.

4.1.1. Comparison of Fluorescence Detectors

As is stated in Section 3.2.4, different fluorescence detectors have different energy resolutions. Moreover, the setting of energy window can also be different. Considering the complexity of the problem, we first set the area of the detectors on sides to 7 × 7 cm and the energy window as 0.1 keV and temporarily ignore the impact of energy resolutions. In the simulation process, the GEANT4 built-in function is used to output the energy of each photon received by the detector, and we will use it to discuss the impact of energy resolutions in Section 5.

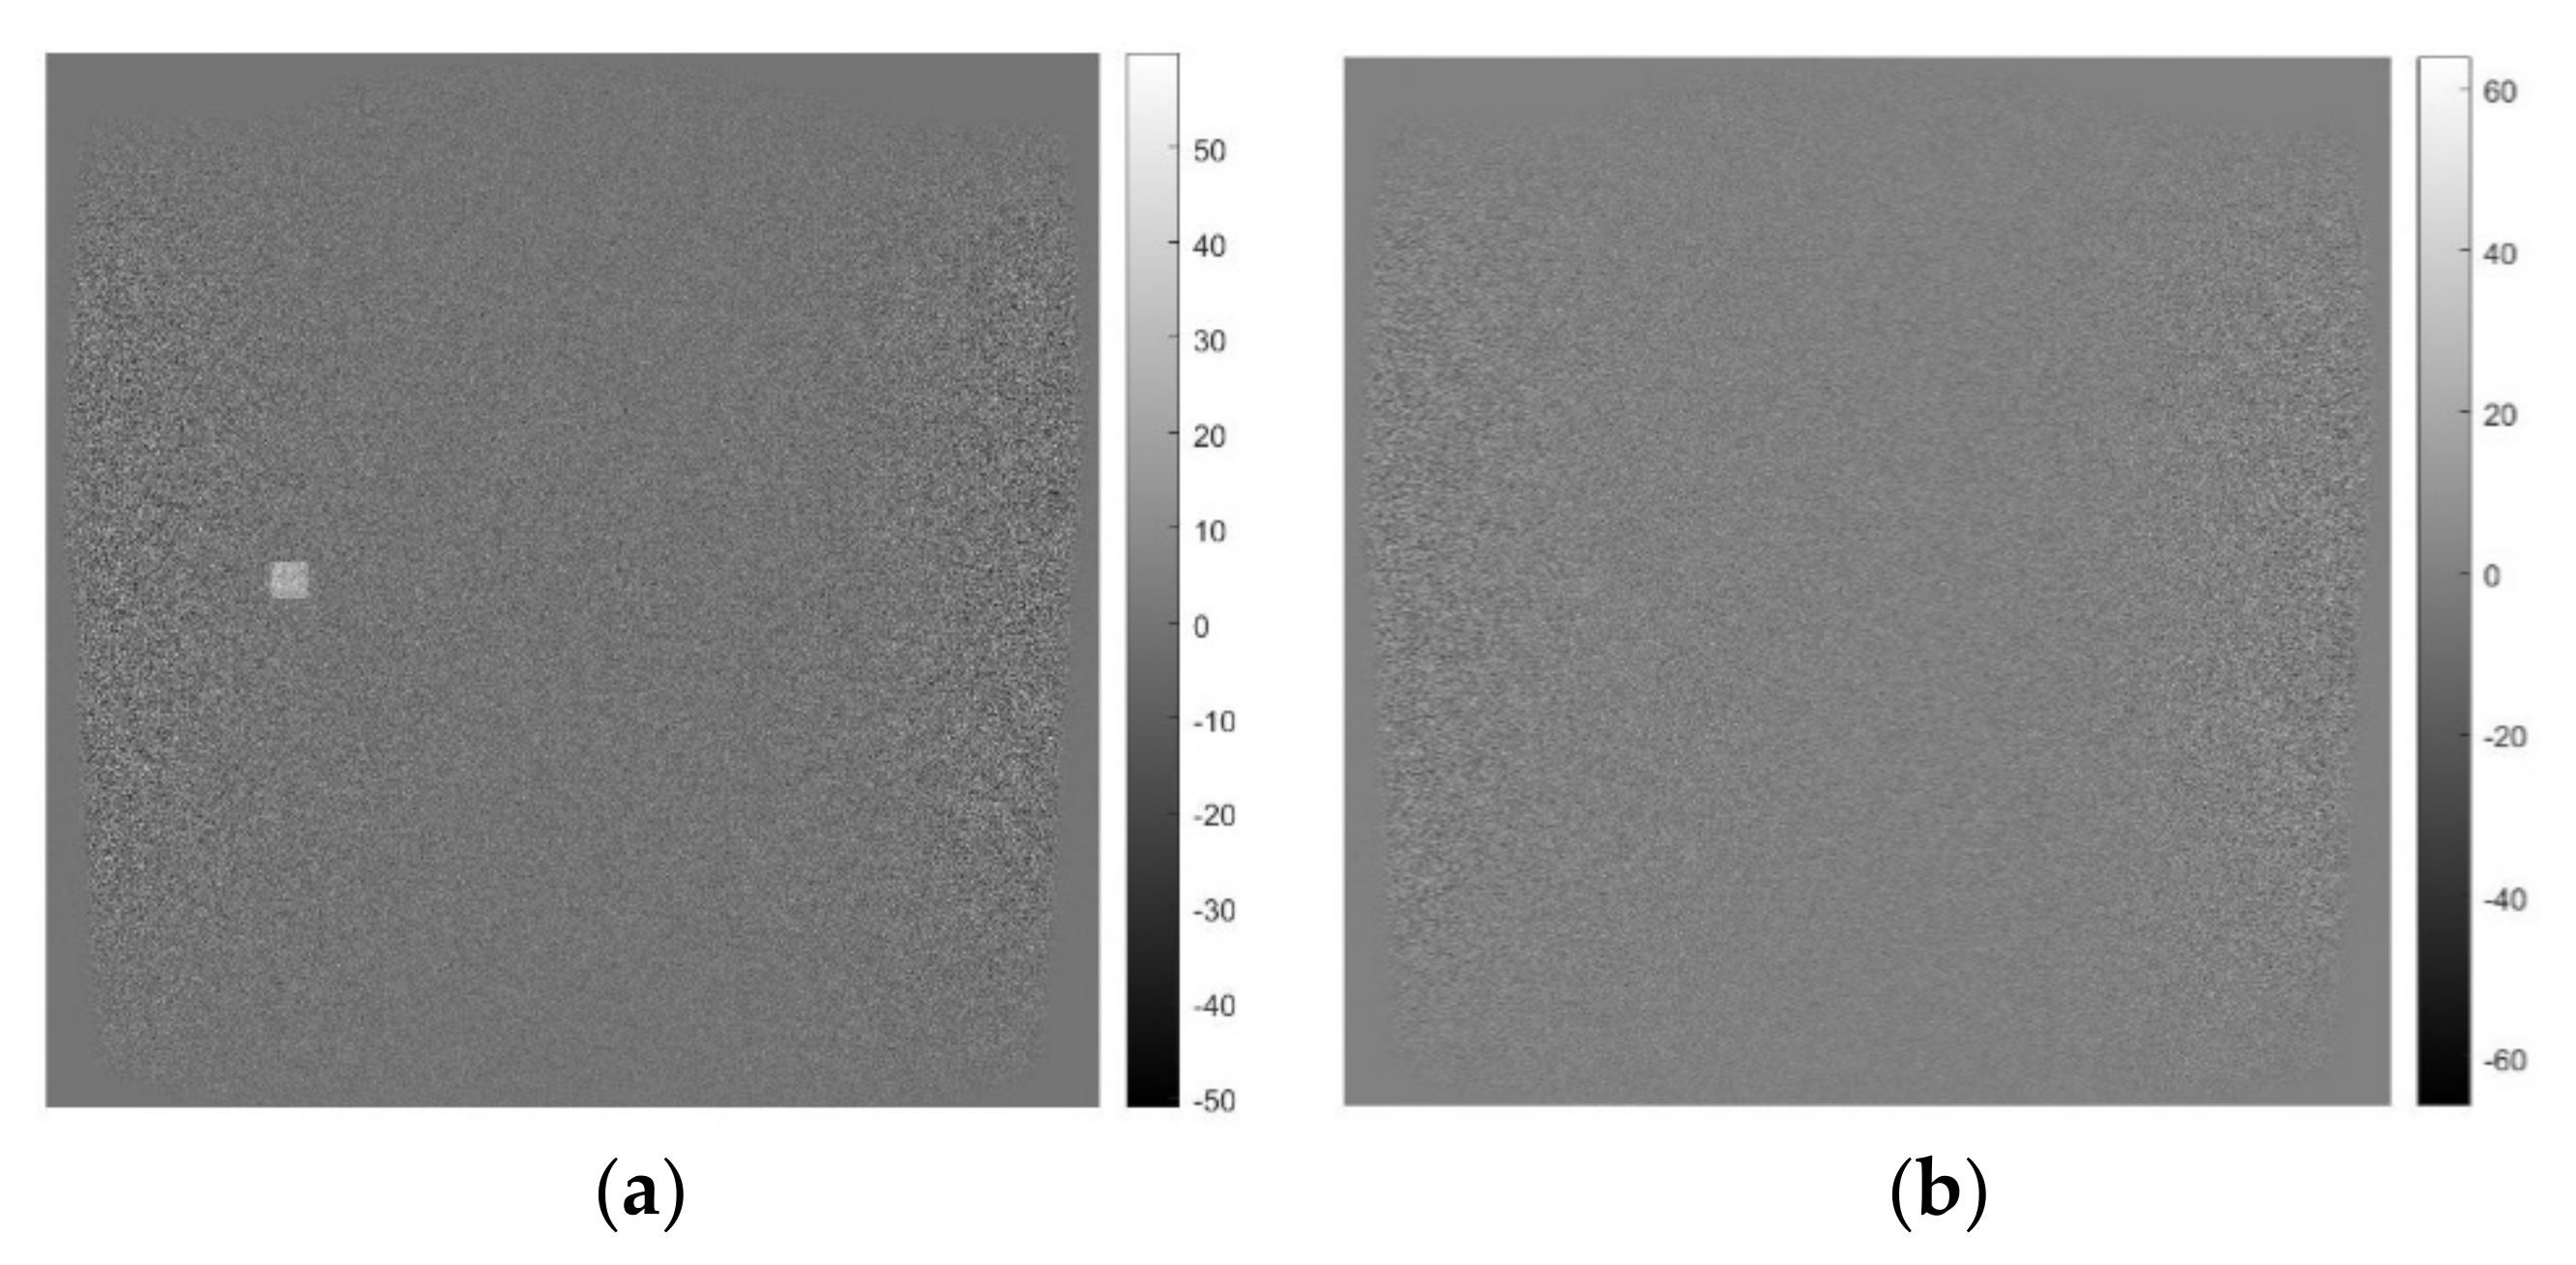
4.1.2. De-Scattering

We reduce the concentration of Au to 5 mg/mL, and the fluorescence image is shown in Figure 8. The position in the fluoroscopy image is the same as that in the fluorescence image. The gray value of each pixel is proportional to the number of photons received by the detectors on sides when the pencil beam scans this point.
From the above picture, we can clearly see that in addition to the square-distributed fluorescence photons we expect, there are also many scattered photons. Moreover, the distribution of these scattered photons also shows certain laws, because different organs have different abilities to scatter photons. The lungs with lower density show two obvious black areas on the map. The places on both sides of the human body close to the detector, because the scattered photons here are easier to detect, will appear brighter on the picture.
In the case of lower concentrations of Au, the distribution of fluorescence photons can easily be covered by scattered photons, such as the case at 0.5 mg/mL shown in the Figure 9, so we have to de-scatter the obtained fluorescence image.
Some efficient background reduction methods have been proposed for X-ray fluorescence imaging of human-sized objects [8]. However, we cannot directly borrow these methods because, unlike XFCT imaging, they are an improvement of two-dimensional imaging technology. The composition and thickness of the materials that each pencil beam passes through are very complex and unknown.
We cannot just use the current image to de-scatter; we need to comprehensively use the photon distribution of adjacent energy windows. As far as Figure 8 and Figure 9 are concerned, only the photons in the energy window of 69–69.1 keV are shown, because this energy region contains the largest fluorescence peak of the Au-Kα1 X-ray line, according to the Livermore physics list used by GEANT4 in simulations [25]. Figure 10 shows the fluorescence images of the two adjacent energy regions 68.9–69 and 69.1–69.2 keV (although these two images do not contain fluorescence photons, they are imaged with the detectors that collect fluorescence photons, so we call them that). Our idea is to use the distribution of photons from adjacent energy regions to estimate the distribution of scattering in the energy region of interest.
As mentioned above, we use a cubic function to fit the energy distribution of all photons (mostly scattered photons) received by the detectors on both sides of the human body, and the fit is shown in Figure 11.
In the fluorescence image we want, the distribution of scattered photons can be estimated by the following formula:
S n c S l P s n P s l + S h P s n P s h 2 ,
P s l , P s n , and P s h are the theoretical relative numbers of scattered photons collected by the low (68.9~69.0 keV), medium (69.0~69.1 keV), and high (69.1~69.2 keV) energy windows, which can be calculated by integrating the curve shown above in the corresponding interval. S l and S h are the photon distribution matrix of the low-energy window and high-energy window, respectively (Figure 10).
Then, the fluorescence signal after de-scattering correction can be expressed as:
S x r f = S n S n c ,
In order to quantitatively measure the denoising algorithm, we compare the true scattered photon distribution and the predicted scattered photon distribution in the energy region of interest. The closer the two are, the more effective our denoise reduction algorithm is. As shown in Figure 12, we draw the cross-section lines at the 360th row (middle) of the two and compare them. It seems that the prediction of the distribution of scattered photons is relatively accurate.
The fluorescence image after de-scattering correction is shown below.

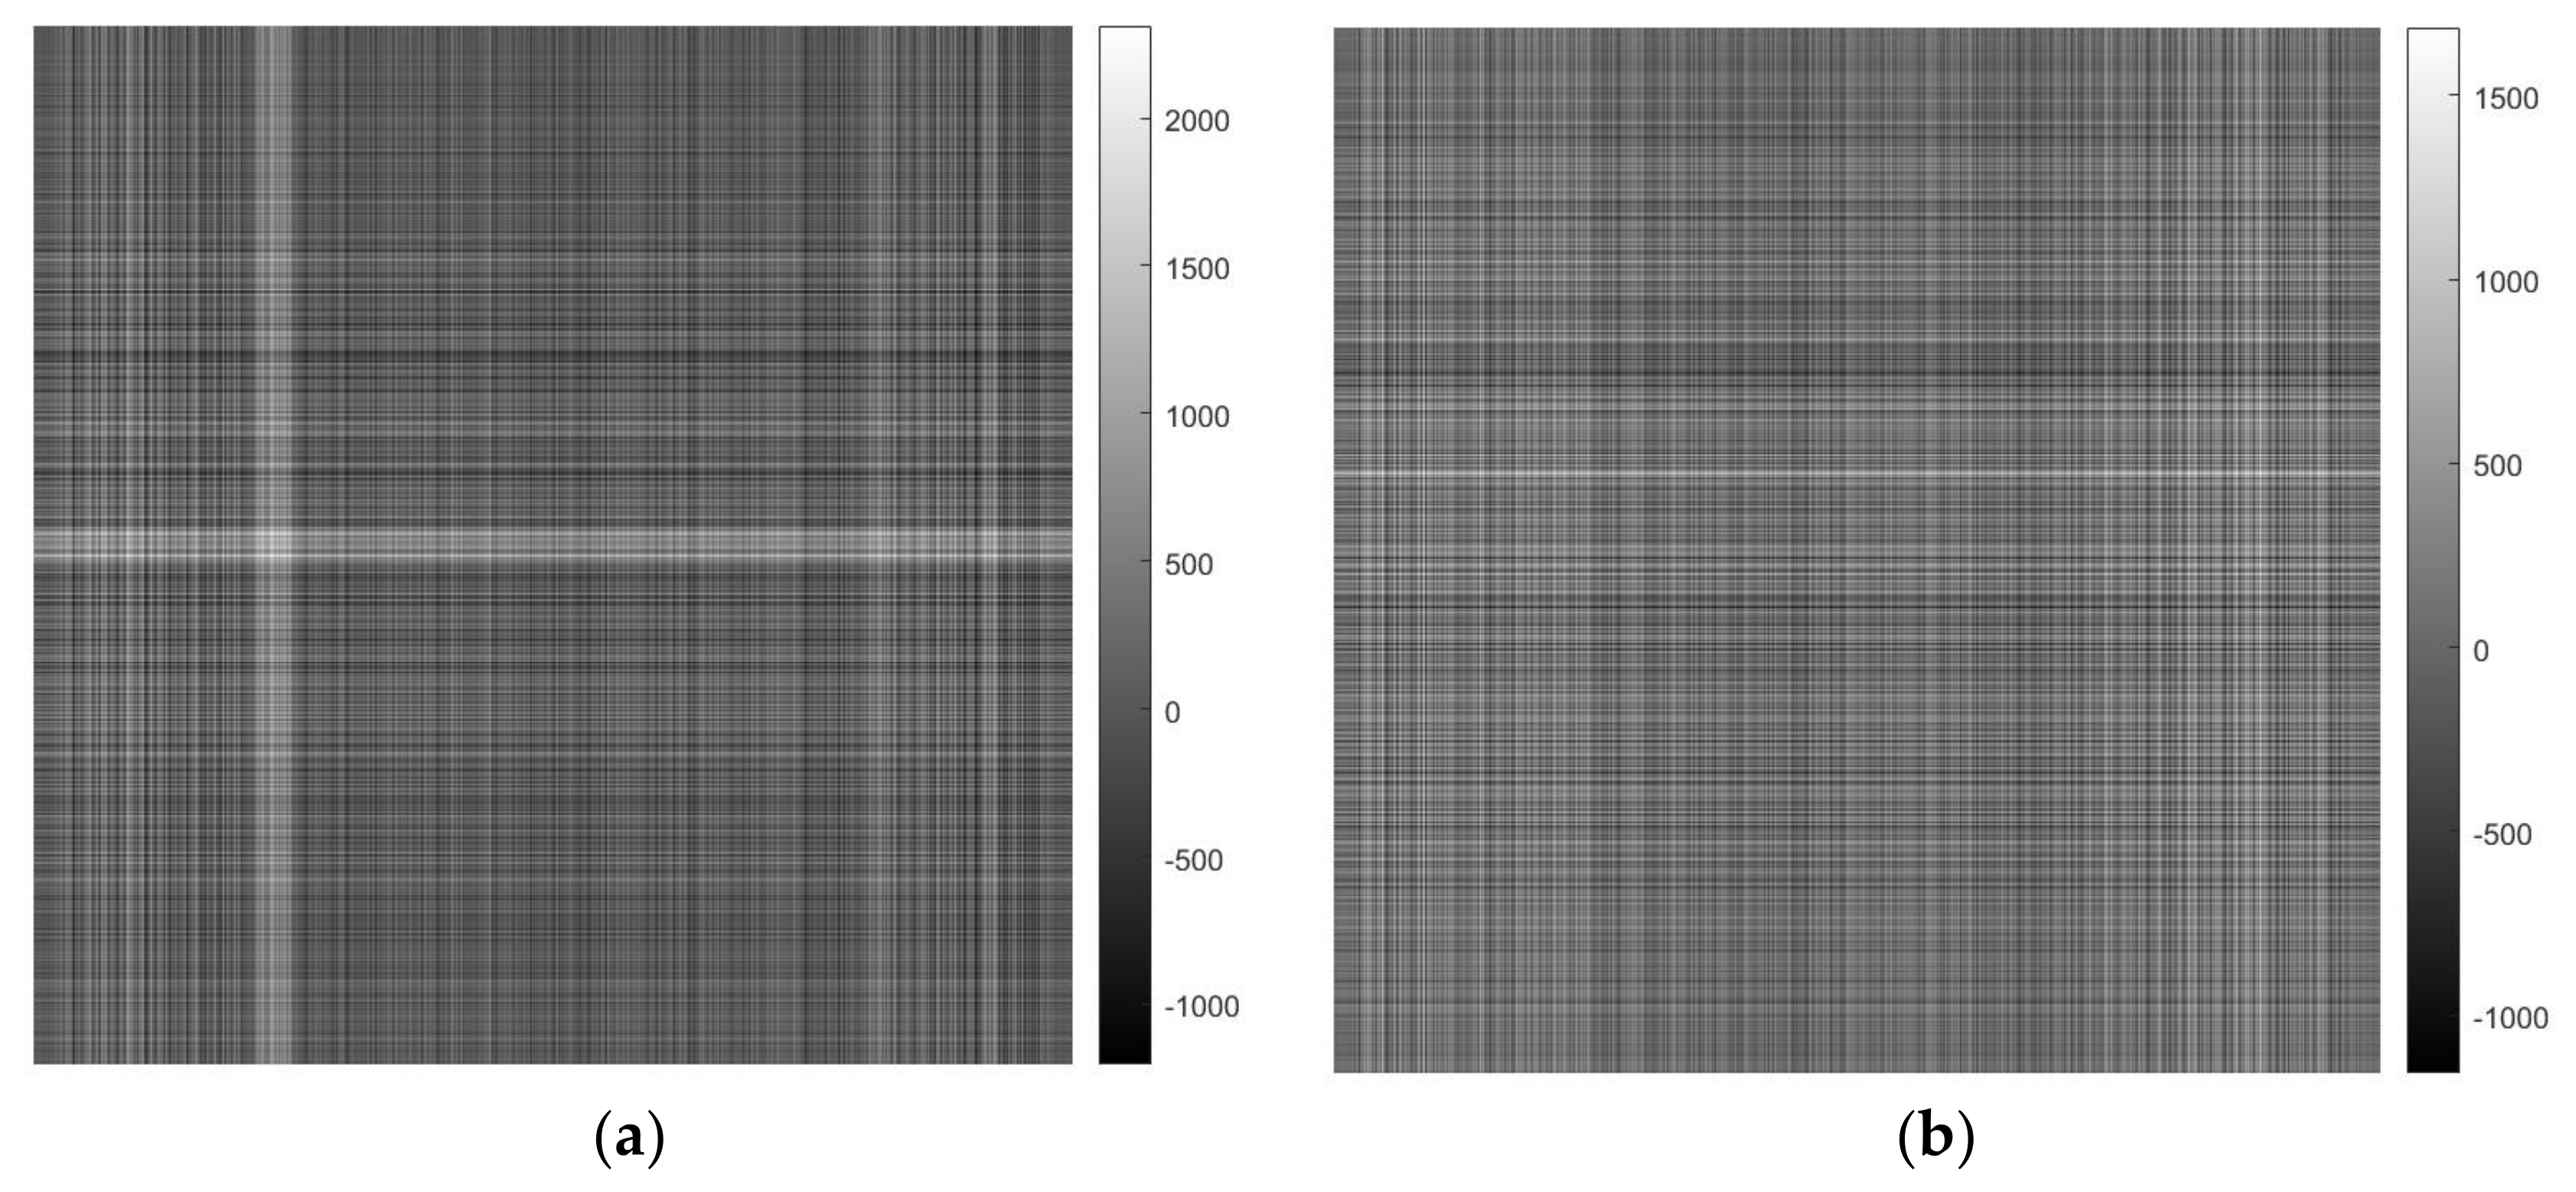
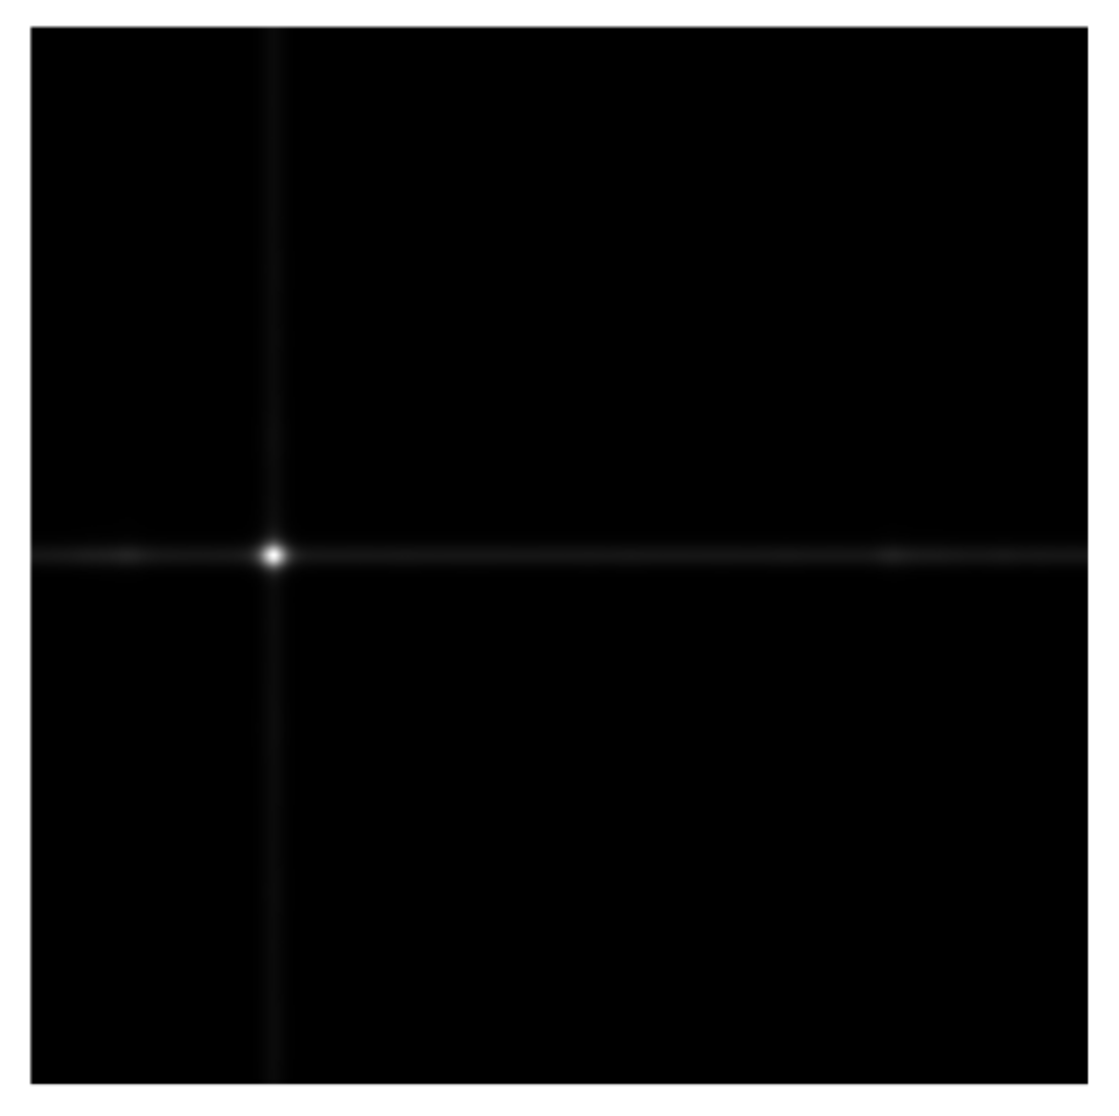
4.1.3. Convolution Denoising

In addition to fluorescence photons, in Figure 13, we can still observe snowflake-like noise. This is the white noise caused by the statistical fluctuations of scattered photons. We use the Gaussian convolution kernel to convolve the original image and smooth out the statistical fluctuations in the image.
Since the ROI is fixed, we change the parameters of the Gaussian convolution kernel to make the CNR for 5 mg/mL the largest. The convolution kernel is finally selected as a 39 × 39 square Gaussian convolution kernel with a variance of 9.4. The main function of the convolution kernel is to smooth out the white noise generated by the statistical fluctuations in the background area, so we can think that the effect of the optimal convolution kernel is universal and has nothing to do with the location of the lesion. We will verify this in Section 5. This kernel is of reference significance for the situation where 0.5 mg/mL of gold distribution cannot be clearly observed in the original picture.
At last, the results are shown in Figure 14. It is obvious that we successfully find the tumors and the CNRs are relatively high (over 3). It can be seen in Figure 14b that there are many false-positives that interfere with our judgment. We will address that in Section 5.

4.1.4. Dual Mode Enhancement Result

We combine the simulation result of fluoroscopy imaging in Figure 7 and fluorescence images in Figure 14 to present a dual-modal enhancement effect in Figure 15.
The red spherical object in the picture is the distribution of Au in the human body found by the pencil beam spot scanning method.
Finally, this method takes long time in practice (not in simulation) because, due to mechanical constraints, X-ray scanning point-by-point is time-consuming. As to the time of simulation, it takes 3–4 days to run 1012 events with 560 threads. This computing power requirement also limits us from performing simulations of a larger dose or more attempts.

4.2. Results of Cone-Beam Collimation Method

We design some geometric structures of this method in GEANT4 according to the assumption mentioned above. Their structures and relative positions to the tumor are shown in the Figure 16.
Theoretically, the characteristic photons are collimated through the seam to form a single-peak distribution in the vertical dimension on the detector, so that we can calculate the position of the tumor in the phantom according to the peak position. However, the signal we obtain does not satisfy this distribution, or the calculated result is far from the real position.
The reason is that the fluorescence signal is inherently weak. After being collimated by the slit collimator, the number of characteristic photons reaching the detectors on sides is small, and the statistical fluctuation is large. Many scattered photons also enter the detector through the collimation seam from other locations, causing significant interference, so the position of the fluorescence signal source cannot be reconstructed at all.

4.3. Results of Slit Scanning Method

We do not need to perform an additional simulation, since the simulation result of the pencil beam scanning method can be directly processed into the result of this method. We directly add the results of two horizontal and vertical scans, and we can see that this method has different performances on different concentrations.
The enrichment area of Au is quite obvious when its concentration is 5 mg/mL, while it cannot be found when its concentration is reduced to 0.5 mg/mL. The results of slit scanning method for different concentrations are shown in Figure 17.
Like the pencil beam spot scanning method, we hope to process this result further so that it can be better integrated with the fluoroscopy image. First, we have to perform similar de-scattering and convolution processing on these two results. Then, because there are two white lines, horizontal and vertical, which are also artifacts that we do not want, we convert the image to the power of the sum of the squares of the two scan results of each point horizontally and vertically, so that the image results can be well-improved.
Even after the above-mentioned treatment, the simulation result of the slit scanning at a concentration of 0.5 mg/mL still fails to see a good enrichment of Au. We show the processing results of the 5 mg/mL concentration simulation in Figure 18.
In the same way, we merge the above image with the fluoroscopy image, as shown in Figure 19. Although the recognized range is smaller than the result of the pencil beam scanning method and the preset size, the position is completely correct.

5. Discussions

Although the simulations have confirmed our technology to a considerable extent, there are still some problems to discuss.

5.1. Phantom

Indeed, this phantom has certain limitations. For example, the entire lung is composed of a homogeneous material mixed with a specific ratio of elements, so this phantom ignores the differences and internal tissues of many organs and structures. Later, we can use more detailed phantoms for simulation.

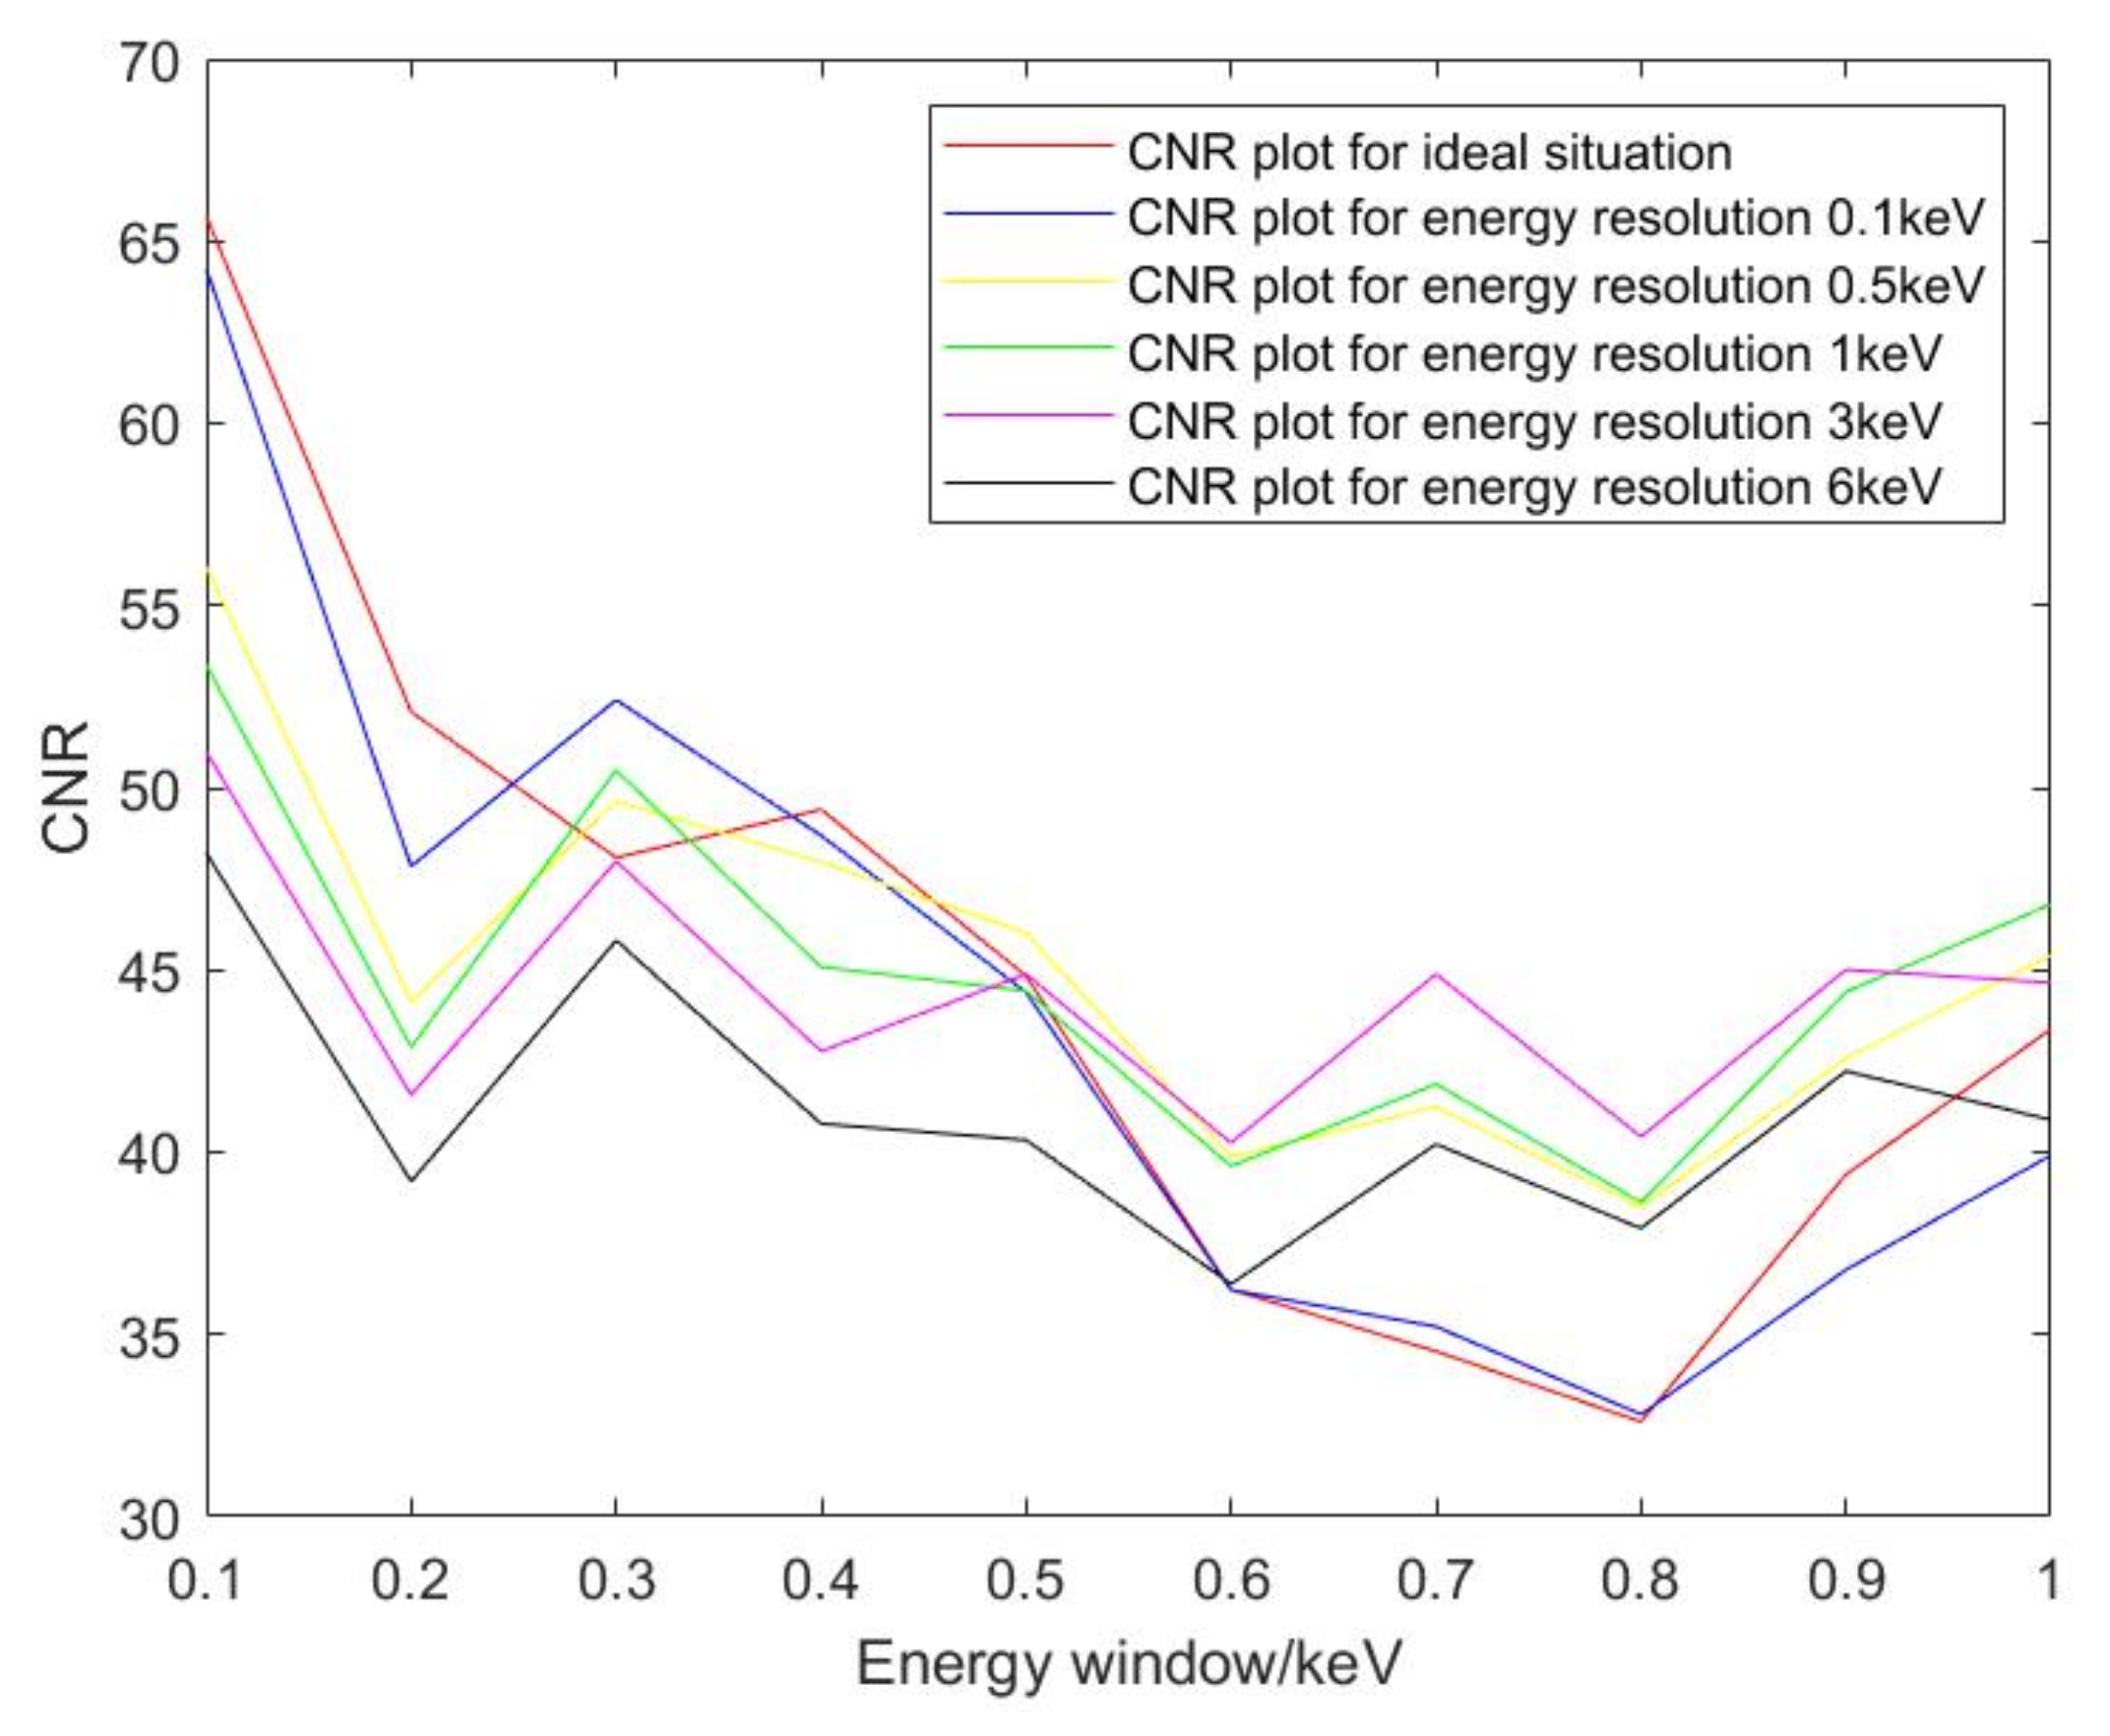
5.2. Influence of Energy Resolutions and Energy Windows

Considering the energy resolution of the detectors on sides, fluorescence photons will be spread over more than just one energy bin. Based on the energy of each photon output in simulation for 5 mg/mL of Au, we perform a Gaussian distribution transformation on them to make them a random value that conforms to the Gaussian distribution centered on its true value and different energy resolutions as the half-height widths. We set the half-height widths as [0.1, 0.5, 1, 3, 6] keV, so we can obtain six sets of data, including the original one.
For different energy resolutions, the energy window of the detectors should not be set to be as small as possible, because fluorescence photons may fall into different energy bins. We process the six sets of data according to four different energy windows [0.1, 0.3, 0.5, 1] keV and obtain the spatial distribution of photon counts obtained by detectors with different energy resolutions under different energy windows. We compare the CNRs of different results and draw it as shown in Figure 20, comprehensively showing the impact of energy resolutions and energy windows on the enhancement effect.

5.3. Position of the Lesion

In the previews part, only the simplest case of a tumor inside the lungs has been studied, while deep lying tumors are not treated. We move the lesion containing Au to the depths of the phantom, as shown in Figure 21. In this way, the tumor is closer to the bones, heart, and other tissues and further away from the detectors, making it harder to detect. In order to form a valid comparison with the previous results, we still set the concentration of Au to 5 mg/mL.
We use the best method, the pencil beam scanning method for simulation, and the parameter settings are consistent with the previous simulations. We still cannot see the distribution of Au after de-scattering, so we need to conduct convolution denoising. By this chance, we can verify that the optimal convolution kernel is independent of the location of the lesion. The optimal convolution kernel can improve the CNR of the result after de-scattering from 0.2031 to 5.5018. The best convolution kernel retrieved in this case can only optimize the CNR by less than 5% at most compared to this result.
The fluorescence image after convolution is shown in Figure 22.

5.4. False Positive

For situations that are not easy to detect, such as Figure 14b and Figure 22, we can see that they definitely show many false-positives. Here is a solution to address false-positives.
In the previous parts, our enhancement technique only uses the strongest fluorescence peak of Au, the Au-Kα1. In fact, there are still other fluorescence peaks available. As can be seen in Figure 23, Au-Kα2 and Au-Kβ1 do exist, though they are weaker compared with that in Figure 8.
For the fluorescence peaks of different energies, we do the same de-scatter and convolution on them and use the results comprehensively. False positives are caused by statistical fluctuations in the counts of scattered photons, and their spatial distribution is random, while the spatial distribution of fluorescent photons of different fluorescence peaks is fixed. Using this point, we can better eliminate the interference of false positives, and the final result is shown in Figure 24.

5.5. Other Areas for Improvement

This research still has some limitations. First, related agents need further research and medical observation, although agents containing gold or gadolinium have been widely used. Second, the concentration that the agent can reach in the human body needs further study. Third, these simulations ignore the electronic noise of the detectors, so if the technology is put into practice, the effect may be worse.
Additionally, there is more room for improvement in this technology. First, the detectors on sides of the slit scanning method can be the same as those in the cone-beam collimation method, using spatially distributed detector arrays instead of single crystals, and a new algorithm can be designed to improve the detection ability of the slit scanning method. Second, if polarized light is used as the X-ray source, since polarized light scatters very few photons at certain angles, it may be able to improve the quality of the image obtained by this technology. However, due to some factors in the phantom and simulation code, we did not study further in this area. Third, for some methods used in the article, many of their features have room for further quantitative analysis, such as error analysis of the de-scattering algorithm.
Last, these are just simulations after all. The true feasibility of this technology needs yet to be verified by experiments.

6. Conclusions

In this paper, a set of Monte Carlo simulations and their corresponding analysis are presented. We can see that the idea of X-ray fluorescence-enhanced fluoroscopy imaging technology has been confirmed, allowing traditional fluoroscopy imaging technology to better diagnose early lung lesions. Different methods may work according to the concentration of agents and the actual situation of the patient. The slit scanning method consumes less time but demands higher concentration, while the pencil beam spot scanning method can work with lower concentration, consuming much more time.

Author Contributions

Conceptualization, L.L.; methodology, Z.Y. and L.L.; software, Z.Y.; validation, Z.Y.; formal analysis, Z.Y.; investigation, Z.Y.; resources, R.Q.; data curation, Z.Y.; writing—original draft preparation, Z.Y; writing—review and editing, Z.Y. and L.L.; visualization, Z.Y.; supervision, L.L. and Z.C.; project administration, L.L. and Z.C.; funding acquisition, L.L. All authors have read and agreed to the published version of the manuscript.

Funding

This research was funded in by National Natural Science Foundation of China 11775124 and National Key Research and Development Program of China 2018YFC0115502.

Informed Consent Statement

Not applicable.

Data Availability Statement

You can find data and code of this paper in https://cloud.tsinghua.edu.cn/d/7c53aaae522a49969437/. The last accessed date is 12 October 2021.

Conflicts of Interest

The authors declare no conflict of interest. The funders had no role in the design of the study; in the collection, analyses, or interpretation of data; in the writing of the manuscript; or in the decision to publish the results.

References

  1. Reddy, B.S.; Premachand, K.; Rao, P.V.R.; Parthasaradhi, K. Z-dependence of photoelectric cross-section in the energy region of absorption edges (6.4 ÷ 136.47) keV. Il Nuovo Cim. A 1992, 105, 735–739. [Google Scholar] [CrossRef]
  2. Yue, Z.G.; Wei, W.; You, Z.X.; Yang, Q.Z.; Yue, H.; Su, Z.G.; Ma, G.H. Iron Oxide Nanotubes for Magetically Guided Delivery and pH-Activated Release of Insoluble Anticancer Drugs. Adv. Funct. Mater. 2011, 21, 3446–3453. [Google Scholar] [CrossRef]
  3. Chen, J.; Zhang, S.; Fang, W.; Li, L. The latest development of X-ray fluorescence computed tomography. Chin. J. Stereol. Image Anal. 2018, 23, 102–116. [Google Scholar]
  4. Rui, X. Synthesis of Nanoparticles as A Contrast Agent for CT and Application in Imaging; Jilin University: Changchun, China, 2014. [Google Scholar]
  5. Gang, X.; Zhengping, Q.; Minghua, Z.; Xiaoming, C.; Shengli, G. A single-source approach to Bi2S3 and Sb2S3 nanorods via a hydrothermal treatment. Cryst. Growth Des. 2004, 4, 513–516. [Google Scholar]
  6. Popovtzer, R.; Agrawal, A.; Kotov, N.; Popovtzer, A.; Balter, J.; Carey, T.; Kopelman, R. Targeted Gold Nanoparticles Enable Molecular CT Imaging of Cancer. Nano Lett. 2008, 8, 4593–4596. [Google Scholar] [CrossRef] [Green Version]
  7. Manohar, N.; Reynoso, F.J.; Diagaradjane, P.; Krishnan, S.; Cho, S.H. Quantitative imaging of gold nanoparticle distribution in a tumor-bearing mouse using benchtop x-ray fluorescence computed tomography. Sci. Rep. 2016, 6, 22079. [Google Scholar] [CrossRef] [PubMed] [Green Version]
  8. Grüner, F.; Blumendorf, F.; Schmutzler, O.; Staufer, T.; Bradbury, M.; Wiesner, U.; Rosentreter, T.; Loers, G.; Lutz, D.; Richter, B.; et al. Localising functionalised gold-nanoparticles in murine spinal cords by X-ray fluorescence imaging and background-reduction through spatial filtering for human-sized objects. Sci. Rep. 2018, 8, 16561. [Google Scholar] [CrossRef] [Green Version]
  9. Schmutzler, O.; Graf, S.; Behm, N.; Mansour, W.; Blumendorf, F.; Staufer, T.; Körnig, C.; Salah, D.; Kang, Y.; Peters, J.; et al. X-ray Fluorescence Uptake Measurement of Functionalized Gold Nanoparticles in Tumor Cell Microsamples. Int. J. Mol. Sci. 2021, 22, 3691. [Google Scholar] [CrossRef] [PubMed]
  10. Zhang, S.; Li, L.; Chen, J.; Chen, Z.; Zhang, W.; Lu, H. Quantitative Imaging of Gd Nanoparticles in Mice Using Benchtop Cone-Beam X-ray Fluorescence Computed Tomography System. Int. J. Mol. Sci. 2019, 20, 2315. [Google Scholar] [CrossRef] [PubMed] [Green Version]
  11. Zhang, S.; Li, L.; Chen, Z. Scattering Noise Model Enhanced EM-TV Algorithm for Benchtop X-ray Fluorescence Computed Tomography Image Reconstruction. IEEE Access 2019, 7, 113589–113595. [Google Scholar] [CrossRef]
  12. Li, L.; Zhang, S.; Li, R.; Chen, Z. Full-field fan-beam x-ray fluorescence computed tomography with a conventional x-ray tube and photon-counting detectors for fast nanoparticle bioimaging. Opt. Eng. 2017, 56, 043106. [Google Scholar] [CrossRef]
  13. Liang, L.; Ruizhe, L.; Siyuan, Z.; Zhiqiang, C. Simultaneous X-ray fluorescence and K-edge CT imaging with photon counting detectors. Proc. SPIE 2016. [Google Scholar] [CrossRef]
  14. Sokolov, K.; Follen, M.; Aaron, J.; Pavlova, I.; Malpica, A.; Lotan, R.; Richards-Kortum, R. Real-time vital optical imaging of precancer using anti-epidermal growth factor receptor antibodies conjugated to gold nanoparticles. Cancer Res. 2003, 63, 1999–2004. [Google Scholar]
  15. Cho, S.H. Estimation of tumour dose enhancement due to gold nanoparticles during typical radiation treatments: A preliminary Monte Carlo study. Phys. Med. Biol. 2005, 50, N163. [Google Scholar] [CrossRef]
  16. Jones, B.L.; Krishnan, S.; Cho, S.H. Estimation of microscopic dose enhancement factor around gold nanoparticles by Monte Carlo calculations. Med. Phys. 2010, 37, 3809–3816. [Google Scholar] [CrossRef]
  17. Feifei, L.; Zihou, L.; Xiaodong, J.; Aiguo, W.; Weiqiang, C.; Qiang, L. Radiosensitizing Effect of Gadolinium Oxide Nanoparticles on Human Non-small Cell Lung Cancer A549 Cells. Nucl. Phys. Rev. 2019, 36, 373. [Google Scholar] [CrossRef]
  18. Hurtado, S.; León, M.G.; García-Tenorio, R. Monte Carlo simulation of the response of a germanium detector for low-level spectrometry measurements using GEANT4. Appl. Radiat. Isot. 2004, 61, 139–143. [Google Scholar] [CrossRef]
  19. Poludniowski, G.; Landry, G.; Deblois, F.; Evans, P.M.; Verhaegen, F. SpekCalc: A program to calculate photon spectra from tungsten anode x-ray tubes. Phys. Med. Biol. 2009, 54, N433. [Google Scholar] [CrossRef] [PubMed] [Green Version]
  20. Wei, L.; Rui, Q.; Zhen, W.; Li, C.; Yang, B.; Liu, H.; Ren, L.; Li, J. Calculation of conversion coefficients using Chinese adult reference phantoms for air submersion and ground contamination. Phys. Med. Biol. 2017, 62, 2276–2314. [Google Scholar]
  21. Lu, W.; Wu, Z.; Qiu, R.; Li, C.; Yang, B.; Gao, S.; Ren, L.; Li, J. Physical Dosimetric Reconstruction of a Radiological Accident at Nanjing (China) for Clinical Treatment Using THUdose. Health Phys. 2017, 113, 327–334. [Google Scholar] [CrossRef] [PubMed]
  22. Yong, H.; Lei, Y.; Ruji, Y.; Ohno, R. The Principle of Cadmium Telluride(CdTe)Detector and Medical Application. Shanghai J. Biomed. Eng. 2005, 4, 221–225. [Google Scholar]
  23. Kuang, Y.; Pratx, G.; Bazalova, M.; Meng, B.; Qian, J.; Xing, L. First demonstration of multiplexed x-ray fluorescence computed tomogra-phy (XFCT) imaging. IEEE Trans. Med. Imaging 2013, 32, 262–267. [Google Scholar] [CrossRef] [PubMed]
  24. Ichihara, T.; Ogawa, K.; Motomura, N.; Kubo, A.; Hashimoto, S. Compton scatter compensation using the triple-energy window method for single-and dual-isotope SPECT. J. Nucl. Med. 1993, 34, 2216–2221. [Google Scholar] [PubMed]
  25. Perkins, S.T.; Cullen, D.; Chen, M.H.; Rathkopf, J.; Scofield, J.; Hubbell, J.H. Tables and Graphs of Atomic Subshell and Relaxation Data Derived from the LLNL Evaluated Atomic Data Library (EADL), Z = 1–100; US Department of Energy, Office of Scientific and Technical Information: Oak Ridge, TN, USA, 1991.
Figure 1. Schematic diagram of the device for pencil beam spot scanning method.
Photonics 08 00441 g001
Figure 2. Schematic diagram of cone-beam collimation method.
Photonics 08 00441 g002
Figure 3. Schematic diagram of slit scanning method.
Photonics 08 00441 g003
Figure 4. Energy spectrum of the incident X-ray.
Photonics 08 00441 g004
Figure 5. Lung (a) and rib cage (b).
Photonics 08 00441 g005
Figure 6. Relative position of the tumor (the red cube) in the fluoroscopy image of the phantom.
Photonics 08 00441 g006
Figure 7. Result for fluoroscopy imaging.
Photonics 08 00441 g007
Figure 8. Fluorescence image for 5 mg/mL of Au.
Photonics 08 00441 g008
Figure 9. Fluorescence image for 0.5 mg/mL of Au.
Photonics 08 00441 g009
Figure 10. Fluorescence images of adjacent energy windows for 5 mg/mL of Au. 68.9–69 keV: (a); 69.1–69.2 keV: (b).
Photonics 08 00441 g010
Figure 11. The result of cubic function fitting energy spectrum.
Photonics 08 00441 g011
Figure 12. Cross-section lines at the 360th row of the true scattered photon distribution and the predicted scattered photon distribution in the energy region of interest.
Photonics 08 00441 g012
Figure 13. Results of pencil beam spot scanning method. 5 mg/mL: (a); 0.5 mg/mL: (b).
Photonics 08 00441 g013
Figure 14. Results (720 × 720) of the pencil beam spot scanning method. 5 mg/mL: (a); 0.5 mg/mL: (b).
Photonics 08 00441 g014
Figure 15. Dual-modal enhancement effect for pencil beam scanning method.
Photonics 08 00441 g015
Figure 16. Geometric structures (a,b) of cone-beam collimation method.
Photonics 08 00441 g016
Figure 17. Results of slit scanning method. 5 mg/mL: (a); 0.5 mg/mL: (b).
Photonics 08 00441 g017
Figure 18. Improved results of slit scanning method.
Photonics 08 00441 g018
Figure 19. Dual-modal enhancement effect for slit scanning method.
Photonics 08 00441 g019
Figure 20. CNRs under different energy resolutions and energy windows for 5 mg/mL of Au.
Photonics 08 00441 g020
Figure 21. Relative position of a deep lying tumor.
Photonics 08 00441 g021
Figure 22. Results (720 × 720) of a deep lying tumor with 5 mg/mL of Au.
Photonics 08 00441 g022
Figure 23. Fluorescence images for (a): Au-Kα2 (67.1–67.2 keV); (b): Au-Kβ1 (77.8–77.9 keV) [25].
Photonics 08 00441 g023
Figure 24. Results after comprehensive utilization of each fluorescence peak for (a) Results in Figure 14b; (b) results in Figure 22.
Photonics 08 00441 g024
Table 1. Parameters for the energy spectrum.
Peak EnergyEnergy Bin/keVThetaAnode MaterialAirAlCu
110 keV130°Tungsten1000 mm3 mm0.11 mm
Table 2. Basic settings for simulation.
Peak EnergyMaterial TypeTumor SizeSimulation PhotonsConcentration
110 keVAu1 cm310125 mg/mL
110 keVAu1 cm310120.5 mg/mL
Publisher’s Note: MDPI stays neutral with regard to jurisdictional claims in published maps and institutional affiliations.

