Abstract
To improve the laser cleaning efficiency of Q235 carbon steel, an imaging analysis-based intelligent technique is proposed. Both offline and online computations are designed. Regarding the offline procedure, first, the corrosion images are accumulated to compute the gray-level co-occurrence matrix (GLCM) and the concave-convex region features. Second, different laser cleanings are performed to obtain various cleaned images. Third, a new cleaning performance evaluation method is developed: a metal color difference feature and a dynamic weight dispatch (DWD) corrosion texture are computed. Finally, a particle swarm optimization (PSO)-support vector machine (SVM) is utilized to forecast the laser process parameters. The corresponding laser parameters include power, linear velocity, and line spacing. For the online computation, after the GLCM and the concave-convex region features are computed, an iterative computation is used to tune the process parameters: the random laser parameters are generated constantly, and the iteration is performed and terminated only if the PSO-SVM output is positive. The experimental results have shown that the cleaning efficiency of this method can be improved, and the qualified rate is 92.5%.
1. Introduction
Laser cleaning is a green and environmentally friendly technology that has been widely used in the preservation of cultural heritage, nuclear fusion research, ship repair and industrial manufacturing [1,2,3,4,5]. Laser cleaning has many advantages, including good cleaning quality, high cleaning efficiency, and stable cleaning precision. Some spectroscopic techniques are used to monitor the procedure of laser cleaning [6,7]. However, due to the uneven rust distribution and the complex laser control of cleaning, it is not easy to guarantee the corresponding cleaning performance, and the substrate materials may be oxidized or damaged [8]. Therefore, an integrated cleaning process that can intelligently forecast the effect of laser cleaning according to the laser parameters and the corrosion degree of workpieces is needed. Additionally, the cleaning performance should be quantitatively calculated by the images collected after laser cleaning.
In recent years, with the advancements of artificial intelligence technology, intelligent laser cleaning has become a fast development opportunity. The intelligent laser cleaning system utilizes an imaging sensor, the computer vision algorithm, and the pattern recognition theory to improve the system automation degree and reduce the dependence on human-involved experience. For example, Mutin et al. [9] used a spectrometer to analyze spark images during laser cleaning and evaluated the cleaning quality online. Tserevelakis et al. [10] monitored the cleaning performance of stone online by photoacoustic signals and predicted whether the stone could be damaged through statistical analysis. In general, intelligent laser cleaning mainly solves the problems of cleaning performance assessment and laser process parameter control.
Regarding the cleaning performance assessment issue, machine vision systems have been widely used in surface cleanliness evaluations [11] before and after cleaning in engineering. Without loss of generality, this kind of system includes a laser, a Cartesian coordinate robot, an imaging sensor, and a data processing unit. Figure 1 presents its sketch map. Clearly, by the application of this system, many intelligent cleaning methods can be implemented. In [12], a coupling algorithm of dynamic threshold location was proposed to solve the problem of uneven illumination on the material surface and separate the qualified area from the unqualified area. In [13], a method of surface roughness estimation based on image analysis was proposed. The authors used the machine vision method to judge the effect of laser cleaning and determine whether the cleaning performance was qualified.
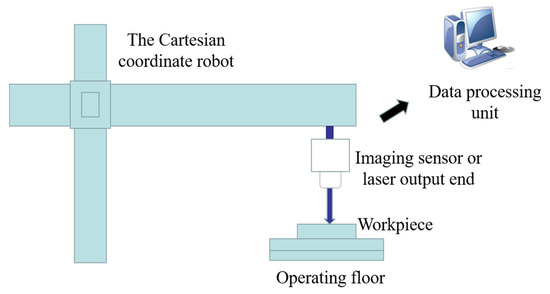
Figure 1.
The sketch map of the lase cleaning implementation system.
For the laser process parameter control problem, many intelligent methods have also been developed. In contrast to the traditional control mechanism, which mainly depends on human-involved experience [14], the intelligent process parameter control technique can employ an artificial neural network [15], intelligent reasoning, or a support vector machine (SVM) to realize the automatic estimation of multiple laser process parameters. In [16], images of an iron surface after laser cleaning were collected, and a dataset was established. A convolutional neural network was used to forecast the cleanliness of the rusty iron surface after laser cleaning. In [17], Lopez et al. developed a processing strategy for laser ablation. The 3D control method was applied to paint removal from a 3D stone surface. Clearly, the current research still has some drawbacks. For example, the cleaning performance perception abilities of most systems are still very low, which results in the limited control effect of laser-cleaning procedures.
In this paper, the laser-cleaning application of Q235 carbon steel [18] is investigated. An offline classifier is trained to realize cleaning performance evaluation by the image features of rusty metal and the laser process parameters. The gray-level co-occurrence matrix (GLCM) and the concave-convex region features are computed for the metal before cleaning. The GLCM describes the joint distribution of two pixel gray levels with some spatial location relationships. The concave-convex region feature can indicate the textured spots on the metal surface, and threshold segmentation is used to calculate this feature. A two-stage cleaning performance evaluation method is proposed: in the first stage, the cleaning performance is preliminarily judged according to the image color difference between the cleaned workpiece and the standard workpiece; and in the second stage, a dynamic weight dispatch (DWD)-based corrosion texture feature is used to assess the clustering degree of pixel bins after image segmentation. Then, a particle swarm optimization (PSO) SVM can be trained by the analysis results. An online prediction of the optimal laser process parameters is realized by a random iteration computation.
The main contributions of this paper include the following: first, a two-stage quantitative evaluation method of laser cleaning performance is proposed. A novel DWD corrosion texture feature is developed for cleaning performance evaluation. Second, a random iteration estimation method of laser process parameter tuning is designed. The laser process parameters can be adaptively assessed by the proposed technique to achieve optimal cleaning performance.
In the following sections, first, the proposed effect evaluation and the parameter adjustment methods are presented. Then, the corresponding experimental results are given. Finally, conclusions and future works are presented.
2. Proposed Method
2.1. Algorithm Flowchart
Figure 2 shows the computational flowchart of the intelligent laser cleaning methodology. Regarding the offline procedure, many images are accumulated through processing parameter experiments. First, many surface images of rusty carbon steel are collected, and a series of image features, including the GLCM and the concave-convex region features, are computed to evaluate the corrosion degree of these workpieces. Second, many laser process parameters are also set carefully to carry out practical laser cleaning applications. Then, a large number of surface images of the workpiece after cleaning can be captured. Third, both a metal color difference feature and a DWD corrosion texture are computed to evaluate the cleaning performance, and all the cleaning performance images are marked as qualified or unqualified. Finally, both the image features and the laser parameters are used to train the PSO-SVM for laser parameter prediction purposes.
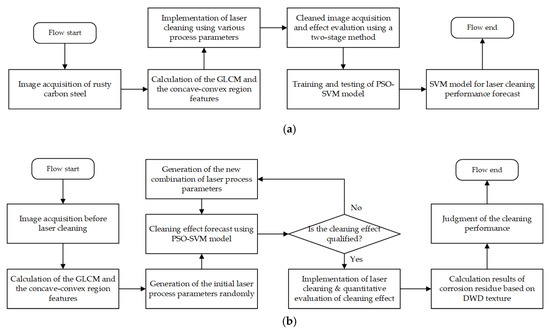
Figure 2.
Flow chart of the proposed intelligent laser cleaning methodology. (a) The offline processing flow chart; (b) the online processing flow chart.
In the online computational process, first, the surface images of the rusty workpiece are collected. Second, the image features of the captured image above, such as the GLCM and the concave-convex region features, are computed. Third, the laser parameters are set randomly, and the PSO-SVM model is used to forecast the cleaning performance [19]. The input data of the PSO-SVM include the image features and the laser process parameters; its output is the qualified label or the unqualified label of image data. If the result is unqualified, the laser parameters are generated randomly again to participate in the cleaning performance prediction. This process is implemented iteratively until the result becomes qualified. Finally, practical laser cleaning is carried out, the cleaning performance of the material surface is quantitatively evaluated, and the corresponding cleaning efficiency results are outputted.
2.2. Cleaning Performance Evaluation Using a Two-Stage Method
In this paper, a two-stage cleaning performance evaluation method is developed. Figure 3 presents the proposed computational flowchart. When carrying out cleaning, the bright white metal substrate can be exposed if the laser process parameters are set properly; otherwise, residual rust will remain. Another fact is that when the laser power density exceeds the damage threshold, the workpiece may also be oxidized, which will result in a yellow or even red metal surface. To assess the cleaning performance objectively, the CIEDE2000 color difference model is utilized to preliminarily determine the overall cleaning performance of the workpiece [20]. Then, image enhancement is computed, and a DWD corrosion texture feature is calculated after Otsu’s segmentation. Generally, the DWD refers to the percentage of corroded area in the whole image area, with a range of 0–1. Different weights are given to the corroded pixels according to their individual corrosion aggregation degrees. Finally, the equivalent area of the residual corrosion is calculated to assess whether the cleaning performance is acceptable.
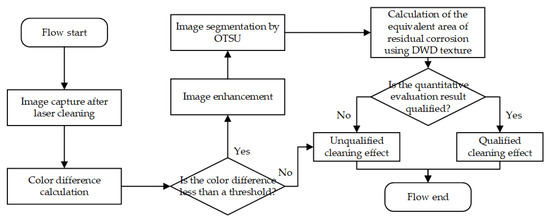
Figure 3.
The proposed flow chart of the two-stage cleaning performance evaluation methodology.
2.2.1. Color Difference Feature
After the laser cleaning of carbon steel workpieces, we can divide the cleaning performance of the workpieces into three grades: insufficient cleaning, proper cleaning, and overcleaning. Figure 4 shows their corresponding image samples in Figure 4a–c. From Figure 4, it can be found that the color difference apparently exists among these images; thus, this index can be utilized as an image feature for cleaning performance evaluation. In our application, the images of insufficient cleaning or overcleaning are directly determined as the unqualified cleaning case. When collecting these images, it should be emphasized that these images are collected under the same environmental lighting conditions; otherwise, the color difference will be seriously affected by the lighting.
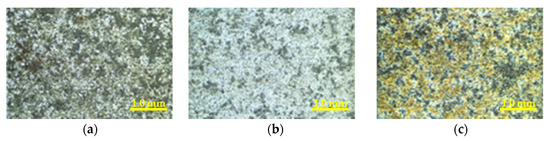
Figure 4.
Photos of three kinds of cleaning performance sample. (a) Photo of the insufficient cleaning performance; (b) photo of the qualified cleaning performance; (c) photo of the over cleaning performance.
In this paper, the CIEDE2000 model is utilized to calculate the color difference feature between our rusty image of the workpiece and the standard image, and then the initial evaluation of whether the cleaning performance is qualified can be determined. Compared with other color space models, such as CIE94, CIELCH, and CIELAB, CIEDE2000 improved the evaluation accuracy of color information. When implementing the CIEDE2000 computation, it is necessary to convert all the color images from the red, green and blue (RGB) color space to the LAB color space first. Then, three new weight coefficients , , and are computed, and the CIEDE2000 feature is computed by Equation (1). Clearly, it is believed that this kind of computation effect is closer to the subjective cognition of the human eye. After that, the color difference and the threshold of the two images are compared. If , laser cleaning has a good effect; otherwise, insufficient cleaning or overcleaning occurs.
where represents the total color difference; , , and are the brightness difference, the saturation difference, and the hue difference, respectively; , , and are the experience parameters, and they are all set to 1.0 in this paper;, , and are the weight coefficients that can be used to correct the color space; and is used to correct the deflection of the ellipse principal axis in the blue area of the color space.
2.2.2. Dynamic Weight Dispatch (DWD) Corrosion Texture Feature
Before the computation of image features, a series of classic image-processing computations are carried out. First, the image preprocessing is performed. Both median filtering and linear transformation are considered. Median filtering can reduce the interference in images. Linear transformation is used to highlight the corrosion residual area. Second, Otsu’s segmentation is adopted for image segmentation. Clearly, fixed threshold segmentation has difficulty achieving good results under uncertain environmental factors and metal surface states; thus, the maximum interclass variance method is performed to realize adaptive threshold segmentation. Finally, a DWD corrosion texture feature that can be used to evaluate the percentage of residual rust is calculated.
The DWD feature is designed to assess the cleaning performance. When calculating the DWD feature, a fixed-size sliding window is used to evaluate the aggregation degree of rusty residues in the image. A unit area is defined to represent the size of the sliding window. It is assumed that the higher the degree of pixel aggregation, the larger the weight of the unit area should be. For example, the weight of the corrosion unit area will be low if the aggregation degree of residual corrosion is small. A dynamic weight dispatch method is proposed to represent the rust degree; the rust pixels are reset to three intensity levels according to their initial rust aggregation degrees. The judgment method of rust aggregation degree is shown in Equation (2), and the dynamic weight dispatch method is given in Equation (3). After sliding window processing, the equivalent area of corrosion is calculated to evaluate the laser cleaning performance. Its calculation method is shown in Equation (4). The judgment method of the cleaning performance is shown in Equation (5).
where the and are the height and width of the sliding window, respectively; is the number of corrosion pixels in the window; reflects the local aggregation degree of corrosion pixel, the threshold of are the empirical values obtained from many experiments; is the pixel value of the rust point in the processed image; is the output of SVM; and , , , and T = 0.15 in this paper.
2.3. Cleaning Performance Prediction Using Particle Swarm Optimization-Support Vector Machine (PSO-SVM)
Laser cleaning is related to the thermal effect. The phase transformation, the deposition of materials, the uncertainty of corrosion distribution, the laser parameters, and the laser working path will affect the cleaning procedure and result. In this study, an SVM [21] is considered to search for suitable laser process parameters under complex working conditions [22]. In the training stage, a variety of image features and laser parameters are used as the input vector, and the qualified or unqualified evaluation result is regarded as the SVM output. Without loss of generality, the input features of SVM include the GLCM features, the concave-convex features, and the laser parameters. The energy, entropy, contrast, and correlation features of the GLCM at 0°, 45°, 90°, and 135° are computed [23]. An effective image concavity feature is used to describe the rust holes or burrs on the workpiece. The laser processing parameters include the power, linear velocity, and line spacing. linear velocity. The laser is scanned on the metal surface, and a series of laser pulse spots get a continuous linear region. Linear velocity and line spacing are used to describe the process. Table 1 shows the SVM training data list. In this paper, the laser parameters are not randomly generated; they are selected from the laser parameter candidate table randomly, which contains empirical information. In fact, a commonly used parameter list is accumulated according to our past engineering practice. We only pick the parameters from this list randomly. Therefore, the applied process parameters are safe for our application. Finally, the appropriate laser parameters can be generated by the trained SVM.

Table 1.
Training data list of support vector machine (SVM).
In general, two methods are utilized to tune the SVM parameters, including the manual adjustment method and the intelligent optimization algorithm. The manual parameter adjustment method uses the research experience of humans to control the parameters, while the intelligent optimization algorithm can realize automatic parameter setting. The PSO method can simulate the swarm behaviors of insects, herds of animals, birds and fish. These groups search for food cooperatively. Each member of the swarm changes its search mode by learning its own experience and other members’ experiences. A PSO-SVM model is proposed in this paper, and its processing steps are shown as follows.
(1) The training and test sample sets are accumulated. In this paper, there are 120 training samples; each sample contains an input feature vector and a cleaning performance evaluation tag. The input vector has 20 dimensional features, which include the laser process parameters and some image features. The output data are the binary evaluation result of laser cleaning.
(2) The kernel function is selected for the SVM. The radial basis function (RBF) kernel function is utilized in this system.
(3) The PSO algorithm is used to optimize the SVM parameters. The particle swarm optimization algorithm searches the penalty factor c and the kernel parameter g of SVM. The computational steps of the PSO-based parameter optimization are shown as follows:
Step 1: The maximum number of iteration steps is set;
Step 2: The initial positions, velocities, and the value range of the penalty coefficient c and the kernel parameter g are set;
Step 3: The fitness values of the particles are calculated;
Step 4: The individual extremum and population extremum are updated according to the particle fitness values;
Step 5: The termination condition, i.e., the maximum iteration number, is evaluated. If the termination condition is not satisfied, the particle velocities and positions are updated, and the computation jumps to step 2. The update method is shown in Equations (6) and (7); otherwise, the algorithm goes to step 6.
where and are the velocities and positions of the particles, rand() is a 0–1 random number, and t is the number of iterations. and are the historical optimal positions of individuals and groups, respectively.
Step 6: The optimization parameters of the particles are assigned to the SVM.
3. Experiments and Discussion
In this paper, a fiber laser is used to clean the corrosion in Q235 carbon steel workpieces. In these experiments, many workpiece surface images before and after cleaning are collected. The image processing methods are simulated by C++ on our PC (1.6 GHz, 8 GB RAM).
3.1. Experiment System and Data
To carry out the experimental test, the national standard GB8923-88 in China is referenced. This standard defines the basic rust grades of steel surfaces before painting. Q235 carbon steel workpieces with corrosion degree C are considered for our research. A Cartesian coordinate robot is used for image acquisition and laser cleaning. The visible light camera and the laser output head can be fixed in the system alternately. Table 2 gives the adjustment range of laser parameters. After placing the rusty workpiece under the robot, the system collects the images of the workpiece along a certain path before laser cleaning. Then, the camera is replaced by the laser output end, and practical laser cleaning is performed. Because the camera has a broad vision field, while the laser can only act in a limited width (the laser optic system can make the laser to go forward like a line), thus the laser movement width will always be less than the vision field width of camera. The overlapping photography will be employed when this system works. Cleaning experiments with different laser processing parameters are performed. In this system, only the laser power, scanning line speed, and line spacing can be adjusted to maintain the service life and ensure the processing stability of the laser, while other laser parameters are fixed. In addition, all the workpieces are cleaned only once. Figure 5 shows the surface image of rusty Q235 carbon steel and its microimage at 200 times magnification. The metal substrate is mainly composed of ferrite and pearlite.
Table 2.
The laser process parameters.
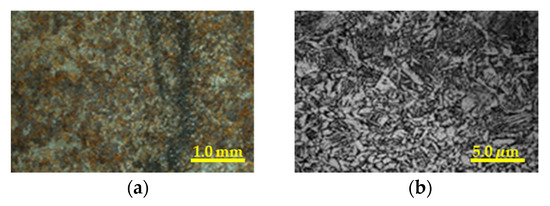
Figure 5.
Photos of Q235 carbon steel sample and its microstructure. (a) Photo of rusty carbon steel; (b) microstructure photo of carbon steel.
3.2. Evaluations of the Proposed Algorithms
3.2.1. Evaluations of Cleaning Performance Using Color Differences and DWD Features
The color difference evaluation technique is used preliminarily to determine the cleaning performance. The CIEDE2000 color difference can implement a computation between the collected color images of workpieces after cleaning and the standard clean image. The final color difference evaluation standard, i.e., the qualified result or the unqualified result, comes from the subjective assessment of human eyes according to national standard GB8923-88. Table 3 presents the corresponding experimental results. In our experimental environment, the color difference between the sample and the standard image is in the range of 0–50. In Table 3, when the overall effect of laser cleaning is qualified, most of the rust can be removed, and a large area of bright white metal can be observed. In this case, the color difference is generally less than 5 (cases 2 and 3 shown in Table 3). The upper limit of the color difference is set to 10 in the automatic decision. When the power density does not reach the minimum threshold value of rust removal or the rust layer is too thick, it is difficult to clean it only once. Some reddish-brown rust will remain on the workpiece surfaces (cases 4 and 5 in Table 3). The color difference between the workpiece image and the standard image is always higher than 10. When the laser thermal input is excessive, the surface of the workpiece will be oxidized. The surface will be covered with a large area of the yellow oxide layer. When the heat input is too large, the metal surface will even turn red, and cases 6 and 7 in Table 3 illustrate these phenomena. If the overall color difference is qualified, a further quantitative evaluation will be carried out.
Table 3.
Color difference of workpieces after cleaning.
In our experiment, the color difference is used preliminarily to evaluate the cleaning performance; however, the value of the color difference always varies with the brightness of the environmental light. To control the environmental light effectively, all the images are collected in a dark room with constant lighting. An annular white light source and hand-held luminance meter are used to measure the illuminance before the formal cleaning experiments. Clearly, if the output intensity of the light source is too strong, it will cause glare on the metal surface, which may result in the failure of surface image acquisition with high definition [24]. An evaluation experiment is implemented: we adjust the brightness of the light source in a dark room to study the influence effect of environmental lighting on the metal color difference feature. The industrial camera MER-310-12UC-L, which is made by the Daheng Company in Beijing, is employed in our experiment. The camera sensor is complementary metal oxide semiconductor (CMOS), and the effective pixel is 3 million. The spectrum ranges of the color components are: 400–550 (blue), 450–600 (green), 700–750 (red). Figure 6 presents the corresponding experimental system and results. In Figure 6, scattered light illumination is considered to avoid the overexposure phenomenon, which can always be observed from the coaxial ring light source. A sketch map of the coaxial ring light source is shown in Figure 6a. A sketch map of our proposed scattered light source is shown in Figure 6b.
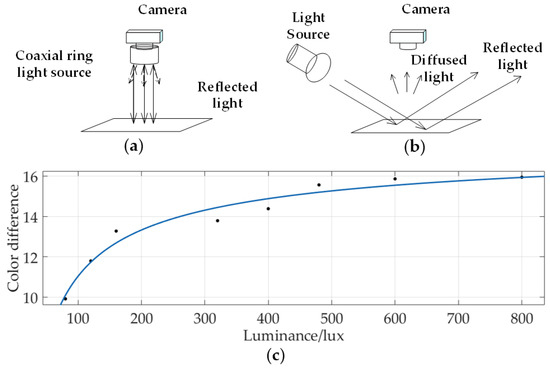
Figure 6.
Sketch map of lighting system and the relationship of color difference and environment illuminance. (a) The lighting system using the coaxial ring light source; (b) the lighting system using the scattered light source; (c) the fitting curve of color difference changing with luminance.
In Figure 6c, the relationship between the color difference and the environmental illuminance is built. The fitting function is f(x) = −94.06x−0.5606 + 18.15. The R-square of the fit is 0.9591. Considering the practical application, the illuminance on the surface of the workpiece is adjusted from 100 lux to 800 lux first, and then the results of the color difference are computed. A curve-fitting computation is also performed in Figure 6c. Figure 6c shows that the value of the color difference will increase with increasing environmental illuminance, and its growth speed will decrease little by little. When the illuminance is less than 100.0 lux, the collected images cannot obtain enough detailed information about the metal surface; therefore, the cleaning performances cannot be distinguished correctly. When the environmental illuminance is larger than 400.0 lux, the color difference growth rate will not change apparently, and the glare will appear on the surface of the workpiece when the illuminance reaches 550.0 lux. Finally, the environmental illuminance is set to 500.0 lux in this paper.
Generally, the larger the rust spot, the faster the corrosion growth will be. This means that the relatively concentrated corrosion will cause more damage to the materials. A DWD method is used to evaluate the effect of laser cleaning by setting different weights for the residual rust with diverse aggregation degrees. To verify the consistency between the proposed method and the human-involved evaluation result, five subjects are invited to assess the cleaning performance images. Thirty cleaned images are employed to participate in the subjective evaluation and scoring. The evaluation degree is set to 3, the best cleaning performance is degree 1, while the worst degree is 3. The final subjective evaluation scores of cleaning performance are obtained by the average scoring results of each image of 5 subjects. Figure 7 shows the fitting curve of the subjective score and the DWD texture. From Figure 7, it can be seen that the evaluation result of our method is close to the subjective evaluation of human eyes in trend.
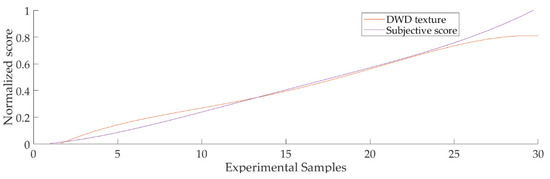
Figure 7.
The fitting curves of the subjective score and the dynamic weight dispatch (DWD) texture.
A quantitative evaluation of the DWD features is carried out further. To eliminate the interference of environmental light and camera optical systems, the collected image is preprocessed by median filtering to remove salt and pepper noise [25]. After that, the linear transformation is used to enhance the contrast of the image. Finally, threshold segmentation is used for the processed image to extract the unqualified areas in the image region. In a practical application, due to the characteristics of metals and the influence of environmental factors, we cannot set a single threshold to segment the unclean area effectively in all conditions. Therefore, Otsu’s method is utilized to realize the adaptive threshold segmentation of the unclean area. Figure 8 shows the image-processing results by our proposed method: Figure 8a is the original image, Figure 8b is the median filtering result of Figure 8a, Figure 8c shows the enhancement result of Figure 8b, Figure 8d presents the Otsu segmentation result of Figure 8c, Figure 8e is a non-logical operation of Figure 8d, which can highlight the aggregation degree of corrosion, and Figure 8f is the DWD processing result of Figure 8e. By comparing the images before and after computation, it can be seen that this method can effectively segment the unclean image region.
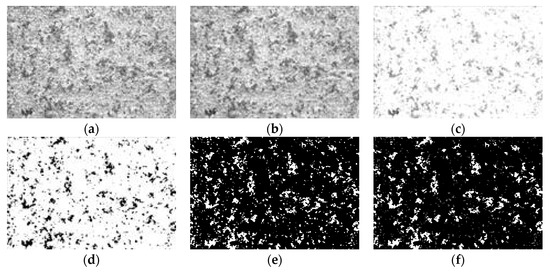
Figure 8.
Image processing results of DWD feature computation. (a) The image before median filtering; (b) the image after median filtering; (c) the image after enhancement; (d) the image after threshold segmentation; (e) the image after a non-logical operation; (f) the image after the analysis of aggregation degree.
3.2.2. Evaluation of Laser Process Parameter Control Using PSO-SVM
A series of surface images of the workpiece before and after laser cleaning is accumulated, and the corresponding laser process parameters are also recorded to establish the laser cleaning dataset. A PSO-SVM model is used to predict the process parameters of laser cleaning. Table 4 shows the cleaning performances with different laser process parameters. In Table 4, case 2 and case 11 achieve good cleaning results; most of the bright white carbon steel substrate can be obtained. Clearly, their cleaning results are better than those of other workpieces. The results of case 4 and case 5 are oxidized again. They may come from the large surface thermal effect of the workpiece. In these cases, the substrate materials are damaged. The results of case 1 and case 12 have apparent rust layers that are not cleaned completely. These results may consist of a low laser power density, which is not powerful enough to remove rust. From these results, it can be found that a sufficient laser power density is needed to clean the rust through the experiments, but the excessive heat input will lead to an oxidation effect. Therefore, it is necessary to establish the relationship model between the corrosion features of the material and the laser parameters to forecast the corresponding cleaning performance. Laser cleaning is carried out after setting the laser parameters. In this experiment, the workpieces with cleaning efficiencies higher than 85% are marked as the qualified sample, while others are marked as the unqualified sample.
Table 4.
The laser cleaning performances using different process parameters.
After setting up the laser cleaning dataset, the PSO-SVM model is trained to carry out the intelligent adjustment of laser parameters. It is necessary to select the appropriate kernel function by using the SVM to tune the laser parameters. A test experiment is performed, and 250 datasets are collected for testing. Table 5 shows the test results of the four kinds of kernel function. It can be seen from this table that the accuracy of the RBF kernel function is highest. To further improve the prediction accuracy, the PSO algorithm is considered to optimize the parameters of SVM. When computing PSO, we set and according to our engineering experience. The size of the population is 20, and the maximum evolutionary algebra of the population is 100. The accuracy of SVM classification is obtained by cross checking. The search range of parameter c is from 0.1 to 100.0; g is from 0.01 to 1000.0. Thus, the optimal parameters c and g are obtained by the cyclic iteration method. In this experiment, 120 datasets are used as the training set of SVM, and 40 groups are employed to test its effect. The final result shows that the prediction result of SVM with a radial basis function (RBF) kernel function can obtain the best prediction accuracy rate by 92.5%, where c = 72.6158 and g = 0.4697.
Table 5.
The prediction accuracy comparison using different support vector machine (SVM) kernel functions.
After the system construction and the algorithm design, we verify the performance of the whole system through practical application experiments. Figure 9 shows the surface images of workpieces before and after cleaning. In Figure 9, Figure 9a–c are the images of workpieces with some corrosion before laser cleaning. Figure 9d is the result of the traditional laser-cleaning method, which sets the parameters manually: the laser power is 80.0 W, the linear velocity is 1000.0 mm/s, and the linear space is 0.05 mm. Figure 9e,f show the results of intelligent laser cleaning proposed in this paper. Regarding image Figure 9e, the laser process parameters predicted by the PSO-SVM model are as follows: the laser power is 40.0 W, the linear velocity is 1000.0 mm/s, and the linear space is 0.05 mm. In Figure 9f, the parameters are as follows: the laser power is 120.0 W, the linear velocity is 2000.0 mm/s, and the linear space is 0.05 mm. It can be found that the algorithm proposed in this paper makes the cleaning performance stable and better; in addition, the surface substrates cannot be damaged easily.
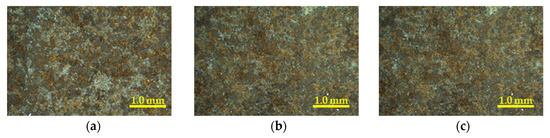
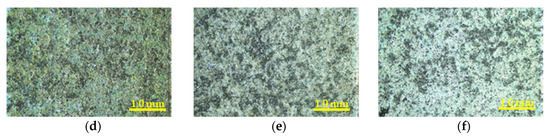
Figure 9.
Comparisons of the results of the traditional method and our intelligent method. (a–c) The images before laser cleaning; (d) the cleaned image of (a) using the traditional laser cleaning method; (e) the cleaned image of (b) using the intelligent laser cleaning method; (f) the cleaned image of (c) using the intelligent laser cleaning method.
4. Discussion
In recent years, laser-cleaning technology has met the intelligent development trend. More state-of-the-art sensors are considered to collect cleaning state information, and a series of machine-learning algorithms are developed to improve the intelligence degree of the whole cleaning system [26]. In our research, when evaluating the laser-cleaning performance, to use machine vision to replace the human-involved judgment method, a two-stage quantitative evaluation approach is proposed; therefore, the evaluation effect can be close to the subjective understanding of humans. Compared with other methods, our proposed method is more stable in cleaning performance assessment. The PSO-SVM is considered to forecast the laser process parameters. A random process parameter generation method and an iterative computation strategy are designed to search the qualified laser parameters. Similar to the classic Monte Carlo technique [27], our proposed techniques can also find the proper solution with a limited iteration computation.
The relationship between the cleaning performance and some specific laser process parameters is also investigated. Power is one of the most important process parameters of laser cleaning. Figure 10 shows some typical results of substrate oxidation after cleaning. Table 6 shows the corresponding laser parameters of Figure 10. In Figure 10, the substrate is oxidized seriously in Figure 10a, and some small rust spots still remain. In Figure 10b, to overcome the oxidation problem, the linear velocity is increased; therefore, the energy accumulation on the workpiece can be decreased. In our experiments, no inert gas is used. Clearly, if the fluence of the laser is too high, the substrate heat absorption cannot be dissipated immediately [28], which will lead to an oxidation phenomenon. Compared with Figure 10a, a better cleaning performance can be achieved in Figure 10b, and the damage to the workpiece can be reduced. In Figure 10c, the power is greatly increased, which causes a serious oxidation damage problem. After a comparison, it can be seen that the power and the correct energy accumulation [29] should be tuned elaborately to guarantee the proper laser-cleaning performance.
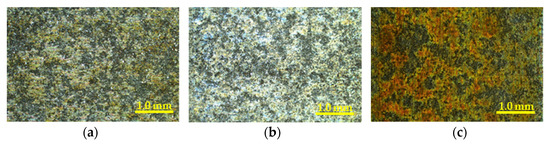
Figure 10.
The analysis experiment of the oxidized substrates. (a) Image of an oxidized workpiece; (b) image of a workpiece with better cleaning performance; (c) image of a workpiece with serious oxidation damage.
Table 6.
The corresponding laser process parameters of Figure 10.
A color difference evaluation experiment is also performed. In this experiment, the relationship between the laser power and image color difference is researched. Other laser parameters are as follows: the linear velocity is 1000.0 mm/s, and the line spacing is 0.05 mm. Figure 11 presents the corresponding experimental results. From the fitting curve in Figure 11, it can be seen that when the laser power is higher than a certain value, the color difference will gradually increase. This phenomenon can be explained as follows: with increasing laser power, the oxidation degree of the workpiece surface will become serious; therefore, the color difference intensity becomes increasingly larger. For example, when the laser power is less than 40.0 W, the color difference mainly comes from incomplete cleaning; if the laser power is larger than 40.0 W, the color difference derives from the oxidation problem. Thus, it is necessary to assess the color difference before further cleaning performance evaluation.
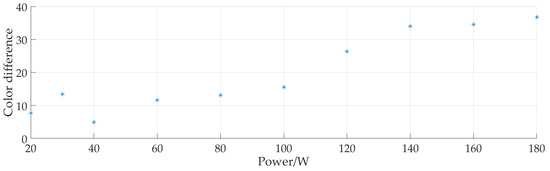
Figure 11.
The relationship curve between the color difference and the laser power.
In this work, the cleaning efficiency was improved, which means that acceptable cleaning performance can be obtained by cleaning once. In addition, the proposed technique has some other merits. First, its automated degree is high. A prediction method of laser parameters based on PSO-SVM is implemented, which greatly reduces the dependence on workers’ experiences. Second, its computation robustness is good. Both the color difference and a DWD texture feature are employed to assess the laser-cleaning performance. A series of environmental evaluation experiments verified its correctness. Third, system scalability is also excellent. Many image-processing algorithms and machine learning techniques can be used to improve the computational effect of the proposed system. The proposed method also has some shortcomings. For example, only limited laser parameter data are accumulated, which affects the computation effect of PSO-SVM. In the future, more laser process parameters will be collected, and some new machine-learning methods, e.g., the deep learning neural network [30], can be utilized in our method.
For the application of laser cleaning in the preservation of cultural heritage or artworks, the method proposed in this paper may also be effective. For example, colorimeters are widely used in the preservation of cultural heritage [31,32], and the removal of surface pollutants can be judged by calculating the color difference. The method of calculating the color difference through images can also play the role of a colorimeter. In the quantitative calculation stage, due to the irregular surface morphology of the cultural relics, we can increase the magnification of the image to approximate the region as a plane, but the area of interest will decrease. In the process of automatic adjustment of laser process parameters, attention should be paid to the combination of process parameters with high energy density [33]. The cleaning of cultural relics or artworks should not damage the sample itself.
5. Conclusions
In this paper, a machine vision-based intelligent laser-cleaning method is proposed. The processing steps include laser parameter tuning and cleaning performance quantitative evaluation. First, many images before and after laser cleaning, the laser process parameters, and the cleaning performance are recorded. Both the color difference and an image adaptive threshold technique, i.e., the DWD texture feature, are used to quantitatively evaluate the laser-cleaning performance. We consider the influence of environmental lighting and heat accumulation on the proposed method. Through the experiments, suitable environmental lighting conditions and a range of laser process parameters are obtained. The PSO-SVM is considered to realize laser parameter tuning. After a series of tests, the accuracy rate of PSO-SVM reached 92.5%.
Author Contributions
Conceptualization, H.L.; Data curation, J.L. (Jiacheng Li); Formal analysis, J.L. (Jiacheng Li); Funding acquisition, H.L.; Investigation, L.S.; Methodology, J.L. (Jiacheng Li) and H.L.; Project administration, J.L. (Jinhui Lan); Resources, H.L.; Software, J.L. (Jiacheng Li) and L.S.; Supervision, J.L. (Jinhui Lan); Validation, L.S.; Visualization, L.S.; Writing—original draft, J.L. (Jiacheng Li); Writing—review and editing, H.L. All authors have read and agreed to the published version of the manuscript.
Funding
This research was funded by the Fund of State Key Laboratory of Intense Pulsed Radiation Simulation and Effect under Grant No. SKLIPR2024, the National Natural Science Foundation of China under Grant No. 61975011, and the Fundamental Research Fund for the China Central Universities of USTB under Grant No. FRF-BD-19-002A.
Conflicts of Interest
The authors declare no conflict of interest.
References
- Raza, M.; Das, S.; Tudu, P.; Saha, P. Excimer laser cleaning of black sulphur encrustation from silver surface. Opt. Laser Technol. 2019, 113, 95–103. [Google Scholar] [CrossRef]
- Zhang, G.; Hua, X.; Li, F.; Zhang, Y.; Cheng, J. Effect of laser cleaning process parameters on the surface roughness of 5754-grade aluminum alloy. Int. J. Adv. Manuf. Technol. 2019, 105, 2481–2490. [Google Scholar] [CrossRef]
- Zhou, X.; Imasaki, K.; Furukawa, H.; Umino, H.; Sakagishi, K.; Nakai, S.; Yamanaka, C. A study of the surface products on zinc-coated steel during laser ablation cleaning. Surf. Coat. Technol. 2001, 137, 170–174. [Google Scholar] [CrossRef]
- Nevin, A.; Pouli, P.; Georgiou, S.; Georgiou, S.; Fotakis, C. Laser conservation of art. Nat. Mater 2007, 6, 320–322. [Google Scholar] [CrossRef]
- Maffini, A.; Uccello, A.; Dellasega, D.; Passoni, M. Laser cleaning of diagnostic mirrors from tungsten–oxygen tokamak-like contaminants. Nucl. Fusion 2016, 56, 086008. [Google Scholar] [CrossRef]
- Stefan, G.W.; Norbert, S.E.; Josef, A.P.; Hubert, S.T.; Johannes, D.P. Chemical imaging with Laser Ablation–Spark Discharge–Optical Emission Spectroscopy (LA-SD-OES) and Laser-Induced Breakdown Spectroscopy (LIBS). Opt. Laser Technol. 2020, 123, 105944. [Google Scholar]
- Stefan, K.; Jens, H.; Klaus, D.; Stratoudaki, T.; Vassilis, Z. LIBS-spectroscopy for monitoring and control of the laser cleaning process of stone and medieval glass. J. Cult. Herit. 2000, 1, S287–S292. [Google Scholar]
- Lim, H.; Kim, D. Laser-assisted chemical cleaning for oxide-scale removal from carbon steel surfaces. J. Laser Appl. 2004, 16, 25–30. [Google Scholar] [CrossRef]
- Mutin, T.; Smirnov, V.; Veiko, V.; Volkov, S. Cleaning laser spark spectroscopy for online cleaning quality control method development. Proc. SPIE-Int. Soc. Opt. Eng. 2010, 7996, 1056–1062. [Google Scholar]
- Tserevelakis, G.J.; Pozo-Antonio, J.S.; Siozos, P.; Rivas, T.; Pouli, P.; Zacharakis, G. On-line photoacoustic monitoring of laser cleaning on stone: Evaluation of cleaning performanceiveness and detection of potential damage to the substrate. J. Cult. Herit. 2019, 35, 108–115. [Google Scholar] [CrossRef]
- Chu, H.; Xie, Z.; Liu, Q.; Shao, Y.; Mi, Z. Surface-cleanliness inspection apparatus for optical component based on machine vision. Image Signal Process. Int. Congr. 2010, 4, 1694–1698. [Google Scholar]
- Shi, T.; Zhou, L.; Wang, C.; Mi, G.; Jiang, P. Machine Vision-Based Real-Time Monitor System for Laser Cleaning Aluminum Alloy. Chin. J. Lasers 2019, 46, 83–89. [Google Scholar]
- Liu, H.; Li, J.; Yang, Y.; Lan, J.; Xue, Y. Automatic Process Parameters Tuning and Surface Roughness Estimation for Laser Cleaning. IEEE Access 2020, 8, 20904–20919. [Google Scholar] [CrossRef]
- Sun, Z.; Xu, J.; Zhou, W. Parameters and mechanism of laser cleaning rust deposit on the steel surface. Proc. SPIE-Int. Soc. Opt. Eng. 2002, 4915. [Google Scholar] [CrossRef]
- Pant, P.; Chatterjee, D. Prediction of clad characteristics using ANN and combined PSO-ANN algorithms in laser metal deposition process. Surf. Interfaces 2020, 21, 100699. [Google Scholar] [CrossRef]
- Sun, B.; Xu, C.; He, J.; Yu, L.; Zhang, Y. Cleanliness prediction of rusty iron in laser cleaning using convolutional neural networks. Appl. Phys. A 2020, 126, 179. [Google Scholar] [CrossRef]
- López, A.J.; Lamas, J.; Pozo-Antonio, J.S.; Rivas, T.; Ramil, A. Development of processing strategies for 3D controlled laser ablation: Application to the cleaning of stonework surfaces. Opt. Lasers Eng. 2020, 126, 105897. [Google Scholar] [CrossRef]
- Nie, X.H.; Li, Y.L.; Li, J.K.; Zhang, H.B. Morphology, Products and Corrosion Mechanism Analysis of Q235 Carbon Steel in Sea-shore Salty Soil. J. Mater. Eng. 2010, 30, 24–28. [Google Scholar]
- Huang, C.L.; Dun, J.F. A distributed PSO-SVM hybrid system with feature selection and parameter optimization. Appl. Soft Comput. J. 2008, 8, 1381–1391. [Google Scholar] [CrossRef]
- Luo, M.R.; Cui, G.; Rigg, B. The development of the CIE 2000 colour-difference formula: CIEDE2000. Color Res. Appl. 2001, 26, 340–350. [Google Scholar] [CrossRef]
- Nordin, N.D.; Zan, M.S.D.; Abdullah, F. Comparative Analysis on the Deployment of Machine Learning Algorithms in the Distributed Brillouin Optical Time Domain Analysis (BOTDA) Fiber Sensor. Photonics 2020, 7, 79. [Google Scholar] [CrossRef]
- Fan, Y.; Zhang, L.; Guo, H.; Hao, H.; Qian, K. Image Processing for Laser Imaging Using Adaptive Homomorphic Filtering and Total Variation. Photonics 2020, 7, 30. [Google Scholar] [CrossRef]
- Hua, B.; Fu-Long, M.A.; Li-Cheng, J. Research on Computation of GLCM of Image Texture. Acta Electron. Sin. 2006, 1, 155–158. [Google Scholar]
- See, T.L.; Metsios, I.; Qian, D.; Antar, M.; Marimuthu, S. Feasibility study and demonstration of cleaning with laser adaptively by novel use of sensors. Procedia Cirp 2018, 74, 376–380. [Google Scholar] [CrossRef]
- Xu, X.H.; Zhang, R.Q.; Dong, X.Z.; Gehring, G.A. A study of the optimization of parameters for pulsed laser deposition using Monte Carlo simulation. Thin Solid Film. 2006, 515, 2754–2759. [Google Scholar] [CrossRef]
- Higashi, H.; Bui, M.V.; Aziz, A.; Nakauchi, S. Computational lighting for extracting optical features from RGB images. Measurement 2020, 151, 107183. [Google Scholar] [CrossRef]
- Lehmann, P. Surface-roughness measurement based on the intensity correlation function of scattered light under speckle-pattern illumination. Appl. Opt. 1999, 7, 1144–1152. [Google Scholar] [CrossRef]
- Peng, Y.; Yan, Z. Characterization of laser-induced local heating in a substrate. Int. J. Heat Mass Transf. 2017, 106, 989–996. [Google Scholar]
- Gorajek, L.; Gontar, P.; Jabczynski, J.; Firak, J.; Stefaniak, M.; Dabrowski, M.; Orzanowski, T.; Trzaskawka, P.; Sosnowski, T.; Firmanty, K.; et al. Characterization of Absorption Losses and Transient Thermo-Optic Effects in a High-Power Laser System. Photonics 2020, 7, 94. [Google Scholar] [CrossRef]
- Zhang, Y.; You, D.D.; Gao, X.; Wang, C.; Li, Y.; Gao, P.P. Real-time monitoring of high-power disk laser welding statuses based on deep learning framework. J. Intell. Manuf. 2020, 31, 799–814. [Google Scholar] [CrossRef]
- Zhang, L.C.; Zhao, J.; Zhao, P.; Wang, C. Preliminary study of cleaning out contaminants on the surface of glazed components of Yan Xi Tang in the Palace Museum. Sci. Conserv. Archaeol. 2020, 32, 98–104. [Google Scholar]
- Wang, H.; Fu, Y.H. Experimental study of laser cleaning of surface contaminants in marine stone sculptures cultural relic. Appl. Laser 2018, 38, 623–629. [Google Scholar]
- Qi, Y.; Ye, Y.Y.; Wang, H.J.; Zhou, W.Q. Mechanisms of laser cleaning of contamination on surface of stonework. Chin. J. Lasers 2015, 42, 99–107. [Google Scholar]


Publisher’s Note: MDPI stays neutral with regard to jurisdictional claims in published maps and institutional affiliations. |
© 2020 by the authors. Licensee MDPI, Basel, Switzerland. This article is an open access article distributed under the terms and conditions of the Creative Commons Attribution (CC BY) license (http://creativecommons.org/licenses/by/4.0/).